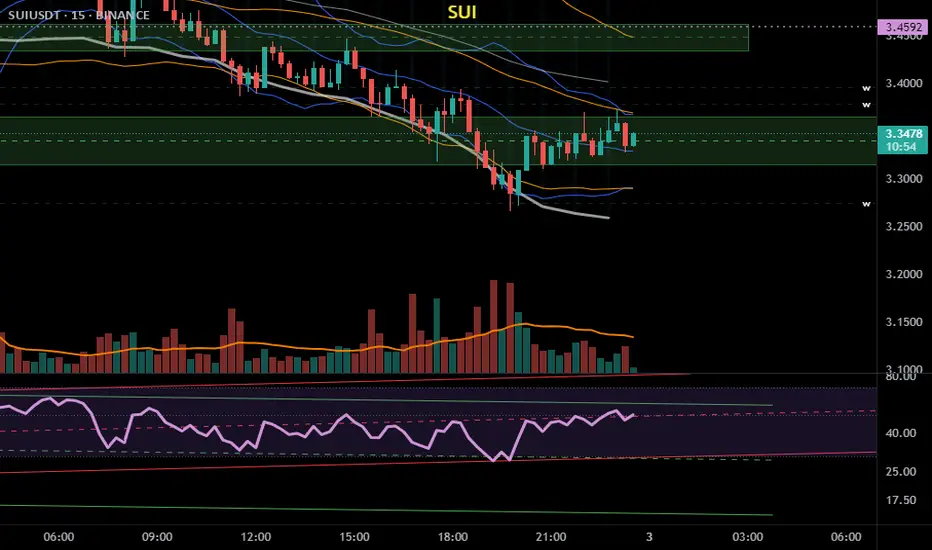
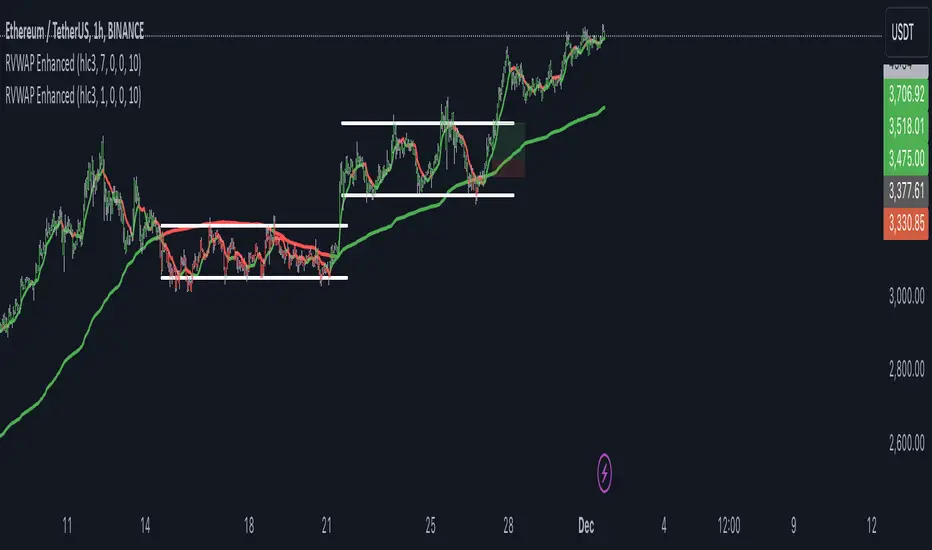
RVWAP ENHANCED**Rolling VWAP with Alerts and Markers**
This Pine Script indicator enhances the traditional Rolling VWAP (Relative Volume Weighted Average Price) by adding dynamic features for improved visualization and alerting.
### Features:
1. **Dynamic VWAP Line Coloring**:
- The VWAP line changes color based on the relationship with the closing price:
- **Green** when the price is above the VWAP.
- **Red** when the price is below the VWAP.
2. **Candle and Background Coloring**:
- **Candles**: Colored green if the close is above the VWAP and red if below.
- **Background**: Subtle green or red shading indicates the price’s position relative to the VWAP.
3. **Alerts**:
- Alerts notify users when the VWAP changes direction:
- "VWAP Turned Green" for price crossing above the VWAP.
- "VWAP Turned Red" for price crossing below the VWAP.
4. **Small Dot Markers**:
- Tiny dots are plotted below the candles to mark VWAP state changes:
- **Green dot** for VWAP turning green.
- **Red dot** for VWAP turning red.
5. **Custom Time Period**:
- Users can select either a dynamic time period based on the chart's timeframe or a fixed time period (customizable in days, hours, and minutes).
6. **Standard Deviation Bands (Optional)**:
- Standard deviation bands around the VWAP can be enabled for further analysis.
This script is designed to provide clear and actionable insights into market trends using the RVWAP, making it an excellent tool for traders who rely on volume-based price action analysis.
ابحث في النصوص البرمجية عن "band"
Contrarian Donchian Channel Indicator with Alerts and VisualsTitle: Contrarian Donchian Channel Indicator with Alerts and Visuals
Description:
The Contrarian Donchian Channel Indicator is designed for traders who seek to implement a contrarian approach using the time-tested Donchian Channel method. This indicator not only signals potential entry points but also enhances trading visualization by marking hypothetical stop loss and take profit levels.
Key Features:
Donchian Channel Signals: Utilizes the Donchian Channel to identify potential reversal points in the market. The indicator generates buy signals when the price touches or breaches the lower band, suggesting a potential upward reversal. Conversely, sell signals are generated when the price touches or exceeds the upper band, indicating a possible downward reversal.
Pause After Stop Loss: Incorporates a unique feature that pauses signal generation for a user-defined number of candles after a stop loss is hit. This helps in avoiding immediate re-entries in volatile market conditions.
Stop Loss and Take Profit Visualization: For each signal, the indicator draws dashed lines on the chart to represent the hypothetical stop loss (red) and take profit (green) levels. These levels are calculated based on user-input percentages for stop loss and the risk-reward ratio.
Alerts for Entry Signals: Traders can set up alerts for buy and sell signals, allowing them to stay informed of potential trading opportunities.
How to Use:
Entry Signal: A triangle symbol (green for buy, red for sell) accompanied by an alert (if set) indicates a potential entry point.
Stop Loss and Take Profit Lines: Use the drawn lines as a guide for setting stop loss and take profit levels if the signal aligns with your trading strategy.
Pause Feature: After a stop loss is triggered, observe the pause period before considering new signals to avoid overtrading in choppy markets.
Suitable For:
Traders who prefer a contrarian approach.
Those who use Donchian Channels as part of their trading strategy.
Traders who appreciate visual aids for better decision-making.
Customization Options:
Length of the Donchian Channel.
Risk/Reward Ratio.
Stop Loss Percentage.
Pause duration after a stop loss is hit.
DISCLAIMER:
This indicator is intended for educational and informational purposes only and should not be construed as financial advice. Trade responsibly and always consider your risk tolerance and investment objectives.

Moving Average SARHello Traders,
Today, I have brought to you an indicator that utilizes the Parabolic SAR.
To begin with, the Parabolic SAR is an indicator that trails the price in the form of a parabola, seeking out Stop And Reverse points.
The indicator I present merges the calculation formula of the Parabolic SAR with the Moving Average.
One aspect I pondered over was how to determine the starting point of this SAR. Trailing the price flow with the logic set by the moving average was fine, but the question was where to begin.
My approach involves a variable I call 'sensitiveness,' which automatically adjusts the length according to the timeframe you are observing. Using pinescript's math.ceil, I formulated:
interval_to_len = timeframe.multiplier * (timeframe.isdaily ? 1440 : timeframe.isweekly ? 1440 * 7 : timeframe.ismonthly ? 1440 * 30 : 1)
main_len = math.ceil(sensitiveness / interval_to_len)
This formula represents the length, and through variables like:
_highest = math.min(ta.highest(high, main_len), close + ta.atr(46)*4)
_lowest = math.max(ta.lowest(low, main_len), close - ta.atr(46)*4)
I have managed to set the risk at a level that does not impose too great a burden.
Moreover, the 'Trend Strength Parameter' allows you to choose how strongly to trail the current price.
Lastly, think of the Band Width as a margin for accepting changes in the trend. As the value increases, the Band Width expands, measured through the ATR.
This indicator is particularly useful for holding positions and implementing trailing stops. It will be especially beneficial for those interested in price tracking of trends, like with Parabolic SAR or Supertrend.
I hope you find this tool useful.

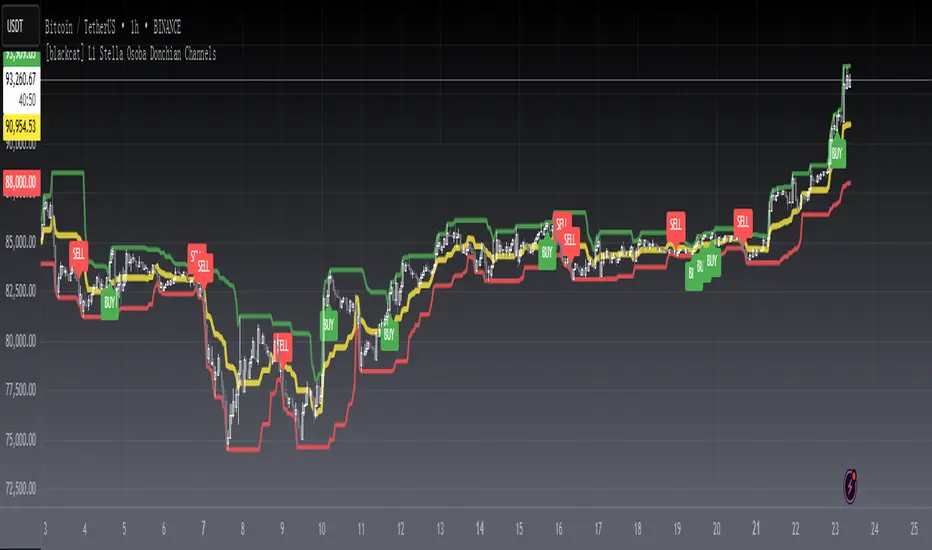
[blackcat] L1 Stella Osoba Donchian ChannelsLevel 1
Background
On Jul, 2023, Stella Osoba proposed a price channel idea in the article of “Using Price Channels”.
Function
In Stella Osoba's article "Using Price Channels" in the 2023 bonus issue, author Stella Osoba describes why many analysis techniques are based on the concept of price channels. In her explanation of the Donchian channels, she explains that they are used to identify the trend and that the prices for the last period are not included in the calculations. I rewrote this idea in the PINE version presented here, allowing the user to optionally include the most recent period. To not include the most recent period, set the IncludeRecentPeriod input to false.
Richard Donchian, a futures trader, created the Donchian Channel as a trend indicator. He was later dubbed the "father of trend following." Several trading methods based on Donchian channels have been established, but day traders can create their own as the indicator is versatile and can be interpreted in different ways. The renowned Turtle Traders also used a variation of the Donchian technique.
The Donchian Channel draws a line between the high and low price of an asset over a period of time, generally using candlesticks as a clock. Candlesticks are chart areas on charts that show the open, high, low, and close price and time frame of a particular stock. They owe their name to their shape. When the indicator is applied to a chart, the lines form a channel around the current price.
When day trading, Donchian channels are useful for highlighting trends and range periods. A third line can be added between the top and bottom lines if required. The upper and lower channel lines are averaged to form this center band. The indicator can be used on all timeframes, including one-minute and five-minute charts (where a bar forms every one or five minutes), and it can be used for forex, stock, futures, and options trading .
Remarks
Feedbacks are appreciated.
actic-fibbA fibbonacci based bollinger band. Up and down trading arrows are generated based on crossover and crossunder of 200 day vma

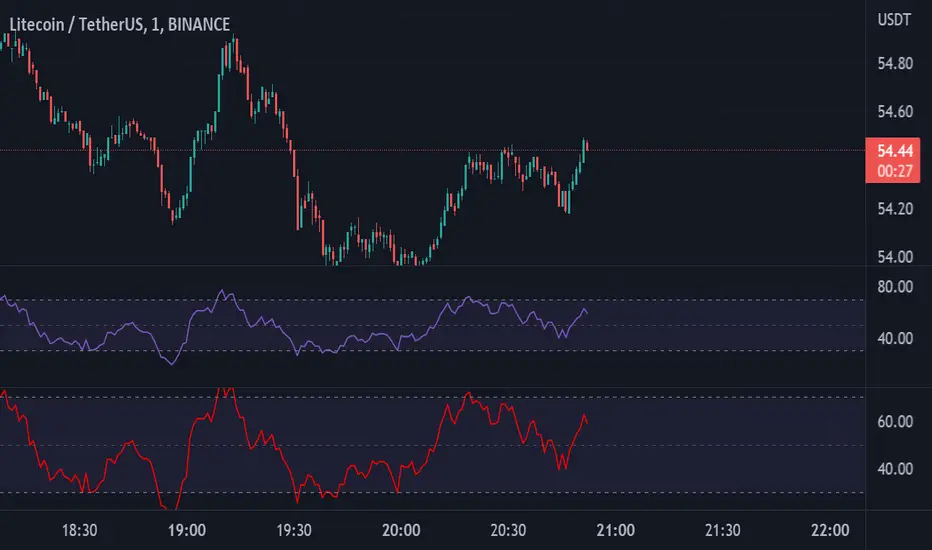
RSI by JBTRelative Strength Index With Alerts. With an upper band of crossing over 62 (RSI) and a lower band with a Triger price of 32 (RSI), This saves time and effort in waiting for the price to move above the desired level.
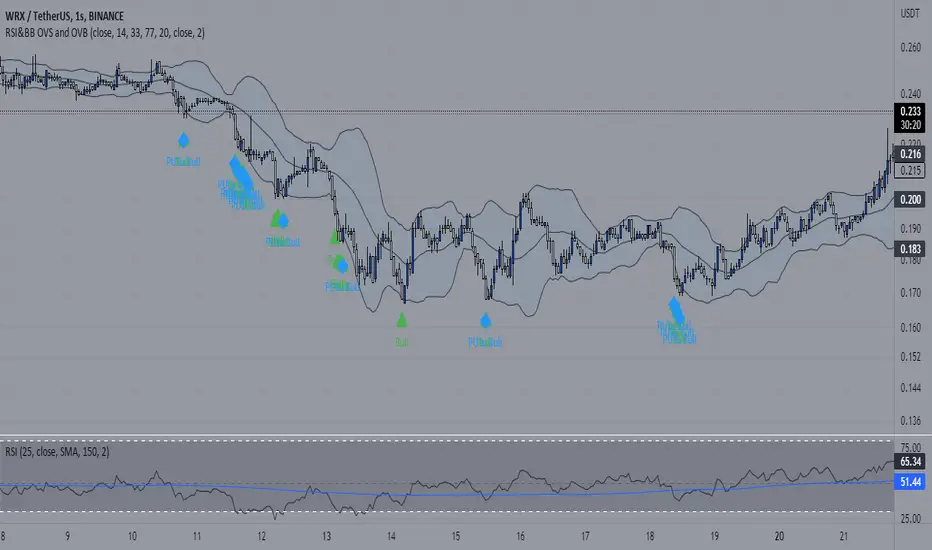
Hitokiri rsi and bbNG : This indicator is created by combining the standard period RSI indicator with an Oversold limit of 32, an Overbought limit of 70 and a period of 14 (these values can be changed optionally from the entries and still tabs of the indicator settings) and the Bollinger Band . indicator with a standard deviation of 2 and a period of 20. Also, the RSI Oversold is an upward green triangle where the price simultaneously falls below the BB and the lower limit (Low) (i.e. below 32), where the RSI Overbought (i.e. above 70) at the same time the price rises above the BB and the upper limit (Upper) is a downward red triangle. is indicated by a triangle. An alarm condition is established on these conditions. Source codes are posted visually and written in clear language and with explanations for beginners to learn to pine.
TR : Bu gösterge OverSold sınırı 32, OverBought sınırı 70 ve periodu 14 olan (bu değerler tercihe göre indikatör ayarlarının girdiler ve still sekmelerinden değiştirilebilir) standart periodluk RSI göstergesi ile standart sapma değeri 2, periodu 20 olan Bollinger Bandı göstergesinin birleştirilmesiyle oluşturulmuş olup ilaveten RSI'nin OverSold iken (yani 32 altına düştüğü) aynı anda fiyatın BBand alt sınırı (Lower) altına düştüğü yerleri yukarı yönlü yeşil üçgenle, RSI'nin OverBought iken (yani 70 üstüne çıktığı) aynı anda fiyatın BBand üst sınırı (Upper) üstüne çıktığı yerleri aşağı yönlü kırmızı üçgenle belirtmektedir. Bu şartlar üzerine de alarm kondüsyonu oluşturulmuştur. Kaynak kodları görünür olarak yayınlanmış olup, pine öğrenmeye yeni başlayanlar için anlaşılır dilde ve açıklamalar eklenerek yazılmıştır.

Happy KCRe-interpreted from @eSaniello for visual purposes and re-worked the math on the Keltner formula.
Keltner Channel Calculation
Keltner Channel Middle Line=EMA
Keltner Channel Upper Band=EMA+multiplier∗ATR
Keltner Channel Lower Band=EMA−multiplier∗ATR
where:
EMA=Exponential moving average (typically over 20 periods)
ATR=Average True Range (typically over 10 or 20 periods)
I wanted dual Keltner channels in a single indicator. If you add the default Tradingview Keltner channels twice with multipliers of 1 and 2, it should overlay exactly.

HURST Channel StrategyBased on the work TJS / Trading Zoom / Svoboda
Strategy based on Hurst channel with loss averaging when an open position is below 0.5 channel range.
How it works:
1. opens the long position when the close price crosses over the lower band (from bottom to top)
2. opens additional position (double in size) when average position price is lower than average channel value (0.5)
3. closes the position when the close price crosses over the higher band (from top to bottom)
Works the best on :
- volatile and continuous instruments (futures)
- on timeframes above 15 minutes
- uptrends or consolidations
- downtrends require more capital to open double positions

ETHUSDT 4H - Keltner Breakout working nice with ETH above EMA200
Using Keltner bands to prevent get rid off unnecessary noices . Works at safe side
Which is fantastic for people who does not want to stick to screen full day , it needs as couple of transactions per month to gain meaningfull profit
Do not forget to use it with 4 hr time frame
Do not recommend to use it with sh*tcoins, however with a small fine tuning its okay to use it with Top altcoins

Ultimate Std Dev Channel • 4 Zones • 100% WORKINGStandard-deviation channel — fully customizable (band width, line style, colors, opacity, thickness, and labels).

[Asian Range + Sweeps]Main Features
Asian Range (S2) — fully configurable session band (start/end, hour:minute) with automatic detection and visual high/low markers.
HOD/LOD (S1) — adaptive cutoff logic for Forex vs Indices, with optional manual override.
Gap Correction — optional true HOD/LOD detection using a 1-minute base with overnight gap adjustment.
Sweep Detection — real-time alerts for S1 and S2 sweeps, with independent cooldown control to avoid duplicate signals.
Visual Controls — customizable colors, line thickness, and transparency.
KeepDays Setting — allows you to manage how many past session drawings are preserved on the chart

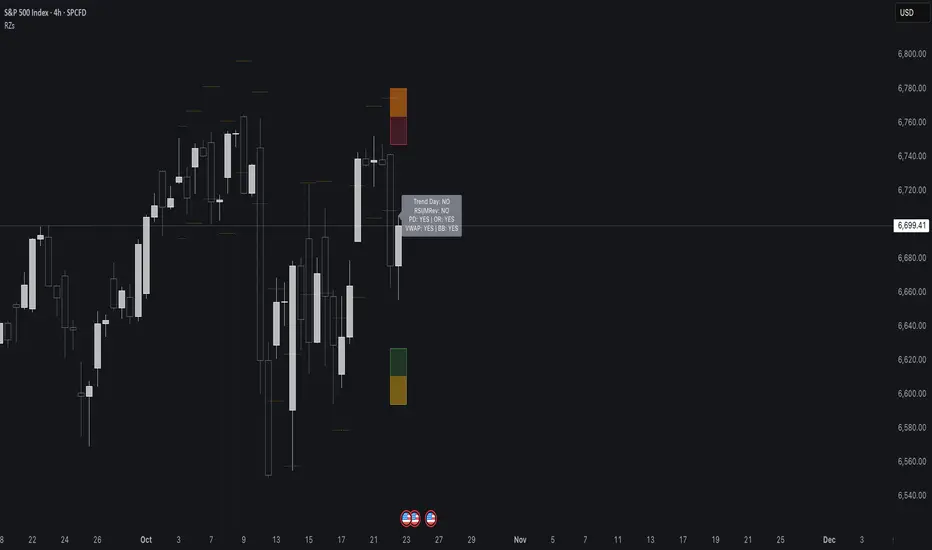
Reversal Zones// This indicator identifies likely reversal zones above and below current price by aggregating multiple technical signals:
// • Prior Day High/Low
// • Opening Range (9:30–10:00)
// • VWAP ±2 standard deviations
// • 60‑minute Bollinger Bands
// It draws shaded boxes for each base level, then computes a single upper/lower reversal zone (closest level from combined signals),
// with configurable zone width based on the expected move (EM). Within those reversal zones, it highlights an inner “strike zone”
// (percentage of the box) to suggest optimal short-option strikes for credit spreads or iron condors.
// Additional features:
// • Optional Expected Move lines from the RTH open
// • 15‑minute RSI/Mean‑Reversion and Trend‑Day confluence flags displayed in a dashboard
// • Toggles to include/exclude each signal and adjust styling
// How to use:
// 1. Adjust inputs to select which levels to include and set the expected move parameters.
// 2. Reversal boxes (red above, green below) show zones where price is most likely to reverse.
// 3. Inner strike zones (darker shading) guide optimal short-strike placement.
// 4. Dashboard confirms whether mean-reversion or trend-day conditions are active.
// Customize colors and visibility in the settings panel. Enjoy disciplined, confluence-based trade entries!
Institutional Rolling VWAPs • 3 lines + editable σ bands3 rolling vwaps, time stamped, same on htf and lft for high level execution

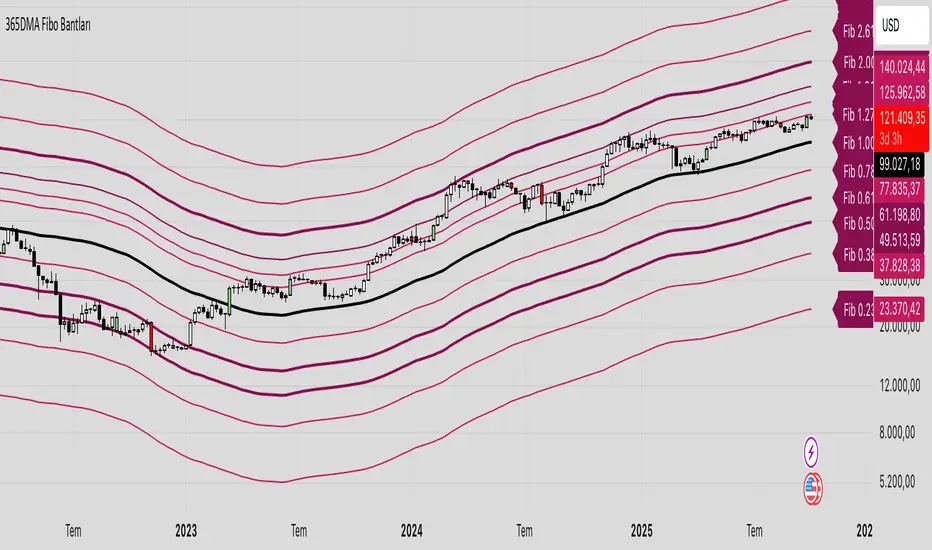
365 DMA Based Multiplier Fibonacci BandsBitcoin Chart
365 DMA Based
Fibonacci 1.0 = Long term trend
Fibonacci 0.5/0.618 = Long term support
Fibonacci 1.618 = Mid term target
Fibonacci 2.618 = Long term target
MA Paketi This advanced MA & ATR Channel Indicator allows you to monitor both short-term and long-term trends on the same chart.
The script includes 9, 21, 50, 100, and 200-period moving averages (MAs) and also lets you add a custom MA of your choice.
Around the 200 MA, a ±6 ATR channel dynamically defines volatility-based support and resistance zones.
Key Features:
🔹 Five classic MAs (9, 21, 50, 100, 200)
🔹 User-defined custom MA (SMA, EMA, WMA, RMA, HMA options)
🔹 MA200-centered ±ATR channel (fully adjustable multiplier and period)
🔹 ATR-based dynamic volatility band
🔹 Alert conditions (notifies when price breaks above or below the channel)
🔹 Clean, colorful, and professional visual design
This indicator helps you analyze trend direction, momentum shifts, and volatility-driven reversal zones simultaneously.
Perfect for swing, scalp, and position traders alike.


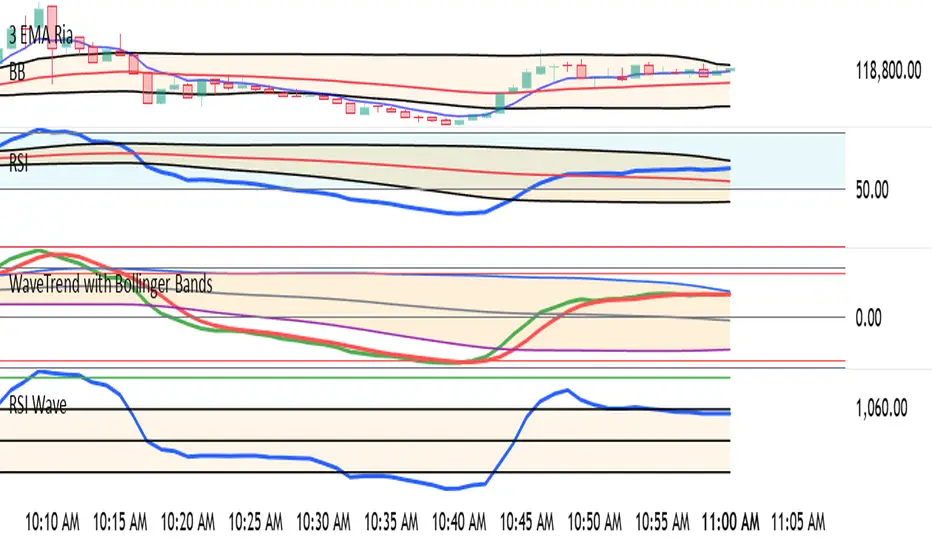
WaveTrend with Bollinger BandsPlots TTM Squeeze momentum histogram (green/red).
Plots RSI (blue) in the same pane.
Shows squeeze dots and RSI overbought/oversold lines.
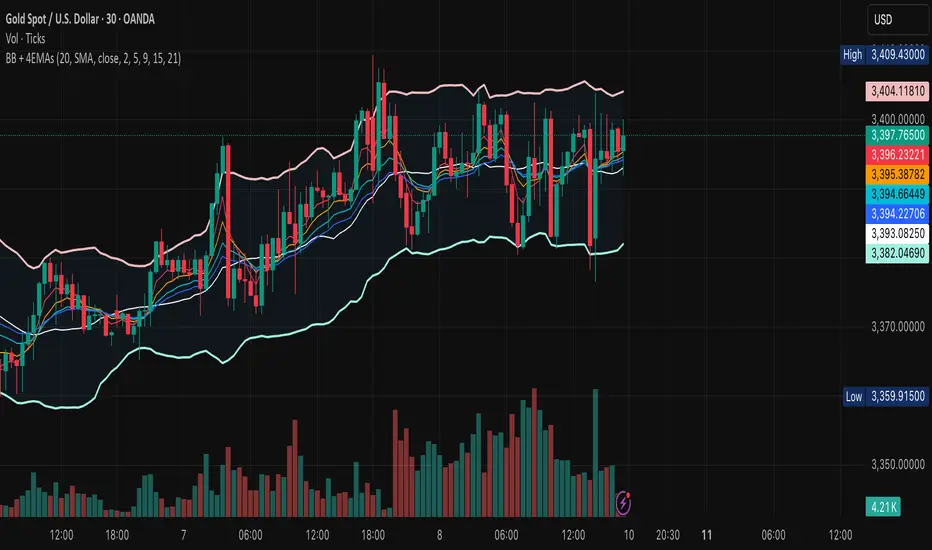
BB + 4 EMAsCustom Bollinger Bands with 4EMAs of your choice. All added in one indicator.
Look Before You Leap!

AUD/USD 1-Min Scalping Strategy with LabelsHere’s a complete TradingView Pine Script v5 for the 1-minute AUD/USD scalping strategy we just discussed. This strategy uses:
EMA 13 and EMA 26 for trend filtering
Bollinger Bands for volatility extremes
RSI (4) for momentum confirmation

Double Bollinger Bands - SF2000twin BB's. One bb can be set for , eg 20 period. The other set for - eg - 50 period. compare the channels.