AWR_8DLRC1. Overview and Objective
The AWR_8DLRC indicator is designed to display multiple dynamic channels directly on your chart (with the overlay enabled). It creates dynamic envelopes based on a regression-like approach combined with a volatility measure derived from the root mean square error (RMSE). These channels can help identify support and resistance areas, overbought/oversold conditions, or even potential trend reversals by providing several layers of analysis using different multipliers and timeframes.
2. Input Parameters
Source and Multiplier
The indicator uses the closing price (close) as its default data source.
A floating-point parameter mult (default value: 3.0) is available. This multiplier is primarily used for channel 5, while other channels employ fixed multipliers (1, 2, or 3) to generate different sensitivity levels.
Channel Lengths
Several channels are calculated with distinct lookback lengths:
Channel 5: Uses a length of 1000 periods (its plot is commented out in the code, so it is not displayed by default).
Channel 6: Uses a length of 2000 periods.
Channel 7: Uses a length of 3000 periods.
Channel 8: Uses a length of 4000 periods.
Custom Colors and Transparencies
Each channel (or group of channels) can be customized with specific colors and transparency settings. For example, channel 6 uses a light yellow tone, channel 7 is red, and channel 8 is white.
Additionally, specific fill colors are defined for the shaded areas between the upper and lower lines of some channels, enhancing visual clarity.
3. Channel Calculation Mechanism
At the heart of the indicator is the function f_calcChannel(), which takes as input:
A data source (_src),
A period (_length), and
A multiplier (_mult).
The calculation process comprises several key steps:
Moving Averages Calculation
The function computes both a weighted moving average (WMA) and a simple moving average (SMA) over the defined length.
Baseline Determination
It then combines these averages into two values (A and B) using linear formulas (e.g., A = 4*b - 3*a and B = 3*a - 2*b). These values help to establish a baseline that represents the central trend during the lookback period.
Slope and Deviation Calculation
A slope (m) is calculated based on the difference between A and B.
The function iterates over the period, measuring the squared deviation between the actual data point and a corresponding value on the regression line. The sum of these squared deviations is used to compute the RMSE.
Defining Upper and Lower Bounds
The RMSE is multiplied by the provided multiplier (_mult) and then added to or subtracted from the baseline B to create the upper and lower channel boundaries.
This method produces an envelope that widens or narrows based on the volatility reflected by the RMSE.
This process is repeated using different multipliers (1, 2, and 3) for channels 6, 7, and 8, providing multiple levels that offer deeper insights into market conditions.
4. Chart Visualization
The indicator plots several lines and shaded regions:
Channels 6, 7, and 8: For each of these channels, three levels are calculated:
Levels with a multiplier of 1 (thin lines with a line width of 1),
Levels with a multiplier of 2 (medium lines with a line width of 2),
Levels with a multiplier of 3 (thick lines with a line width of 4).
To further enhance visual interpretation, shaded areas (fills) are added between the upper and lower lines — notably for the level with multiplier 3.
Channel 5: Although the calculations for channel 5 are included, its plot commands are commented out. This means it won’t display on the chart unless you uncomment the relevant lines by modifying the script.
5. Conditions and Alerts
Beyond the visual channels, the indicator integrates several alert conditions and visual markers:
Graphical Conditions:
The script defines conditions checking whether the price (i.e., the source) is above or below specific channel levels, particularly the levels calculated with multipliers 2 and 3.
“Mixed” conditions are also established to detect when the price is simultaneously above one set of levels and below another, aiming to highlight potential reversal areas.
Automated Alerts:
Alert conditions are programmed to notify you when the price crosses specific channel boundaries:
Alerts for conditions such as “Upper Channels 2” or “Lower Channels 2” indicate when prices exceed or fall below the second level of the channels.
Similarly, alerts for “Upper Channels 3” and “Lower Channels 3” correspond to the more extreme boundaries defined by the multiplier of 3.
Visual Symbols:
The indicator employs the plotchar() function to place symbols (like 🌙, ⚠️, 🪐, and ☢️) directly on the chart. These symbols make it easy to spot when the price meets these crucial levels.
These alert features are especially valuable for traders who rely on real-time notifications to adjust positions or watch for potential trend shifts.
6. How to Use the Indicator
Installation and Setup:
Copy the provided code into your Pine Script editor on your charting platform (e.g., TradingView) and add the indicator to your chart.
Customize the parameters according to your trading strategy:
Channel Lengths: Modify the lookback periods to see how the envelope adapts.
Colors and Transparencies: Adjust these to fit your display preferences.
Multipliers: Experiment with the multipliers to observe how different settings affect the channel widths.
Interpreting the Channels:
The upper and lower bands represent dynamic thresholds that change with market volatility.
A price that nears an upper boundary might indicate an overextended move upward, whereas a break beyond these dynamic boundaries could signal a potential trend reversal.
Utilizing Alerts:
Configure notifications based on the alert conditions so you can be alerted when the price moves beyond the defined channel levels. This can help trigger entry or exit signals, or simply keep you informed of significant price movements.
Multi-Level Analysis:
The strength of this indicator lies in its multi-level approach. With three defined levels for channels 6, 7, and 8, you gain a more nuanced view of market volatility and trend strength.
For instance, a price crossing the level with a multiplier of 2 might indicate the start of a trend change, while a break of the level with multiplier 3 might confirm a strong trend movement.
7. In Summary
The AWR_8DLRC indicator is a comprehensive tool for drawing dynamic channels based on a regression and RMSE-driven volatility measure. It offers:
Multiple channel levels, each with different lookback periods and multipliers.
Shaded regions between channel boundaries for rapid visual interpretation.
Alert conditions to notify you immediately when the price hits critical levels.
Visual markers directly on the chart to highlight key moments of price action.
This indicator is particularly suited for technical traders seeking to dynamically identify support and resistance zones with a responsive alert system. Its customizable settings and rich array of signals provide an excellent framework to refine your trading decisions.
ابحث في النصوص البرمجية عن "band"

VWAP Z-Score Oscillator + Scaled TableVWAP Z-Score Oscillator + Scaled Table
This indicator calculates the Z-Score of the VWAP (Volume Weighted Average Price) based on your chosen source price and reset period (Session, Week, Month, Quarter, or Year).
The Z-Score represents how many standard deviations the current price is from the VWAP, visualized as an oscillator oscillating between ±3 sigma levels. The indicator also features three standard deviation bands for easy reference.
To enhance readability, a scaled Z-Score is displayed in a clean, minimalistic table on the top right of the indicator panel. This score is linearly capped between -2 and +2, mapping the raw Z-Score values with limits at ±3 sigma for clarity and quick assessment.
Use this tool to identify extreme deviations from the VWAP, which may signal potential reversals or continuation of price trends.

Turtle ZoneTurtle Zone indicator helps to visually determine support and resistance zones of the price movement.
Displays a channel with zones located symmetrically around the moving average of the price.
Width of the channel is determined by the current volatility computed as average true range which makes the channel width adaptable to the volatility.
Touching of the zones from inside of the channel can be interpreted as a signal of potential reversal.
Breaking outside of the outer boundary of the zones can be interpreted as a signal of a potential continuation of price movement.
Parameters
• Price Source - Component of the bar for computation. Default is ‘hlc3’. Other reasonable values, such as ‘ohlc4’, ‘open’ or’ close’ can be used by advanced users.
• Lookback period - Amount of bars used in moving average computation. Default is 200.
• Inner Amplitude - Relative width of the inner channel. Default is 5.6.
• Outer Amplitude - Relative width of the outer channel. Default is 9.6.
Available plots for notifications
There are five plots on the graph comprising the channel: four boundaries of the channel bands and one hidden mean line of the channel:
Upper Zone Upper Line
Upper Zone Lower Line
Mean
Lower Zone Upper Line
Lower Zone Lower Line
All of the plots can be used to set up notifications.
Notes
All computations are performed in logarithmic price scale which makes this indicator useful on large timeframes.
Credits
This script uses Ehlers_Super_Smoother library by KevanoTrades

Upper and Lower bound for pairs/BTCUpper and Lower Bound for Pairs/BTC
This indicator provides dynamic upper and lower boundary levels for cryptocurrency pairs traded against BTC. It uses statistical or technical analysis methods, such as Z-Score, Bollinger Bands, or moving averages, to identify key resistance (upper bound) and support (lower bound) levels.
Key Features:
Dynamic Boundaries: Tracks real-time price fluctuations of selected pairs against BTC, adapting to market conditions.
Market Insights: Helps traders visualize potential overbought (upper bound) and oversold (lower bound) zones for pairs like ETH/BTC, DOGE/BTC, and others.
Customizable Settings: Allows users to configure lookback periods, standard deviations, or other parameters for boundary calculations.
Decision Support: Assists in identifying reversal or breakout points to refine entry and exit strategies.
This tool is ideal for traders seeking to optimize risk management and spot opportunities in BTC pair markets.

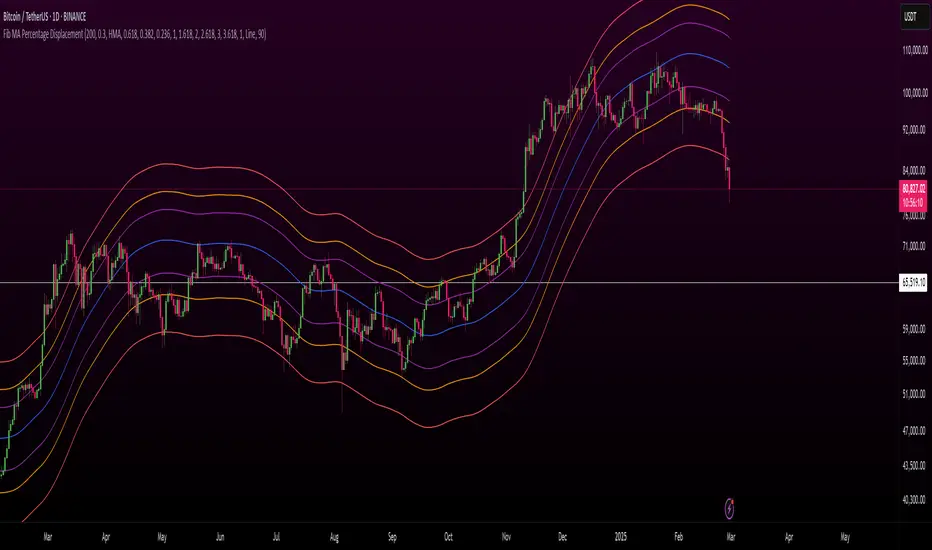
Fibonacci Displaced Moving Averages with Percentage DisplacementThis indicator combines Fibonacci levels with percentage-based displacement, creating a versatile tool for analyzing moving averages in relation to market trends and potential reversal points. It's designed to adapt to different market conditions and asset types, making it a valuable addition to a trader's toolkit.
Key Features:
Fibonacci-Infused Averages: Leverages Fibonacci ratios (0.618, 0.382, 0.236) to construct displaced moving averages. This method offers a layered perspective of market support and resistance levels.
Adaptive Percentage-Based Displacement: The displacement of the moving average is calculated as a percentage of the average, allowing for flexible and market-responsive band positioning. This feature is particularly crucial for adapting to the unique volatility and price behavior of different trading pairs.
Customizable SMA Core: The core of the indicator is a simple moving average (SMA), which can be tailored in length to suit various trading strategies and timeframes.
Logarithmic Scale Compatibility: Includes an option for logarithmic scaling, making it applicable to a broad range of assets, including those with exponential price trends.
Advanced Alert System: Equipped with a comprehensive alert system, it notifies traders of price crossings over any of the Fibonacci displaced moving averages, aiding timely market responses.
Optimizing for Different Pairs:
To maximize the indicator's effectiveness, it is crucial to fine-tune the Percentage Displacement setting according to the specific volatility and price movement characteristics of each trading pair. This customization ensures that the displaced moving averages accurately reflect the market dynamics of each asset, providing more reliable support and resistance levels for traders.
Ideal Use Cases:
This indicator is ideal for traders who seek a deeper understanding of moving averages, especially in markets where Fibonacci levels play a significant role. It is versatile enough for various trading approaches, including swing and day trading, and adaptable across multiple timeframes.
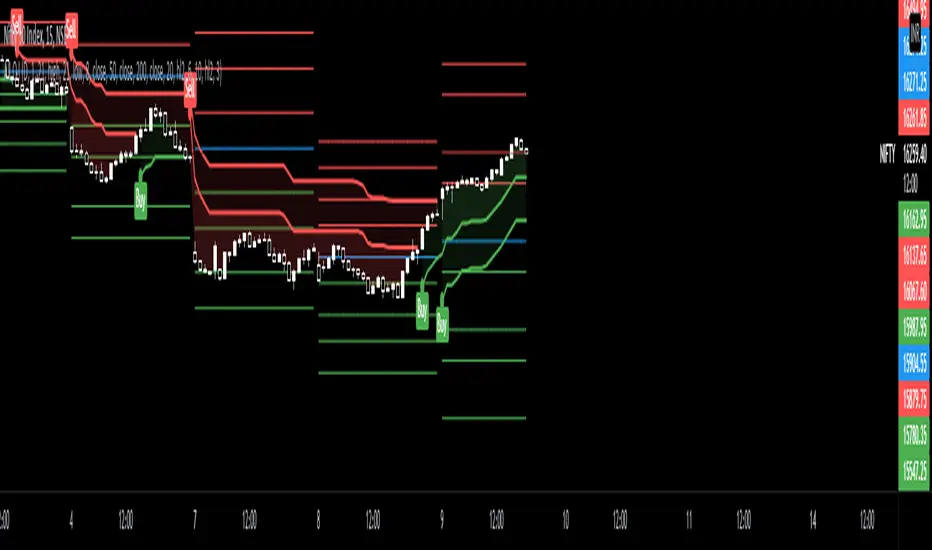
Thursday Close BandsThis script is useful for Indian Markets where weekly expiry is on Thursday.
As per last 10 years historical stats Nifty stays with in 3% range from Thursday close 80% times.

BB Strategy toobabollinger bands strategy with added upper basis and lower line on the chart.
when we use BB strategy in trading view unfortunately the upper, lower and basis line did not display.
so we solve the problem with just a little script codes and bring back the lines to the chart

MCL-YG Pair Trading StrategyThis strategy uses Bollinger Band breakouts to detect buy and sell signals on a correlated pair of assets.


Joker Linear Regression ChannelLinear regression analysis is used to predict the value of a variable based on the value of another variable. The variable you want to predict is called the dependent variable. The variable you are using to predict the other variable's value is called the independent variable. This indicator plot channel bands of Linear Regression.

Rma Stdev BandsStandard Deviation support resistances with percent boxes.
The Relative Moving Average isn’t a well-known moving average. But TradingView uses this average with two popular indicators: the Relative Strength Index (RSI) and Average True Range (ATR)
The weighting factors that the Relative Moving Average uses decrease exponentially. That way recent bars have the highest weight, while earlier bars get smaller weights the older they are.

CPR PIVOT, 2ST, 5MA, VWAPSUPERTREND
2 supertrend with diffrent patameters.
MOVING AVERAGE RIBBON
5 differenT EMA
VWAP
Simple vwap with bands nothing special
every parameters and looks can be change
AND CPR
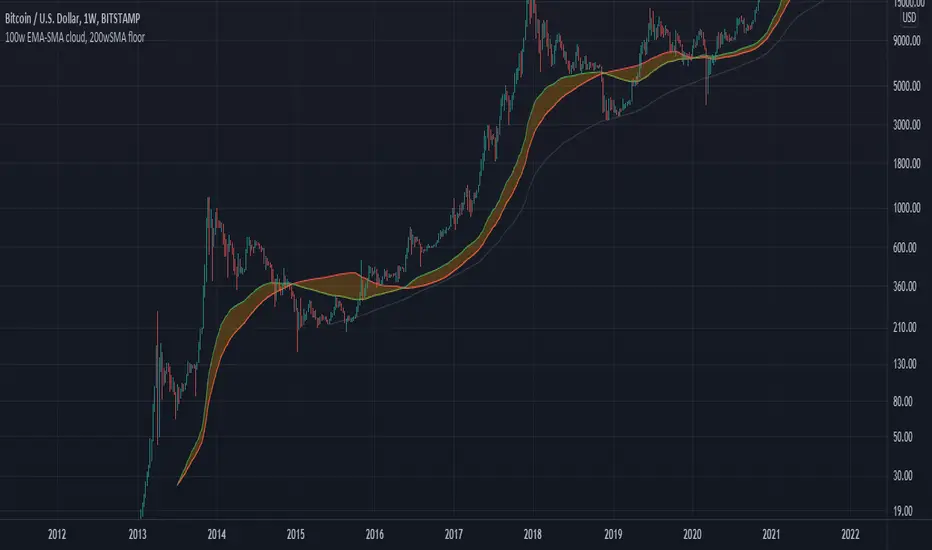
100w EMA-SMA cloud, 200wSMA floorRepresents a support band for the full bull/bear market cycles. Bull markets tend to hold the 100w EMA over the 100w SMA. When the flippening is produced, historically for BTCUSD there is a long bear market which leads to a 200w SMA support. Then, when the 100w EMA gets above the 100w SMA again, the bear market is motly over and the bullrun starts again.
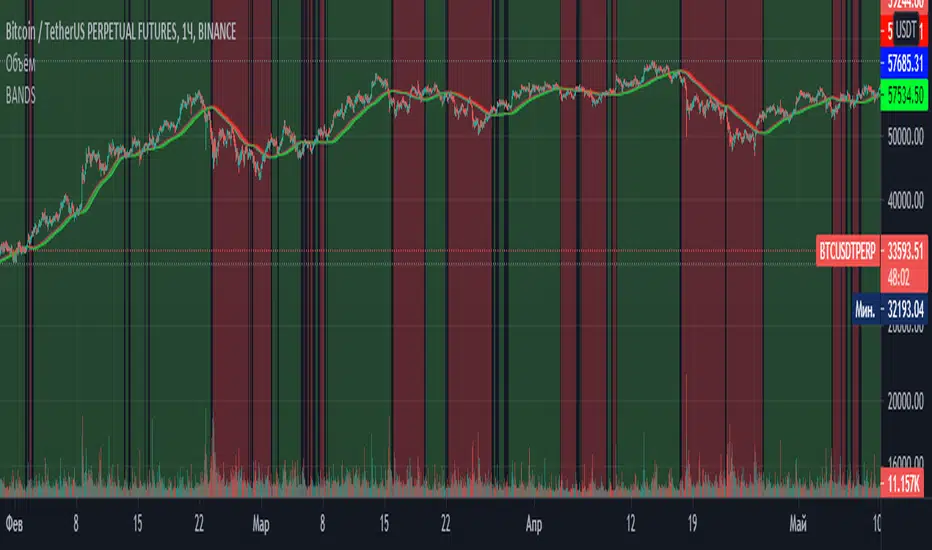
BANDSTrend indicator. It is based on a simple moving average, the maximum and minimum of this moving average for the period. When the moving average coincides with its maximum for the period , the trend is rising, when the moving average coincides with its minimum for the period, the trend is falling. The optimal periods should be selected for each timeframe and trading instrument.
MA + ATR Channel V2This script creates a dynamic volatility channel (similar to a Keltner Channel). It plots a central Moving Average (SMA or EMA) to represent the baseline trend and uses the Average True Range (ATR) to calculate the Upper and Lower bands. The channel automatically widens during high volatility and narrows during low volatility.
Usage
Mean Reversion: In sideways markets, prices touching the outer bands often tend to revert back to the central line.
该脚本构建了一个基于波动率的动态通道(类似肯特纳通道)。它以**移动平均线(SMA或EMA)为中轴判断趋势,并利用真实波幅(ATR)**计算通道宽度。通道范围会随市场波动加剧而变宽,随波动平缓而收窄。
用法
震荡回归: 在横盘行情中,价格触及通道边缘时,往往有回调至中轴的倾向。

BTC Price Prediction Model [Global PMI]🇨🇳 中文说明 (Chinese Version)
1. 简介
本指标由 GW Capital 使用 Gemini Vibe Coding 技术制作。利用先进的 AI 编程能力,将复杂的宏观经济模型重构为可执行的交易工具。
2. 致谢
特别感谢模型原作者 Marty Kendall。他对这一算法的研究奠定了基础,揭示了比特币价格与宏观经济因素之间的深层联系。
3. 模型原理与公式
该模型基于四大宏观经济支柱计算比特币的“公允价值”。它假设比特币的价格是全球流动性、网络安全性、风险偏好和经济周期的函数。
模型公式
$$\ln(BTC) = \alpha + (1 + \beta \cdot PMI_{z}) \times $$
全球流动性 (M2): 美、中、欧、日四大经济体的 M2 总量(折算为美元)。代表可流入资产的法币资金池。
网络安全性 (Hashrate): 比特币全网算力,代表网络的物理安全性和实用价值。
风险偏好 (S&P 500): 作为全球风险情绪的代理指标。
经济周期 (PMI Z-Score): 美国制造业 PMI 用于根据商业周期(扩张 vs 收缩)来放大或抑制估值。
4. 指标用法
指标会在图表上绘制 公允价值 (白线) 以及基于统计偏差 (Z-Score) 的四条情绪带。
情绪区间
🚨 极度贪婪 (红色区域): 价格 > +0.3 标准差。历史上通常预示市场顶部或情绪过热。
⚠️ 一般贪婪 (橙色区域): 价格 > +0.15 标准差。多头动能强劲,但需谨慎。
⚖️ 公允价值 (白线): 基于宏观数据的理论“正确”价格。
😨 一般恐惧 (青色区域): 价格 < -0.15 标准差。进入低估区域。
💎 极度恐惧 (绿色区域): 价格 < -0.3 标准差。历史上通常是代际级别的买入机会。
情绪评分 (0-100)
100: 极度贪婪 (顶部)
50: 公允价值
0: 极度恐惧 (底部)
5. 使用建议
周期: 仅限日线 (1D) 或周线 (1W)。
原因: 底层数据源(M2, PMI)是月度更新的。标普500和算力是日度更新的。在日内图表(如15分钟、1小时、4小时)上使用此指标没有任何意义,因为基本面数据不会变化得那么快。
长期视角: 这是一个宏观周期指标,旨在识别数月甚至数年的周期顶部和底部,而非用于日内交易。
6. 免责声明
本指标仅供教育和参考使用,不构成任何财务建议。该模型依赖于历史相关性,未来可能不再适用。所有交易均涉及风险。GW Capital 及制作者不对任何交易损失承担责任。
🇺🇸 English Guide (英文说明)
1. Introduction
This indicator was created by GW Capital using Gemini Vibe Coding technology. It leverages advanced AI coding capabilities to reconstruct complex macroeconomic models into actionable trading tools.
2. Credits
Special thanks to the original model author, Marty Kendall. His research into the correlation between Bitcoin's price and macroeconomic factors lays the foundation for this algorithm.
3. Model Principles & Formula
This model calculates the "Fair Value" of Bitcoin based on four key macroeconomic pillars. It assumes that Bitcoin's price is a function of Global Liquidity, Network Security, Risk Appetite, and the Economic Cycle.
The Formula
$$\ln(BTC) = \alpha + (1 + \beta \cdot PMI_{z}) \times $$
Global Liquidity (M2): Sum of M2 supply from US, China, Eurozone, and Japan (converted to USD). Represents the pool of fiat money available to flow into assets.
Network Security (Hashrate): Bitcoin's hashrate, representing the physical security and utility of the network.
Risk Appetite (S&P 500): Used as a proxy for global risk sentiment.
Economic Cycle (PMI Z-Score): US Manufacturing PMI is used to amplify or dampen the valuation based on where we are in the business cycle (Expansion vs. Contraction).
4. How to Use
The indicator plots the Fair Value (White Line) and four sentiment bands based on statistical deviation (Z-Score).
Sentiment Zones
🚨 Extreme Greed (Red Zone): Price > +0.3 StdDev. Historically indicates a market top or overheated sentiment.
⚠️ Greed (Orange Zone): Price > +0.15 StdDev. Bullish momentum is strong but caution is advised.
⚖️ Fair Value (White Line): The theoretical "correct" price based on macro data.
😨 Fear (Teal Zone): Price < -0.15 StdDev. Undervalued territory.
💎 Extreme Fear (Green Zone): Price < -0.3 StdDev. Historically a generational buying opportunity.
Sentiment Score (0-100)
100: Maximum Greed (Top)
50: Fair Value
0: Maximum Fear (Bottom)
5. Usage Recommendations
Timeframe: Daily (1D) or Weekly (1W) ONLY.
Reason: The underlying data sources (M2, PMI) are updated monthly. The S&P 500 and Hashrate are daily. Using this indicator on intraday charts (e.g., 15m, 1h, 4h) adds no value because the fundamental data does not change that fast.
Long-Term View: This is a macro-cycle indicator designed for identifying cycle tops and bottoms over months and years, not for day trading.
6. Disclaimer
This indicator is for educational and informational purposes only. It does not constitute financial advice. The model relies on historical correlations which may not hold true in the future. All trading involves risk. GW Capital and the creators assume no responsibility for any trading losses.

Smart Donchian Channel Hariss 3691. The Donchian Channel is a trend-following indicator. It’s primarily used to identify volatility, breakouts, and price trends.
The channel is composed of three lines:
Upper Band: The highest high over a specified period (e.g., 20 bars).
Lower Band: The lowest low over the same period.
Middle Line (optional): The average of the upper and lower bands.
2. How the Donchian Channel Detects Price Momentum
The Donchian Channel is based on price extremes, which inherently reflects momentum and market sentiments.
Price Above Midline / Upper Band: Indicates strong bullish momentum. Buyers are dominating, pushing price toward new highs.
Price Below Midline / Lower Band: Indicates strong bearish momentum. Sellers are in control, pushing price toward new lows.
Price Touching the Bands:
Upper band breakout: A potential continuation of an uptrend or trend initiation.
Lower band breakout: A potential continuation of a downtrend or trend initiation.
Bounce from the bands: Signals potential reversals or retracements.
Essentially, the Donchian Channel acts as a dynamic support and resistance level.
3. Interpreting Market Conditions
Trending Markets:
Price moves along or breaks out from the upper/lower band. Donchian Channel expands as volatility increases. Breakouts from the channel often indicate continuation of the trend.
Sideways/Range-Bound Markets:
Price oscillates between upper and lower bands. Channel width narrows. Bounces from upper/lower bands may produce false signals unless filtered by volume or trend indicators.
4. Trading Applications
Breakout Strategy:
Buy when price closes above the upper band.
Sell when price closes below the lower band.
Useful for trend-following systems.
Reversal/Bounce Strategy:
Buy when price bounces from the lower band.
Sell when price rejects the upper band.
How this indicator has been designed to reduce false signals:
Buy signal fires when price bounces from the lower band with high volume (1.5), bullish RSI and DMI/ADX.
Sell signal fires when price reverses from upper band with high volume (1.5) with bearish RSI and DMI/ADX.
One can change the RSI and RVOL setting according to trading style and class assets being traded.
Trading With this Indicator:
Buy when the signal is fired to buy, place Stop Loss just below the low of last candle and take profit @1.5 or 2 times of stop loss.
Sell when the signal is fired to sell, place stop loss just above the high of the last candle and take profit @1.5 or 2 times of stop loss.
It is to note that, this indicator is a trend following indicator, so be with the trend will avoid missing out trend following levels or early exit.

Channels Strategy [JoseMetal]============
ENGLISH
============
- Description:
This strategy is based on Bollinger Bands / Keltner Channel price "rebounds" (the idea of price bouncing from one band to another).
The strategy has several customizable options, which allows you to refine the strategy for your asset and timeframe.
You can customize settings for ALL indicators, Bollinger Bands (period and standard deviation), Keltner Channel (period and ATR multiplier) and ATR (period).
- AVAILABLE INDICATORS:
You can pick Bollinger Bands or Keltner Channels for the strategy, the chosen indicator will be plotted as well.
- CUSTOM CONDITIONS TO ENTER A POSITION:
1. Price breaks the band (low below lower band for LONG or high above higher band for SHORT).
2. Same as 1 but THEN (next candle) price closes INSIDE the bands.
3. Price breaks the band AND CLOSES OUT of the band (lower band for LONG and higher band for SHORT).
4. Same as 3 but THEN (next candle) price closes INSIDE the bands.
- STOP LOSS OPTIONS:
1. Previous wick (low of previous candle if LONG and high or previous candle if SHORT).
2. Extended band, you can customize settings for a second indicator with larger values to use it as STOP LOSS, for example, Bollinger Bands with 2 standard deviations to open positions and 3 for STOP LOSS.
3. ATR: you can pick average true ratio from a source (like closing price) with a multiplier to calculate STOP LOSS.
- TAKE PROFIT OPTIONS:
1. Opposite band (top band for LONGs, bottom band for SHORTs).
2. Moving average: Bollinger Bands simple moving average or Keltner Channel exponential moving average .
3. ATR: you can pick average true ratio from a source (like closing price) with a multiplier to calculate TAKE PROFIT.
- OTHER OPTIONS:
You can pick to trade only LONGs, only SHORTs, both or none (just indicator).
You can enable DYNAMIC TAKE PROFIT, which updates TAKE PROFIT on each candle, for example, if you pick "opposite band" as TAKE PROFIT, it'll update the TAKE PROFIT based on that, on every single new candle.
- Visual:
Bands shown will depend on the chosen indicator and it's settings.
ATR is only printed if used as STOP LOSS and/or TAKE PROFIT.
- Recommendations:
Recommended on DAILY timeframe , it works better with Keltner Channels rather than Bollinger Bands .
- Customization:
As you can see, almost everything is customizable, for colors and plotting styles check the "Style" tab.
Enjoy!
============
ESPAÑOL
============
- Descripción:
Esta estrategia se basa en los "rebotes" de precios en las Bandas de Bollinger / Canal de Keltner (la idea de que el precio rebote de una banda a otra).
La estrategia tiene varias opciones personalizables, lo que le permite refinar la estrategia para su activo y temporalidad favoritas.
Puedes personalizar la configuración de TODOS los indicadores, Bandas de Bollinger (periodo y desviación estándar), Canal de Keltner (periodo y multiplicador ATR) y ATR (periodo).
- INDICADORES DISPONIBLES:
Puedes elegir las Bandas de Bollinger o los Canales de Keltner para la estrategia, el indicador elegido será mostrado en pantalla.
- CONDICIONES PERSONALIZADAS PARA ENTRAR EN UNA POSICIÓN:
1. El precio rompe la banda (mínimo por debajo de la banda inferior para LONG o máximo por encima de la banda superior para SHORT).
2. Lo mismo que en el punto 1 pero ADEMÁS (en la siguiente vela) el precio cierra DENTRO de las bandas.
3. El precio rompe la banda Y CIERRA FUERA de la banda (banda inferior para LONG y banda superior para SHORT).
4. Igual que el 3 pero ADEMÁS (siguiente vela) el precio cierra DENTRO de las bandas.
- OPCIONES DE STOP LOSS:
1. Mecha anterior (mínimo de la vela anterior si es LONGy máximo de la vela anterior si es SHORT).
2. Banda extendida, puedes personalizar la configuración de un segundo indicador con valores más extensos para utilizarlo como STOP LOSS, por ejemplo, Bandas de Bollinger con 2 desviaciones estándar para abrir posiciones y 3 para STOP LOSS.
3. ATR: puedes elegir el average true ratio de una fuente (como el precio de cierre) con un multiplicador para calcular el STOP LOSS.
- OPCIONES DE TAKE PROFIT:
1. Banda opuesta (banda superior para LONGs, banda inferior para SHORTs).
2. Media móvil: media móvil simple de las Bandas de Bollinger o media móvil exponencial del Canal de Keltner .
3. ATR: se puede escoger el average true ratio de una fuente (como el precio de cierre) con un multiplicador para calcular el TAKE PROFIT.
- OTRAS OPCIONES:
Puedes elegir operar sólo con LONGs, sólo con SHORTs, ambos o ninguno (sólo el indicador).
Puedes activar el TAKE PROFIT DINÁMICO, que actualiza el TAKE PROFIT en cada vela, por ejemplo, si eliges "banda opuesta" como TAKE PROFIT, actualizará el TAKE PROFIT basado en eso, en cada nueva vela.
- Visual:
Las bandas mostradas dependerán del indicador elegido y de su configuración.
El ATR sólo se muestra si se utiliza como STOP LOSS y/o TAKE PROFIT.
- Recomendaciones:
Recomendada para temporalidad de DIARIO, funciona mejor con los Canales de Keltner que con las Bandas de Bollinger .
- Personalización:
Como puedes ver, casi todo es personalizable, para los colores y estilos de dibujo comprueba la pestaña "Estilo".
¡Que lo disfrutes!

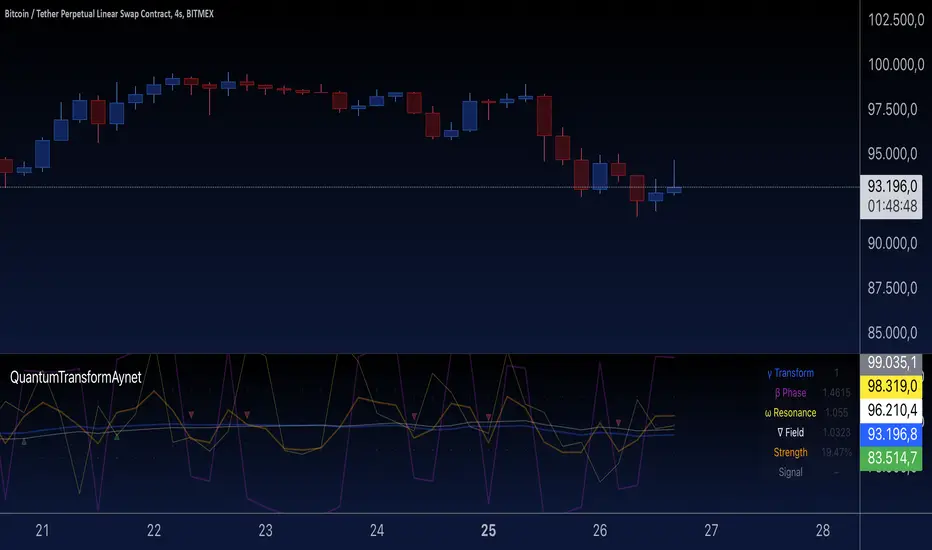
Quantum Transform - AynetQuantum Transform Trading Indicator: Explanation
This script is called a "Quantum Transform Trading Indicator" and aims to enhance market analysis by applying complex mathematical models. Written in Pine Script, the indicator includes the following elements:
1. General Structure
Quantum Parameters: Inspired by physical and mathematical concepts (Planck constant ℏ, wave function Ψ, time τ, etc.), it uses specific parameters.
Transformation Functions: Applies various mathematical operations to transform price data in different ways.
Signal Generation: Produces signals for long and short positions.
Visualization: Displays different price transformations and signals on the chart.
2. Core Parameters
The parameters allow users to control various transformations:
Planck Constant (ℏ): A scaling factor for wave modulation.
Wave (Ψ): Controls oscillation in price data.
Time (τ): The length of the lookback period for calculations.
Relativity (γ): Power factor in the Lorentz transformation.
Phase Shift (β): Manages phase shift in transformations.
Frequency (ω): Represents the frequency of price movements.
Dimensions (∇): Enables multi-dimensional field analysis.
3. Functions
a) Relativistic Transform
Inspired by the theory of relativity.
Calculates the Lorentz factor using the rate of price change.
Transforms price data to amplify the relativity effect.
b) Phase Transform
Calculates the phase of price data and applies wave modulation.
Creates phase and amplitude modulation based on the bar index.
c) Resonance Transform
Calculates resonance effects using natural frequency and oscillations.
Highlights periodic behaviors of price movements.
d) Field Transform
Applies multi-dimensional field calculations.
Combines strength, wave, and coherence aspects of price data.
e) Chaos Transform
Implements a chaos effect based on sensitivity analysis.
Simulates chaotic behaviors of price movements.
4. Main Calculations
Quantum Price: The average of all transformation functions.
Bands:
Upper Band: The highest level of quantum price.
Lower Band: The lowest level of quantum price.
Mid Band: The average of upper and lower bands.
Momentum: Calculates the rate of change in quantum price.
5. Signal Generation
Long Signal:
Triggered when the phase price crosses above the field price.
Momentum must be positive, and the price above the mid-band.
Short Signal:
Triggered when the phase price crosses below the field price.
Momentum must be negative, and the price below the mid-band.
Signal strength is calculated relative to the momentum moving average.
6. Visualization
Each transformation is displayed in a unique color.
Bands and Momentum: Visualize price behavior.
Signal Icons: Show buy/sell signals using up/down arrows on the chart.
7. Information Panel
A table in the top-right corner of the chart displays:
The current values of each transformation.
Signal strength (as a percentage).
The type of signal (⬆: Long, ⬇: Short).
Applications
Trend Following: Analyze trends with complex transformations.
Resonance and Chaos Analysis: Understand dynamic behaviors of price.
Signal Strategies: Create strong and reliable buy/sell signals.
If you have any additional questions or customization requests regarding this indicator, feel free to ask!
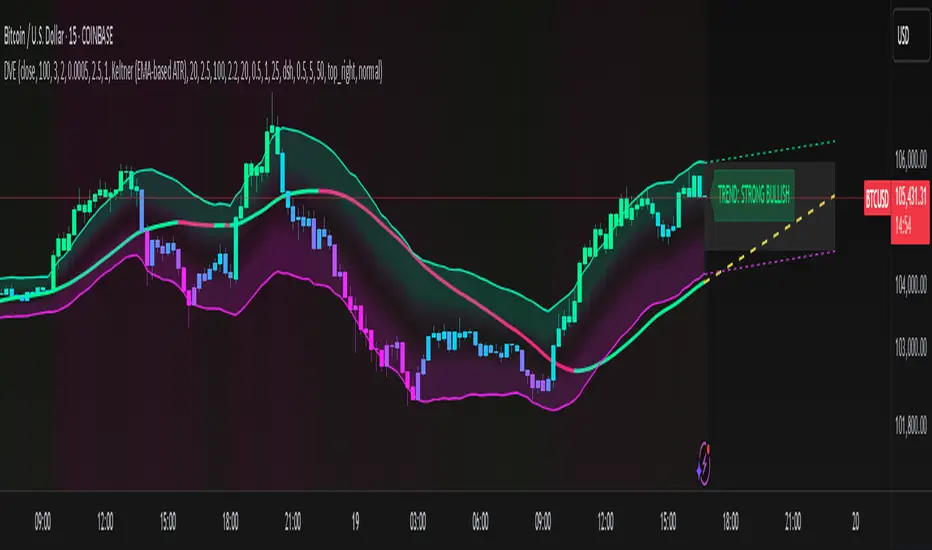
Dynamic Volatility EnvelopeDynamic Volatility Envelope: Indicator Overview
The Dynamic Volatility Envelope is an advanced, multi-faceted technical indicator designed to provide a comprehensive view of market trends, volatility, and potential future price movements. It centers around a customizable linear regression line, enveloped by dynamically adjusting volatility bands. The indicator offers rich visual feedback through gradient coloring, candle heatmaps, a background volatility pulse, and an on-chart trend strength meter.
Core Calculation Mechanism
Linear Regression Core :
-A central linear regression line is calculated based on a user-defined source (e.g., close, hl2) and lookback period.
-The regression line can be optionally smoothed using an Exponential Moving Average (EMA) to reduce noise.
-The slope of this regression line is continuously calculated to determine the current trend direction and strength.
Volatility Channel :
-Dynamic bands are plotted above and below a central basis line. This basis is typically the calculated regression line but shifts to an EMA in Keltner mode.
-The width of these bands is determined by market volatility, using one of three user-selectable modes:
ATR Mode : Bandwidth is a multiple of the Average True Range (ATR).
Standard Deviation Mode : Bandwidth is a multiple of the Standard Deviation of the source data.
Keltner Mode (EMA-based ATR) : ATR-based bands are plotted around a central Keltner EMA line, offering a smoother channel.
The channel helps identify dynamic support and resistance levels and assess market volatility.
Future Projection :
The indicator can project the current regression line and its associated volatility bands into the future for a user-defined number of bars. This provides a visual guide for potential future price pathways based on current trend and volatility characteristics.
Candle Heatmap Coloring :
-Candle bodies and/or wicks/borders can be colored based on the price's position within the upper and lower volatility bands.
-Colors transition in a gradient from bearish (when price is near the lower band) through neutral (mid-channel) to bullish (when price is near the upper band), providing an intuitive visual cue of price action relative to the dynamic envelope.
Background Volatility Pulse :
The chart background color can be set to dynamically shift based on a ratio of short-term to long-term ATR. This creates a "pulse" effect, where the background subtly changes color to indicate rising or falling market volatility.
Trend Strength Meter :
An on-chart text label displays the current trend status (e.g., "Strong Bullish", "Neutral", "Bearish") based on the calculated slope of the regression line relative to user-defined thresholds for normal and strong trends.
Key Features & Components
-Dynamic Linear Regression Line: Core trend indicator with optional smoothing and slope-based gradient coloring.
-Multi-Mode Volatility Channel: Choose between ATR, Standard Deviation, or Keltner (EMA-based ATR) calculations for band width.
-Customizable Vertical Gradient Channel Fills: Visually distinct fills for upper and lower channel segments with user-defined top/bottom colors and gradient spread.
-Future Projection: Extrapolates regression line and volatility bands to forecast potential price paths.
-Price-Action Based Candle Heatmap: Intuitive candle coloring based on position within the volatility channel, with adjustable gradient midpoint.
-Volatility-Reactive Background Gradient: Subtle background color shifts to reflect changes in market volatility.
-On-Chart Trend Strength Meter: Clear textual display of current trend direction and strength.
-Extensive Visual Customization: Fine-tune colors, line styles, widths, and gradient aggressiveness for most visual elements.
-Comprehensive Tooltips: Detailed explanations for every input setting, ensuring ease of use and understanding.
Visual Elements Explained
Regression Line : The primary trend line. Its color dynamically changes (e.g., green for uptrend, red-pink for downtrend, neutral for flat) based on its slope, with smooth gradient transitions.
Volatility Channel :
Upper & Lower Bands : These lines form the outer boundaries of the envelope, acting as dynamic support and resistance levels.
Channel Fill : The area between the band center and the outer bands is filled with a vertical gradient. For example, the upper band fill might transition from a darker green near the center to a lighter green at the upper band.
Band Borders : The lines outlining the upper and lower bands, with customizable color and width.
Future Projection Lines & Fill :
Projected Regression Line : An extension of the current regression line into the future, typically styled differently (e.g., dashed).
Projected Channel Bands : Extensions of the upper and lower volatility bands.
Projected Area Fill : A semi-transparent fill between the projected upper and lower bands.
Candle Heatmap Coloring : When enabled, candles are colored based on their closing price's relative position within the channel. Bullish colors appear when price is in the upper part of the channel, bearish in the lower, and neutral in the middle. Users can choose to color the entire candle body or just the wicks and borders.
Background Volatility Pulse : The chart's background color subtly shifts (e.g., between a calm green and an agitated red-pink) to reflect the current volatility regime.
Trend Strength Meter : A text label (e.g., "TREND: STRONG BULLISH") positioned on the chart, providing an at-a-glance summary of the trend.
Configuration Options
Users can tailor the indicator extensively via the settings panel, with options logically grouped:
Core Analysis Engine : Adjust regression source data, lookback period, and EMA smoothing for the regression line.
Regression Line Visuals : Control visibility, line width, trend-based colors (uptrend, downtrend, flat), slope thresholds for trend definition, strong slope multiplier (for Trend Meter), and color gradient sharpness.
Volatility Channel Configuration : Select band calculation mode (ATR, StdDev, Keltner), set relevant periods and multipliers. Customize colors for vertical gradient fills (upper/lower, top/bottom), border line colors, widths, and the gradient spread factor for fills.
Future Projection Configuration : Toggle visibility, set projection length (number of bars), line style, and colors for projected regression and band areas.
Appearance & Candle Theme : Set default bull/bear candle colors, enable/disable candle heatmap, choose if body color matches heatmap, and configure heatmap gradient target colors (bull, neutral, bear) and the gradient's midpoint.
Background Volatility Pulse : Enable/disable the background effect and configure short/long ATR periods for the volatility calculation.
Trend Strength Meter : Enable/disable the meter, and choose its on-chart position and text size.
Interpretation Notes
-The Regression Line is the primary indicator of trend direction. Its slope and color provide immediate insight.
-The Volatility Bands serve as dynamic support and resistance zones. Price approaching or touching these bands may indicate potential turning points or breakouts. The width of the channel itself reflects market volatility – widening suggests increasing volatility, while narrowing suggests consolidation.
Future Projections are not predictions but rather an extension of current conditions. They can help visualize potential areas where price might interact with projected support/resistance if the current trend and volatility persist.
Candle Heatmap Coloring offers a quick visual assessment of where price is trading within the dynamic envelope, highlighting strength or weakness relative to the channel.
The Background Volatility Pulse gives a contextual feel for overall market agitation or calmness.
This indicator is designed to be a comprehensive analytical tool. Its signals and visualizations are best used in conjunction with other technical analysis techniques, price action study, and robust risk management practices. It is not intended as a standalone trading system.
Risk Disclaimer
Trading and investing in financial markets involve substantial risk of loss and is not suitable for every investor. The Dynamic Volatility Envelope indicator is provided for analytical and educational purposes only and does not constitute financial advice or a recommendation to buy or sell any security. Past performance is not indicative of future results. Always use sound risk management practices and never trade with capital you cannot afford to lose. The developers assume no liability for any financial losses incurred based on the use of this indicator.
WaveTrend Dynamic (Lazy Bear Style)█ OVERVIEW
The WaveTrend Dynamic indicator (in the style of Lazy Bear) is an advanced tool based on the Exponential Smoothing Average (ESA), which adapts to the volatility and price of a financial instrument. It is more flexible than the classic WaveTrend but shares a similar concept of bands around a main oscillator line.
The indicator uses dynamic bands calculated as distances from the ESA, with their width adjustable via the "level" parameter. This allows it to be tailored to various markets, timeframes, and volatility conditions, making it easier to identify trends, reversal points, and buy/sell signals.
█ CONCEPTS
The WaveTrend Dynamic combines oscillator functions with trend analysis. Below, we explain the key components in a simple way, understandable even for beginner users.
Core Calculations
The indicator relies on the adaptive ESA and a few straightforward steps:
1 — ESA (Adaptive Average): Calculated as a smoothed average of the price (from high, low, and close, or HLC3) using the ESA Length parameter (default: 10). This number determines how many past candles are considered in the calculation. The ESA quickly responds to price changes, helping to track trends.
2 — Deviation (D): Measures how much the price deviates from the ESA, factoring in market volatility. This allows the indicator to adapt to different instruments.
3 — Price Distance Indicator (CI): Shows how far the price is from the ESA relative to market volatility. This forms the basis for the main indicator line, reacting to price movements.
4 — WT1 (WaveTrend 1): The main line, smoothing the Price Distance Indicator (CI) with the Average Length parameter (default: 21). It reflects the direction of price movement and momentum.
5 — WT2 (WaveTrend 2): A signal line that further smooths WT1 (with a period of 4). It helps confirm signals through crossovers with WT1.
6 — Bands (UpperBand and LowerBand): These form a dynamic channel around the ESA. Their width depends on the level parameter (default: 100). Wider bands result in fewer but more reliable signals. In the original WaveTrend, the oscillator bands use lower values, such as 50 or 60. To achieve classic oscillator signals (more frequent WT1/WT2 crossovers outside the bands), set the level to 50–60.
Trend Identification
The indicator identifies two types of trends:
• Major Trend: Determined by the position of WT1 relative to the ESA. When WT1 is above the ESA, it indicates a bullish trend. When below, it signals a bearish trend. Line and fill colors reflect this trend.
• Mini-Trend: Based on WT1 and WT2 crossovers. When the lines cross, they change to the same color, signaling short-term changes or reversal points. This is ideal for quick trading decisions.
Visuals and Effects
• WT1 and WT2 Lines: Scaled to price and displayed on the price chart for easier analysis.
• Fills: Between the bands (UpperBand/LowerBand) and between WT1/WT2, with a "wave" effect that adjusts transparency based on the trend (green for bullish, red for bearish).
• Signals: Three types—return-to-band, WT1/WT2 crossovers outside the bands, and crossovers inside the bands. Signals are displayed as triangles with different colors for buy and sell.
█ FEATURES
Detailed features of the indicator, aligned with the order of settings in the script:
• Basic Parameters: ESA Length — controls ESA smoothing; Average Length — affects WT1 responsiveness; level (WT Level) — adjusts band width for signal filtering.
• Display Elements: Options to show/hide ESA, bands, WT1/WT2; customizable colors for lines, fills, and the wave effect.
• Signals: Three signal groups (return-to-band, crossovers outside bands, crossovers inside bands) with display and color customization options.
█ HOW TO USE
1 — Add the indicator to your TradingView chart and adjust parameters: — Increase ESA Length and Average Length for low-volatility markets (e.g., stocks), or decrease for cryptocurrencies or forex. — Set level to 50–60 for classic WaveTrend signals with WT1/WT2 crossovers outside bands. The default value of 100 creates wider bands and fewer signals.
2 — Analyze trends: — Major trend (WT1 vs. ESA) shows the overall market direction. — Mini-trends (WT1/WT2 crossovers) help time short-term entries.
3 — Use signals: — Return-to-band: Buy at the lower band, sell at the upper band (mean-reversion). — Crossovers outside bands: Indicate strong momentum (with a lower level, e.g., 50). — Crossovers inside bands: Signal weaker trend changes.
4 — Combine with other tools: Use with volume, RSI, or support/resistance for better decisions. Test on historical data to optimize settings.

Nadaraya-Watson Probability [Yosiet]The script calculates and displays probability bands around price movements, offering insights into potential market trends.
Setting Up the Script
Window Size: Determines the length of the window for the Nadaraya-Watson estimation. A larger window smooths the data more but might lag current market conditions.
Bandwidth: Controls the bandwidth for the kernel regression, affecting the smoothness of the probability bands.
Reading the Data Table
The script dynamically updates a table positioned at the bottom right of your chart, providing real-time insights into market probabilities. Here's how to interpret the table:
Table Columns: The table is organized into three columns:
Up: Indicates the probability or relative change percentage for the upper band.
Down: Indicates the probability or relative change percentage for the lower band.
Table Rows: There are two main rows of interest:
P%: Shows the price change percentage difference between the bands and the closing price. A positive value in the "Up" column suggests the upper band is above the current close, indicating potential upward momentum. Conversely, a negative value in the "Down" column suggests downward momentum.
R%: Displays the relative inner change percentage difference between the bands, offering a measure of the market's volatility or stability within the bands.
Utilizing the Insights
Market Trends: A widening gap between the "Up" and "Down" percentages in the "P%" row might indicate increasing market volatility. Traders can use this information to adjust their risk management strategies accordingly.
Entry and Exit Points: The "R%" row provides insights into the relative position of the current price within the probability bands. Traders might consider positions closer to the lower band as potential entry points and positions near the upper band as exit points or take-profit levels.
Conclusion
The Nadaraya-Watson Probability script offers a sophisticated tool for traders looking to incorporate statistical analysis into their trading strategy. By understanding and utilizing the data presented in the script's table, traders can gain insights into market trends and volatility, aiding in decision-making processes. Remember, no indicator is foolproof; always consider multiple data sources and analyses when making trading decisions.

Uptrick: Volatility Weighted CloudIntroduction
The Volatility Weighted Cloud (VWC) is a trend-tracking overlay that combines adaptive volatility-based bands with a multi-source smoothed price cloud to visualize market bias. It provides users with a dynamic structure that adapts to volatility conditions while maintaining a persistent visual record of trend direction. By incorporating configurable smoothing techniques, percentile-ranked volatility, and multi-line cloud construction, the indicator allows traders to interpret price context more effectively without relying on raw price movement alone.
Overview
The script builds a smoothed price basis using the open, and close prices independently, and uses these to construct a layered visual cloud. This cloud serves both as a reference for price structure and a potential area of dynamic support and resistance. Alongside this cloud, adaptive upper and lower bands are plotted using volatility that scales with percentile rank. When price closes above or below these bands, the script interprets that as a breakout and updates the trend bias accordingly.
Candle coloring is persistent and reflects the most recent confirmed signal. Labels can optionally be placed on the chart when the trend bias flips, giving traders additional visual reference points. The indicator is designed to be both flexible and visually compact, supporting different strategies and timeframes through its detailed configuration options.
Originality
This script introduces originality through its combined use of percentile-ranked volatility, adaptive envelope sizing, and multi-source cloud construction. Unlike static-band indicators, the Volatility Weighted Cloud adjusts its band width based on where current volatility ranks within a defined lookback range. This dynamic scaling allows for smoother signal behavior during low-volatility environments and more responsive behavior during high-volatility phases.
Additionally, instead of using a single basis line, the indicator computes two separate smoothed lines for open and close. These are rendered into a shaded visual cloud that reflects price structure more completely than traditional moving average overlays. The use of ALMA and MAD, both less commonly applied in volatility-band overlays, adds further control over smoothing behavior and volatility measurement, enhancing its adaptability across different market types.
Inputs
Group: Core
Basis Length (short-term): The number of bars used for calculating the primary basis line. Affects how quickly the basis responds to price changes.
Basis Type: Option to choose between EMA and ALMA. EMA provides a standard exponential average; ALMA offers a centered, Gaussian-weighted average with reduced lag.
ALMA Offset: Determines the balance point of the ALMA window. Only applies when ALMA is selected.
Sigma: Sets the width of the ALMA smoothing window, influencing how much smoothing is applied.
Basis Smoothing EMA: Adds additional EMA-based smoothing to the computed basis line for noise reduction.
Group: Volatility & Bands
Volatility: Choose between StDev (standard deviation) and MAD (median absolute deviation) for measuring price volatility.
Vol Length (short-term): Length of the window used for calculating volatility.
Vol Smoothing EMA: Smooths the raw volatility value to stabilize band behavior.
Min Multiplier: Minimum multiplier applied to volatility when forming the adaptive bands.
Max Multiplier: Maximum multiplier applied at high volatility percentile.
Volatility Rank Lookback: Number of bars used to calculate the percentile rank of current volatility.
Show Adaptive Bands: Enables or disables the display of upper and lower volatility bands on the chart.
Group: Trend Switch Labels
Show Trend Switch Labels: Toggles the appearance of labels when the trend direction changes.
Label Anchor: Defines whether the labels are anchored to recent highs/lows or to the main basis line.
ATR Length (offset): Length used for calculating ATR, which determines label offset distance.
ATR Offset (multiplier): Multiplies the ATR value to place labels away from price bars for better visibility.
Label Size: Allows selection of label size (tiny to huge) to suit different chart setups.
Features
Adaptive Volatility Bands: The indicator calculates volatility using either standard deviation or MAD. It then applies an EMA smoothing layer and scales the band width dynamically based on the percentile rank of volatility over a user-defined lookback window. This avoids fixed-width bands and allows the indicator to adapt to changing volatility regimes in real time.
Volatility Method Options: Users can switch between two volatility measurement methods:
➤ Standard Deviation (StDev): Captures overall price dispersion, but may be sensitive to spikes.
➤ Median Absolute Deviation (MAD): A more robust measure that reduces the effect of outliers, making the bands less jumpy during erratic price behavior.
Basis Type Options: The core price basis used for cloud and bands can be built from:
➤ Exponential Moving Average (EMA): Fast-reacting and widely used in trend systems.
➤ Arnaud Legoux Moving Average (ALMA): A smoother, more centered alternative that offers greater control through offset and sigma parameters.
Multi-Line Basis Cloud: The cloud is formed by plotting two individually smoothed basis lines from open and close prices. A filled area is created between the open and close basis lines. This cloud serves as a dynamic support or resistance zone, allowing users to identify possible reversal areas. Price moving through or rejecting from the cloud can be interpreted contextually, especially when combined with band-based signals.
Persistent Trend Bias Coloring: The indicator uses the last confirmed breakout (above upper band or below lower band) to determine bias. This bias is reflected in the color of every subsequent candle, offering a persistent visual cue until a new signal is triggered. It helps simplify trend recognition, especially in choppy or sideways markets.
Trend Switch Labels: When enabled, the script places labeled markers at the exact bar where the bias direction switches. Labels are anchored either to recent highs/lows or to the main basis line, and spaced vertically using an ATR-based offset. This allows the trader to quickly locate historical trend transitions.
Alert Conditions: Two built-in alert conditions are available:
➤ Long Signal: Triggered when the close crosses above the upper adaptive band.
➤ Short Signal: Triggered when the close crosses below the lower adaptive band.
These conditions can be used for custom alerts, automation, or external signaling tools.
Display Control and Flexibility: Users can disable the adaptive bands for a cleaner layout while keeping the basis cloud and candle coloring active. The indicator can be tuned for fast or slow response depending on the strategy in use, and is suitable for intraday, swing, or position trading.
Summary
The Volatility Weighted Cloud is a configurable trend-following overlay that uses adaptive volatility bands and a structured cloud system to help visualize market bias. By combining EMA or ALMA smoothing with percentile-ranked volatility and a four-line price structure, it provides a flexible and informative charting layer. Its key strengths lie in the use of dynamic envelopes, visually persistent trend indication, and clearly defined breakout zones that adapt to current volatility conditions.
Disclaimer
This indicator is for informational and educational purposes only. Trading involves risk and may not be suitable for all investors. Past performance does not guarantee future results.
