VWAP BANDS [qrsq]Description
This indicator is used to find support and resistance utilizing both buying and selling volume. It can be used on lower and higher time frames to understand where price is likely to reject or bounce.
How it works
Instead of calculating the VWAP using the total volume, this script estimates the buying/selling volume and respectively calculates their individual VWAP's. The standard deviations of these are then calculated to create the set of two bands. The top bands being the VWAP from buying volume and bottom bands are from selling volume, with the option to use a double band on either pair.
How to use it
I like to use the bands for LTF scalping as well as HTF swings, I also like to use it alongside my SMA VWAP BANDS.
For scalping:
I tend to use either the 5m or 15m TF
I then set the indicator's TF to 1m
I will take a scalp based on the bands confluence with other PA methods, if price is being either supported or rejected.
For swings:
I tend to use a variety of TFs, including: 30m, 1H, 4H, D
I then set the indicator's TF to "Chart"
I will take a swing based on the bands confluence with other PA methods, if price is being either supported or rejected.
I also tend to use them on perpetual contracts as the volume seems to be more consistent and hence results in more accurate support and resistance.
ابحث في النصوص البرمجية عن "bands"

Dynamic Trend Bands (DTB)Description:
Dynamic Trend Bands (DTB) is a volatility-based range filter combined with multiple trend confirmation tools to detect and visualize market direction and possible reversals.
Features:
Range Filter: Identifies potential highs/lows and filters out market noise.
Trend Strength: Integrated ADX to validate trend momentum.
VIDYA Bands + ATR: Detects breakout conditions using variable adaptive moving averages and volatility bands.
EMA 200 Filter: Determines long-term trend direction.
Auto Buy/Sell Labels: Generates clear entry and exit signals.
Alerts: Ready-to-use alert conditions for automated notifications.
Recommended Use:
Timeframe: 4H (works on other timeframes as well)
Markets: BTC, ETH, major altcoins, and traditional assets.
Advantages:
Combines short-term and long-term trend detection.
Filters out false signals in choppy markets.
Visual and alert-based trade setups for easier execution.
//@version=6
// ─────────────────────────────────────────────────────────────────────────────
// Title: Dynamic Trend Bands (DTB) + Auto Buy/Sell + EMA 200 + ADX + VIDYA
//
// Description:
// Dynamic Trend Bands (DTB) is a volatility-based range filter combined with
// multiple trend confirmation tools to detect and visualize market direction
// and possible reversals.
//
// Features:
// - Range Filter: Identifies potential highs/lows and filters out market noise.
// - Trend Strength: Integrated ADX to validate trend momentum.
// - VIDYA Bands + ATR: Detects breakout conditions using variable adaptive moving averages and volatility bands.
// - EMA 200 Filter: Determines long-term trend direction.
// - Auto Buy/Sell Labels: Generates clear entry and exit signals.
// - Alerts: Ready-to-use alert conditions for automated notifications.
//
// Recommended Use:
// - Timeframe: 4H (works on other timeframes as well)
// - Markets: BTC, ETH, major altcoins, and traditional assets.
//
// Advantages:
// - Combines short-term and long-term trend detection.
// - Filters out false signals in choppy markets.
// - Visual and alert-based trade setups for easier execution.
// ───────────────────────────────────────────

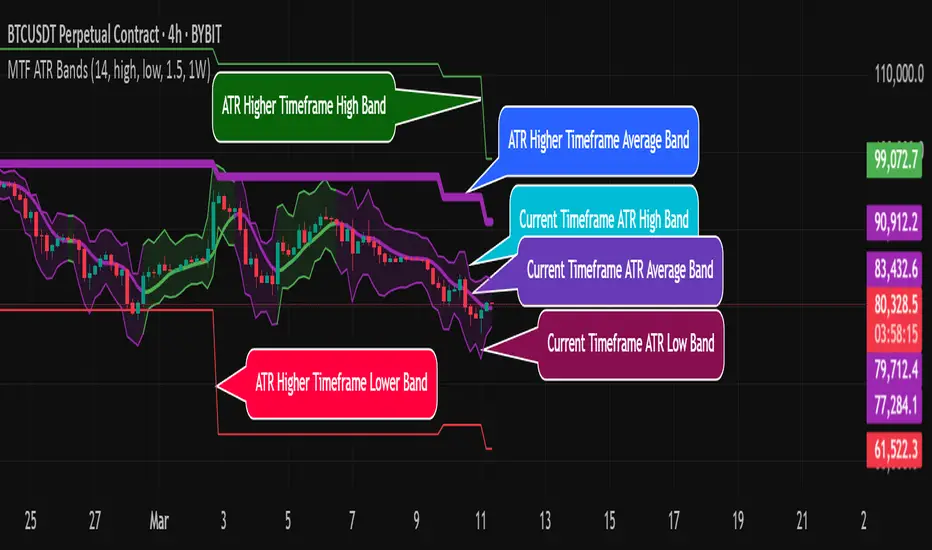
MTF ATR BandsA simple but effective MTF ATR bands indicator.
The script calculate and display ATR bands low and high of the current timeframe using high, low inputs and an RMA moving average, adding to it ATR of the period multiplied with the user multiplier, default is set to 1.5.
Than is calculated a smoothed average of the range and the color of it based on its slope, same color is used to fill the atr bands.
Than the higher timeframe bands are calculated and displayed on the chart.
How can be used ?
The higher timeframe average and bands can give you long term direction of the trend and the current timeframes moving average and filling short term trend, for example using the 15 min chart with a 4h HTF bands, or an 1h with a daily, or a daily with an weekly or weekly with bi-monthly atr bands.
Also can be used as a stop loss indicator.
Hope you will like it, any question send me a PM.
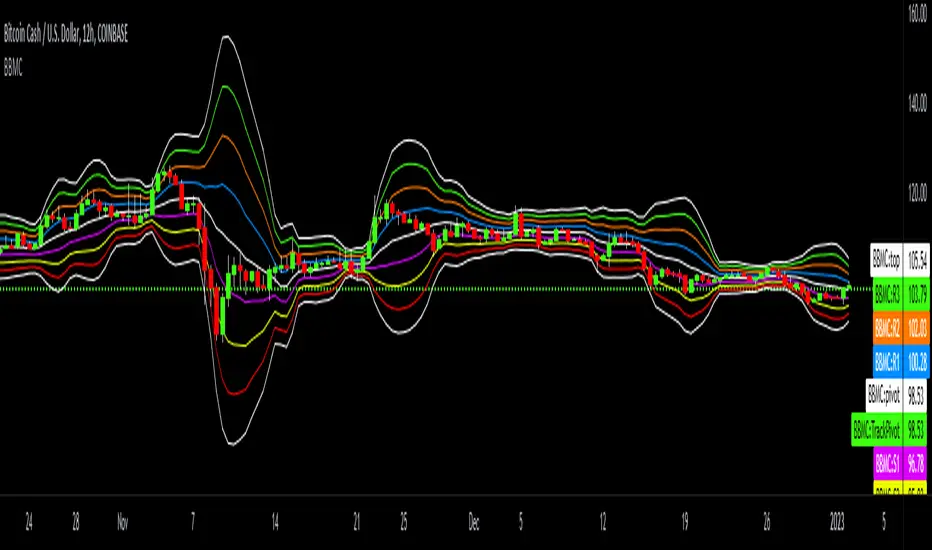
Bollinger-Bands.Multi_Choice(BBMC) "Bollinger-Bands.Multi_Choice" indicator gives the end user a choice of which Moving Average they want to use.
The MA choices available are:
SMA = simple moving average
EMA = exponentially weighted moving average
RMA = moving average used in RSI
WMA = weighted moving average
VWMA = volume weighted moving average
VWAP = volume weighted average price
HMA = Hull moving average
SWMA = symmetrically weighted moving average
ALMA = Arnaud Legoux moving average
The default setting inputs are:
source = OHLC4
length = 13
ALMA offset = 0.89
ALMA sigma = 5
Moving average type = VWMA
Level 1 standard deviation = 1.0
Level 2 standard deviation = 2.0
Level 3 standard deviation = 3.0
Level 3 standard deviation = 4.0
The default setting colors are:
Top = white
R3 = green
R2 = orange
R1 = blue
pivot = white
(track pivot line = bullish is green, bearish is red)
S1 = purple
S2 = yellow
S3 = red
Bottom = white
I made this indicator from an idea I had for a few months with the help of pine coder scripts before me. Kudos to @TradingView & @Madrid.
* This script uses altered pieces of code from @TradingView "Intrabar Efficiency Ratio indicator" & @Madrid "Bollinger Bands indicator" *
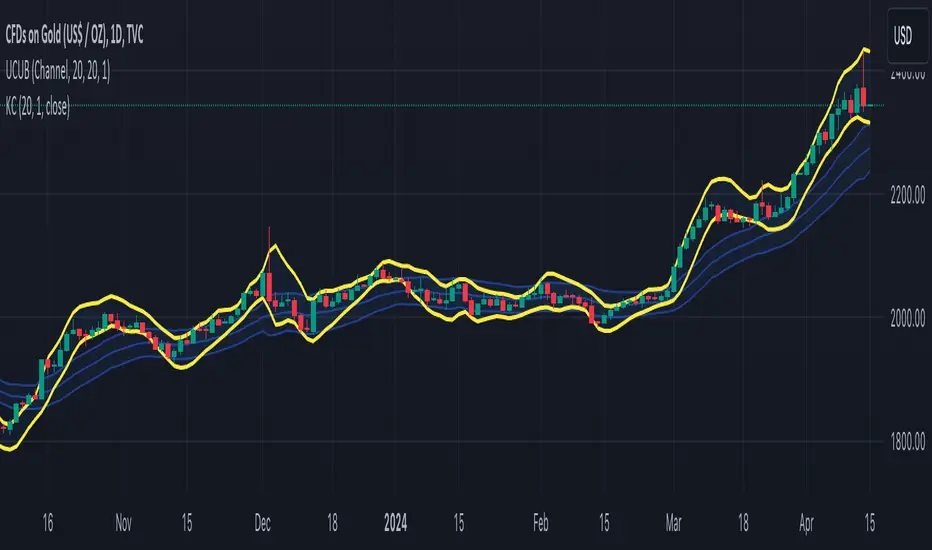
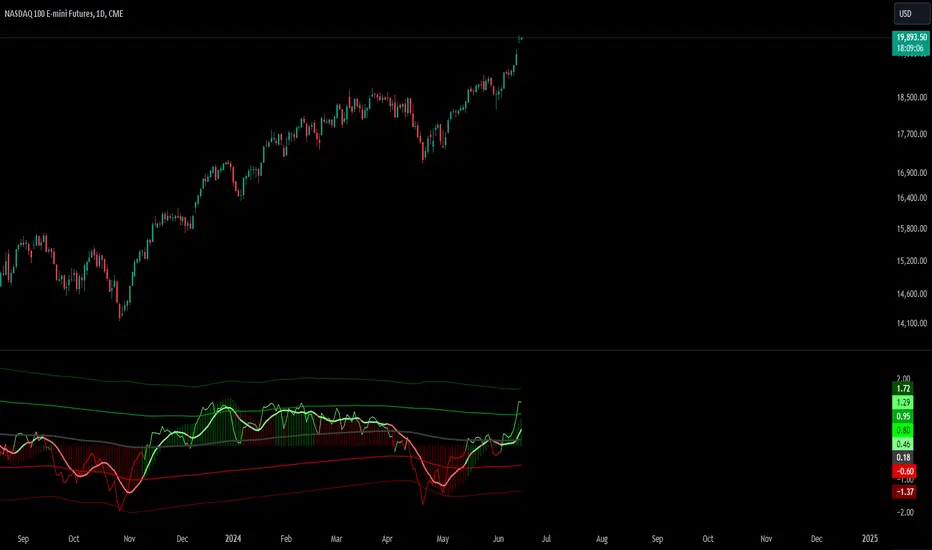
Absolute Move BandsOverview:
The Absolute Move Bands indicator calculates the absolute value of the expected return, also known as "momentum" by some traders, and then displays it with standard deviation bands. The indicator also shows a moving average and a Kalman filter of the absolute move. If you take the expected return, you get what many traders commonly call "momentum." Now, if you turn the negative values into positive values by getting the magnitude of the expected return, it shows the "strength or intensity of the expected return." A low value of the absolute value of the expected return shows that the expected return is close to 0, which means that there is no significant trending behavior. The higher the value, the higher the deviation is from the mean, indicating stronger trend moves in the expected return itself. This indicator then gets the standard score of the absolute value of the expected return and then gets the moving average and Kalman Filter.
This indicator is not a directional indicator, but it can help you time moves and determine the "strength" of the expected returns (also known as momentum).
Interpreting the Magnitude:
Low Values: A low absolute value of the expected return indicates that the expected return is close to 0, suggesting no significant trending behavior in the market.
High Values: A high absolute value indicates a strong deviation from the mean, reflecting stronger trend moves in the expected return itself.
Standard Score Calculation:
This indicator computes the standard score (z-score) of the absolute value of the expected return. The value shows how many standard deviations the absolute return is from the mean. This helps in identifying periods of extreme magnitude.
Moving Average and Kalman Filter:
Moving Average: The indicator calculates the moving average of the standard score to smooth out the short-term fluctuations and show the longer-term trends in the absolute returns.
Kalman Filter: Applied to further reduce noise and provide a clearer signal, it enhances the indicator's effectiveness in determining the strength of the expected returns.
Standard Deviation Bands
Purpose: The standard deviation bands help determine if the standard score is at an extreme low or high.
High Standard Score (+2 Standard Deviation Band): Indicates that the absolute value of the expected return is at a high level, suggesting a strong trend. This could mean that the trend is at its peak and might be nearing completion.
Low Standard Score (-2 Standard Deviation Band): Indicates that the absolute value of the expected return is at a low level, suggesting minimal or no trending behavior. This could imply that the expected return is around 0, and a new trend (in any direction) may start soon.
How to interpret and use this indicator
Two ways will be discussed on how you can use this indicator. First of all lets go back over the interpretation of the standard score and bands.
High Standard Score: Indicates that the absolute value is significantly higher than usual, which suggest a strong trend which may be nearing its peak. Some traders who entered a trade at a low standard score value might want to consider taking profits or preparing for a potential reversal.
Low Standard Score: Indicates that the absolute value is significantly low, close to 0, which suggest minimal trending behavior and a new trend or move may soon start.
This indicator shouldn't be used alone; you may need an indicator that shows you the trend with an expected return indicator or a "momentum" indicator, because all this shows you is the strength of the trend or "momentum." So let's say that if you see that the standard score is low and the Kalman filter is increasing, then this shows that a trend may start soon, so you can use the "momentum" indicator and enter with whatever the trend is on.
Another way to use the indicator is to trade extreme occurrences. If on an indicator that shows the expected returns, or "momentum," and its at an extreme standard deviation occurrence level like -2 standard deviation from the mean, and the standard score is at 2 standard deviation (the top band), and the Kalman filter starts decreasing, then the downtrend may be over and you could place a long.
TrueLevel BandsTrueLevel Bands is a powerful trading indicator that employs linear regression and standard deviation to create dynamic, envelope-style bands around the price action of a financial instrument. These bands are designed to help traders identify potential support and resistance levels, trend direction, and volatility.
The TrueLevel Bands indicator consists of multiple envelope bands, each constructed using different timeframes or lengths, and a multiple (mult) factor. The multiple factor determines the width of the bands by adjusting the number of standard deviations from the linear regression line.
Key Features of TrueLevel Bands
1. Multi-Timeframe Analysis: Unlike traditional moving average-based indicators, TrueLevel Bands allow traders to incorporate multiple timeframes into their analysis. This helps traders capture both short-term and long-term market dynamics, offering a more comprehensive understanding of price behavior.
2. Customization: The TrueLevel Bands indicator offers a high level of customization, allowing traders to adjust the lengths and multiple factors to suit their trading style and preferences. This flexibility enables traders to fine-tune the indicator to work optimally with various instruments and market conditions.
3. Adaptive Volatility: By incorporating standard deviation, TrueLevel Bands can automatically adjust to changing market volatility. This feature enables the bands to expand during periods of high volatility and contract during periods of low volatility, providing traders with a more accurate representation of market dynamics.
4. Dynamic Support and Resistance Levels: TrueLevel Bands can help traders identify dynamic support and resistance levels, as the bands adjust in real-time according to price action. This can be particularly useful for traders looking to enter or exit positions based on support and resistance levels.
5. The "Global Trend Line" refers to the average of the bands used to indicate the overall trend.
Why TrueLevel Bands are Different from Classic Moving Averages
TrueLevel Bands differ from conventional moving averages in several ways:
1. Linear Regression: While moving averages are based on simple arithmetic means, TrueLevel Bands use linear regression to determine the centerline. This offers a more accurate representation of the trend and helps traders better assess potential entry and exit points.
2. Envelope Style Bands: Unlike moving averages, which are single lines, TrueLevel Bands form envelope-style bands around the price action. This provides traders with a visual representation of potential support and resistance levels, trend direction, and volatility.
3. Multi-Timeframe Analysis: Classic moving averages typically focus on a single timeframe. In contrast, TrueLevel Bands incorporate multiple timeframes, enabling traders to capture a broader understanding of market dynamics.
4. Adaptive Volatility: Traditional moving averages do not account for changing market volatility, whereas TrueLevel Bands automatically adjust to volatility shifts through the use of standard deviation.
The TrueLevel Bands indicator is a powerful, versatile tool that offers traders a unique approach to technical analysis. With its ability to adapt to changing market conditions, provide multi-timeframe analysis, and dynamic support and resistance levels, TrueLevel Bands can serve as an invaluable asset to both novice and experienced traders looking to gain an edge in the markets.

TrueLevel BandsWhat are TrueLevel Bands ?
TrueLevel Bands is a powerful trading indicator that employs linear regression and standard deviation to create dynamic, envelope-style bands around the price action of a financial instrument. These bands are designed to help traders identify potential support and resistance levels, trend direction, and volatility.
The TrueLevel Bands indicator consists of multiple envelope bands, each constructed using different timeframes or lengths, and a multiple (mult) factor. The multiple factor determines the width of the bands by adjusting the number of standard deviations from the linear regression line.
Key Features of TrueLevel Bands
1. Multi-Timeframe Analysis: Unlike traditional moving average-based indicators, TrueLevel Bands allow traders to incorporate multiple timeframes into their analysis. This helps traders capture both short-term and long-term market dynamics, offering a more comprehensive understanding of price behavior.
2. Customization: The TrueLevel Bands indicator offers a high level of customization, allowing traders to adjust the lengths and multiple factors to suit their trading style and preferences. This flexibility enables traders to fine-tune the indicator to work optimally with various instruments and market conditions.
3. Adaptive Volatility: By incorporating standard deviation, TrueLevel Bands can automatically adjust to changing market volatility. This feature enables the bands to expand during periods of high volatility and contract during periods of low volatility, providing traders with a more accurate representation of market dynamics.
4. Dynamic Support and Resistance Levels: TrueLevel Bands can help traders identify dynamic support and resistance levels, as the bands adjust in real-time according to price action. This can be particularly useful for traders looking to enter or exit positions based on support and resistance levels.
Why TrueLevel Bands are Different from Classic Moving Averages
TrueLevel Bands differ from conventional moving averages in several ways:
1. Linear Regression: While moving averages are based on simple arithmetic means, TrueLevel Bands use linear regression to determine the centerline. This offers a more accurate representation of the trend and helps traders better assess potential entry and exit points.
2. Envelope Style Bands: Unlike moving averages, which are single lines, TrueLevel Bands form envelope-style bands around the price action. This provides traders with a visual representation of potential support and resistance levels, trend direction, and volatility.
3. Multi-Timeframe Analysis: Classic moving averages typically focus on a single timeframe. In contrast, TrueLevel Bands incorporate multiple timeframes, enabling traders to capture a broader understanding of market dynamics.
4. Adaptive Volatility: Traditional moving averages do not account for changing market volatility, whereas TrueLevel Bands automatically adjust to volatility shifts through the use of standard deviation.
The TrueLevel Bands indicator is a powerful, versatile tool that offers traders a unique approach to technical analysis. With its ability to adapt to changing market conditions, provide multi-timeframe analysis, and dynamic support and resistance levels, TrueLevel Bands can serve as an invaluable asset to both novice and experienced traders looking to gain an edge in the markets.

LA - MACD EMA BandsOverview of the "LA - MACD EMA Bands" Indicator
For Better view, use this indicator along with "LA - EMA Bands with MTF Dashboard"
The "LA - MACD EMA Bands" is a custom technical indicator written in Pine Script v6 for TradingView. It builds on the traditional Moving Average Convergence Divergence (MACD) oscillator by incorporating additional smoothing via Exponential Moving Averages (EMAs) and Bollinger Bands (BB) applied directly to the MACD line. This creates a multi-layered momentum and volatility tool displayed in a separate pane below the price chart (not overlaid on the price itself).
The indicator allows for customization, such as selecting a different timeframe (for multi-timeframe analysis) and adjusting period lengths. It fetches data from the specified timeframe using request.security with lookahead enabled to avoid repainting issues. The core idea is to provide insights into momentum trends, crossovers, and volatility expansions/contractions in the MACD's behavior, making it suitable for identifying potential trend reversals, continuations, or ranging markets.
Unlike a standard MACD, which focuses primarily on momentum via a single line, signal line, and histogram, this version emphasizes longer-term smoothing and volatility boundaries. It uses visual fills between lines to highlight bullish/bearish conditions, aiding quick interpretation. Below, I'll break down each component, its calculation, visual representation, and practical uses.
Detailed Breakdown of Each Component and Its Uses
MACD Line (Blue Line, Labeled 'MACD Line')
Calculation: This is the core MACD value, computed as the difference between a fast EMA (default length 12) and a slow EMA (default length 144) of the input source (default: close price). The EMAs are calculated on data from the selected timeframe.
Visuals: Plotted as a solid blue line.
Uses:
Measures momentum: When above zero, it indicates bullish momentum (prices rising faster in the short term); below zero, bearish momentum.
Trend identification: Rising MACD suggests strengthening uptrends; falling suggests downtrends.
Divergence spotting: Compare with price action—e.g., if price makes higher highs but MACD makes lower highs, it signals potential bearish reversal (and vice versa for bullish divergence).
In trading: Often used for entry/exit signals when crossing the zero line or other lines in the indicator.
MACD EMA (Red Line, Labeled 'MACD EMA')
Calculation: A 12-period EMA applied to the MACD Line itself.
Visuals: Plotted as a solid red line.
Uses:
Acts as a signal line for the MACD, smoothing out short-term noise.
Crossover signals: When the MACD Line crosses above the MACD EMA, it can signal a bullish buy opportunity; crossing below suggests a bearish sell.
Trend confirmation: Helps filter false signals in choppy markets by requiring confirmation from this slower-moving average.
In trading: Useful for momentum-based strategies, like entering trades on crossovers in alignment with the overall trend.
Fill Between MACD Line and MACD EMA (Green/Red Shaded Area, Titled 'MACD Fill')
Calculation: The area between the MACD Line and MACD EMA is filled with color based on their relative positions.
Color Logic: Green (with 57% transparency) if MACD Line > MACD EMA (bullish); red if MACD Line < MACD EMA (bearish).
Visuals: Semi-transparent fill for easy visibility without overwhelming the lines.
Uses:
Quick visual cue for momentum shifts: Green areas highlight bullish phases; red for bearish.
Enhances readability: Makes crossovers more apparent at a glance, especially in fast-moving markets.
In trading: Can be used to time entries/exits or as a filter (e.g., only take long trades in green zones).
Bollinger Bands on MACD (BB Upper: Black Dotted, BB Basis: Maroon Dotted, BB Lower: Black Dotted)
Calculation: Bollinger Bands applied to the MACD Line.
BB Basis: 144-period EMA of the MACD Line.
BB Standard Deviation: 144-period stdev of the MACD Line.
BB Upper: BB Basis + (2.0 * BB Stdev)
BB Lower: BB Basis - (2.0 * BB Stdev)
Visuals: Upper and lower bands as black dotted lines; basis as maroon dotted
Uses:
Volatility measurement: Bands expand during high momentum volatility (strong trends) and contract during low volatility (ranging or consolidation).
Mean reversion: When MACD Line touches or exceeds the upper band, it may signal overbought conditions (potential sell); lower band for oversold (potential buy).
Squeeze detection: Narrow bands (squeeze) often precede big moves—watch for breakouts.
In trading: Combines momentum with volatility; e.g., a MACD Line breakout above the upper band could confirm a strong uptrend.
BB Basis EMA (Green Line, Labeled 'BB Basis EMA')
Calculation: A 72-period EMA applied to the BB Basis (which is already a 144-period EMA of the MACD Line).
Visuals: Solid green line.
Uses:
Further smoothing: Provides a longer-term view of the MACD's average behavior, reducing noise from the BB Basis.
Trend direction: Acts as a baseline for the BB system—above it suggests bullish bias in momentum volatility; below, bearish.
Crossover with BB Basis: Can signal shifts in volatility trends (e.g., BB Basis crossing above BB Basis EMA indicates increasing bullish volatility).
In trading: Useful for confirming longer-term trends or as a filter for BB-based signals.
Fill Between BB Basis and BB Basis EMA (Gray Shaded Area, Titled 'BB Basis Fill')
Calculation: The area between BB Basis and BB Basis EMA is filled.
Color Logic: Currently set to a constant semi-transparent gray regardless of position.
Visuals: Semi-transparent gray fill.
Uses:
Highlights divergence: Shows when the shorter-term BB Basis deviates from its longer-term EMA, indicating potential volatility shifts.
Visual aid for crossovers: Makes it easier to spot when BB Basis crosses its EMA.
In trading: Could be used to identify overextensions in volatility (e.g., wide gray areas might signal impending mean reversion).
Zero Line (Black Horizontal Line)
Calculation: A simple horizontal line at y=0.
Visuals: Solid black line.
Uses:
Reference point: Divides bullish (above) from bearish (below) territory for all MACD-related lines.
In trading: Crossovers of the zero line by the MACD Line or BB Basis can signal major trend changes.
How It Differs from a Normal MACD
A standard MACD (e.g., the built-in TradingView MACD with defaults 12/26/9) consists of:
MACD Line: EMA(12) - EMA(26).
Signal Line: EMA(MACD Line, 9).
Histogram: MACD Line - Signal Line (bars showing convergence/divergence).
Key differences in "LA - MACD EMA Bands":
Periods: Uses a much longer slow EMA (144 vs. 26), making it more sensitive to long-term trends but less reactive to short-term price action. The MACD EMA is 12 periods (vs. 9), further emphasizing smoothing.
No Histogram: Replaces the histogram with fills and bands for visual emphasis on crossovers and volatility.
Added Bollinger Bands: Applies BB directly to the MACD Line (with a long 144-period basis), introducing volatility analysis absent in standard MACD. This helps detect "squeezes" or expansions in momentum.
Additional EMA Layer: The BB Basis EMA (72-period) adds a secondary smoothing level to the BB system, providing a hierarchical view of momentum (short-term MACD → mid-term BB → long-term EMA).
Multi-Timeframe Support: Built-in option for higher timeframes, unlike basic MACD.
Focus: Standard MACD is purely momentum-focused; this version integrates volatility (via BB) and multi-layer smoothing, making it better for trend-following in volatile markets but potentially overwhelming for beginners.
Overall, this indicator transforms the MACD from a simple oscillator into a comprehensive momentum-volatility hybrid, reducing false signals in trending markets but introducing lag.
Overall Pros and Cons
Pros:
Enhanced Visualization: Fills and bands make trends, crossovers, and volatility easier to spot without needing multiple indicators.
Reduced Noise: Longer periods (144, 72) smooth out whipsaws, ideal for swing or position trading in trending assets like stocks or forex.
Volatility Integration: BB adds a dimension not in standard MACD, helping identify breakouts or consolidations.
Customizable: Inputs for timeframes and lengths allow adaptation to different assets/timeframes.
Multi-Layered Insights: Combines short-term signals (MACD crossovers) with long-term confirmation (BB EMA), improving signal reliability.
Cons:
Lagging Nature: Long periods (e.g., 144) delay signals, missing early entries in fast markets or leading to late exits.
Complexity: Multiple lines and fills can clutter the pane, requiring experience to interpret; beginners might misread it.
Potential Overfitting: Custom periods (12/144/12/144/72) may work well on historical data but underperform in live trading without backtesting.
No Built-in Alerts/Signals: Relies on visual interpretation; users must manually set alerts for crossovers.
Resource Intensive: On lower timeframes or with lookahead, it might slow chart loading on Trading View.
This indicator shines in strategies combining momentum and volatility, like trend-following with BB squeezes, but test it on your assets (e.g., via backtesting) to ensure it fits your style.
For Better view, use this indicator along with "LA - EMA Bands with MTF Dashboard"

Waldo Cloud Bollinger Bands
Waldo Cloud Bollinger Bands Indicator Description for TradingView
Title: Waldo Cloud Bollinger Bands
Short Title: Waldo Cloud BB
Overview:
The Waldo Cloud Bollinger Bands indicator is a sophisticated tool designed for traders looking to combine the volatility analysis of Bollinger Bands with the momentum insights of the Relative Strength Index (RSI) and moving average crossovers. This indicator overlays on your chart, providing a visual representation that helps in identifying potential trading opportunities based on price action, momentum, and trend direction.
Concept:
This indicator merges three key technical analysis concepts:
Bollinger Bands: These are used to measure market volatility. The bands consist of a central moving average (basis) with an upper and lower band that are standard deviations away from this average. In this indicator, you can customize the type of moving average used for the basis (SMA, EMA, SMMA, WMA, VWMA), the length of the period, the source price, and the standard deviation multiplier, offering flexibility to adapt to different market conditions.
Relative Strength Index (RSI): The RSI is incorporated to provide insight into the momentum of price movements. Users can adjust the RSI length and overbought/oversold levels and even choose the price source for RSI calculation, allowing for tailored momentum analysis. The RSI values influence the cloud color between the Bollinger Bands, signaling market conditions.
Moving Average Crossovers: Two moving averages with customizable lengths and types are used to identify trend direction through crossovers. A fast MA (default 20 periods) and a slow MA (default 50 periods) are plotted when enabled, helping to signal potential bullish or bearish market conditions when they cross over each other.
Functionality:
Bollinger Bands Calculation: The basis of the Bollinger Bands is calculated using a user-defined moving average type, with a customizable length, source, and standard deviation multiplier. The upper and lower bands are then plotted around this basis.
RSI Calculation: The RSI is computed using a user-specified source, length, and overbought/oversold levels. This RSI value is used to determine the color of the cloud between the Bollinger Bands, which visually represents market sentiment:
Purple when RSI is overbought.
Blue when RSI is oversold.
Green for bullish conditions (when the fast MA crosses above the slow MA, RSI is bullish, and the price is above the slow MA).
Red for bearish conditions (when the fast MA crosses below the slow MA, RSI is bearish, and the price is below the slow MA).
Gray for neutral conditions.
Trend Analysis: The indicator uses two moving averages to help determine the trend direction.
When the fast MA crosses over the slow MA, it suggests a potential change in trend direction, which, combined with RSI conditions, provides a more comprehensive trading signal.
Customization:
Users can select the type of moving average for all calculations through the "Global MA Type" setting, ensuring consistency in how trends and volatility are interpreted.
The Bollinger Bands settings allow for adjustments in length, source, standard deviation, and offset, giving traders control over how volatility is measured.
RSI settings include the ability to change the RSI source, length, and overbought/oversold thresholds, which can be fine-tuned to match trading strategies.
The option to show or hide moving averages provides clarity on the chart, focusing on either the Bollinger Bands or including the MA crossovers for trend analysis.
Usage:
This indicator is ideal for traders who incorporate both volatility and momentum in their trading decisions.
By observing the color changes in the cloud, along with the position of the price relative to the moving averages, traders can gauge potential entry and exit points.
For instance, a green cloud with a price above the slow MA might suggest a strong buying opportunity, while a red cloud with a price below might indicate selling pressure.
Conclusion:
The Waldo Cloud Bollinger Bands indicator offers a unique blend of volatility, momentum, and trend analysis, providing traders with a multi-faceted view of market conditions. Its customization options make it adaptable to various trading styles and market environments, making it a valuable addition to any trader's toolkit on Trading View.

Full Day Midpoint Line with Dynamic StdDev Bands (ETH & RTH)A Pine Script indicator designed to plot a midpoint line based on the high and low prices of a user-defined trading session (typically Extended Trading Hours, ETH) and to add dynamic standard deviation (StdDev) bands around this midpoint.
Session Midpoint Line:
The midpoint is calculated as the average of the session's highest high and lowest low during the defined ETH period (e.g., 4:00 AM to 8:00 PM).
This line represents a central tendency or "fair value" for the session, similar to a pivot point or volume-weighted average price (VWAP) anchor.
Interpretation:
Prices above the midpoint suggest bullish sentiment, while prices below indicate bearish sentiment.
The midpoint can act as a dynamic support/resistance level, where price may revert to or react at this level during the session.
Dynamic StdDev Bands:
The bands are calculated by adding/subtracting a multiple of the standard deviation of the midpoint values (tracked in an array) from the midpoint.
The standard deviation is dynamically computed based on the historical midpoint values within the session, making the bands adaptive to volatility.
Interpretation:
The upper and lower bands represent potential overbought (upper) and oversold (lower) zones.
Prices approaching or crossing the bands may indicate stretched conditions, potentially signaling reversals or breakouts.
Trend Identification:
Use the midpoint as a reference for the session’s trend. Persistent price action above the midpoint suggests bullishness, while below indicates bearishness.
Combine with other indicators (e.g., moving averages, RSI) to confirm trend direction.
Support/Resistance Trading:
Treat the midpoint as a dynamic pivot point. Price rejections or consolidations near the midpoint can be entry points for mean-reversion trades.
The StdDev bands can act as secondary support/resistance levels. For example, price reaching the upper band may signal a potential short entry if accompanied by reversal signals.
Breakout/Breakdown Strategies:
A strong move beyond the upper or lower band may indicate a breakout (bullish above upper, bearish below lower). Confirm with volume or momentum indicators to avoid false breakouts.
The dynamic nature of the bands makes them useful for identifying significant price extensions.
Volatility Assessment:
Wider bands indicate higher volatility, suggesting larger price swings and potentially riskier trades.
Narrow bands suggest consolidation, which may precede a breakout. Traders can prepare for volatility expansions in such scenarios.
The "Full Day Midpoint Line with Dynamic StdDev Bands" is a versatile and visually intuitive indicator well-suited for day traders focusing on session-specific price action. Its dynamic midpoint and volatility-adjusted bands provide valuable insights into support, resistance, and potential reversals or breakouts.

Bollinger Bands + RSI [Uncle Sam Trading]The Bollinger Bands + RSI indicator combines two popular technical analysis tools, Bollinger Bands (BB) and the Relative Strength Index (RSI), into a unified framework designed to assess both market volatility and momentum. This indicator provides both visual signals on the chart, and allows you to set alerts. It is intended to help traders identify potential overbought/oversold conditions, trend reversals, and to refine trade entry and exit points.
Key Features:
Bollinger Bands: The indicator plots Bollinger Bands, which consist of a basis line (typically a 20-period Simple Moving Average), an upper band (basis + 2 standard deviations), and a lower band (basis - 2 standard deviations). The bands dynamically adjust to market volatility, widening during periods of increased volatility and contracting during periods of decreased volatility.
Relative Strength Index (RSI): The RSI, a momentum oscillator, is plotted in a separate pane below the price chart. It measures the magnitude of recent price changes to evaluate overbought or oversold conditions in the price of a stock or other asset. Traditional interpretation uses 70 and 30 as overbought and oversold levels, respectively.
Overbought/Oversold Zones Highlighting: This indicator uniquely highlights overbought and oversold zones directly on the price chart based on the RSI values. When the RSI is above the overbought level (default 70), a red-shaded area is displayed. When the RSI is below the oversold level (default 30), a green-shaded area is displayed. These visual cues enhance the identification of potential trend reversals.
Buy and Sell Signals: The indicator generates buy signals when the price crosses above the lower Bollinger Band and the RSI is below the oversold level (if the RSI filter is enabled). Sell signals are generated when the price crosses below the upper Bollinger Band and the RSI is above the overbought level (if the RSI filter is enabled). These signals are plotted as green upward-pointing triangles (buy) and red downward-pointing triangles (sell) on the chart.
Customizable Parameters: Users can adjust various settings, including:
Bollinger Bands Length: The number of periods used to calculate the moving average and standard deviation.
Bollinger Bands Standard Deviation: The multiplier used to determine the distance of the upper and lower bands from the basis.
RSI Length: The number of periods used to calculate the RSI.
RSI Overbought/Oversold Levels: The threshold values that define overbought and oversold conditions for the RSI.
Use RSI Filter for Signals: Enable/disable the RSI filter for buy and sell signals.
Colors: The colors of the Bollinger Bands, RSI, overbought/oversold levels, and zone highlights can be customized to suit user preferences.
Alerts: The indicator supports customizable alerts for various conditions, including:
Buy Signal: Triggered when a buy signal is generated.
Sell Signal: Triggered when a sell signal is generated.
Price Crossed Upper BB: Triggered when the price crosses above the upper Bollinger Band.
Price Crossed Lower BB: Triggered when the price crosses below the lower Bollinger Band.
RSI Overbought: Triggered when the RSI crosses above the overbought level.
RSI Oversold: Triggered when the RSI crosses below the oversold level.
How to Use:
The Bollinger Bands + RSI indicator can be used in various ways, including:
Identifying Potential Trend Reversals: Price crosses above the lower band coupled with an oversold RSI (and highlighted zone) may signal a bullish reversal. Conversely, a price cross below the upper band with an overbought RSI (and highlighted zone) may indicate a bearish reversal.
Confirming Trend Strength: In an uptrend, the price may "ride" the upper band, while in a downtrend, it may "ride" the lower band.
Exit Signals: Crossing the opposite band while in a trade, particularly with confirming RSI signals, is often used to identify potential exit points.
Combined with Other Analysis: This indicator works well in conjunction with other technical analysis tools, such as trend lines, support/resistance levels, chart patterns, and moving average-based strategies.
Disclaimer:
This indicator is for educational and informational purposes only and should not be considered as financial advice. Trading involves risk, and past performance is not indicative of future results. Always conduct thorough research and consider your risk tolerance before making any trading decisions.

GKD-C RSX VDI w/ Confidence Bands [Loxx]Giga Kaleidoscope GKD-C RSX VDI w/ Confidence Bands is a Confirmation module included in Loxx's "Giga Kaleidoscope Modularized Trading System".
█ Giga Kaleidoscope Modularized Trading System
What is Loxx's "Giga Kaleidoscope Modularized Trading System"?
The Giga Kaleidoscope Modularized Trading System is a trading system built on the philosophy of the NNFX (No Nonsense Forex) algorithmic trading.
What is the NNFX algorithmic trading strategy?
The NNFX (No-Nonsense Forex) trading system is a comprehensive approach to Forex trading that is designed to simplify the process and remove the confusion and complexity that often surrounds trading. The system was developed by a Forex trader who goes by the pseudonym "VP" and has gained a significant following in the Forex community.
The NNFX trading system is based on a set of rules and guidelines that help traders make objective and informed decisions. These rules cover all aspects of trading, including market analysis, trade entry, stop loss placement, and trade management.
Here are the main components of the NNFX trading system:
1. Trading Philosophy: The NNFX trading system is based on the idea that successful trading requires a comprehensive understanding of the market, objective analysis, and strict risk management. The system aims to remove subjective elements from trading and focuses on objective rules and guidelines.
2. Technical Analysis: The NNFX trading system relies heavily on technical analysis and uses a range of indicators to identify high-probability trading opportunities. The system uses a combination of trend-following and mean-reverting strategies to identify trades.
3. Market Structure: The NNFX trading system emphasizes the importance of understanding the market structure, including price action, support and resistance levels, and market cycles. The system uses a range of tools to identify the market structure, including trend lines, channels, and moving averages.
4. Trade Entry: The NNFX trading system has strict rules for trade entry. The system uses a combination of technical indicators to identify high-probability trades, and traders must meet specific criteria to enter a trade.
5. Stop Loss Placement: The NNFX trading system places a significant emphasis on risk management and requires traders to place a stop loss order on every trade. The system uses a combination of technical analysis and market structure to determine the appropriate stop loss level.
6. Trade Management: The NNFX trading system has specific rules for managing open trades. The system aims to minimize risk and maximize profit by using a combination of trailing stops, take profit levels, and position sizing.
Overall, the NNFX trading system is designed to be a straightforward and easy-to-follow approach to Forex trading that can be applied by traders of all skill levels.
Core components of an NNFX algorithmic trading strategy
The NNFX algorithm is built on the principles of trend, momentum, and volatility. There are six core components in the NNFX trading algorithm:
1. Volatility - price volatility; e.g., Average True Range, True Range Double, Close-to-Close, etc.
2. Baseline - a moving average to identify price trend
3. Confirmation 1 - a technical indicator used to identify trends
4. Confirmation 2 - a technical indicator used to identify trends
5. Continuation - a technical indicator used to identify trends
6. Volatility/Volume - a technical indicator used to identify volatility/volume breakouts/breakdown
7. Exit - a technical indicator used to determine when a trend is exhausted
What is Volatility in the NNFX trading system?
In the NNFX (No Nonsense Forex) trading system, ATR (Average True Range) is typically used to measure the volatility of an asset. It is used as a part of the system to help determine the appropriate stop loss and take profit levels for a trade. ATR is calculated by taking the average of the true range values over a specified period.
True range is calculated as the maximum of the following values:
-Current high minus the current low
-Absolute value of the current high minus the previous close
-Absolute value of the current low minus the previous close
ATR is a dynamic indicator that changes with changes in volatility. As volatility increases, the value of ATR increases, and as volatility decreases, the value of ATR decreases. By using ATR in NNFX system, traders can adjust their stop loss and take profit levels according to the volatility of the asset being traded. This helps to ensure that the trade is given enough room to move, while also minimizing potential losses.
Other types of volatility include True Range Double (TRD), Close-to-Close, and Garman-Klass
What is a Baseline indicator?
The baseline is essentially a moving average, and is used to determine the overall direction of the market.
The baseline in the NNFX system is used to filter out trades that are not in line with the long-term trend of the market. The baseline is plotted on the chart along with other indicators, such as the Moving Average (MA), the Relative Strength Index (RSI), and the Average True Range (ATR).
Trades are only taken when the price is in the same direction as the baseline. For example, if the baseline is sloping upwards, only long trades are taken, and if the baseline is sloping downwards, only short trades are taken. This approach helps to ensure that trades are in line with the overall trend of the market, and reduces the risk of entering trades that are likely to fail.
By using a baseline in the NNFX system, traders can have a clear reference point for determining the overall trend of the market, and can make more informed trading decisions. The baseline helps to filter out noise and false signals, and ensures that trades are taken in the direction of the long-term trend.
What is a Confirmation indicator?
Confirmation indicators are technical indicators that are used to confirm the signals generated by primary indicators. Primary indicators are the core indicators used in the NNFX system, such as the Average True Range (ATR), the Moving Average (MA), and the Relative Strength Index (RSI).
The purpose of the confirmation indicators is to reduce false signals and improve the accuracy of the trading system. They are designed to confirm the signals generated by the primary indicators by providing additional information about the strength and direction of the trend.
Some examples of confirmation indicators that may be used in the NNFX system include the Bollinger Bands, the MACD (Moving Average Convergence Divergence), and the MACD Oscillator. These indicators can provide information about the volatility, momentum, and trend strength of the market, and can be used to confirm the signals generated by the primary indicators.
In the NNFX system, confirmation indicators are used in combination with primary indicators and other filters to create a trading system that is robust and reliable. By using multiple indicators to confirm trading signals, the system aims to reduce the risk of false signals and improve the overall profitability of the trades.
What is a Continuation indicator?
In the NNFX (No Nonsense Forex) trading system, a continuation indicator is a technical indicator that is used to confirm a current trend and predict that the trend is likely to continue in the same direction. A continuation indicator is typically used in conjunction with other indicators in the system, such as a baseline indicator, to provide a comprehensive trading strategy.
What is a Volatility/Volume indicator?
Volume indicators, such as the On Balance Volume (OBV), the Chaikin Money Flow (CMF), or the Volume Price Trend (VPT), are used to measure the amount of buying and selling activity in a market. They are based on the trading volume of the market, and can provide information about the strength of the trend. In the NNFX system, volume indicators are used to confirm trading signals generated by the Moving Average and the Relative Strength Index. Volatility indicators include Average Direction Index, Waddah Attar, and Volatility Ratio. In the NNFX trading system, volatility is a proxy for volume and vice versa.
By using volume indicators as confirmation tools, the NNFX trading system aims to reduce the risk of false signals and improve the overall profitability of trades. These indicators can provide additional information about the market that is not captured by the primary indicators, and can help traders to make more informed trading decisions. In addition, volume indicators can be used to identify potential changes in market trends and to confirm the strength of price movements.
What is an Exit indicator?
The exit indicator is used in conjunction with other indicators in the system, such as the Moving Average (MA), the Relative Strength Index (RSI), and the Average True Range (ATR), to provide a comprehensive trading strategy.
The exit indicator in the NNFX system can be any technical indicator that is deemed effective at identifying optimal exit points. Examples of exit indicators that are commonly used include the Parabolic SAR, the Average Directional Index (ADX), and the Chandelier Exit.
The purpose of the exit indicator is to identify when a trend is likely to reverse or when the market conditions have changed, signaling the need to exit a trade. By using an exit indicator, traders can manage their risk and prevent significant losses.
In the NNFX system, the exit indicator is used in conjunction with a stop loss and a take profit order to maximize profits and minimize losses. The stop loss order is used to limit the amount of loss that can be incurred if the trade goes against the trader, while the take profit order is used to lock in profits when the trade is moving in the trader's favor.
Overall, the use of an exit indicator in the NNFX trading system is an important component of a comprehensive trading strategy. It allows traders to manage their risk effectively and improve the profitability of their trades by exiting at the right time.
How does Loxx's GKD (Giga Kaleidoscope Modularized Trading System) implement the NNFX algorithm outlined above?
Loxx's GKD v1.0 system has five types of modules (indicators/strategies). These modules are:
1. GKD-BT - Backtesting module (Volatility, Number 1 in the NNFX algorithm)
2. GKD-B - Baseline module (Baseline and Volatility/Volume, Numbers 1 and 2 in the NNFX algorithm)
3. GKD-C - Confirmation 1/2 and Continuation module (Confirmation 1/2 and Continuation, Numbers 3, 4, and 5 in the NNFX algorithm)
4. GKD-V - Volatility/Volume module (Confirmation 1/2, Number 6 in the NNFX algorithm)
5. GKD-E - Exit module (Exit, Number 7 in the NNFX algorithm)
(additional module types will added in future releases)
Each module interacts with every module by passing data between modules. Data is passed between each module as described below:
GKD-B => GKD-V => GKD-C(1) => GKD-C(2) => GKD-C(Continuation) => GKD-E => GKD-BT
That is, the Baseline indicator passes its data to Volatility/Volume. The Volatility/Volume indicator passes its values to the Confirmation 1 indicator. The Confirmation 1 indicator passes its values to the Confirmation 2 indicator. The Confirmation 2 indicator passes its values to the Continuation indicator. The Continuation indicator passes its values to the Exit indicator, and finally, the Exit indicator passes its values to the Backtest strategy.
This chaining of indicators requires that each module conform to Loxx's GKD protocol, therefore allowing for the testing of every possible combination of technical indicators that make up the six components of the NNFX algorithm.
What does the application of the GKD trading system look like?
Example trading system:
Backtest: Strategy with 1-3 take profits, trailing stop loss, multiple types of PnL volatility, and 2 backtesting styles
Baseline: Hull Moving Average
Volatility/Volume: Hurst Exponent
Confirmation 1: RSX VDI w/ Confidence Bands as shown on the chart above
Confirmation 2: Williams Percent Range
Continuation: Fisher Transform
Exit: Rex Oscillator
Each GKD indicator is denoted with a module identifier of either: GKD-BT, GKD-B, GKD-C, GKD-V, or GKD-E. This allows traders to understand to which module each indicator belongs and where each indicator fits into the GKD protocol chain.
Giga Kaleidoscope Modularized Trading System Signals (based on the NNFX algorithm)
Standard Entry
1. GKD-C Confirmation 1 Signal
2. GKD-B Baseline agrees
3. Price is within a range of 0.2x Volatility and 1.0x Volatility of the Goldie Locks Mean
4. GKD-C Confirmation 2 agrees
5. GKD-V Volatility/Volume agrees
Baseline Entry
1. GKD-B Baseline signal
2. GKD-C Confirmation 1 agrees
3. Price is within a range of 0.2x Volatility and 1.0x Volatility of the Goldie Locks Mean
4. GKD-C Confirmation 2 agrees
5. GKD-V Volatility/Volume agrees
6. GKD-C Confirmation 1 signal was less than 7 candles prior
Volatility/Volume Entry
1. GKD-V Volatility/Volume signal
2. GKD-C Confirmation 1 agrees
3. Price is within a range of 0.2x Volatility and 1.0x Volatility of the Goldie Locks Mean
4. GKD-C Confirmation 2 agrees
5. GKD-B Baseline agrees
6. GKD-C Confirmation 1 signal was less than 7 candles prior
Continuation Entry
1. Standard Entry, Baseline Entry, or Pullback; entry triggered previously
2. GKD-B Baseline hasn't crossed since entry signal trigger
3. GKD-C Confirmation Continuation Indicator signals
4. GKD-C Confirmation 1 agrees
5. GKD-B Baseline agrees
6. GKD-C Confirmation 2 agrees
1-Candle Rule Standard Entry
1. GKD-C Confirmation 1 signal
2. GKD-B Baseline agrees
3. Price is within a range of 0.2x Volatility and 1.0x Volatility of the Goldie Locks Mean
Next Candle:
1. Price retraced (Long: close < close or Short: close > close )
2. GKD-B Baseline agrees
3. GKD-C Confirmation 1 agrees
4. GKD-C Confirmation 2 agrees
5. GKD-V Volatility/Volume agrees
1-Candle Rule Baseline Entry
1. GKD-B Baseline signal
2. GKD-C Confirmation 1 agrees
3. Price is within a range of 0.2x Volatility and 1.0x Volatility of the Goldie Locks Mean
4. GKD-C Confirmation 1 signal was less than 7 candles prior
Next Candle:
1. Price retraced (Long: close < close or Short: close > close )
2. GKD-B Baseline agrees
3. GKD-C Confirmation 1 agrees
4. GKD-C Confirmation 2 agrees
5. GKD-V Volatility/Volume Agrees
1-Candle Rule Volatility/Volume Entry
1. GKD-V Volatility/Volume signal
2. GKD-C Confirmation 1 agrees
3. Price is within a range of 0.2x Volatility and 1.0x Volatility of the Goldie Locks Mean
4. GKD-C Confirmation 1 signal was less than 7 candles prior
Next Candle:
1. Price retraced (Long: close < close or Short: close > close)
2. GKD-B Volatility/Volume agrees
3. GKD-C Confirmation 1 agrees
4. GKD-C Confirmation 2 agrees
5. GKD-B Baseline agrees
PullBack Entry
1. GKD-B Baseline signal
2. GKD-C Confirmation 1 agrees
3. Price is beyond 1.0x Volatility of Baseline
Next Candle:
1. Price is within a range of 0.2x Volatility and 1.0x Volatility of the Goldie Locks Mean
2. GKD-C Confirmation 1 agrees
3. GKD-C Confirmation 2 agrees
4. GKD-V Volatility/Volume Agrees
]█ Setting up the GKD
The GKD system involves chaining indicators together. These are the steps to set this up.
Use a GKD-C indicator alone on a chart
1. Inside the GKD-C indicator, change the "Confirmation Type" setting to "Solo Confirmation Simple"
Use a GKD-V indicator alone on a chart
**nothing, it's already useable on the chart without any settings changes
Use a GKD-B indicator alone on a chart
**nothing, it's already useable on the chart without any settings changes
Baseline (Baseline, Backtest)
1. Import the GKD-B Baseline into the GKD-BT Backtest: "Input into Volatility/Volume or Backtest (Baseline testing)"
2. Inside the GKD-BT Backtest, change the setting "Backtest Special" to "Baseline"
Volatility/Volume (Volatility/Volume, Backte st)
1. Inside the GKD-V indicator, change the "Testing Type" setting to "Solo"
2. Inside the GKD-V indicator, change the "Signal Type" setting to "Crossing" (neither traditional nor both can be backtested)
3. Import the GKD-V indicator into the GKD-BT Backtest: "Input into C1 or Backtest"
4. Inside the GKD-BT Backtest, change the setting "Backtest Special" to "Volatility/Volume"
5. Inside the GKD-BT Backtest, a) change the setting "Backtest Type" to "Trading" if using a directional GKD-V indicator; or, b) change the setting "Backtest Type" to "Full" if using a directional or non-directional GKD-V indicator (non-directional GKD-V can only test Longs and Shorts separately)
6. If "Backtest Type" is set to "Full": Inside the GKD-BT Backtest, change the setting "Backtest Side" to "Long" or "Short
7. If "Backtest Type" is set to "Full": To allow the system to open multiple orders at one time so you test all Longs or Shorts, open the GKD-BT Backtest, click the tab "Properties" and then insert a value of something like 10 orders into the "Pyramiding" settings. This will allow 10 orders to be opened at one time which should be enough to catch all possible Longs or Shorts.
Solo Confirmation Simple (Confirmation, Backtest)
1. Inside the GKD-C indicator, change the "Confirmation Type" setting to "Solo Confirmation Simple"
1. Import the GKD-C indicator into the GKD-BT Backtest: "Input into Backtest"
2. Inside the GKD-BT Backtest, change the setting "Backtest Special" to "Solo Confirmation Simple"
Solo Confirmation Complex without Exits (Baseline, Volatility/Volume, Confirmation, Backtest)
1. Inside the GKD-V indicator, change the "Testing Type" setting to "Chained"
2. Import the GKD-B Baseline into the GKD-V indicator: "Input into Volatility/Volume or Backtest (Baseline testing)"
3. Inside the GKD-C indicator, change the "Confirmation Type" setting to "Solo Confirmation Complex"
4. Import the GKD-V indicator into the GKD-C indicator: "Input into C1 or Backtest"
5. Inside the GKD-BT Backtest, change the setting "Backtest Special" to "GKD Full wo/ Exits"
6. Import the GKD-C into the GKD-BT Backtest: "Input into Exit or Backtest"
Solo Confirmation Complex with Exits (Baseline, Volatility/Volume, Confirmation, Exit, Backtest)
1. Inside the GKD-V indicator, change the "Testing Type" setting to "Chained"
2. Import the GKD-B Baseline into the GKD-V indicator: "Input into Volatility/Volume or Backtest (Baseline testing)"
3. Inside the GKD-C indicator, change the "Confirmation Type" setting to "Solo Confirmation Complex"
4. Import the GKD-V indicator into the GKD-C indicator: "Input into C1 or Backtest"
5. Import the GKD-C indicator into the GKD-E indicator: "Input into Exit"
6. Inside the GKD-BT Backtest, change the setting "Backtest Special" to "GKD Full w/ Exits"
7. Import the GKD-E into the GKD-BT Backtest: "Input into Backtest"
Full GKD without Exits (Baseline, Volatility/Volume, Confirmation 1, Confirmation 2, Continuation, Backtest)
1. Inside the GKD-V indicator, change the "Testing Type" setting to "Chained"
2. Import the GKD-B Baseline into the GKD-V indicator: "Input into Volatility/Volume or Backtest (Baseline testing)"
3. Inside the GKD-C 1 indicator, change the "Confirmation Type" setting to "Confirmation 1"
4. Import the GKD-V indicator into the GKD-C 1 indicator: "Input into C1 or Backtest"
5. Inside the GKD-C 2 indicator, change the "Confirmation Type" setting to "Confirmation 2"
6. Import the GKD-C 1 indicator into the GKD-C 2 indicator: "Input into C2"
7. Inside the GKD-C Continuation indicator, change the "Confirmation Type" setting to "Continuation"
8. Inside the GKD-BT Backtest, change the setting "Backtest Special" to "GKD Full wo/ Exits"
9. Import the GKD-E into the GKD-BT Backtest: "Input into Exit or Backtest"
Full GKD with Exits (Baseline, Volatility/Volume, Confirmation 1, Confirmation 2, Continuation, Exit, Backtest)
1. Inside the GKD-V indicator, change the "Testing Type" setting to "Chained"
2. Import the GKD-B Baseline into the GKD-V indicator: "Input into Volatility/Volume or Backtest (Baseline testing)"
3. Inside the GKD-C 1 indicator, change the "Confirmation Type" setting to "Confirmation 1"
4. Import the GKD-V indicator into the GKD-C 1 indicator: "Input into C1 or Backtest"
5. Inside the GKD-C 2 indicator, change the "Confirmation Type" setting to "Confirmation 2"
6. Import the GKD-C 1 indicator into the GKD-C 2 indicator: "Input into C2"
7. Inside the GKD-C Continuation indicator, change the "Confirmation Type" setting to "Continuation"
8. Import the GKD-C Continuation indicator into the GKD-E indicator: "Input into Exit"
9. Inside the GKD-BT Backtest, change the setting "Backtest Special" to "GKD Full w/ Exits"
10. Import the GKD-E into the GKD-BT Backtest: "Input into Backtest"
Baseline + Volatility/Volume (Baseline, Volatility/Volume, Backtest)
1. Inside the GKD-V indicator, change the "Testing Type" setting to "Baseline + Volatility/Volume"
2. Inside the GKD-V indicator, make sure the "Signal Type" setting is set to "Traditional"
3. Import the GKD-B Baseline into the GKD-V indicator: "Input into Volatility/Volume or Backtest (Baseline testing)"
4. Inside the GKD-BT Backtest, change the setting "Backtest Special" to "Baseline + Volatility/Volume"
5. Import the GKD-V into the GKD-BT Backtest: "Input into C1 or Backtest"
6. Inside the GKD-BT Backtest, change the setting "Backtest Type" to "Full". For this backtest, you must test Longs and Shorts separately
7. To allow the system to open multiple orders at one time so you can test all Longs or Shorts, open the GKD-BT Backtest, click the tab "Properties" and then insert a value of something like 10 orders into the "Pyramiding" settings. This will allow 10 orders to be opened at one time which should be enough to catch all possible Longs or Shorts.
█ GKD-C RSX VDI w/ Confidence Bands
What is the VDI (Volatility Direction Index)?
The Volatility Direction Index Index (VDI) is a technical analysis indicator developed by Loxx. It is designed to help traders and investors identify potential trend reversals, confirm existing trends, and recognize overbought or oversold market conditions. VDI is a momentum oscillator that measures the volatility and price direction of an asset over a specified period.
Here's a step-by-step breakdown of how to calculate VDI:
Choose a period (n) over which to calculate the VDI, typically 8 or 10.
Calculate the true range for each day:
True Range = max
Calculate the directional bias for each day:
If (Today's High - Previous Close) > (Previous Close - Today's Low), the directional bias is positive.
If (Today's High - Previous Close) < (Previous Close - Today's Low), the directional bias is negative.
Calculate the VDI for each day with a positive directional bias:
VDI Positive = * 100
Calculate the VDI for each day with a negative directional bias:
VDI Negative = * 100
Calculate the n-day sum of positive VDI values (Sum_Positive_VDI) and the n-day sum of negative VDI values (Sum_Negative_VDI).
Calculate the final Volatility Direction Index Index value:
VDI = (Sum_Positive_VDI - Sum_Negative_VDI) / (Sum_Positive_VDI + Sum_Negative_VDI) * 100
This VDI value can then be plotted on a chart over time to help traders and investors visualize the momentum and volatility of the asset's price.
VDI oscillates between -100 and +100. Positive VDI values indicate bullishness, while negative VDI values suggest bearishness. Values near the extremes (+100 or -100) can be considered overbought or oversold, potentially signaling a trend reversal. Traders often use additional technical analysis tools and techniques to confirm signals generated by the VDI.
What are Confidence Bands?
Confidence bands are computed using the inverse normal CDF as calculated below:
RationalApproximation(float t): This function is an implementation of a rational approximation, which is a technique used to approximate a function using a ratio of two polynomial functions. The function provided here is specific to approximating a particular function, possibly related to the inverse of the cumulative distribution function (CDF) of the standard normal distribution. The function takes a float value t as input and returns an approximation based on the given coefficients.
NormalCDFInverse(float p): This function calculates the inverse of the cumulative distribution function (CDF) for the standard normal distribution (also known as the quantile function or percent-point function). The standard normal distribution is a normal distribution with a mean of 0 and a standard deviation of 1. The input to the function is a probability value p (0 < p < 1), and the output is the corresponding z-score (or standard score) at which the CDF has the value p.
The Normal CDF Inverse function relies on the RationalApproximation function to obtain an approximation of the inverse CDF value. If the probability p is less than 0.5, the function calculates the negative z-score, while for p greater than or equal to 0.5, it calculates the positive z-score. The final output is the z-score corresponding to the input probability p.
How to calculate RSX VDI confidence bands:
1. Set the Confidence Level by clamping the input Confidence Level between 0.0000000001 and 99.9999999999.
2. Set the Confidence Band Shift by taking the maximum of the input Confidence Band Shift and 1.
3. Calculate the Confidence Z-score, a z-score corresponding to the given confidence level, using the Normal CDF Inverse function.
4. Calculate va by checking if Confidence Band Shift is greater than or equal to 0. If it is, calculate the VALUE using the backwards XX many Confidence Band Shift bars. Otherwise, set VALUE to 0.
5. Finally, calculate MERROR, which is the measure of error or confidence interval, using Confidence Z-sore, VALUE, and input Period.
The result, MERROR, represents the confidence interval or bands for the RSX VDI, which can be used in technical analysis to assess the reliability of the indicator and potential price reversals.
What is the RSX?
The Jurik RSX is a technical indicator developed by Mark Jurik to measure the momentum and strength of price movements in financial markets, such as stocks, commodities, and currencies. It is an advanced version of the traditional Relative Strength Index (RSI), designed to offer smoother and less lagging signals compared to the standard RSI.
The main advantage of the Jurik RSX is that it provides more accurate and timely signals for traders and analysts, thanks to its improved calculation methods that reduce noise and lag in the indicator's output. This enables better decision-making when analyzing market trends and potential trading opportunities.
What is RSX VDI w/ Confidence Bands
This indicator calculates the RSX VDI and then wraps that calculation with upper and lower confidence level. There are three types of signals: Levels cross, dynamic middle cross, and signal cross. Levels cross only works if you adjust the Confidence Bands shift upward or adjust the confidence level downward as the likelihood of reaching the default setting of 95% confidence is very low.
Requirements
Inputs
Confirmation 1: GKD-V Volatility / Volume indicator
Confirmation 2: GKD-C Confirmation indicator
Continuation: GKD-C Confirmation indicator
Solo Confirmation Simple: GKD-B Baseline
Solo Confirmation Complex: GKD-V Volatility / Volume indicator
Solo Confirmation Super Complex: GKD-V Volatility / Volume indicator
Stacked 1: None
Stacked 2+: GKD-C, GKD-V, or GKD-B Stacked 1
Outputs
Confirmation 1: GKD-C Confirmation 2 indicator
Confirmation 2: GKD-C Continuation indicator
Continuation: GKD-E Exit indicator
Solo Confirmation Simple: GKD-BT Backtest
Solo Confirmation Complex: GKD-BT Backtest or GKD-E Exit indicator
Solo Confirmation Super Complex: GKD-C Continuation indicator
Stacked 1: GKD-C, GKD-V, or GKD-B Stacked 2+
Stacked 2+: GKD-C, GKD-V, or GKD-B Stacked 2+ or GKD-BT Backtest
Additional features will be added in future releases.

Bollinger Bands Forecast [QuantAlgo]🟢 Overview
Bollinger Bands are widely recognized for mapping volatility boundaries around price action, but they inherently lag behind market movement since they calculate based on completed bars. The Bollinger Bands Forecast addresses this limitation by adding a predictive layer that attempts to project where the upper band, lower band, and basis line might position in the future. The indicator provides three unique analytical models for generating these projections: one examines swing structure and breakout patterns, another integrates volume flow and accumulation metrics, while the third applies statistical trend fitting. Traders can select whichever methodology aligns with their market view or trading style to gain visibility into potential future volatility zones that could inform position planning, risk management, and timing decisions across various asset classes and timeframes.
🟢 How It Works
The core calculation begins with traditional Bollinger Bands: a moving average basis line (configurable as SMA, EMA, SMMA/RMA, WMA, or VWMA) with upper and lower bands positioned at a specified number of standard deviations away. The forecasting extension works by first generating predicted price values for upcoming bars using the selected method. These projected prices then feed into a rolling calculation that simulates how the basis line would update bar by bar, respecting the mathematical properties of the chosen moving average type. As each new forecasted price enters the calculation window, the oldest historical price drops out, mimicking the natural progression of the moving average. The system recalculates standard deviation across this evolving price window and applies the multiplier to determine where upper and lower bands would theoretically sit. This process repeats for each of the forecasted bars, creating a connected chain of potential future band positions that render as dashed lines on the chart.
🟢 Key Features
1. Market Structure Model
This forecasting approach interprets price through the lens of swing analysis and structural patterns. The algorithm identifies pivot highs and lows across a definable lookback window, then tracks whether price is forming higher highs and higher lows (bullish structure) or lower highs and lower lows (bearish structure). The system looks for break of structure (BOS) when price pushes beyond a previous swing point in the trending direction, or change of character (CHoCH) when price starts creating opposing swing patterns.
When projecting future prices, the model considers current distance from recent swing levels and the strength of the established trend (measured by counting higher highs versus lower lows). If bullish structure dominates and price sits near a swing low, the forecast biases upward. Conversely, bearish structure near a swing high produces downward bias. ATR scaling ensures the projection magnitude relates to actual market volatility.
Practical Implications for Traders:
Useful when you trade based on swing points and structural breaks
The Structure Influence slider (0 to 1) lets you dial in how much weight structure analysis carries versus pure trend
Helps visualize where bands could form around key structural levels you're watching
Works better in trending conditions where structure patterns are clearer
Might be less effective in choppy, sideways markets without defined swings
2. Volume-Weighted Model
This method attempts to incorporate volume flow into the price forecast. It combines three volume-based metrics: On-Balance Volume (OBV) to track cumulative buying/selling pressure, the Accumulation/Distribution Line to measure money flow, and volume-weighted price changes to emphasize moves that occur on high volume. The algorithm calculates the slope of these indicators to determine if volume is confirming price direction or diverging from it.
Volume spikes above a configurable threshold are flagged as potentially significant, with the direction of the spike (whether it occurred on an up bar or down bar) influencing the forecast. When OBV, A/D Line, and volume momentum all align in the same direction, the model projects stronger moves. When they conflict or show weak volume support, the forecast becomes more conservative.
Practical Implications for Traders:
Relevant if you use volume analysis to confirm price moves
More meaningful in markets with reliable volume data
The Volume Influence parameter (0 to 1) controls how much volume factors into the projection
Volume Spike Threshold adjusts sensitivity to what constitutes unusual volume
Helps spot scenarios where volume doesn't support a move, suggesting possible consolidation
Might be less effective in low-liquidity instruments or markets where volume reporting is unreliable
3. Linear Regression Model
The simplest of the three methods, linear regression fits a straight line through recent price data using least-squares mathematics and extends that line forward. This creates a clean trend projection without conditional logic or interpretation of market characteristics. The forecast simply asks: if the recent trend continues at its current rate of change, where would price be in 10 or 20 bars?
Practical Implications for traders:
Provides a neutral, mathematical baseline for comparison
Works well when trends are steady and consistent
Can be useful for backtesting since results are deterministic
Requires minimal configuration beyond lookback period
Might not adapt to changing market conditions as dynamically as the other methods
Best suited for trending markets rather than ranging or volatile conditions
🟢 Universal Applications Across All Models
Regardless of which forecasting method you select, the indicator projects future Bollinger Band positions that may help with:
▶ Pre-planning entries and exits: See where potential support (lower band) or resistance (upper band) might develop before price gets there
▶ Volatility context: Observe whether forecasted bands are widening (suggesting potential volatility expansion) or narrowing (possible compression or squeeze setup)
▶ Target setting: Reference projected band levels when determining profit targets or stop placement
▶ Mean reversion scenarios: Visualize potential paths back toward the basis line when price extends to a band extreme
▶ Breakout anticipation: Consider where upper or lower bands might sit if price begins a strong directional move
▶ Strategy development: Build trading rules around forecasted band interactions, such as entering when price is projected to return to the basis or exit when forecasts show band expansion
▶ Method comparison: Switch between the three forecasting models to see if they agree or diverge, potentially using consensus as a confidence filter
It's critical to understand that these forecasts are projections based on recent market behavior. Markets are complex systems influenced by countless factors that cannot be captured in a technical calculation or predicted perfectly. The forecasted bands represent one possible scenario of how volatility might unfold, so actual price action may still diverge from these projections. Past performance and historical patterns provide no assurance of future results. Use these forecasts as one input within a broader trading framework that includes proper risk management, position sizing, and multiple forms of analysis. The value lies not in prediction accuracy but in helping you think probabilistically about potential market states and plan accordingly.

Smart Trend Signal with Bands [wjdtks255]Indicator Description for TradingView
Title: Adaptive Trend Kernel
Description:
The "Adaptive Trend Kernel " is a versatile trend-following and volatility indicator designed to help traders identify dynamic market trends, potential reversals, and price extremes within a channel. Built upon a customized linear regression model, this indicator provides clear visual cues to enhance your trading decisions.
Key Features:
Regression Line: A central dynamic line representing the core trend direction, calculated based on a user-defined "Regression Length."
Regression Bands: Standard deviation-based bands plotted around the Regression Line, which act like a dynamic channel. These bands expand and contract with market volatility, indicating potential overbought/oversold conditions relative to the trend.
Trend Reversal Signals: Distinct "Up" (green triangle up) and "Down" (red triangle down) signals are generated when the price (close) crosses over or under the Regression Line. These signals suggest potential shifts in the short-term trend direction.
Visual Customization: Highly flexible input options for adjusting line colors, band colors, line width, and panel opacity. Users can toggle the visibility of bands and trend labels to suit their chart preferences.
Panel Label: A subtle "Regression" label is dynamically positioned, offering clear context without cluttering the main chart.
How it Works: The indicator calculates a linear regression line as the adaptive center of the price movement. Standard deviation is then used to create upper and lower bands, encapsulating typical price fluctuations. Signals are fired when price breaks out of the regression line, suggesting a momentum shift in line with the established trend or a potential reversal.
Trading Methods & Strategies
Here are some trading strategies you can apply using the "Adaptive Trend Kernel " indicator:
Trend-Following with Confirmation:
Long Entry: Look for an "Up" signal (green triangle up) when the price is above the Regression Line, especially after a brief retracement towards the line. This confirms that the uptrend is likely resuming.
Short Entry: Look for a "Down" signal (red triangle down) when the price is below the Regression Line, especially after a brief rally towards the line. This confirms that the downtrend is likely resuming.
Exit Strategy: Consider exiting if an opposite signal appears, or if the price closes outside the opposite band, indicating potential overextension or reversal.
Reversal / Counter-Trend Play:
Long Entry (Aggressive): When the price approaches or briefly dips below the Lower Regression Band and then generates an "Up" signal (green triangle up). This could indicate a potential bounce from an oversold condition relative to the trend.
Short Entry (Aggressive): When the price approaches or briefly moves above the Upper Regression Band and then generates a "Down" signal (red triangle down). This could indicate a potential pullback from an overbought condition relative to the trend.
Confirmation: This strategy works best when combined with other reversal confirmation patterns (e.g., bullish/bearish engulfing candlesticks) or divergences in other momentum indicators (like RSI).
Volatility Breakout:
Entry (Long): After a period of low volatility where the Regression Bands are narrow, observe if the price decisively breaks above the Upper Regression Band and an "Up" signal appears. This suggests a strong bullish momentum breakout.
Entry (Short): After a period of low volatility where the Regression Bands are narrow, observe if the price decisively breaks below the Lower Regression Band and a "Down" signal appears. This suggests a strong bearish momentum breakdown.
Management: Volatility breakouts can be swift; use appropriate risk management and profit-taking strategies.
Important Considerations:
Risk Management: Always apply proper stop-loss and take-profit levels. No indicator is infallible.
Timeframe Sensitivity: Adjust the "Regression Length" and "Band Multiplier" according to the asset and timeframe you are trading. Shorter lengths might suit scalping, while longer lengths are better for swing trading.
Confirmation with Other Tools: For higher conviction trades, use this indicator in conjunction with other technical analysis tools such like volume, MACD, or RSI on an oscillator pane.
Backtesting: Always backtest any strategy on historical data to understand its performance characteristics before live trading.

8 SMA Bands (Points)The "8 SMA Bands (Points)" indicator creates a set of eight Simple Moving Average (SMA) bands with adjustable offsets, overlaid on a price chart.
Here’s a breakdown:
Purpose: It tracks price trends using multiple SMAs of varying lengths (default 25, 50, 100, 200, 400, 800, 1600 periods) and adds upper and lower bands around each SMA based on point offsets, helping identify potential support, resistance, and trend strength.
Key Components:
SMAs: Eight SMAs are calculated using closing prices with lengths ranging from 25 to 1600 periods. Each SMA is plotted with a distinct color and line thickness (e.g., MA 1 is blue, MA 8 is white with thicker lines).
Bands: For each SMA, upper and lower bands are created by adding or subtracting a point-based offset (suggestions are to use default Murray Math based numbers e.g., 0.305176 for MA 1, 39.062528 for MA 8) multiplied by a global multiplier (default 1.0). These offsets define the band width and are customizable.
Customization: Users can adjust SMA lengths, offset points, colors, and the global multiplier via input settings grouped by each MA.
Visuals: SMAs are plotted as solid lines with increasing thickness for longer periods (e.g., MA 6–8 use thicker lines or circles).
Bands are plotted as semi-transparent lines matching the SMA color, with longer-term bands (MA 6–7) using a different style for emphasis.
Usage: The indicator helps traders visualize trend direction (upward if price is above most SMAs, downward if below) and potential reversal zones where price interacts with band boundaries.
The flattening or crossing of bands can signal momentum shifts. The coming together of multiple envelope tops/bottoms can signal reversal zones of various degrees based on how many envelopes come together. More envelopes converging mean a more significant top or bottom.
This indicator is particularly useful for identifying multi-timeframe trends and volatility zones on assets like Gold Futures, with flexibility to fine-tune based on market conditions.

Quantile Regression Bands [BackQuant]Quantile Regression Bands
Tail-aware trend channeling built from quantiles of real errors, not just standard deviations.
What it does
This indicator fits a simple linear trend over a rolling lookback and then measures how price has actually deviated from that trend during the window. It then places two pairs of bands at user-chosen quantiles of those deviations (inner and outer). Because bands are based on empirical quantiles rather than a symmetric standard deviation, they adapt to skewed and fat-tailed behaviour and often hug price better in trending or asymmetric markets.
Why “quantile” bands instead of Bollinger-style bands?
Bollinger Bands assume a (roughly) symmetric spread around the mean; quantiles don’t—upper and lower bands can sit at different distances if the error distribution is skewed.
Quantiles are robust to outliers; a single shock won’t inflate the bands for many bars.
You can choose tails precisely (e.g., 1%/99% or 5%/95%) to match your risk appetite.
How it works (intuitive)
Center line — a rolling linear regression approximates the local trend.
Residuals — for each bar in the lookback, the indicator looks at the gap between actual price and where the line “expected” price to be.
Quantiles — those gaps are sorted; you select which percentiles become your inner/outer offsets.
Bands — the chosen quantile offsets are added to the current end of the regression line to draw parallel support/resistance rails.
Smoothing — a light EMA can be applied to reduce jitter in the line and bands.
What you see
Center (linear regression) line (optional).
Inner quantile bands (e.g., 25th/75th) with optional translucent fill.
Outer quantile bands (e.g., 1st/99th) with a multi-step gradient to visualise “tail zones.”
Optional bar coloring: bars trend-colored by whether price is rising above or falling below the center line.
Alerts when price crosses the outer bands (upper or lower).
How to read it
Trend & drift — the slope of the center line is your local trend. Persistent closes on the same side of the center line indicate directional drift.
Pullbacks — tags of the inner band often mark routine pullbacks within trend. Reaction back to the center line can be used for continuation entries/partials.
Tails & squeezes — outer-band touches highlight statistically rare excursions for the chosen window. Frequent outer-band activity can signal regime change or volatility expansion.
Asymmetry — if the upper band sits much further from the center than the lower (or vice versa), recent behaviour has been skewed. Trade management can be adjusted accordingly (e.g., wider take-profit upslope than downslope).
A simple trend interpretation can be derived from the bar colouring
Good use-cases
Volatility-aware mean reversion — fade moves into outer bands back toward the center when trend is flat.
Trend participation — buy pullbacks to the inner band above a rising center; flip logic for shorts below a falling center.
Risk framing — set dynamic stops/targets at quantile rails so position sizing respects recent tail behaviour rather than fixed ticks.
Inputs (quick guide)
Source — price input used for the fit (default: close).
Lookback Length — bars in the regression window and residual sample. Longer = smoother, slower bands; shorter = tighter, more reactive.
Inner/Outer Quantiles (τ) — choose your “typical” vs “tail” levels (e.g., 0.25/0.75 inner, 0.01/0.99 outer).
Show toggles — independently toggle center line, inner bands, outer bands, and their fills.
Colors & transparency — customize band and fill appearance; gradient shading highlights the tail zone.
Band Smoothing Length — small EMA on lines to reduce stair-step artefacts without meaningfully changing levels.
Bar Coloring — optional trend tint from the center line’s momentum.
Practical settings
Swing trading — Length 75–150; inner τ = 0.25/0.75, outer τ = 0.05/0.95.
Intraday — Length 50–100 for liquid futures/FX; consider 0.20/0.80 inner and 0.02/0.98 outer in high-vol assets.
Crypto — Because of fat tails, try slightly wider outers (0.01/0.99) and keep smoothing at 2–4 to tame weekend jumps.
Signal ideas
Continuation — in an uptrend, look for pullback into the lower inner band with a close back above the center as a timing cue.
Exhaustion probe — in ranges, first touch of an outer band followed by a rejection candle back inside the inner band often precedes mean-reversion swings.
Regime shift — repeated closes beyond an outer band or a sharp re-tilt in the center line can mark a new trend phase; adjust tactics (stop-following along the opposite inner band).
Alerts included
“Price Crosses Upper Outer Band” — potential overextension or breakout risk.
“Price Crosses Lower Outer Band” — potential capitulation or breakdown risk.
Notes
The fit and quantiles are computed on a fixed rolling window and do not repaint; bands update as the window moves forward.
Quantiles are based on the recent distribution; if conditions change abruptly, expect band widths and skew to adapt over the next few bars.
Parameter choices directly shape behaviour: longer windows favour stability, tighter inner quantiles increase touch frequency, and extreme outer quantiles highlight only the rarest moves.
Final thought
Quantile bands answer a simple question: “How unusual is this move given the current trend and the way price has been missing it lately?” By scoring that question with real, distribution-aware limits rather than one-size-fits-all volatility you get cleaner pullback zones in trends, more honest “extreme” tags in ranges, and a framework for risk that matches the market’s recent personality.

Ehlers Ultimate Bands (UBANDS)UBANDS: ULTIMATE BANDS
🔍 OVERVIEW AND PURPOSE
Ultimate Bands, developed by John F. Ehlers, are a volatility-based channel indicator designed to provide a responsive and smooth representation of price boundaries with significantly reduced lag compared to traditional Bollinger Bands. Bollinger Bands typically use a Simple Moving Average for the centerline and standard deviations from it to establish the bands, both of which can increase lag. Ultimate Bands address this by employing Ehlers' Ultrasmooth Filter for the central moving average. The bands are then plotted based on the volatility of price around this ultrasmooth centerline.
The primary purpose of Ultimate Bands is to offer traders a clearer view of potential support and resistance levels that react quickly to price changes while filtering out excessive noise, aiming for nearly zero lag in the indicator band.
🧩 CORE CONCEPTS
Ultrasmooth Centerline: Employs the Ehlers Ultrasmooth Filter as the basis (centerline) for the bands, aiming for minimal lag and enhanced smoothing.
Volatility-Adaptive Width: The distance between the upper and lower bands is determined by a measure of price deviation from the ultrasmooth centerline. This causes the bands to widen during volatile periods and contract during calm periods.
Dynamic Support/Resistance: The bands serve as dynamic levels of potential support (lower band) and resistance (upper band).
🧮 CALCULATION AND MATHEMATICAL FOUNDATION
Ehlers' Original Concept for Deviation:
John Ehlers describes the deviation calculation as: "The deviation at each data sample is the difference between Smooth and the Close at that data point. The Standard Deviation (SD) is computed as the square root of the average of the squares of the individual deviations."
This describes calculating the Root Mean Square (RMS) of the residuals:
Smooth = UltrasmoothFilter(Source, Length)
Residuals = Source - Smooth
SumOfSquaredResiduals = Sum(Residuals ^2) for i over Length
MeanOfSquaredResiduals = SumOfSquaredResiduals / Length
SD_Ehlers = SquareRoot(MeanOfSquaredResiduals) (This is the RMS of residuals)
Pine Script Implementation's Deviation:
The provided Pine Script implementation calculates the statistical standard deviation of the residuals:
Smooth = UltrasmoothFilter(Source, Length) (referred to as _ehusf in the script)
Residuals = Source - Smooth
Mean_Residuals = Average(Residuals, Length)
Variance_Residuals = Average((Residuals - Mean_Residuals)^2, Length)
SD_Pine = SquareRoot(Variance_Residuals) (This is the statistical standard deviation of residuals)
Band Calculation (Common to both approaches, using their respective SD):
UpperBand = Smooth + (NumSDs × SD)
LowerBand = Smooth - (NumSDs × SD)
🔍 Technical Note: The Pine Script implementation uses a statistical standard deviation of the residuals (differences between price and the smooth average). Ehlers' original text implies an RMS of these residuals. While both measure dispersion, they will yield slightly different values. The Ultrasmooth Filter itself is a key component, designed for responsiveness.
📈 INTERPRETATION DETAILS
Reduced Lag: The primary advantage is the significant reduction in lag compared to standard Bollinger Bands, allowing for quicker reaction to price changes.
Volatility Indication: Widening bands indicate increasing market volatility, while narrowing bands suggest decreasing volatility.
Overbought/Oversold Conditions (Use with caution):
• Price touching or exceeding the Upper Band may suggest overbought conditions.
• Price touching or falling below the Lower Band may suggest oversold conditions.
Trend Identification:
• Price consistently "walking the band" (moving along the upper or lower band) can indicate a strong trend.
• The Middle Band (Ultrasmooth Filter) acts as a dynamic support/resistance level and indicates the short-term trend direction.
Comparison to Ultimate Channel: Ehlers notes that the Ultimate Band indicator does not differ from the Ultimate Channel indicator in any major fashion.
🛠️ USE AND APPLICATION
Ultimate Bands can be used similarly to how Keltner Channels or Bollinger Bands are used for interpreting price action, with the main difference being the reduced lag.
Example Trading Strategy (from John F. Ehlers):
Hold a position in the direction of the Ultimate Smoother (the centerline).
Exit that position when the price "pops" outside the channel or band in the opposite direction of the trade.
This is described as a trend-following strategy with an automatic following stop.
⚠️ LIMITATIONS AND CONSIDERATIONS
Lag (Minimized but Present): While significantly reduced, some minimal lag inherent to averaging processes will still exist. Increasing the Length parameter for smoother bands will moderately increase this lag.
Parameter Sensitivity: The Length and StdDev Multiplier settings are key to tuning the indicator for different assets and timeframes.
False Signals: As with any band indicator, false signals can occur, particularly in choppy or non-trending markets.
Not a Standalone System: Best used in conjunction with other forms of analysis for confirmation.
Deviation Calculation Nuance: Be aware of the difference in deviation calculation (statistical standard deviation vs. RMS of residuals) if comparing directly to Ehlers' original concept as described.
📚 REFERENCES
Ehlers, J. F. (2024). Article/Publication where "Code Listing 2" for Ultimate Bands is featured. (Specific source to be identified if known, e.g., "Stocks & Commodities Magazine, Vol. XX, No. YY").
Ehlers, J. F. (General). Various publications on advanced filtering and cycle analysis. (e.g., "Rocket Science for Traders", "Cycle Analytics for Traders").
Bollinger Bands x3 with Fill + HMA + Dynamic Width Colors📄 Description for TradingView Publication:
This is an enhanced and flexible version of the classic Bollinger Bands indicator, designed for traders who want deeper insight into market volatility and price structure.
🔹 Key Features:
✅ Triple Bollinger Bands
Displays 3 standard deviation bands: ±1σ, ±2σ, and ±3σ
Customize each deviation level independently
✅ Dynamic Band Width Coloring
Band lines change color when the distance between upper and lower bands narrows
Helps identify volatility contractions and potential squeeze setups
✅ Dynamic Fill Coloring
Fill between bands also changes color when the bands narrow
Visually highlights transitions from high to low volatility conditions
✅ Multiple Moving Average Options
Choose from:
Simple Moving Average (SMA)
Exponential Moving Average (EMA)
Smoothed Moving Average (SMMA / RMA)
Weighted Moving Average (WMA)
Volume-Weighted Moving Average (VWMA)
Hull Moving Average (HMA) for a smoother, more responsive central tendency
✅ Customization Options
Show/hide each band individually
Adjust standard deviation multipliers
Toggle fills between bands
Customize fill colors for normal and narrowing conditions
Offset option to shift all plots forward or backward
💡 Use Case Tips:
When all bands begin narrowing, it could signal an upcoming volatility expansion or breakout.
Use the ±3σ bands to gauge extreme price behavior, and ±1σ for short-term mean reversion.
Combine with price action, momentum, or volume for breakout confirmation.
🧰 Recommended For:
Volatility traders
Mean reversion strategies
Breakout traders
Trend confirmation and structure analysis

Volume-Weighted Pivot BandsThe Volume-Weighted Pivot Bands are meant to be a dynamic, rolling pivot system designed to provide traders with responsive support and resistance levels that adapt to both price volatility and volume participation. Unlike traditional daily pivot levels, this tool recalculates levels bar-by-bar using a rolling window of volume-weighted averages, making it highly relevant for intraday traders, scalpers, swing traders, and algorithmic systems alike.
-- What This Indicator Does --
This tool calculates a rolling VWAP-based pivot level, and surrounds that central pivot with up to five upper bands (R1–R5) and five lower bands (S1–S5). These act as dynamic zones of potential resistance (R) and support (S), adapting in real time to price and volume changes.
Rather than relying on static session or daily data, this indicator provides continually evolving levels, offering more relevant levels during sideways action, trending periods, and breakout conditions.
-- How the Bands Are Calculated --
Pivot (VWAP Pivot):
The core of this system is a rolling Volume-Weighted Average Price, calculated over a user-defined window (default 20 bars). This ensures that each bar’s price impact is weighted by its volume, giving a more accurate view of fair value during the selected lookback.
Volume-Weighted Range (VW Range):
The highest high and lowest low over the same window are used to calculate the volatility range — this acts as a spread factor.
Support & Resistance Bands (S1–S5, R1–R5):
The bands are offset above and below the pivot using multiples of the VW Range:
R1 = Pivot + (VW Range × multiplier)
R2 = R1 + (VW Range × multiplier)
R3 = R2 + (VW Range x multiplier)
...
S1 = Pivot − (VW Range × multiplier)
S2 = S1 − (VW Range × multiplier)
S3 = S2 - (VW Range x multiplier)
...
You can control the multiplier manually (default is 0.25), to widen or tighten band spacing.
Smoothing (Optional):
To prevent erratic movements, you can optionally toggle on/off a simple moving average to the pivot line (default length = 20), providing a smoother trend base for the bands.
-- How to Use It --
This indicator can be used for:
Support and resistance identification:
Price often reacts to R1/S1, and the outer bands (R4/R5 or S4/S5) act as overshoot zones or strong reversal areas.
Trend context:
If price is respecting upper bands (R2–R3), the trend is likely bullish. If price is pressing into S3 or lower, it may indicate sustained selling pressure or a breakdown.
Volatility framing:
The distance between bands adjusts based on price range over the rolling window. In tighter markets, the bands compress — in volatile moves, they expand. This makes the indicator self-adaptive.
Mean reversion trades:
A move into R4/R5 or S4/S5 without continuation can be a sign of exhaustion — potential for reversal toward the pivot.
Alerting:
Built-in alerts are available for crosses of all major bands (R1–R5, S1–S5), enabling trade automation or scalp alerts with ease.
-- Visual Features --
Fuchsia Lines: Mark all Resistance (R1–R5) levels.
Lime Lines: Mark all Support (S1–S5) levels.
Gray Circle Line: Marks the rolling pivot (VWAP-based).
-- Customizable Settings --
Rolling Length: Number of bars used to calculate VWAP and VW Range.
Multiplier: Controls how wide the bands are spaced.
Smooth Pivot: Toggle on/off to smooth the central pivot.
Pivot Smoothing Length: Controls how many bars to average when smoothing is enabled.
Offset: Visually shift all bands forward/backward in time.
-- Why Use This Over Standard Pivots? --
Traditional pivots are based on previous session data and remain fixed. That’s useful for static setups, but may become irrelevant as price action evolves. In contrast:
This system updates every bar, adjusting to current price behavior.
It includes volume — a key feature missing from most static pivots.
It shows multiple bands, giving a full view of compression, breakout potential, or trend exhaustion.
-- Who Is This For? --
This tool is ideal for:
Day traders & scalpers who need relevant intraday levels.
Swing traders looking for evolving areas of confluence.
Algorithmic/systematic traders who rely on quantifiable, volume-aware support/resistance.
Traders on all assets: works on crypto, stocks, futures, forex — any chart that has volume.

ONE RING 8 MA Bands with RaysCycle analysis tool ...
MAs: Eight moving averages (MA1–MA8) with customizable lengths, types (RMA, WMA, EMA, SMA), and offsets
Bands: Upper/lower bands for each MA, calculated based on final_pctX (Percentage mode) or final_ptsX (Points mode), scaled by multiplier
Rays: Forward-projected lines for bands, with customizable start points, styles (Solid, Dashed, Dotted), and lengths (up to 500 bars)
Band Choices
Manual: Uses individual inputs for band offsets
Uniform: Sets all offsets to base_pct (e.g., 0.1%) or base_pts (e.g., 0.1 points)
Linear: Scales linearly (e.g., base_pct * 1, base_pct * 2, base_pct * 3 ..., base_pct * 8)
Exponential: Scales exponentially (e.g., base_pct * 1, base_pct * 2, base_pct * 4, base_pct * 8 ..., base_pct * 128)
ATR-Based: Offsets are derived from the Average True Range (ATR), scaled by a linear factor. Dynamic bands that adapt to market conditions, useful for breakout or mean-reversion strategies. (final_pct1 = base_pct * atr, final_pct2 = base_pct * atr * 2, ..., final_pct8 = base_pct * atr * 8)
Geometric: Offsets follow a geometric progression (e.g., base_pct * r^0, base_pct * r^1, base_pct * r^2, ..., where r is a ratio like 1.5) This is less aggressive than Exponential (which uses powers of 2) and provides a smoother progression.
Example: If base_pct = 0.1, r = 1.5, then final_pct1 = 0.1%, final_pct2 = 0.15%, final_pct3 = 0.225%, ..., final_pct8 ≈ 1.71%
Harmonic: Offsets are based on harmonic flavored ratios. final_pctX = base_pct * X / (9 - X), final_ptsX = base_pts * X / (9 - X) for X = 1 to 8 This creates a harmonic-like progression where offsets increase non-linearly, ensuring MA8 bands are wider than MA1 bands, and avoids duplicating the Linear choice above.
Ex. offsets for base_pct = 0.1: MA1: ±0.0125% (0.1 * 1/8), MA2: ±0.0286% (0.1 * 2/7), MA3: ±0.05% (0.1 * 3/6), MA4: ±0.08% (0.1 * 4/5), MA5: ±0.125% (0.1 * 5/4), MA6: ±0.2% (0.1 * 6/3), MA7: ±0.35% (0.1 * 7/2), MA8: ±0.8% (0.1 * 8/1)
Square Root: Offsets grow with the square root of the band index (e.g., base_pct * sqrt(1), base_pct * sqrt(2), ..., base_pct * sqrt(8)). This creates a gradual widening, less aggressive than Linear or Exponential. Set final_pct1 = base_pct * sqrt(1), final_pct2 = base_pct * sqrt(2), ..., final_pct8 = base_pct * sqrt(8).
Example: If base_pct = 0.1, then final_pct1 = 0.1%, final_pct2 ≈ 0.141%, final_pct3 ≈ 0.173%, ..., final_pct8 ≈ 0.283%.
Fibonacci: Uses Fibonacci ratios (e.g., base_pct * 1, base_pct * 1.618, base_pct * 2.618
Percentage vs. Points Toggle:
In Percentage mode, bands are calculated as ma * (1 ± (final_pct / 100) * multiplier)
In Points mode, bands are calculated as ma ± final_pts * multiplier, where final_pts is in price units.
Threshold Setting for Slope:
Threshold setting for determining when the slope would be significant enough to call it a change in direction. Can check efficiency by setting MA1 to color on slope temporarily
Arrow table: Shows slope direction of 8 MAs using an Up or Down triangle, or shows Flat condition if no triangle.

Volatility Gaussian Bands [BigBeluga]The Volatility Gaussian Bands indicator is a cutting-edge tool designed to analyze market trends and volatility with high precision. By applying a Gaussian filter to smooth price data and implementing dynamic bands based on market volatility, this indicator provides clear signals for trend direction, strength, and potential reversals. With updated volatility calculations, it enhances the accuracy of trend detection, making it a powerful addition to any trader's toolkit.
⮁ KEY FEATURES & USAGE
● Gaussian Filter Trend Bands:
The Gaussian Filter forms the foundation of this indicator by smoothing price data to reveal the underlying trend. The trend is visualized through upper and lower bands that adjust dynamically based on market volatility. These bands provide clear visual cues for traders: a crossover above the upper band indicates a potential uptrend, while a cross below the lower band signals a potential downtrend. This feature allows traders to identify trends with greater accuracy and act accordingly.
● Dynamic Trend Strength Gauges:
The indicator includes trend strength gauges positioned at the top and bottom of the chart. These gauges dynamically measure the strength of the uptrend and downtrend, based on the middle Gaussian line. Even if the trend is downward, a rising midline will cause the upward trend strength gauge to show an increase, offering a nuanced view of the market’s momentum.
Weakening of the trend:
● Fast Trend Change Indicators:
Triangles with a "+" symbol appear on the chart to signal rapid changes in trend direction. These indicators are particularly useful when the trend changes swiftly while the midline continues to grow in its previous direction. For instance, during a downtrend, if the trend suddenly shifts upward while the midline is still declining, a triangle with a "+" will indicate this quick reversal. This feature is crucial for traders looking to capitalize on rapid market movements.
● Retest Signals:
Retest signals, displayed as triangles, highlight potential areas where the price may retest the Gaussian line during a trend. These signals provide an additional layer of analysis, helping traders confirm trend continuations or identify possible reversals. The retest signals can be customized based on the trader’s preferences.
⮁ CUSTOMIZATION
● Length Adjustment:
The length of the Gaussian filter can be customized to control the sensitivity of trend detection. Shorter lengths make the indicator more responsive, while longer lengths offer a smoother, more stable trend line.
● Volatility Calculation Mode:
Traders can select from different modes (AVG, MEDIAN, MODE) to calculate the Gaussian filter, allowing for flexibility in how trends are detected and analyzed.
● Retest Signals Toggle:
Enable or disable the retest signals based on your trading strategy. This toggle allows traders to choose whether they want these additional signals to appear on the chart, providing more control over the information displayed during their analysis.
⮁ CONCLUSION
The Volatility Gaussian Bands indicator is a versatile and powerful tool for traders focused on trend and volatility analysis. By combining Gaussian-filtered trend lines with dynamic volatility bands, trend strength gauges, and rapid trend change indicators, this tool provides a comprehensive view of market conditions. Whether you are following established trends or looking to catch early reversals, the Volatility Gaussian Bands offers the precision and adaptability needed to enhance your trading strategy.

Hullinger Bands [AlgoAlpha]🎯 Introducing the Hullinger Bands Indicator ! 🎯
Maximize your trading precision with the Hullinger Bands , an advanced tool that combines the strengths of Hull Moving Averages and Bollinger Bands for a robust trading strategy. This indicator is designed to give traders clear and actionable signals, helping you identify trend changes and optimize entry and exit points with confidence.
✨ Key Features :
📊 Dual-Length Settings : Customize your main and TP signal lengths to fit your trading style.
🎯 Enhanced Band Accuracy : The indicator uses a modified standard deviation calculation for more reliable volatility measures.
🟢🔴 Color-Coded Signals : Easily spot bullish and bearish conditions with customizable color settings.
💡 Dynamic Alerts : Get notified for trend changes and TP signals with built-in alert conditions.
🚀 Quick Guide to Using Hullinger Bands
1. ⭐ Add the Indicator : Add the indicator to favorites by pressing the star icon. Adjust the settings to align with your trading preferences, such as length and multiplier values.
2. 🔍 Analyze Readings : Observe the color-coded bands for real-time insights into market conditions. When price is closer to the upper bands it suggests an overbought market and vice versa if price is closer to the lower bands. Price being above or below the basis can be a trend indicator.
3. 🔔 Set Alerts : Activate alerts for bullish/bearish trends and TP signals, ensuring you never miss a crucial market movement.
🔍 How It Works
The Hullinger Bands indicator calculates a central line (basis) using a simple moving average, while the upper and lower bands are derived from a modified standard deviation of price movements. Unlike the traditional Bollinger Bands, the standard deviation in the Hullinger bands uses the Hull Moving Average instead of the Simple Moving Average to calculate the average variance for standard deviation calculations, this give the modified standard deviation output "memory" and the bands can be observed expanding even after the price has started consolidating, this can identify when the trend has exhausted better as the distance between the price and the bands is more apparent. The color of the bands changes dynamically, based on the proximity of the closing price to the bands, providing instant visual cues for market sentiment. The indicator also plots TP signals when price crosses these bands, allowing traders to make informed decisions. Additionally, alerts are configured to notify you of crucial market shifts, ensuring you stay ahead of the curve.

TASC 2024.05 Ultimate Channels and Ultimate Bands█ OVERVIEW
This script, inspired by the "Ultimate Channels and Ultimate Bands" article from the May 2024 edition of TASC's Traders' Tips , showcases the application of the UltimateSmoother by John Ehlers as a lag-reduced alternative to moving averages in indicators based on Keltner channels and Bollinger Bands®.
█ CONCEPTS
The UltimateSmoother , developed by John Ehlers, is a digital smoothing filter that provides minimal lag compared to many conventional smoothing filters, e.g., moving averages . Since this filter can provide a viable replacement for moving averages with reduced lag, it can potentially find broader applications in various technical indicators that utilize such averages.
This script explores its use as the smoothing filter in Keltner channels and Bollinger Bands® calculations, which traditionally rely on moving averages. By substituting averages with the UltimateSmoother function, the resulting channels or bands respond more quickly to fluctuations with substantially reduced lag.
Users can customize the script by selecting between the Ultimate channel or Ultimate bands and adjusting their parameters, including lookback lengths and band/channel width multipliers, to fine-tune the results.
█ CALCULATIONS
The calculations the Ultimate channels and Ultimate bands use closely resemble those of their conventional counterparts.
Ultimate channel:
Apply the Ultimate smoother to the `close` time series to establish the basis (center) value.
Calculate the smooth true range (STR) by applying the UltimateSmoother function with a user-specified length instead of a rolling moving average, thus replacing the conventional average true range (ATR). Users can adjust the final STR value using the "Width multiplier" input in the script's settings.
Calculate the upper channel value by adding the multiplied STR to the basis calculated in the first step, and calculate the lower channel value by subtracting the multiplied STR from the basis.
Ultimate bands:
Apply the Ultimate smoother to the `close` time series to establish the basis (center) value.
Calculate the width of the bands by finding the square root of the average of individual squared deviations over the specified length, then multiplying the result by the "Width multiplier" input value.
Calculate the upper band by adding the resulting width to the basis from the first step, and calculate the lower band by subtracting the width from the basis.