Divergence KlingerVolumeOscillator [mado]Divergence screener for KVO
Regular Bullish: "D" navy label
Hidden Bullish: "H" navy label
Regular Bearish: "D" red label
Hidden Bearish: "H" red label
ابحث في النصوص البرمجية عن "bear"

Divergence CCI [mado]Divergence screener for CCI
Regular Bullish: "D" navy label
Hidden Bullish: "H" navy label
Regular Bearish: "D" red label
Hidden Bearish: "H" red label

Divergence Awesome Oscillator [mado]Divergence screener for Awesome Oscillator
Regular Bullish: "D" navy label
Hidden Bullish: "H" navy label
Regular Bearish: "D" red label
Hidden Bearish: "H" red label
Elder impulse system with double exponential moving average dema
This version of impulse uses the double exponential moving average instead of the typical ema both to calculate macd and the moving slow and fast moving average that are plotted.
The impulse system :
The Impulse System combines two simple but powerful indicators.
One measures market inertia, the other its momentum. When both
point in the same direction, they identify an impulse worth following.
We get an entry signal when both indicators get in gear.
The Impulse System uses an exponential moving average to find
uptrends and downtrends. When the EMA rises, it shows that inertia
favors the bulls. When EMA falls, inertia works for the bears. The sec-
ond component is MACD-Histogram, an oscillator whose slope reflects
changes of power among bulls or bears. When MACD-Histogram rises,
it shows that bulls are becoming stronger. When it falls, it shows that
bears are growing stronger.
The Impulse System flags those bars where both the inertia and the
momentum point in the same direction. When both the EMA and
MACD-Histogram rise, they show that bulls are roaring and the uptrend
is accelerating.
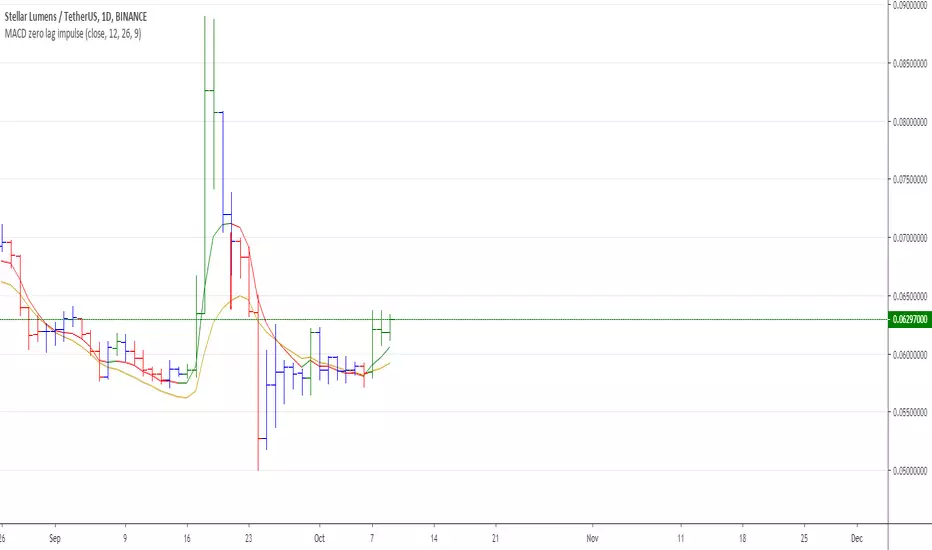
MACD Zero lag impulse systemThis version of impulse uses the double exponential moving average instead of the typical ema.
The impulse system :
The Impulse System combines two simple but powerful indicators.
One measures market inertia, the other its momentum. When both
point in the same direction, they identify an impulse worth following.
We get an entry signal when both indicators get in gear.
The Impulse System uses an exponential moving average to find
uptrends and downtrends. When the EMA rises, it shows that inertia
favors the bulls. When EMA falls, inertia works for the bears. The sec-
ond component is MACD-Histogram, an oscillator whose slope reflects
changes of power among bulls or bears. When MACD-Histogram rises,
it shows that bulls are becoming stronger. When it falls, it shows that
bears are growing stronger.
The Impulse System flags those bars where both the inertia and the
momentum point in the same direction. When both the EMA and
MACD-Histogram rise, they show that bulls are roaring and the uptrend
is accelerating.

Elder impulse system with barcolor + Safezone stops + emasThe impulse system :
The Impulse System combines two simple but powerful indicators.
One measures market inertia, the other its momentum. When both
point in the same direction, they identify an impulse worth following.
We get an entry signal when both indicators get in gear.
The Impulse System uses an exponential moving average to find
uptrends and downtrends. When the EMA rises, it shows that inertia
favors the bulls. When EMA falls, inertia works for the bears. The sec-
ond component is MACD-Histogram, an oscillator whose slope reflects
changes of power among bulls or bears. When MACD-Histogram rises,
it shows that bulls are becoming stronger. When it falls, it shows that
bears are growing stronger.
The Impulse System flags those bars where both the inertia and the
momentum point in the same direction. When both the EMA and
MACD-Histogram rise, they show that bulls are roaring and the uptrend
is accelerating.
The SafeZone Stop :
Once in a trade, where should you put your stop? This is one of the
hardest questions in technical analysis. After answering it, you’ll face
an even harder one—when and where to move that stop with the pas-
sage of time. Put a stop too close and it’ll get whacked by some mean-
ingless intraday swing. Put it too far, and you’ll have very skimpy
protection.
The Parabolic System, described in Trading for a Living, tried to
tackle this problem by moving stops closer to the market each day,
accelerating whenever a stock or a commodity reached a new extreme.
The trouble with Parabolic was that it kept moving even if the market
stayed flat and often got hit by meaningless noise.
SafeZone trails prices with stops tight enough to protect
capital but remote enough to keep clear of most random fluctuations.
Engineers design filters to suppress noise and allow the signal to come
through. If the trend is the signal, then the countertrend motion is the
noise. When the trend is up, we can define noise as that part of each
day’s range that protrudes below the previous day’s low. When the trend
is down, we can define noise as that part of each day’s range that pro-
trudes above the previous day’s high. SafeZone measures market noise
and places stops at a multiple of noise level away from the market.
We can make our lookback period 100 days or so if we want to aver-
age long-term market behavior.
SafeZone offers an original approach to placing stops. It monitors
changes in prices and adapts stops to the current levels of activity. It
places stops at individually tailored distances rather than at obvious
support and resistance levels.

Absolute Strength MTF IndicatorIntroduction
The non-signal version of the absolute strength indicator from fxcodebase.com requested by ernie76 . This indicator originally from mt4 aim to estimate the bullish/bearish force of the market by using various methods.
The Indicator
Two lines are plotted, a bull line (blue) representing the bullish/buying force and a bear one (red) representing the bearish/selling force, when the bull line is greater than the bear line the market is considered to be strongly bullish, else strongly bearish.
The indicator use various method, Rsi, stochastic, adx. The Rsi method is the one by default.
The stochastic method is less reactive but smoother
The Adx method is way different, while the other two methods make the bull and bear lines somewhat uncorrelated, the adx method focus more on the overall market strength than individual buyer/seller strength.
The smoothing method use 3 different filters, SMA, EMA and LSMA, LSMA is more reactive than the two previous one while EMA is just more computer efficient.
It is possible to use price data of different time frames for the calculation of the indicator.
Stochastic method with 4 hour price close as source.
Conclusion
A classic indicator who can be derived into a lot of ways using a more adaptive architecture or recursion. Hope you find it a use :)
A big thanks to ernie76 for the request and the support/testing of the indicator
Feel free to pm me for any request.

Ichimoku Kinko Hyo: Basic StrategyIchimoku Kinko Hyo: Basic Strategy
Entry/Exit orders are placed when three basic signals are triggered.
Ichimoku Signals:
1) Tenkan-Sen/Kijun-Sen Cross
Bullish: Tenkan-Sen is above the Kijun-Sen.
Bearish: Tenkan-Sen is below the Kijun-Sen.
2) Chikou-Span Cross
Bullish: Chikou-Span is above the close of 26 bars ago.
Bearish: Chikou-Span is below the close of 26 bars ago.
3) Price versus Kumo Cloud
Bullish: Close is above the Kumo Cloud.
Bearish: Close is below the Kumo Cloud.
Notes:
1) Long-only or short-only direction is feasible by checkbox. Stop and reverse strategy is taken by default.
2) Built-in Ichimoku indicator is strictly wrong because of counting one extra bar for all Ichimoku components.
Including the current bar like moving average is correct way in Japan. This problem is fixed in my script.

Fast EMA Stack >XBT<Multi-timeframe EMA indicator displaying 9/20 EMA bands across 5M, 15M, 1H, and 4H timeframes simultaneously on a single chart.
Quickly assess trend alignment across multiple timeframes without switching charts. A built-in signal table provides instant visual confirmation of bullish or bearish conditions on each timeframe.
Features:
Multi-Timeframe Bands — View EMA 9/20 bands for 5M, 15M, 1H, and 4H all at once
Crossover Labels — Bull/Bear labels appear directly on the chart at each EMA crossover point
Stack Filter — Only show crossover signals that align with your higher timeframe bias (e.g. if 1H is bullish, only show bull signals on lower timeframes)
Individual Label Controls — Toggle crossover labels on/off independently for each timeframe
Label Limit — Set maximum labels per timeframe to keep charts clean (default 5)
Signal Table — Dark-mode table showing BULL/BEAR status with colour-coded indicators
Fully Customisable — Adjust EMA lengths, line thickness, colours, and band transparency per timeframe
Toggle Timeframes — Show or hide individual timeframe bands
Alert Conditions — Pre-built alerts for bullish and bearish EMA crossovers on all four timeframes
How to Use:
Look for alignment across timeframes to confirm trend direction. When multiple timeframes show the same signal (all green or all red), you have stronger confluence. Crossover labels mark exact entry/exit points where momentum shifts.
Stack Filter:
Enable the Stack Filter to only see signals that match your higher timeframe bias. Select your bias timeframe (15M, 1H, or 4H), then:
When bias is bullish → only bull crossovers appear on lower timeframes
When bias is bearish → only bear crossovers appear on lower timeframes
The bias timeframe always shows both directions so you can see when trend changes
This helps filter out counter-trend noise and keeps you trading with the flow.
Green = Bullish (EMA 9 above EMA 20)
Red = Bearish (EMA 9 below EMA 20)

PPAO - Propagator Price Action Oscillator
How PPAO works in one cycle (what it does every candle)
PPAO has 3 moving parts that run every bar:
1) It measures new candle pressure (the “push”)
This is the forcing term.
Return (ret): did price go up or down from last close?
Body: did the candle close above or below its open?
CLV: did the candle close near the high or near the low of its range?
With Option B, the “price action push” is directional:
Body is positive on bullish candles, negative on bearish candles.
CLV is:
near +1 if the candle closes near the high (buying strength),
near -1 if it closes near the low (selling strength).
So a candle that closes weak (near the low) pushes PPAO downward even if the candle range is large.
2) It decides how much to remember vs forget (the “friction”)
This is damping / decay.
High volatility (noisy market) → forget faster
Low volatility (cleaner market) → remember longer
So PPAO adapts: in chop it won’t hold bias for long; in smooth trends it will.
3) It updates a hidden “momentum engine” (state)
Internally it keeps two numbers (p and q) that store the market’s impulse with memory.
Every candle:
it shrinks the old state (decay),
rotates it a bit (momentum/volatility creates oscillation),
then adds the candle push (forcing).
Finally, it converts that hidden state into a 0–100 line:
> 50 means the state is aligned bullish,
< 50 means it’s aligned bearish.
The image below will give you an example of a deep analysis using the Propagator Price Action Oscillator (PPAO).
PPAO below 30
What that means mechanically
Below 30 = bearish impulse extreme.
It happens when the recent candles are consistently “bearish pressure” according to the forcing inputs:
returns are negative and/or
candles close weak inside their range (CLV negative) and/or
bodies are bearish (close < open)
Also, if volatility is elevated, damping can make this flip faster and stay extreme during a strong impulse.
What it means behaviorally
PPAO < 30 is not “prediction.” It is diagnosis:
“Recent candle pressure has been strongly bearish.”
This can show up in two common market contexts:
Continuation context
Price is breaking structure down, and candles keep closing weak → PPAO stays < 30.
Distribution / hidden weakness context (important)
Price may look stable or near a high, but candles are repeatedly closing poorly inside their ranges (negative CLV).
That makes PPAO drop under 30 even if price hasn’t collapsed yet.
That second case is exactly why Option B (Body + CLV) is useful: it can flag weak closes / selling absorption earlier than “price-only” oscillators.
PPAO above 70
What that means mechanically
Above 70 = bullish impulse extreme.
It occurs when the forcing inputs are strongly positive:
returns are positive and/or
candles close strong inside their range (CLV positive) and/or
bodies are bullish (close > open)
If volatility is not exploding, damping won’t erase the accumulated bullish state quickly, so PPAO can stay above 70 during sustained buying pressure.
What it means behaviorally
Again: not a prophecy, but an impulse read:
“Recent candle pressure has been strongly bullish.”
Two common contexts:
Trend continuation
Price is pushing higher and closes are strong → PPAO remains > 70.
Exhaustion risk
If price is hitting major resistance/liquidity and you start seeing weaker closes (CLV drops) while PPAO stops making new highs → that’s where reversals begin to appear.
The key takeaway using both images
PPAO extremes are best understood as:
Below 30: “Sellers are currently dominating candle pressure.”
Above 70: “Buyers are currently dominating candle pressure.”
Whether that dominance leads to continuation or reversal depends on what price does next (structure + where you are on the chart). PPAO is measuring pressure, not guaranteeing outcome.

Kalman Hull Bands For Loop | RakoQuant Kalman Hull Bands For Loop | RakoQuant
RakoQuant | Kalman Hull Bands For Loop is a trend-following breakout + regime tool built to keep you on the right side of the market with clean structure and minimal noise. It combines a Kalman Filter (noise reduction), a Hull Moving Average baseline (responsive trend anchor), and a standard deviation envelope computed via a for-loop (robust rail bands) to define actionable bullish and bearish regimes.
What it does
This indicator builds a dynamic “rail system” around price:
Kalman Filtered Source → reduces measurement noise in the input series.
Hull Baseline (HMA) → fast trend baseline built on the Kalman-filtered source.
Deviation Bands (“Rails”) → upper/lower rails based on a loop-calculated standard deviation.
Regime Breakout Logic → trend regime flips only when price breaks out beyond the rails:
Bullish regime when close crosses above the upper rail
Bearish regime when close crosses below the lower rail
Once a regime is established, the tool highlights the active rail in bright neon and fades the inactive rail (optional), giving you a clear “trend corridor” and a strong visual state.
Key Features
1) Kalman Noise Filtering (R & Q)
The Kalman filter smooths the selected source using:
R (Measurement Noise) – how noisy you assume the observations are
Q (Process Noise) – how quickly the model is allowed to adapt
This helps reduce chop without turning the indicator into a laggy moving average.
2) Hull Baseline (fast + smooth)
The baseline is a Hull Moving Average applied to the Kalman-filtered source:
responsive in trend,
cleaner during transitions,
ideal for breakout regime detection.
3) Deviation Envelope with Two Modes
Deviation rails are calculated using a for-loop standard deviation (population stdev), with two choices:
Residual vs Baseline (default): deviation of (src - baseline)
→ focuses on “distance from fair value” instead of raw price volatility
Raw Source: deviation of the source itself
→ classic volatility envelope behavior
Then bands are formed by:
upper = baseline + mult * sd
lower = baseline - mult * sd
4) Regime Rails + Candle Painting (RakoQuant Neon)
Bull regime: active lower rail plotted in Neon Aqua
Bear regime: active upper rail plotted in Neon Magenta
Candles are painted to match the current state (optional)
Inactive rails can be shown faintly for context.
5) Alerts for Breakouts
Built-in alerts trigger exactly on regime flips:
Bull Breakout (close crosses above upper rail)
Bear Breakout (close crosses below lower rail)
How to Use It
Trend-following approach
Stay with the active regime until a breakout flip occurs.
In bull regime, the lower rail behaves like an adaptive trend support guide.
In bear regime, the upper rail behaves like an adaptive trend resistance guide.
Breakout confirmation
Use the breakout as a confirmation layer with your other confluences:
take longs only after a bull breakout,
take shorts only after a bear breakout,
filter mean-reversion trades by the regime state.
Inputs Summary
Source: select what the model tracks (default: high)
Kalman: R / Q controls smoothing vs responsiveness
Baseline: Hull length
Deviation: loop length, mode (Residual vs Baseline / Raw Source), multiplier
Visuals: candle painting, baseline visibility, inactive rails
Disclaimer
Backtests are based on historical data and are not indicative of future performance.
:

SuperBands: Smart Pullback StrategyIndicator Name: SuperBands (Smart Pullback Strategy)
1. Core Concept (The Philosophy)
This indicator represents a smart fusion of two powerful trading methodologies: Trend Following and Mean Reversion. Instead of trying to predict market tops or bottoms, it focuses on joining an established trend at a "Discount Price."
In short: "Buy the dips in an Uptrend, and Sell the rallies in a Downtrend."
2. Technical Components
The indicator consists of two main engines working in harmony:
First: The Trend Filter (Supertrend):
Settings: (ATR 20 / Factor 6.0).
Function: Identifies the long-term market direction. The high Factor (6.0) is deliberately used to filter out noise and minor fluctuations, ensuring the trend direction only changes when there is a significant market shift.
Rule: If the line is Green, only Long trades are allowed. If Red, only Short trades are allowed.
Second: The Sniper (Bollinger Bands):
Settings: (Length 20 / StdDev 2.0).
Function: Identifies temporary Overbought and Oversold zones within the trend.
Rule: The Lower Band acts as a "Value Zone" for buying, while the Upper Band acts as a "Premium Zone" for selling.
3. Signal Logic (How it Works)
The indicator scans the market for specific, high-probability conditions:
A. Buy Signal (Green Triangle):
Appears only when both conditions are met:
Trend is Bullish: Supertrend is Green.
Price is "Cheap": Price drops to touch or break the Lower Bollinger Band.
Logic: The general trend is Up, and the price has pulled back to a dynamic support level. This is a buying opportunity.
B. Sell Signal (Red Triangle):
Appears only when both conditions are met:
Trend is Bearish: Supertrend is Red.
Price is "Expensive": Price rises to touch or break the Upper Bollinger Band.
Logic: The general trend is Down, and the price has rallied to a dynamic resistance level. This is a selling opportunity.
4. User Guide (How to Trade It)
To achieve the best results, consider the following approach when a signal appears:
A. Entry:
Enter the trade immediately upon the close of the candle where the triangle appears (or place a pending order slightly above/below the signal candle for confirmation).
B. Stop Loss (SL):
Conservative: Place the SL at the Supertrend line (if this line breaks, the trend is invalid).
Aggressive: Place the SL slightly below the signal candle's low or the most recent Swing Low.
C. Take Profit (TP):
Target 1: The Bollinger Bands Middle Line (Basis/SMA 20).
Target 2: The Opposite Band (Upper Band for Buy signals, Lower Band for Sell signals).
5. Key Strengths & Limitations
Main Advantage: This indicator prevents a common trader mistake: "FOMO" (Fear Of Missing Out). It stops you from buying at the top or selling at the bottom. It psychologically forces you to wait for the price to come to you.
Best Use Case: The wide Supertrend settings make this highly effective for Crypto and Volatile Stocks where trends are strong and pullbacks are deep.
Limitation: In tight, ranging markets (choppy markets), the price might not touch the bands often, or it might generate a signal followed by sideways movement.
Summary for the Trader:
This indicator tells you: "The trend is Up, but don't chase the price... wait for it to drop to the Lower Band, then strike."
اسم المؤشر: SuperBands (Smart Pullback Strategy)
1. الفكرة الأساسية (الفلسفة وراء المؤشر)
هذا المؤشر هو دمج ذكي بين استراتيجيتين شهيرتين: تتبع الاتجاه (Trend Following) و اقتناص الارتدادات (Mean Reversion). هو لا يحاول التنبؤ بقمة أو قاع السوق، بل يحاول الدخول مع الاتجاه العام القوي ولكن من "نقطة سعرية مخفضة" (Discount Price).
باختصار: "اشترِ الانخفاضات في الاتجاه الصاعد، وبع الارتفاعات في الاتجاه الهابط".
2. المكونات التقنية
يتكون المؤشر من جزأين رئيسيين يعملان كفريق واحد:
أولاً: الحارس (Supertrend):
الإعدادات: (ATR 20 / Factor 6.0).
الوظيفة: تحديد الاتجاه العام "طويل المدى". استخدام العامل 6.0 (وهو رقم كبير) يجعل المؤشر يتجاهل التذبذبات الصغيرة ولا يغير لونه إلا إذا تغير الاتجاه الحقيقي للسوق بقوة.
القاعدة: إذا كان الخط أخضر، يُسمح بالشراء فقط. إذا كان أحمر، يُسمح بالبيع فقط.
ثانياً: القناص (Bollinger Bands):
الإعدادات: (Length 20 / StdDev 2.0).
الوظيفة: تحديد مناطق ذروة البيع والشراء المؤقتة (Overbought/Oversold) داخل الاتجاه.
القاعدة: الحد السفلي يعتبر منطقة "رخيصة" للشراء، والحد العلوي منطقة "غالية" للبيع.
3. كيف تتكون الإشارة (آلية العمل)
يقوم المؤشر بمسح السوق بحثاً عن شروط محددة بدقة:
A. إشارة الشراء (المثلث الأخضر):
تظهر فقط عند تحقق الشرطين معاً:
الاتجاه صاعد: السوبر تريند لونه أخضر.
سعر مغري: السعر هبط ليلامس أو يكسر الحد السفلي للبولنجر باند (Lower Band).
المنطق: الاتجاه العام صاعد، والسعر قام بعمل تصحيح (Pullback) لمستوى دعم ديناميكي، إذن هي فرصة للشراء بسعر أفضل.
B. إشارة البيع (المثلث الأحمر):
تظهر فقط عند تحقق الشرطين معاً:
الاتجاه هابط: السوبر تريند لونه أحمر.
سعر مرتفع: السعر صعد ليلامس أو يخترق الحد العلوي للبولنجر باند (Upper Band).
المنطق: الاتجاه العام هابط، والسعر قام بعمل تصحيح صعودي لمقاومة ديناميكية، إذن هي فرصة للبيع من مكان مرتفع.
4. كيفية الاستفادة منه (دليل المستخدم)
لتحقيق أفضل نتائج، يُنصح باتباع الخطوات التالية عند ظهور الإشارة:
أ. نقاط الدخول (Entry):
ادخل الصفقة بمجرد إغلاق الشمعة التي ظهر عليها المثلث (أو ضع أمر معلق فوق/تحت الشمعة لتأكيد الحركة).
ب. وقف الخسارة (Stop Loss):
الخيار الآمن: ضع الوقف عند خط السوبر تريند (لأنه إذا كُسر الخط، يعني أن الاتجاه تغير).
الخيار المغامر: ضع الوقف أسفل قاع الشمعة السابقة بمسافة بسيطة، أو أسفل آخر قاع (Swing Low).
ج. جني الأرباح (Take Profit):
الهدف الأول: خط المنتصف للبولنجر باند (الخط البرتقالي الخفي أو متوسط 20).
الهدف الثاني: الحد المعاكس للبولنجر باند (الحد العلوي في حالة الشراء، والسفلي في حالة البيع).
5. مميزات وعيوب يجب الانتباه لها
الميزة القوية: يمنعك هذا المؤشر من ارتكاب خطأ شائع وهو "الشراء في القمة" أو "البيع في القاع". هو يجبرك نفسياً على انتظار السعر ليأتي إليك في مناطق التصحيح.
نقطة القوة: إعدادات السوبر تريند (6.0) تجعل الإشارات قوية جداً في العملات الرقمية (Crypto) والأسهم ذات الاتجاه الواضح (Trending Markets).
نقطة الضعف: في الأسواق العرضية المملة (Ranging Markets) ذات النطاق الضيق جداً، قد لا تلمس الأسعار حدود البولنجر كثيراً، أو قد يعطي إشارات دخول والسوق لا يتحرك بعدها بقوة.
ملخص للمتداول:
هذا المؤشر يقول لك: "السوق صاعد، لكن لا تطارد السعر.. انتظر حتى يهبط السعر إليك عند الخط السفلي ثم اشترِ".

Smart Trader, Episode 04, by Ata Sabanci, Candles and Z ScoresSmart Trader, Episode 04
Candles and Z-Scores: A Statistical Approach to Market Analysis
━━━━━━━━━━━━━━━━━━━━━━━━━━━━━━━━━━━━━━━━━━━
OVERVIEW
This indicator applies Z-Score statistical analysis to measure how unusual current market conditions are compared to historical norms. It simultaneously analyzes five key metrics: Price, Total Volume, Buy Volume, Sell Volume, and Delta (Buy minus Sell) . The system detects 60 academically-researched market scenarios and provides visual feedback through Z-Lines (support/resistance levels), Event Markers, Trend Channels, and a comprehensive Dashboard.
━━━━━━━━━━━━━━━━━━━━━━━━━━━━━━━━━━━━━━━━━━━
CORE CONCEPT: WHY Z-SCORE?
A Z-Score measures how many standard deviations a value is from its mean. In financial markets, extreme Z-Scores indicate statistically rare events that often precede significant price movements.
Mathematical Formula:
Z = (Current Value - Mean) / Standard Deviation
Interpretation:
• Z ≥ +2.0: Extremely high (occurs approximately 2.5% of the time)
• Z ≥ +1.0: Above average
• Z ≈ 0: Normal (near the mean)
• Z ≤ -1.0: Below average
• Z ≤ -2.0: Extremely low (occurs approximately 2.5% of the time)
━━━━━━━━━━━━━━━━━━━━━━━━━━━━━━━━━━━━━━━━━━━
ACADEMIC FOUNDATION
This indicator is inspired by / grounded in market microstructure literature (abbreviated citations in-script) from market microstructure literature:
• Price-Volume Relationship - Karpoff (1987), Journal of Financial and Quantitative Analysis, Cambridge
Volume is positively correlated with price change magnitude
• Order Flow Imbalance - Cont, Kukanov, Stoikov (2014), Journal of Financial Econometrics
Order imbalance drives price more reliably than raw volume
• Informed Trading (PIN Model) - Easley, Kiefer, O'Hara, Paperman (1996), Journal of Finance
Buy/Sell imbalance reveals informed trader activity
• Mixture of Distributions - Tauchen & Pitts (1983), Clark (1973)
Volume clusters with volatility regimes
• Volume Predictability - Gervais, Kaniel, Mingelgrin (2001)
Volume shocks predict future returns
• Liquidity & Order Imbalance - Chordia, Roll, Subrahmanyam (2002)
Order imbalance affects short-term returns
• Volume-Return Dynamics - Llorente, Michaely, Saar, Wang (2002)
Speculation vs. risk-sharing patterns
• Reversal vs. Continuation - Campbell, Grossman, Wang (MIT)
High volume predicts lower autocorrelation
━━━━━━━━━━━━━━━━━━━━━━━━━━━━━━━━━━━━━━━━━━━
VOLUME ENGINE
The indicator offers two methods for decomposing total volume into Buy and Sell components:
Method 1: Geometry (Approximation)
Uses candle structure to estimate buying and selling pressure:
Buy Volume = Total Volume × (Close - Low) / (High - Low)
Sell Volume = Total Volume × (High - Close) / (High - Low)
• Works on all instruments without additional data requirements
• Fast calculation
• Less precise than intrabar method
Method 2: Intrabar (Precise)
Uses Lower Timeframe (LTF) tick/second data to aggregate actual up-ticks versus down-ticks:
• More accurate volume decomposition
• Requires LTF data availability
• Configurable LTF: 1T (tick), 1S, 15S, 1M
Delta Calculation:
Delta = Buy Volume - Sell Volume
━━━━━━━━━━━━━━━━━━━━━━━━━━━━━━━━━━━━━━━━━━━
Z-SCORE SYSTEM
The system calculates Z-Scores for five metrics simultaneously, using a configurable lookback period (default: 20 bars):
• Zp (Price Z-Score): Measures price deviation from its mean
• Zv (Volume Z-Score): Measures total volume deviation
• Zbuy (Buy Volume Z-Score): Measures buying pressure deviation
• Zsell (Sell Volume Z-Score): Measures selling pressure deviation
• ZΔ (Delta Z-Score): Measures order flow imbalance deviation
Threshold Constants:
• ZH (Z High) = 2.0: Extreme threshold
• ZM (Z Medium) = 1.0: Moderate threshold
• Z0 (Z Zero) = 0.5: Near-zero threshold
Group System:
The analysis window is divided into groups (default: 5 groups × 20 bars = 100 bar total window). Group numbers (1, 2, 3...) are displayed above candles when enabled, helping identify the relative age of detected levels.
━━━━━━━━━━━━━━━━━━━━━━━━━━━━━━━━━━━━━━━━━━━
Z-LINES (SUPPORT/RESISTANCE LEVELS)
When any metric reaches an extreme Z-Score, the system marks that price level as a significant support or resistance zone.
Detection Logic:
• Upper Z-Line: Drawn from the HIGH when Z ≥ upper threshold (default +2.0)
• Lower Z-Line: Drawn from the LOW when Z ≤ lower threshold (default -2.0)
Multi-Metric Detection:
Z-Lines can be triggered by any of the five metrics (Price, Volume, Buy, Sell, Delta). When multiple metrics trigger at similar price levels, they are clustered together into a single combined label showing all contributing metrics.
Persistence:
Z-Lines persist for the entire analysis window (Period × Groups bars) and are NOT removed when price touches them. This allows traders to see historical support/resistance levels that may still be relevant.
Anti-Overlap System:
Labels are automatically repositioned to prevent overlap. The "Label Min Gap (%)" setting controls minimum vertical separation between ALL labels (both upper and lower), ensuring readability even when multiple levels cluster together.
━━━━━━━━━━━━━━━━━━━━━━━━━━━━━━━━━━━━━━━━━━━
EVENT DETECTION ENGINE (60 SCENARIOS)
The system analyzes 60 distinct market scenarios based on Z-Score combinations. Each scenario is derived from academic research and assigned a confidence score based on signal strength and alignment.
Notation:
• Zp = Price Z-Score
• Zv = Total Volume Z-Score
• Zbuy = Buy Volume Z-Score
• Zsell = Sell Volume Z-Score
• ZΔ = Delta Z-Score
• dirP = Price direction (+1 if Zp > 0.5, -1 if Zp < -0.5, else 0)
• = Previous bar value
• ZH = 2.0 (High threshold)
• ZM = 1.0 (Medium threshold)
• Z0 = 0.5 (Zero threshold)
─────────────────────────────────────────────────────────────
CATEGORY A: PRICE-VOLUME (Events 1-10)
Based on: Karpoff (1987), Tauchen-Pitts (1983), Clark (1973)
─────────────────────────────────────────────────────────────
Event 1: Breakout Confirmed
|Zp| ≥ ZH AND Zv ≥ ZH AND sign(ZΔ) = dirP AND dirP ≠ 0
Direction: Bullish/Bearish (follows price direction)
Event 2: Trend Strength Confirmed
|Zp| ≥ ZH AND Zv ≥ ZH
Direction: Follows price direction
Event 3: Fragile Move
|Zp| ≥ ZH AND Zv ≤ -ZM
Direction: Warning (price move without volume support)
Event 4: Weak Rally
Zp ≥ ZH AND Zv ≤ -ZH
Direction: Warning (price up without volume)
Event 5: Weak Selloff
Zp ≤ -ZH AND Zv ≤ -ZH
Direction: Warning (price down without volume)
Event 6: Momentum Build
ZM ≤ |Zp| < ZH AND Zv ≥ ZH
Direction: Follows price direction
Event 7: Churn
|Zp| ≤ Z0 AND Zv ≥ ZH
Direction: Neutral (high volume, low price movement)
Event 8: Quiet Compression
|Zp| ≤ Z0 AND Zv ≤ -ZH
Direction: Neutral (low volume, low price movement)
Event 9: High Volume Regime
Zv ≥ ZH
Direction: Neutral
Event 10: Low Volume Regime
Zv ≤ -ZH
Direction: Neutral
─────────────────────────────────────────────────────────────
CATEGORY B: ORDER-FLOW / DELTA (Events 11-16)
Based on: Cont, Kukanov, Stoikov (2014), Easley, Kiefer, O'Hara, Paperman (1996)
─────────────────────────────────────────────────────────────
Event 11: Imbalance Drives Price
|ZΔ| ≥ ZH AND sign(ZΔ) = dirP AND dirP ≠ 0
Direction: Follows price direction (dirP), with delta alignment required
Event 12: Divergence Top
Zp ≥ ZH AND ZΔ ≤ -ZH
Direction: Warning (distribution at top)
Event 13: Divergence Bottom
Zp ≤ -ZH AND ZΔ ≥ ZH
Direction: Warning (accumulation at bottom)
Event 14: Absorption Positive
|Zp| ≤ Z0 AND Zv ≥ ZH AND ZΔ ≥ ZH
Direction: Bullish (buy absorption, support forming)
Event 15: Absorption Negative
|Zp| ≤ Z0 AND Zv ≥ ZH AND ZΔ ≤ -ZH
Direction: Bearish (sell absorption, resistance forming)
Event 16: Depth Wall
Zv ≥ ZH AND |ZΔ| ≥ ZH AND |Zp| ≤ Z0
Direction: Neutral (market depth absorbing)
─────────────────────────────────────────────────────────────
CATEGORY C: BUY VS SELL (Events 17-23)
Based on: Easley, Kiefer, O'Hara, Paperman (1996), Chordia, Roll, Subrahmanyam (2002)
─────────────────────────────────────────────────────────────
Event 17: Aggressive Buy Dominance
Zbuy ≥ ZH AND ZΔ ≥ ZH AND Zsell ≤ -ZM
Direction: Bullish
Event 18: Aggressive Sell Dominance
Zsell ≥ ZH AND ZΔ ≤ -ZH AND Zbuy ≤ -ZM
Direction: Bearish
Event 19: Two-Sided Battle
Zbuy ≥ ZH AND Zsell ≥ ZH AND |ZΔ| ≤ Z0
Direction: Neutral (buyers and sellers equally strong)
Event 20: Battle with Buy Edge
Zbuy ≥ ZH AND Zsell ≥ ZH AND ZM ≤ ZΔ < ZH
Direction: Bullish
Event 21: Battle with Sell Edge
Zbuy ≥ ZH AND Zsell ≥ ZH AND -ZH < ZΔ ≤ -ZM
Direction: Bearish
Event 22: Hidden Accumulation
Zbuy ≥ ZH AND |Zp| ≤ Z0 AND Zv ≥ ZH
Direction: Bullish (buy shock without price movement)
Event 23: Hidden Distribution
Zsell ≥ ZH AND |Zp| ≤ Z0 AND Zv ≥ ZH
Direction: Bearish (sell shock without price movement)
─────────────────────────────────────────────────────────────
CATEGORY D: PREDICTABILITY (Events 24-26)
Based on: Gervais, Kaniel, Mingelgrin (2001), Karpoff (1987)
─────────────────────────────────────────────────────────────
Event 24: Volume Shock Positive Drift
Zv ≥ ZH AND |Zp| ≤ ZM
Direction: Follows price direction
Event 25: Volume Shock Negative Drift
Zv ≤ -ZH AND |Zp| ≤ ZM
Direction: Opposite to price direction
Event 26: Abnormal Volume Info Arrival
Zv ≥ ZH
Direction: Neutral
─────────────────────────────────────────────────────────────
CATEGORY E: REVERSAL VS CONTINUATION (Events 27-30)
Based on: Campbell, Grossman, Wang (MIT), Llorente, Michaely, Saar, Wang (2002)
─────────────────────────────────────────────────────────────
Event 27: High Vol Reversal Risk
Zv ≥ ZH
Direction: Warning (high volume implies lower positive autocorrelation)
Event 28: Low Vol Continuation Risk
Zv ≤ -ZH
Direction: Follows price direction (trend likely continues)
Event 29: Speculation Continuation
Zv ≥ ZH AND |ZΔ| ≥ ZM AND sign(ZΔ) = dirP AND dirP ≠ 0
Direction: Follows price direction
Event 30: Risk Sharing Reversal
Zv ≥ ZH AND |ZΔ| ≤ Z0
Direction: Warning (potential reversal)
─────────────────────────────────────────────────────────────
CATEGORY F: IMBALANCE LAG (Events 31-33)
Based on: Chordia, Roll, Subrahmanyam (2002)
─────────────────────────────────────────────────────────────
Event 31: Persistent Imbalance Push
|ZΔ| ≥ ZM AND |ZΔ | ≥ ZM AND sign(ZΔ) = sign(ZΔ )
Direction: Follows delta direction (persistent pressure)
Event 32: Imbalance Pressure Decay
(ZΔ ≥ ZM AND ZΔ ≤ -ZM) OR (ZΔ ≤ -ZM AND ZΔ ≥ ZM)
Direction: Warning (imbalance sign flip)
Event 33: Intraday Imbalance Predicts
|ZΔ| ≥ ZM
Direction: Follows delta direction
─────────────────────────────────────────────────────────────
CATEGORY G: SUPPORT/RESISTANCE (Events 34-36)
Based on: Peskir (Manchester)
─────────────────────────────────────────────────────────────
Event 34: SR Barrier Event
|Zp| ≤ Z0 AND Zv ≥ ZH
Direction: Neutral (price stalls with high volume)
Event 35: Volume Backed SR Level
|Zp| ≤ Z0 AND Zv ≥ ZH AND |ZΔ| ≥ ZM
Direction: Follows delta direction
Event 36: Volume Poor SR Level
|Zp| ≤ Z0 AND Zv ≤ -ZM
Direction: Warning (weak S/R without volume)
─────────────────────────────────────────────────────────────
CATEGORY H: EXTENDED ANALYSIS (Events 37-50)
Based on: Extended market microstructure analysis
─────────────────────────────────────────────────────────────
Event 37: Climax Buy
Zbuy ≥ ZH AND Zp ≥ ZH AND Zv ≥ ZH
Direction: Warning (extreme buying exhaustion, potential top)
Event 38: Climax Sell
Zsell ≥ ZH AND Zp ≤ -ZH AND Zv ≥ ZH
Direction: Warning (extreme selling exhaustion, potential bottom)
Event 39: Stealth Accumulation
Zbuy ≥ ZM AND |Zp| ≤ Z0 AND Zv ≤ Z0
Direction: Bullish (quiet buying)
Event 40: Stealth Distribution
Zsell ≥ ZM AND |Zp| ≤ Z0 AND Zv ≤ Z0
Direction: Bearish (quiet selling)
Event 41: Volume Divergence Bull
Zp ≤ -ZM AND Zv ≤ -ZM
Direction: Bullish (price down but volume declining)
Event 42: Volume Divergence Bear
Zp ≥ ZM AND Zv ≤ -ZM
Direction: Bearish (price up but volume declining)
Event 43: Delta Price Alignment
|Zp| ≥ ZM AND |ZΔ| ≥ ZM AND sign(Zp) = sign(ZΔ)
Direction: Follows price direction (strong trend confirmation)
Event 44: Extreme Compression
|Zp| ≤ Z0 AND Zv ≤ -ZH
Direction: Neutral (very low volatility)
Event 45: Volatility Expansion
|Zp| ≥ ZH AND Zv ≥ ZH
Direction: Follows price direction (breakout from compression)
Event 46: Buy Exhaustion
Zbuy ≥ ZH AND Zp ≤ Z0
Direction: Warning (high buy but price fails)
Event 47: Sell Exhaustion
Zsell ≥ ZH AND Zp ≥ -Z0
Direction: Warning (high sell but price holds)
Event 48: Trend Acceleration
|Zp| ≥ ZM AND |Zp| > |Zp | AND Zv ≥ ZM
Direction: Follows price direction (increasing momentum)
Event 49: Trend Deceleration
|Zp| ≥ ZM AND |Zp| < |Zp | AND sign(Zp) = sign(Zp )
Direction: Warning (decreasing momentum)
Event 50: Multi Divergence
(Zp ≥ ZM AND ZΔ ≤ -ZM) OR (Zp ≤ -ZM AND ZΔ ≥ ZM) + |Zp| ≥ ZM AND Zv ≤ -ZM
Direction: Warning (multiple divergence signals)
─────────────────────────────────────────────────────────────
CATEGORY I: TREND-INTEGRATED (Events 51-60)
Based on: Combined price-volume-delta trend analysis
─────────────────────────────────────────────────────────────
Event 51: Trend Breakout Confirmed
|Zp| ≥ ZH AND Zv ≥ ZH AND |ZΔ| ≥ ZM AND sign(ZΔ) = dirP AND dirP ≠ 0
Direction: Follows price direction
Event 52: Trend Support Test
Zp ≥ ZM AND Z0 ≤ Zp < ZM AND ZΔ ≥ Z0
Direction: Bullish (pullback in uptrend)
Event 53: Trend Resistance Test
Zp ≤ -ZM AND -ZM < Zp ≤ -Z0 AND ZΔ ≤ -Z0
Direction: Bearish (rally in downtrend)
Event 54: Trend Reversal Signal
sign(Zp) ≠ sign(Zp ) AND |Zp| ≥ ZM AND |Zp | ≥ ZM
Direction: Follows new price direction (momentum flip)
Event 55: Channel Absorption
|Zp| ≤ Z0 AND Zv ≥ ZH
Direction: Neutral (range-bound with volume)
Event 56: Trend Continuation Volume
|Zp| ≥ ZM AND Zv ≥ ZM AND sign(ZΔ) = dirP AND dirP ≠ 0
Direction: Follows price direction (healthy trend with volume)
Event 57: Trend Exhaustion
|Zp| ≥ ZM AND Zv ≤ -ZM AND |Zp| < |Zp |
Direction: Warning (trend losing steam)
Event 58: Range Breakout Pending
|Zp| ≤ Z0 AND Zv ≤ -ZH AND |ZΔ| ≥ ZM
Direction: Follows delta direction (compression with imbalance)
Event 59: Trend Quality High
|Zp| ≥ ZM AND sign(ZΔ) = dirP AND Zv ≥ Z0 AND dirP ≠ 0
Direction: Follows price direction (strong aligned signals)
Event 60: Trend Quality Low
|Zp| ≥ ZM AND sign(ZΔ) ≠ dirP AND dirP ≠ 0
Direction: Warning (conflicting signals)
━━━━━━━━━━━━━━━━━━━━━━━━━━━━━━━━━━━━━━━━━━━
TREND CHANNEL SYSTEM
The trend channel system is adapted from Smart Trader Episode 03 to provide consistent visual context for price action analysis.
How It Works:
• Divides the chart into blocks based on Z-Score groups
• Calculates OHLC (Open, High, Low, Close) for each block
• Detects Higher Highs/Higher Lows (uptrend) or Lower Highs/Lower Lows (downtrend) patterns
• Draws channel lines connecting block extremes
• Classifies by angle: steep angles indicate trends, flat angles indicate ranges
Channel Classifications:
• UPTREND: Higher highs and higher lows detected
• DOWNTREND: Lower highs and lower lows detected
• RANGE: Channel angle below threshold (default 10 degrees)
Label Information:
• Trend direction (UPTREND/DOWNTREND/RANGE)
• Channel boundary prices
• Distance from current price (absolute and percentage)
• Channel angle in degrees
━━━━━━━━━━━━━━━━━━━━━━━━━━━━━━━━━━━━━━━━━━━
DASHBOARD
The dashboard provides a comprehensive real-time view of all Z-Score metrics and detected events.
Dashboard Sections:
1. Header Row
Displays indicator name and current calculation mode (CLOSED or LIVE).
2. Metric Rows (Price, Total Volume, Buy Volume, Sell Volume, Delta)
Each row displays:
• Value: Current metric value
• Z: Calculated Z-Score
• Visual: Graphical Z-bar showing position relative to mean
• Status: Interpretation (Extreme High, Above Avg, Normal, Below Avg, Extreme Low)
• Upper: Oldest active upper Z-Line in window (Label Mirror)
• Lower: Oldest active lower Z-Line in window (Label Mirror)
3. Event Detection Section
• Count of triggered events out of 60 total scenarios
• Market Bias: Bull/Bear/Neutral percentage with visual bar
• Strongest Event: Highest confidence event currently triggered
• #2 Event: Second highest confidence event
4. Footer
Shows engine type (Geometry/Intrabar), Z-Score period, calculation basis, and number of valid bars.
━━━━━━━━━━━━━━━━━━━━━━━━━━━━━━━━━━━━━━━━━━━
ALERT SYSTEM
The indicator uses native alertcondition() functions, keeping the settings menu clean while providing comprehensive alert options in TradingView's alert dialog.
Available Alert Categories:
• Master Alerts: Any event, Any bullish, Any bearish, Any warning
• Single Event Alerts: Individual alerts for key events (Breakout, Climax, Divergence, etc.)
• Category Alerts: Alerts by event category (Price-Volume, Order-Flow, etc.)
• Confluence Alerts: 2+, 3+, 4+, or 5+ aligned events
• Bias Shift Alerts: 10%, 20%, or 30% shifts in market bias
• High Confidence Alerts: Events with 60%+, 70%+, 80%+, or 90%+ confidence
• Divergence Alerts: Price vs Volume or Price vs Delta divergences
━━━━━━━━━━━━━━━━━━━━━━━━━━━━━━━━━━━━━━━━━━━
DATA ACCURACY AND LIMITATIONS
This indicator is 100% VOLUME-BASED and requires Lower Timeframe (LTF) intrabar data for accurate calculations when using the Intrabar method.
Data Accuracy Levels:
• 1T (Tick): Most accurate, real volume distribution per tick
• 1S (1 Second): Reasonably accurate approximation
• 15S (15 Seconds): Good approximation, longer historical data available
• 1M (1 Minute): Rough approximation, maximum historical data range
Backtest and Replay Limitations:
• Replay mode results may differ from live trading due to data availability
• For longer backtest periods, use higher LTF settings (15S or 1M)
• Not all symbols/exchanges support tick-level data
• Crypto and Forex typically have better LTF data availability than stocks
A Note on Data Access:
Higher TradingView plans provide access to more historical intrabar data, which directly impacts the accuracy of volume-based calculations. More precise volume data leads to more reliable calculations.
━━━━━━━━━━━━━━━━━━━━━━━━━━━━━━━━━━━━━━━━━━━
LANGUAGE SUPPORT (TRI-LINGUAL UI)
This indicator includes a built-in language switch with three interface languages :
• English (EN)
• Türkçe (TR)
• 한국어 (KO)
The selected language updates key interface text such as the Dashboard headers/rows , tooltips , and the Event Engine outputs (event names, category names, and direction labels). Turkish diacritics and Korean Hangul are supported for clean, native readability.
Why only three languages?
Each additional language requires duplicating strings throughout the code, which increases script size/memory usage and compilation time. To keep the indicator optimized and responsive, language options are intentionally limited to three.
━━━━━━━━━━━━━━━━━━━━━━━━━━━━━━━━━━━━━━━━━━━
⚠️ DISCLAIMER
FOR EDUCATIONAL AND RESEARCH PURPOSES ONLY
This indicator is designed as an educational and research tool based on academic market microstructure literature. It is NOT financial advice and should NOT be used as the sole basis for trading decisions.
Important Notices:
• Past performance does not guarantee future results
• All trading involves risk of substantial loss
• The indicator's signals are statistical probabilities, not certainties
• Always conduct your own research and consult qualified financial advisors
• The creator assumes no responsibility for trading losses
Research Sources:
This indicator is built upon peer-reviewed academic research from:
• Journal of Financial and Quantitative Analysis (Cambridge University Press)
• Journal of Finance
• Journal of Financial Econometrics
• MIT Working Papers
• arXiv Financial Mathematics

CSS Reversal - VAThis indicator identifies a price action reversal pattern known as CSS (Candle Stop Setup). Unlike standard 3-candle patterns, this logic is dynamic and "hunts" for the true peak or valley before confirming a shift in momentum.
Core Logic & Rules
The script follows a specific sequence of "Initiation, Waiting, and Triggering" to ensure it captures high-probability reversals:
1. Initiation (The Sweep): The process starts when a candle (the Pivot) sweeps the liquidity of the previous candle.
Bearish: Candle 2 makes a higher high than Candle 1.
Bullish: Candle 2 makes a lower low than Candle 1.
2. Identifying the Extreme: The script tracks the absolute highest high (for bearish) or lowest low (for bullish) during the setup. If a subsequent candle goes higher/lower without triggering a close, the "mark" moves to that new extreme candle.
3. The Waiting Room (Inside Bars): The setup remains active even if several candles follow that do not break out of the Pivot's range. The script can wait indefinitely (e.g., 3, 4, or 5+ candles) as long as the original extreme is not breached.
4. The Trigger (The Confirmation): A signal is only confirmed when a candle closes past the opposite side of the extreme candle's body.
Bearish Trigger: A candle closes below the Low of the highest candle.
Bullish Trigger: A candle closes above the High of the lowest candle.
5. Retrospective Marking: Once the trigger close occurs, the script automatically places a visual marker (arrow) on the actual extreme candle (the peak or valley), even if that candle occurred several bars ago.
Visual Indicators
Red Arrow (↓): Placed at the high of the highest candle in a confirmed bearish reversal.
Green Arrow (↑): Placed at the low of the lowest candle in a confirmed bullish reversal.
Use Cases
This script is designed for traders who look for Liquidity Sweeps and Market Structure Shifts. It filters out "fake" reversals where price merely wicks past a level without a solid closing confirmation, and it specifically accounts for "inside bar" periods where price consolidates before making its move.

Smart TrendSmart Trend — TradingView Indicator Documentation
© 2026 Arup Sarkar
Indicator Name: Smart Trend
Version: 1.0
What It Does
Smart Trend is a trend detection and momentum analysis indicator for TradingView. It identifies high-probability trend flips, strong momentum moves, volatility expansions, and short-term counter-trend signals.
It combines:
- Current timeframe trend lines (EMA + SMA)
- Higher timeframe EMA context (1H + 4H + Daily)
- ATR-based dynamic exits
- Volume confirmation
Smart Trend is designed to:
- Detect trend changes early
- Confirm momentum strength
- Highlight weakening trends before reversals
- Keep charts clean and actionable
How It Works
1. Trend Detection: Trend Line (EMA21 + SMA50): represents current trend direction
2. Higher Timeframe EMA (HTF EMA 1H): confirms alignment
Trend Conditions:
- Uptrend: candle closes above trend line and HTF EMA
- Downtrend: candle closes below trend line and HTF EMA
- Choppy / Flat: neither uptrend nor downtrend
2. Momentum Strength
- Calculated using slope of trend line EMA
- Candle colors indicate momentum:
* Bullish: green, opacity based on strength
* Bearish: red, opacity based on strength
* Neutral / Choppy: grey
3. Alerts
- Smart Trend sends alerts once per confirmed condition on candle close:
- Uptrend Flip (U) — 2-candle confirmation, trend turns bullish
- Downtrend Flip (D) — 2-candle confirmation, trend turns bearish
- Strong Bullish Momentum — trend up + ATR breakout + volume confirmation
- Strong Bearish Momentum — trend down + ATR breakout + volume confirmation
- Volatility Expansion — ATR rising
- Volatility Expansion After Squeeze — breakout after low-volatility period
- Counter-Trend Up — short-term uptrend vs HTF downtrend
- Counter-Trend Down — short-term downtrend vs HTF uptrend
4. ATR Dynamic Exits
- ATR (Average True Range) over last 50 days is used to calculate dynamic stop levels
- Plots longExit and shortExit levels
- Helps traders manage risk dynamically based on market volatility
5. Visuals
- Trend Line: colored by direction (green/red/gray)
- Smoothed 4H+1D EMA: thin orange line for higher timeframe context
- Labels: “U” for uptrend flips, “D” for downtrend flips
- Counter-trend signals: small triangles above/below bars
- ATR exit lines: semi-transparent for clean chart
Benefits
- Detects trend reversals early
- Confirms strong momentum moves
- Highlights weakening trends using volume and ATR
- Provides dynamic exit levels for risk management
- Keeps chart clean and readable
- Alerts are actionable and trigger once per pattern confirmation
Conclusion
Smart Trend is an all-in-one trend and momentum tool for traders who want:
- Early detection of trend flips
- High-probability momentum signals
- Volatility-aware trade management
- Minimal visual clutter with maximum actionable insights
Smart Trend can be combined with support/resistance levels, higher timeframe analysis, and other indicators to increase confidence and improve trade decisions.

[CT] MoBo BandsThis script is the TradingView Pine Script version of MoBo Bands, the Momentum Breakout indicator, and the original creator credited in the code is NPR21, who also notes it was based on an original Thinkorswim concept and then modified and converted to Pine Script by NPR21.
At its core, MoBo Bands is a volatility envelope built from a simple moving average and standard deviation, but it’s not meant to be used like a normal Bollinger Band “touch = reversal” tool. It’s designed to identify when price has pushed far enough away from its recent average to qualify as a breakout regime, and then to keep you biased in that regime until a true opposite breakout occurs. The indicator calculates a midline using a simple moving average of your chosen price source over the selected length. It then measures how spread out price has been over that same lookback using standard deviation. From there it builds an upper and lower band by taking the midline and adding or subtracting a user-defined multiple of standard deviation. In this script those multipliers are “Num Dev Up” and “Num Dev Down.” They default to ±0.8, which is tighter than traditional Bollinger settings, meaning the bands are closer to price and the indicator is more willing to declare a breakout state. The “Displace” input simply shifts the plotted bands forward or backward by bars for visual alignment; functionally, the breakout comparisons are being made against the displaced band values, so if you use displacement you are intentionally changing where signals occur in time.
The key concept in MoBo is that it separates “where price is right now” from “what state we are in.” First it assigns a raw status called MoboStatus: if the close is above the upper band it becomes bullish breakout state, if the close is below the lower band it becomes bearish breakout state, and if the close is between the bands it is neutral. If the script stopped there, you’d only see signals on the exact bars that closed outside the bands. Instead, it adds a second layer called BreakStatus, which is a persistent regime variable. BreakStatus changes only when a true breakout happens, and it does not reset to neutral when price returns inside the bands. That is the entire purpose of the “recursion” line: once BreakStatus flips bullish, it stays bullish through the inside-band chop until a bearish breakout flips it the other way, and vice versa. This is why the band colors and the band fill behave the way they do. When BreakStatus is bullish, the bands plot green and the filled area between them is green. When BreakStatus is bearish, the bands plot red and the fill becomes red. If price is simply oscillating inside the bands, BreakStatus stays whatever it last was, which is the whole “stay with the breakout bias” philosophy.
Because of that design, the most straightforward way to trade it is to treat MoBo as a regime/bias indicator first, and an entry tool second. A bullish regime begins when you get a bullish breakout condition, meaning you had a close above the upper band and BreakStatus flips to bullish. In this script that flip is also where the “Break Out” arrow prints. That event is telling you volatility expansion has pushed price into an upside breakout state, so your default expectation becomes continuation or at least holding above the midline with higher odds of higher highs. A common execution approach is to take the breakout as your initial trigger, then use the band structure to manage the trade: if you want a more aggressive style, you enter on the breakout bar close or on the next bar if it confirms. If you want a more conservative style, you wait for the first pullback after the breakout and enter when price holds above the midline or reclaims the upper band area. Your risk can be framed in a few ways depending on instrument and timeframe: the most “indicator-pure” protective logic is that the bullish regime is invalidated only when price later breaks below the lower band and flips BreakStatus bearish. That is a very wide stop concept, but it reflects the indicator’s intent to ride trends. A tighter, more practical stop for active trading is to use the midline or a recent swing low as the risk point while still respecting the MoBo bias; the idea is you are using MoBo to keep you from fading the move, while your stop is based on structure rather than waiting for a full opposite breakout.
A bearish regime is the exact mirror. It begins when a close is below the lower band and BreakStatus flips bearish, which is when the red “Break Down” arrow prints. From that point, you treat rallies into the midline/band area as potential short opportunities as long as the regime remains bearish. More aggressive traders will short the initial breakdown; more conservative traders wait for a bounce that fails back below the midline or for a retest of the lower band zone. Exits can be handled either as “regime exits,” meaning you hold until BreakStatus flips the other way, or as “trade exits,” meaning you scale or exit into targets while staying aligned with the regime until it ends. On trend days, the regime exit can keep you in the move much longer than typical oscillators. On choppy days, a tighter risk plan is needed because a tight band setting can flip more often.
The candle coloring addition you asked for simply mirrors the fill state so you can read the regime without looking at the bands. When the fill is green (BreakStatus bullish), the candles are tinted green; when the fill is red (BreakStatus bearish), the candles are tinted red; when neither fill is active, it leaves the candles unchanged. This doesn’t change the logic or signals, it just makes the “state” visually obvious.
Where traders usually get the most out of MoBo is by using it in the context it was designed for: volatility expansion and trend participation. If you try to trade it like a mean-reversion Bollinger Band system, you’ll often do the opposite of what it’s signaling. Here, a close outside the band is not “overbought/oversold,” it’s the condition that defines a breakout regime. The best trades tend to come when the breakout occurs in alignment with a higher-timeframe trend or after a compression period, because the band break is then capturing a genuine shift in volatility and direction. If you want it to trigger fewer, higher-quality regimes, increase the length and/or increase the deviation multipliers, because that widens the envelope and demands a more significant move to flip state. If you want earlier, more frequent signals, reduce the length and/or reduce the multipliers, understanding you’ll also increase whipsaw risk.

Mean Deviation Loop | Lyro RSThe MAD Bollinger Bands + Loops is a sophisticated technical analysis tool designed to identify and quantify market trends by combining dynamic moving averages with robust statistical dispersion measures. This indicator employs a multi-model approach, integrating Bollinger-style MAD bands, for-loop momentum scoring, and a hybrid signal system to provide traders with adaptive insights across varying market conditions.
Indicator Modes
Bollinger-Style MAD Bands
This mode calculates dynamic volatility bands around price using Mean Absolute Deviation (MAD) instead of standard deviation or RMSE. MAD offers a smoother and more outlier-resistant measure of price dispersion.
Upper Band = Dynamic Moving Average + (MAD × Multiplier)
Lower Band = Dynamic Moving Average − (MAD × Multiplier)
These bands expand and contract with market volatility, helping to identify potential breakout and breakdown zones with reduced sensitivity to extreme price spikes.
For-Loop Momentum Scoring
Momentum is evaluated by analyzing recent price behavior through a loop-based comparison system applied to a MAD-weighted price series.
A rising momentum score indicates strengthening bullish pressure
A declining momentum score signals increasing bearish dominance
This method emphasizes directional consistency rather than short-term noise.
Hybrid Combined Signal
This mode combines the outputs of the MAD Bands and For-Loop Momentum Scoring into a unified directional signal.
+1 indicates bullish conditions (green)
−1 indicates bearish conditions (red)
An average of these scores is calculated to generate a combined signal, providing a clearer and more reliable indication of overall market trend.
Practical Application
Signal Interpretation
A buy signal is generated when both the MAD Bands and For-Loop Momentum align bullishly.
A sell signal is generated when both components align bearishly.
Trend Confirmation
The Hybrid Combined Signal serves as a confirmation layer, helping traders validate trend direction and reduce the likelihood of false signals during choppy or low-volatility conditions.
⚠️ Disclaimer
This indicator is a technical analysis tool and does not guarantee results. It should be used in conjunction with additional analysis methods and proper risk management strategies. The creators of this indicator are not responsible for any financial decisions made based on its signals.

SMA Squeeze Oscillator█ OVERVIEW
SMA Squeeze Oscillator is a momentum oscillator based on the relationship between multiple SMA moving averages. It combines volatility compression analysis (Squeeze), wave-style momentum structure, trend filtering, breakout signals, and divergence detection.
The indicator is designed to identify periods of market compression (low volatility), which are often followed by dynamic price moves. Additionally, it visualizes momentum and trend structure in a clean and readable way, without using a classic histogram.
█ CONCEPT
The core of the indicator is built on three SMA moving averages with different lengths. The distance between them (spread) is compared to ATR, which allows the detection of volatility compression (Squeeze).
- When the SMA spread is smaller than ATR × multiplier, the market is considered to be in Squeeze
- When the spread expands beyond this threshold, the market exits the Squeeze – often signaling the beginning of an impulse
Momentum is calculated from the relationship between the faster SMA and the slower SMAs, then smoothed. Instead of a traditional histogram, the indicator displays continuous momentum waves above and below the zero line, making changes in momentum structure easier to read.
An optional SMA trend filter can be used to limit signals to the direction of the current trend.
█ FEATURES
Calculations
- three SMA moving averages
- ATR as a volatility measure
- Squeeze detection based on SMA spread
- wave-based momentum oscillator with smoothing
- optional SMA trend filter
Visualization
- momentum waves above / below the zero line
- bullish / bearish trend fills
- separate fill and color for Squeeze phases
- thick zero line reflecting current trend
- wave-style candle coloring based on momentum
- first wave markers after exiting Squeeze
- bullish and bearish divergence visualization
Signals
- momentum zero-line cross (Bull / Bear Cross)
- first momentum wave after Squeeze
- classic bullish and bearish divergences
Alerts
- Bull Cross
- Bear Cross
- First Bullish after Squeeze
- First Bearish after Squeeze
- Bullish Divergence
- Bearish Divergence
█ HOW TO USE
Adding the indicator
Paste the code into Pine Editor or search for “SMA Squeeze Oscillator” on TradingView.
Main settings
- SMA 1 / 2 / 3 – lengths of SMAs used for Squeeze and momentum
- ATR Length / Multiplier – Squeeze detection sensitivity
- ATR Multiplier = 0 → the indicator does not display Squeeze zones
- Momentum Smoothing – smoothing of momentum waves
- Enable SMA Filter – trend filter
- the current trend is reflected by the zero-line color
- price below SMA → bearish trend
- price above SMA → bullish trend
- when enabled, it filters Bull / Bear Cross and First Bullish / Bearish after Squeeze signals, allowing only those aligned with the trend
- Enable candle coloring – wave-style candle coloring
- Enable Divergence – divergence detection
█ APPLICATION
Squeeze & Breakout
Squeeze phases indicate low volatility and energy accumulation. A breakout from Squeeze often leads to a strong directional move.
The SMA filter is not required – instead, users may apply:
- a more advanced trend filter
- structural confirmation (level break, correction completion)
- additional price-action tools
Momentum trading
The direction and slope of momentum waves help assess impulse strength and loss of momentum.
A momentum reversal can act as an early signal of a correction or potential trend change, often before it becomes visible on price.
Divergences
The indicator detects classic bullish and bearish divergences.
Important notes:
- divergences appear with a delay equal to the pivot length required for detection, by default, this delay is two candles
- divergences forming on small momentum waves or inside a Squeeze are often misleading and should be treated with caution
█ NOTES
- the indicator works best when used in market context
- Squeeze reflects volatility, not direction
- it is not a standalone trading system

Futures Trend SignalerWhat this indicator is
Futures Trend Signaler is a compact trend/bias dashboard built for futures (and any liquid symbol) that combines:
EMA trend alignment (EMA9 vs EMA21), and
Micro price positioning versus a higher‑timeframe EMA (e.g., 15s and 1s price relative to the 1m EMA9),
plus crossover markers on the chart to timestamp regime shifts.
It’s designed to answer, in seconds:
“Is the market in a bullish or bearish EMA structure?”
“Are the lower timeframes aligned with the higher timeframe?”
“When was the most recent bull/bear crossover?”
What it shows (table)
The table includes:
1m EMA9 vs EMA21
State: EMA9 > EMA21 / EMA9 < EMA21 / neutral
Bias: Bullish / Bearish / Neutral
“Last cross” context (so you know what the most recent regime shift was)
15s EMA9 vs EMA21
Same state/bias logic as the 1m row
1s EMA9 vs EMA21
Same state/bias logic as the 1m row
15s Price vs 1m EMA9
Shows whether micro price is above or below the 1m EMA9
1s Price vs 1m EMA9
Same, but even more “micro”
This structure gives you a quick “stacked timeframe” view:
1m EMA structure = your baseline regime,
15s/1s EMA structure = your momentum alignment,
15s/1s price vs 1m EMA9 = your immediate pressure/positioning vs the baseline.
What it plots (crossover markers)
For each EMA crossover set (1m, 15s, 1s), the script plots:
Bull cross marker (arrow up)
Bear cross marker (arrow down)
To keep the chart clean:
It keeps only the most recent bull cross and most recent bear cross per tracked timeframe.
When a new bull/bear cross happens, the prior marker of that same type/timeframe is removed.
Markers are differentiated by:
Color and/or a mini label on the marker (e.g., “1m”, “15s”, “1s”), so you can instantly tell which timeframe produced the signal.
Inputs / customization
Typical controls include:
Show/hide table
Table position + text size
Lower‑timeframe selections (so you can change 15s/1s if your symbol or plan doesn’t support seconds data)
Optional marker sizing / visibility settings (if you decide to expose them)
Recommended usage
Use the 1m EMA9/EMA21 as your baseline bias filter.
Use 15s & 1s EMA alignment to confirm momentum is in agreement before entries.
Use 15s/1s price vs 1m EMA9 as a quick “pressure” check (continuation vs mean‑reversion risk).
Use the most recent crossover markers to avoid trading into a fresh regime change without confirmation.
Limitations / notes
Seconds‑based signals require seconds data availability for your symbol/account. If not supported, switch those inputs to a higher LTF (e.g., 1m / 5m).
Because the indicator uses multi‑timeframe data, responsiveness can depend on your current chart timeframe and how often TradingView updates each series.
Disclaimer
This indicator is for educational/informational purposes only and does not constitute trading or investment advice. Futures trading involves substantial risk and can result in significant losses. Always manage risk and follow your plan.

EMA Fractal Bias"EMA Fractal Bias" overlays on TradingView charts to detect directional bias for scalping on futures like NQ/ES.
It computes three smoothed EMAs (fast 3/2, mid 9/3, slow 20/5, configurable) for stacking checks (bullish: fast > mid > slow; bearish: reverse).
Williams Fractals (period 2 default) identify potential breaks: close above up-fractal high for long, below down-fractal low for short.
Bias logic: Tracks last up/down fractal. On break, if stacked aligns, sets bias (long/short) and resets broken fractal. If no stack, sets pending flag and neutral bias; confirms on later bars if stack turns true.
Shading teal for long, purple for short, orange for neutral, with intra-bar previews.
Debug toggle adds event labels and status on last bar.
Non-repainting, evaluates on close.

PDH/PDL/PMH/PML Dashboard (Key-Levels Style PM Range)🟩 1. SHORT DESCRIPTION
Multi-ticker PDH/PDL/PMH/PML dashboard for intraday traders. Shows premarket range, PDH/PDL breaks, % change and trend classification.
🟩 2. FULL DESCRIPTION (for main body)
Use this for the Description section:
📘 Overview
This indicator provides a real-time dashboard for monitoring multiple tickers relative to key intraday levels including:
Previous Day High (PDH)
Previous Day Low (PDL)
Premarket High (PMH)
Premarket Low (PML)
% Change vs Yesterday Close
Breakout Signals
Trend Classification
Designed for intraday traders who monitor multiple names at once, this tool consolidates market-structure levels into one unified display without switching charts.
🧩 Key Features
✔ 14-symbol dashboard
✔ PDH / PDL / PMH / PML levels
✔ Break signal markers (▲ / ▼ / ●)
✔ % change column
✔ Trend direction column
✔ Extended hours premarket logic
✔ Automatic light/dark theme adaptation
✔ Built for U.S. equities
✔ Zero chart clutter — dashboard only
🧠 Level Logic
Previous Day Levels
PDH = yesterday high
PDL = yesterday low
Premarket Levels
Calculated from extended-hours session before 09:30 (New York time):
PMH = highest premarket price
PML = lowest premarket price
Levels reset daily.
📈 Signals
Break conditions:
Event Signal
Price > PDH ▲ (bullish breakout)
Price < PDL ▼ (bearish breakdown)
Price > PMH ● (premarket breakout)
Price < PML ● (premarket breakdown)
🔎 Trend Classification
Trend column simplifies direction:
Bullish: price > PDH AND price > PMH
Bearish: price < PDL AND price < PML
Neutral: otherwise
🧰 Use Cases
Useful for:
Opening drive monitoring
Liquidity sweeps / stop hunts
Reversal fades vs PDH/PDL
Sector rotation scanning
News trader watchlists
Options flow targeting
Premarket level validation
Great for prop/desk traders watching multiple names intraday.
📖 Usage Guide
Setup:
Enable extended hours for underlying symbols
Use timeframes ≥1m (1m–5m recommended)
Premarket values display once premarket prints
Recommended Workflow
Look for leaders clearing PDH/PMH
Watch laggards holding below PDL/PML
Use % change for rotation confirmation
Combine with volume/tape for execution
⚙ Data Requirements
Works with U.S. equities with extended hours feeds
Premarket not guaranteed for non-US symbols
PMH/PML will show “-” until premarket exists
📌 Limitations
Pine Script engine limits:
Request functions limited (40 calls)
Dashboard max 14 symbols (optimized for stability)
📂 Category
Suggested categories:
Indicators → Volume/Volatility
Indicators → Trend Analysis
Indicators → Market Structure
Tools → Dashboard/Scanner
🟩 3. TAGS (SEO optimized)
Paste these in tags:
PDH, PDL, PMH, PML, premarket, dashboard, scanner, intraday, breakout, liquidity, trend, stocks, equities, scanner, levels, key levels, extended hours, open drive, day trading, order flow, structure, range, opening drive, watchlist
🟩 4. LICENSE LINE (Required)
TradingView requires attribution for open licensing:
This script is published under the Mozilla Public License 2.0 (MPL 2.0).
🟩 5. SCREENSHOT GUIDE
TV moderators care a lot about screenshots.
Suggested screenshots:
✔ Dashboard visible on chart
✔ Both Light & Dark themes (shows UI adaptability)
✔ Example of premarket and PDH/PDL breaks
✔ Watchlist-style layout (multiple tickers)
Optional but increases engagement:
Opening drive examples (9:30–10:00)
Sector rotation examples
Breakout + Fade comparison
🟩 6. MODERATOR COMPLIANCE NOTES
This script:
✔ Does NOT generate buy/sell signals
✔ Does NOT imply future returns
✔ Does NOT perform risk/portfolio management
✔ Does NOT give financial advice
✔ Does NOT require broker data
✔ Does NOT violate the “commercial intent” rule
✔ Does NOT reference external paid services
✔ Does NOT plot protected labels on chart
✔ Is fully transparent and readable
This will help it pass without revision.
🟩 7. DISCLAIMER (Required for public scripts)
Add at bottom:
This indicator is for informational and educational purposes only and should not be considered financial advice. Trading involves risk.
🟩 8. OPTIONAL — “WHY IT WAS BUILT” SECTION
Adding this boosts publishing engagement & saves moderator time:
This indicator was built to solve a real workflow problem for intraday traders who monitor multiple symbols against structural levels like PDH/PDL/PMH/PML. Instead of switching charts repeatedly, the dashboard consolidates all levels and break conditions into a single view for faster execution and better decision-making.
🟩 9. OPTIONAL — TRADER PAIN POINTS (Marketing section)
Useful for retail publishing:
Many day traders struggle to track multiple tickers for opening drive setups, PDH/PDL sweeps, and premarket levels. This dashboard removes that friction by visualizing the levels and break signals across a watchlist in real time.

Smart Fear & Greed Index [MarkitTick]💡 This comprehensive technical tool is designed to quantify market sentiment on an asset-specific basis, translating complex price action into a singular, normalized gauge of "Fear" and "Greed." While traditional Fear & Greed indices rely on macro-economic data (like put/call ratios or junk bond demand) generally applied to the broad S&P 500, this script calculates a localized index for the specific chart you are viewing. It synthesizes Momentum, Volatility, Volume, and Price Positioning into a bounded 0-100 oscillator, aiming to identify psychological extremes where market reversals are statistically more likely to occur.
✨ Originality and Utility
● Asset-Specific Sentiment Analysis
Most sentiment tools are external to the chart (e.g., news sentiment or broad market indices). The Smart Fear & Greed Index is unique because it internalizes this logic, creating a bespoke psychological profile for any ticker—whether it is Crypto, Forex, or Stocks. It allows traders to see if *this specific asset* is overheated (Greed) or oversold (Fear) relative to its own recent history.
● The "Buy the Fear, Sell the Greed" Logic
The script employs a contrarian color-coding philosophy aligned with the famous investment adage: "Be fearful when others are greedy, and greedy when others are fearful."
When the indicator shows Fear (Low values), it colors the zone Green, signaling a potential buying opportunity (discount).
When the indicator shows Greed (High values), it colors the zone Red, signaling potential downside risk (premium).
● Integrated Divergence Detection
Unlike standard oscillators that leave interpretation entirely to the user, this tool includes an automated divergence engine. It detects discrepancies between the sentiment index and price action, plotting lines and labels to highlight potential exhaustion points before they become obvious on the price chart.
🔬 Methodology and Concepts
The calculation is driven by a custom User-Defined Type (UDT) called QuantEngine , which aggregates four distinct technical "pillars" to form the final Composite Index.
• Pillar 1: Momentum (RSI)
The engine utilizes the Relative Strength Index to measure the velocity and magnitude of directional price movements. High momentum contributes to the "Greed" score, while collapsing momentum contributes to "Fear."
• Pillar 2: Volatility (Inverted Normalized ATR)
This component interprets volatility through a psychological lens.
Low Volatility is interpreted as complacency or "Greed" (steady uptrends often have low vol).
High Volatility is interpreted as "Fear" (panic selling and erratic ranges often spike volatility).
The script normalizes the Average True Range (ATR) and inverts it so that stability adds to the score, and instability subtracts from it.
• Pillar 3: Volume Strength
Volume is analyzed relative to its moving average. However, raw volume isn't enough; the engine applies directional logic.
High relative volume on an Up-Close adds to the Greed score.
High relative volume on a Down-Close subtracts, adding to the Fear score.
• Pillar 4: Price Position (Stochastic)
This calculates where the current close sits relative to the recent High-Low range. Closing near the highs indicates confidence (Greed), while closing near the lows indicates pessimism (Fear).
• The Composite & Smoothing
These four metrics are averaged to create a raw composite, which is then smoothed via an Exponential Moving Average (EMA) to filter out noise and produce the final, readable "Smart Fear & Greed" line.
🎨 Visual Guide
● The Oscillator Line
This is the primary fluctuating line that moves between 0 and 100.
Values > 50 suggest positive sentiment.
Values < 50 suggest negative sentiment.
● Color-Coded Zones
The plot changes color dynamically to reflect the psychological state:
Red (70-100): Extreme Greed. The market may be irrationally exuberant.
Orange (60-70): Greed. Strong bullish conviction.
Yellow (40-60): Neutral. Indecisive or transitionary market.
Light Green (30-40): Fear. Sentiment is turning bearish.
Bright Green (0-30): Extreme Fear. Panic selling, often a precursor to a value bounce.
● Background Highlights
A semi-transparent Red Background appears when the index breaches 75, warning of a potential "Top."
A semi-transparent Green Background appears when the index drops below 25, highlighting a potential "Bottom."
● Divergence Elements
Red Lines/Labels ("Bear"): Bearish Divergence. Price makes a Higher High, but the Index makes a Lower High. This suggests momentum is waning despite rising prices.
Green Lines/Labels ("Bull"): Bullish Divergence. Price makes a Lower Low, but the Index makes a Higher Low. This suggests selling pressure is drying up.
📖 How to Use
• Identifying Reversals
Wait for the oscillator to enter "Extreme" zones. Do not trade immediately upon entry; wait for the line to exit the extreme zone to confirm the reversal. For example, if the line hits 80 (Red) and then crosses back down below 70, it signals that Greed is fading.
• Trend Continuation
In a strong trend, the indicator may hover in the Greed (Orange) or Fear (Light Green) zones for extended periods. In these cases, use the Neutral (Yellow) zone crosses as re-entry signals in the direction of the trend.
• Divergence Confirmation
Use the automated divergence lines as high-conviction triggers. If the background turns Green (Extreme Fear) AND a Bullish Divergence label appears, it provides a stronger technical case for a long position than the zone alone.
⚙️ Inputs and Settings
● Calculation Settings
Global Lookback Period (Default: 21): The core lookback window for RSI, ATR, Volume, and Stochastic calculations. Increasing this makes the index slower and less reactive; decreasing it makes it faster.
Smoothing Length (Default: 5): Determines how smooth the final line is. Higher numbers reduce "whipsaws" but add lag.
Color Main Chart Candles : Colors the chart bars based on Fear/Greed sentiment.
● Divergence Settings
Divergence Lookback (Default: 5): Determines the pivot strength required to register a high or low for divergence checks.
Show Divergence Lines/Labels: Toggles to hide visual clutter if you only want to see the oscillator.
🔍 Deconstruction of the Underlying Scientific and Academic Framework
● Normalization Theory
The core scientific principle here is Min-Max Normalization. The script takes heterogeneous data types—Price (Dollars/Cents), Volume (Shares/Contracts), and Volatility (Points)—and standardizes them into a unit-less distribution between 0 and 100. This allows for the summation of disparate market forces into a single vector.
● Mean Reversion and Oscillator Bounds
The indicator relies on the statistical concept of Mean Reversion. Markets, like elastic bands, can only stretch so far from their average valuation (represented by the 50 line) before snapping back. The "Extreme" zones (Upper and Lower deciles) represent areas of statistical improbability where the likelihood of a continuation decreases and the likelihood of a reversion increases.
● Divergence and Momentum Theory
The divergence logic is grounded in the principle that momentum precedes price. Mathematically, price is the integral of velocity. When the derivative (momentum/sentiment) approaches zero or reverses while the function (price) continues, it signals a non-sustainable anomaly in the data series, often resolved by a price correction.
⚠️ Disclaimer
All provided scripts and indicators are strictly for educational exploration and must not be interpreted as financial advice or a recommendation to execute trades. I expressly disclaim all liability for any financial losses or damages that may result, directly or indirectly, from the reliance on or application of these tools. Market participation carries inherent risk where past performance never guarantees future returns, leaving all investment decisions and due diligence solely at your own discretion.

Unreached Highs/Lows Oscillator [LuxAlgo]The Unreached Highs/Lows Oscillator highlights the amount of unreached high/low prices as a percentage over time, helping visualize trend strength and momentum from bullish and bearish market participants.
🔶 USAGE
This indicator measures the strength of directional price movements, helping traders visualize the strength of both the bullish and bearish market participants.
When prices are moving up with strength, the price structure will not come back to retest previous lows. Therefore, unreached lows keep adding up.
When prices are moving down with strength, they will not retest previous highs; therefore, unreached highs keep adding up.
As we can see on the chart, high readings of unreached highs (red) and low readings of unreached lows (green) are considered bearish, and a downtrend in price confirms this bias. Conversely, high readings of unreached lows and low readings of unreached highs are considered bullish. On the chart, this is reflected as an uptrend.
Additionally, the oscillator can reveal significant breakouts on the chart, with unreached highs or lows decreasing rapidly indicating that a large number of highs/lows have been reached.
Due to the oscillator being normalized, overbought and oversold levels are included.
In this gold chart, we have different examples of how to use the tool in conjunction with price behavior to understand the market. Let's dissect it step by step:
1. Uptrend: Bullish readings are above 80, and bearish readings are below 20. The market is trending up.
2. Range: Mixed readings around 50 for both bullish and bearish; the market is ranging.
3. Uptrend: The same as before. Bullish above 80 and bearish below 20.
4. Pullback: A bullish dip below 80 to 50 and a bearish reading below 20 indicates a pullback.
5. Range: Mixed readings. In this case, it is bullish above and below 80 and bearish above and below 20. The market is ranging.
6. Uptrend: Bullish above 80 and bearish below 20; the market keeps moving up.
7. Pullback: Bullish dips below 80 and bearish rises to 50 indicate a pullback.
8. Uptrend: As before, bullish is above 80 and bearish is below 20; the market is trending up.
This Bitcoin chart shows how to use extreme readings of 0 and 100 to detect potential reversals. When both readings are at extreme opposites, we set the threshold level at 100 and 0 instead of the default levels of 80 and 20 to better identify these areas.
As we can see, extreme readings at points 1 and 5 identify major reversals that lead to a change in trend. Extreme readings at points 2, 3, 4, and 6 identify minor reversals that do not lead to a change in trend.
From the settings panel, traders can adjust the length parameter. A smaller value measures smaller price movements, while a larger value measures larger price movements. A length value of 20 is used by default.
The chart shows how different values affect bullish and bearish measures.
🔶 SETTINGS
Length: Select the maximum number of highs and lows to be used.
🔹 Style
Bullish: Select a color for unreached lows.
Bearish: Select a color for unreached highs.
Top Threshold: Select the top threshold level and color. Enable the Auto feature to choose the default color.
Bottom Threshold: Select the bottom threshold level and color. Enable the Auto feature to choose the default color.
