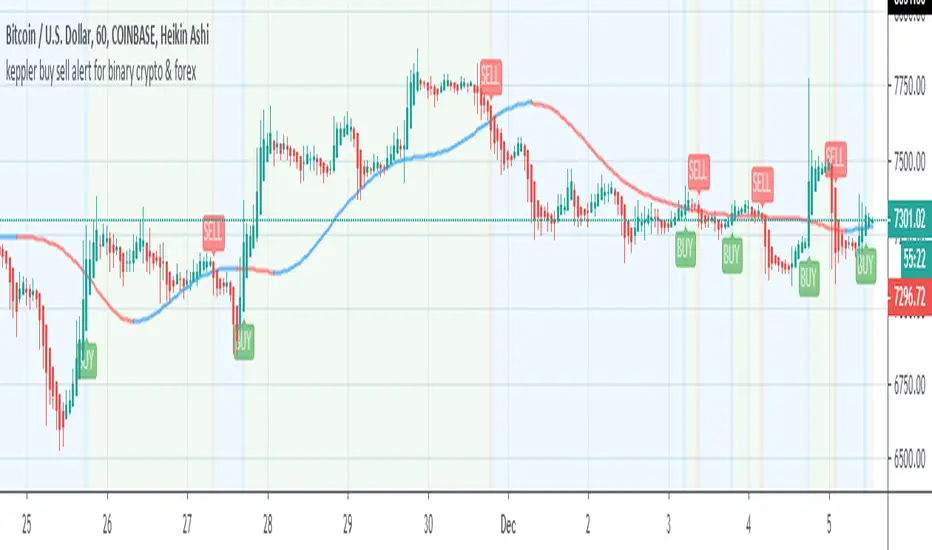
keppler buy sell alert for binary crypto & forexthis script is 100% working on binary 1 min trading
crypto and forex use on hourly charts for best results.
ابحث في النصوص البرمجية عن "binary"
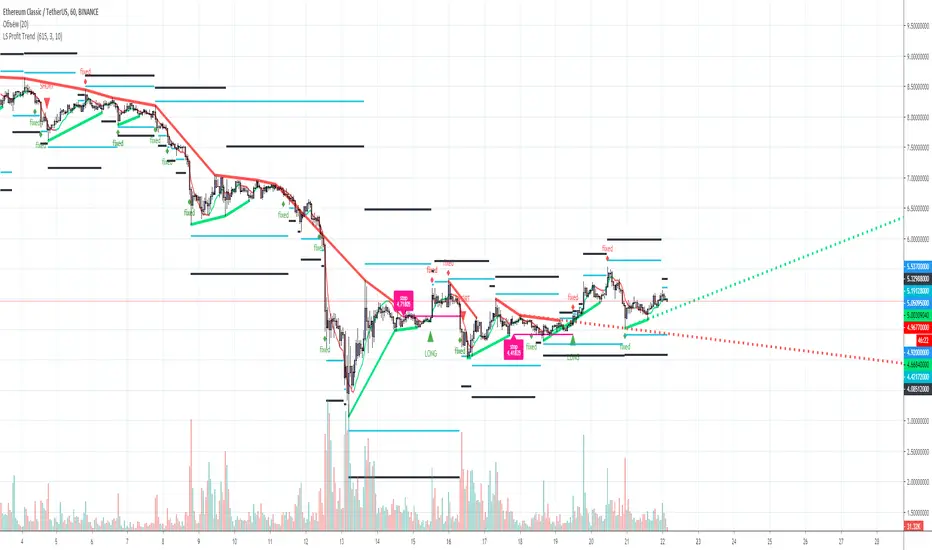
L&S PROFIT TREND Trend indicator for TF from 1 hour and above, for any trading pair, any exchange, binary options. Signals+ Take profit levels. 90% good signal and take profit 1.
yutas_BOindicator_β1Ver1.0
High-low sign indicator for binary option only. (β version)
バイナリーオプション専用ハイローサインインジケーター。 (ベータバージョン)

yutas_BOindicatorVer .1.0
High-low sign indicator for binary option only.
バイナリーオプション専用ハイローサインインジケーター。


Turbo Binary Master 2Turbo Binary Master 2
Accurate in most market conditions. Proven record, with a consistent win rate in excess of 90%.
Available at $15 per month or a once off $75 for permanent access.
If you are interested, kindly e-mail me at marais.francois@hotmail.com
Kind regards,

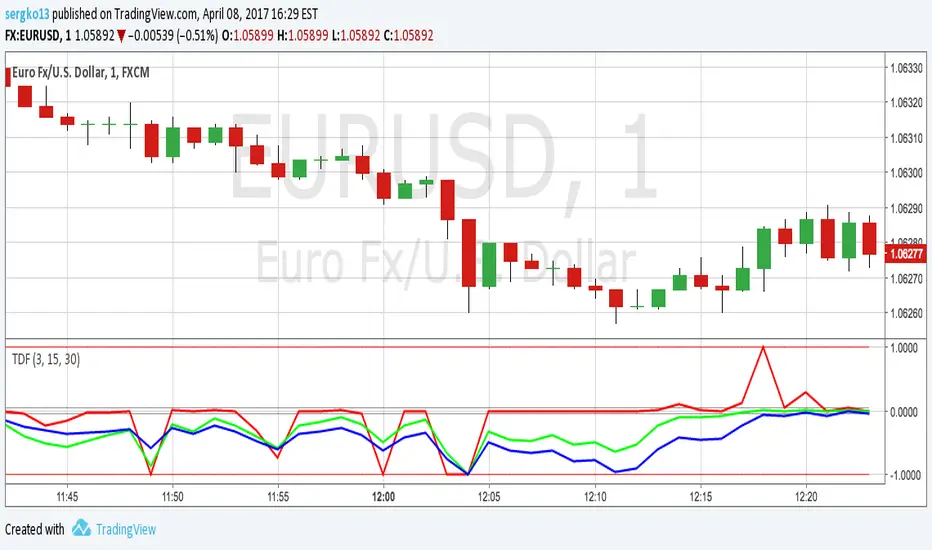
Trend Direction and Force IndexTrend direction and force index for binary options. Minor corrections to code. All invite-only scripts have been disabled
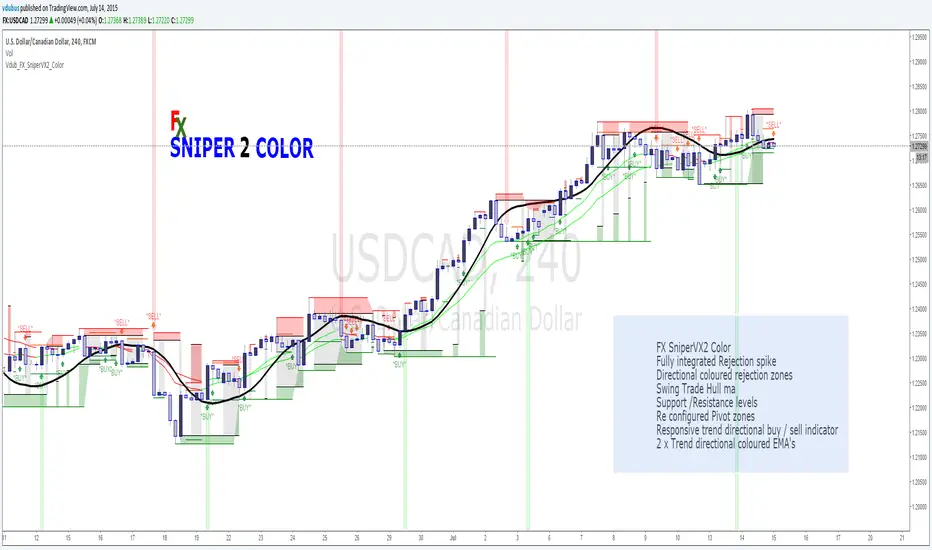
Vdub FX SniperVX2 Color v2FX SniperVX2 Color
Fully integrated Rejection spike
Directional coloured rejection zones
Swing Trade Hull ma
Support /Resistance levels
Re configured Pivot zones
Responsive trend directional buy / sell indicator
2 x Trend directional coloured EMA's
Sniper series
Indicators: Rainbow Charts Oscillator, Binary Wave and MAsRainbow Charts, by Mel Widner, is a trend detector. It uses recursively smoothed MAs (remember, this idea was proposed back in 1997 -- it was certainly cool back then!) and also builds an oscillator out of the MAs. Oscillator bands indicate the stability range.
I have also included a simple binary wave based on whether all the MAs are in an upward slope or not. If you see any value above 0.5 there, the trend is definitely up (all MAs pointing up).
More info:
www.traders.com
Here's my complete list of indicators (With these 3, the total count should be above 100 now...will update the list later today)

Fair Value MatrixConcept & Utility The Fair Value Matrix is a quantitative analysis suite designed to visualize the relationship between an asset's price action and a theoretical valuation model. Unlike standard technical indicators that rely solely on lagging price history, this script integrates a Fundamental Growth Model to project a calculated baseline trajectory derived from sector-specific data and valuation logic.
This tool is intended to assist traders in identifying statistical deviations from this projected baseline, offering a data-driven perspective on whether an asset is trading at a premium or a discount relative to the model's parameters.
Technical Methodology
1. Theoretical Growth Modeling The core of the matrix is a dynamic "Fair Value" curve. This is generated using:
Sector-Specific Growth Logic: The script applies distinct growth parameters adapted for different asset classes (e.g., Technology, Commodities, Utilities) to model theoretical expansion over time.
Dynamic Valuation: It incorporates calculated valuation logic to adjust the slope of the curve, creating a reference point that evolves with time rather than just price action.
2. Statistical Deviation Bands (Volatility Cloud) To quantify market state, the script constructs a "Volatility Cloud" around the fundamental baseline. These bands are not support/resistance lines but statistical probability envelopes calculated using:
Composite Volatility Engine: A proprietary blend of multiple volatility models is used to adapt to changing market conditions.
Statistical Measurement: The bands represent standard deviations from the calculated baseline.
Lower Bands: Represent deviation zones suggesting a statistical discount.
Upper Bands: Represent deviation zones suggesting a statistical premium.
3. Quantitative Inflection Points The script monitors price relative to these bands to generate "Inflection Signals":
Mean Reversion Alerts: Triggered when price deviates significantly from the baseline while showing signs of momentum exhaustion.
Momentum Strength: A composite trend line colors the price action based on the aggregate score of volatility, trend direction, and deviation depth.
4. Deviation Weighting Labels The numeric labels (e.g., "1x", "2x") displayed on the chart represent the magnitude of the statistical deviation at that specific moment. These values are strictly mathematical measurements of distance from the mean and are provided to help users assess the rarity of a specific price move relative to the model.
Disclaimer This script is for informational and educational purposes only. It is a theoretical model based on fixed parameters and historical data analysis. It does not predict future price movements, nor does it guarantee profitability. All trading involves risk.

[TEMPLATE] Code Block Comments█ OVERVIEW
Here I present to the community at large a collection of code comment blocks that I think will be useful, especially for larger script projects bordering on 2,000 lines or above of code.
█ PLANNED FUTURE UPDATES
Work with the community to expand this template to be even more useful with the inclusion of useful global colour sets, variables, tooltips, groups, etc.
better script thumbnail.
full-screen table or label outlining the script's use-cases.

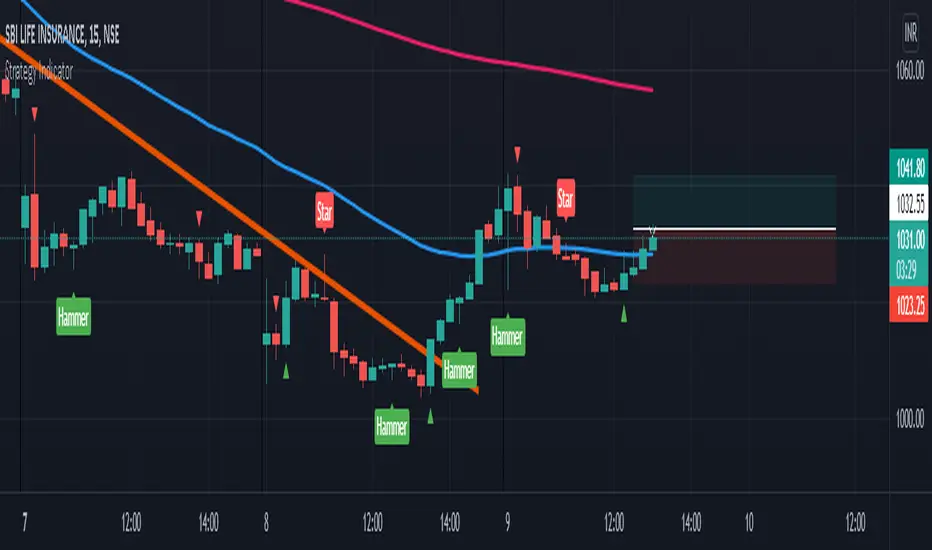
Strategy Indicator 691. 3 Moving Averages
2. Bullish/Bearish Engulfing
3. Hammer/Shooting Star
4. ATR
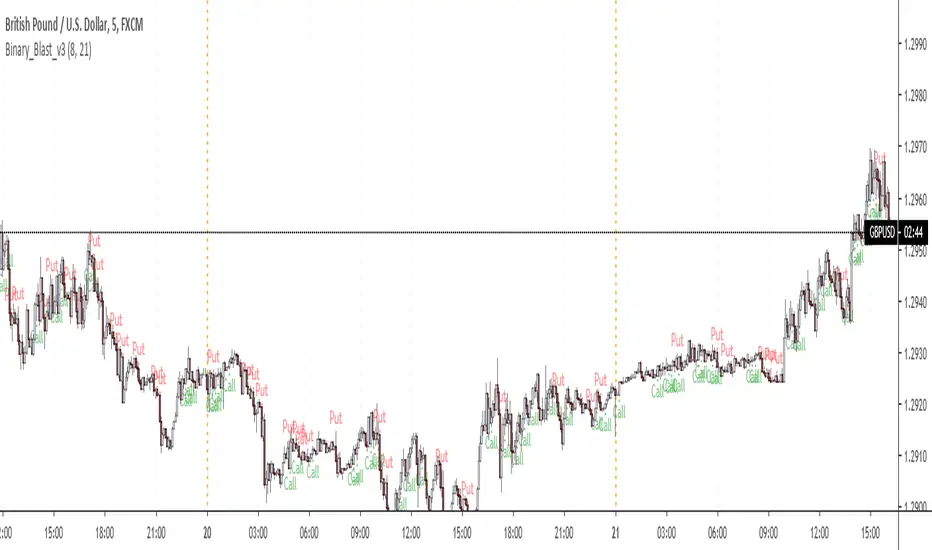
Binary_Blast_v3.1Expiry 1 candlestick after the signal candlestick(bar) closes. Maximum consecutive loses found 4 if someone wants to use it a a martingale please back test this system. Don't Put or Call on the current candlestick as it repaints for only current candle when the candlestick closes with the signal then you can Put or Call.


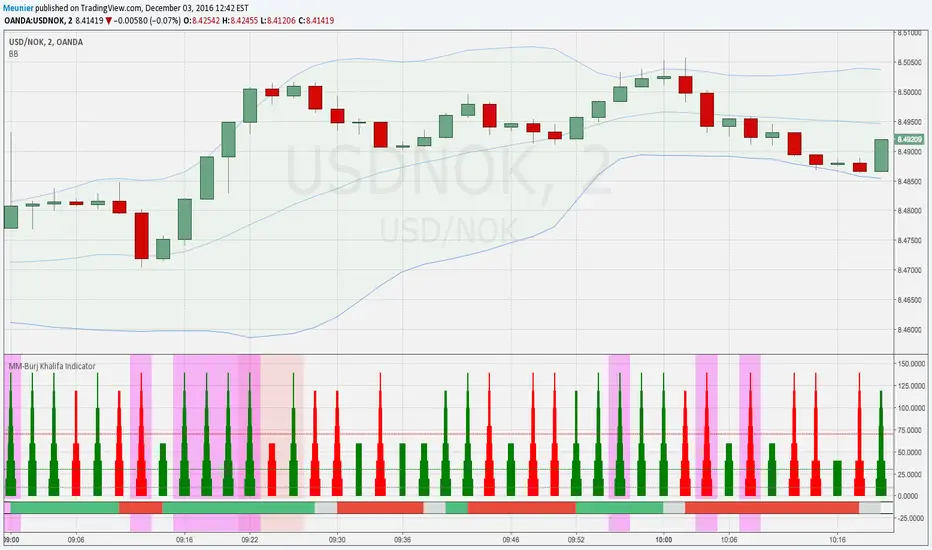
MM-Burj Khalifa Indicator
This indicator uses several signals to visualize a "perfect candle" to enter a trade.
It colors the background to identify the zones of interest (multiple configurable high or low RSI zones). Underlying is a trendbar with the current MACD direction. It's possible to tweak the indicator with a lot of options in the settings section (e.g. for which period you want a rising DM+-signal, etc.)
The indicator is using signals of:
--MACD
--RSI
--PVT
--ATR
--AD and DMI+/DMI-
When all 7 criterias are met it highlights the candle.
It also creates different colums with different height and width, so that you can see which signal is OK and which is maybe missing. When all signals are on GO you'll see a Burj-Khalifa-like figure. If not all signals are on GO you'see crippled versions.
To be clear:
it's not intended to detect trends or supertrends or reversals. It's purpose it's just to decide if this current candle is really going in the right direction. It doesn't prevent upcoming reversals in the opposite direction.
The Burj-Khalifa indicator could help to confirm the entry point of an trade which was already planned.
I'll come up with a more detailed documentation.
Vdub_BinaryBands_v1Combined 3 x Bollinger Bands With BUY & SELL zones
EMA,
Wma
SMA
Multiplier adjustment

Binary_Blast_v3_directional biasThis is not my script.
The original was done by pizer.. I have just added an option to include a fast moving average and a slow moving average to filter the direction....implying should I look for "Put" or "Call"
Kay_StochasticRSIThis is a different version of Stochastic RSI. the only difference is the use of variable moving average by Lazybear instead of regular sma for K smoothing.
Its purely an experiment. I am not a professional trader but an enthusiastic programmer trying different indicator combination to see different results.
Criticizing and negative comments will be gracefully accepted. :)
Appreciation will be even more. :)
Binary Options v4.0This script fixes the situation of consecutive losses from single-direction trades through window logic
