888 BOT #alerts█ 888 BOT #alerts (open source)
This is an Expert Advisor 'EA' or Automated trading script for ‘longs’ and ‘shorts’, which uses only a Take Profit or, in the worst case, a Stop Loss to close the trade.
It's a much improved version of the previous ‘Repanocha’. It doesn`t use 'Trailing Stop' or 'security ()' functions (although using a security function doesn`t mean that the script repaints) and all signals are confirmed, therefore the script doesn`t repaint in alert mode and is accurate in backtest mode.
Apart from the previous indicators, some more and other functions have been added for Stop-Loss, re-entry and leverage.
It uses 8 indicators, (many of you already know what they are, but in case there is someone new), these are the following:
1. Jurik Moving Average
It's a moving average created by Mark Jurik for professionals which eliminates the 'lag' or delay of the signal. It's better than other moving averages like EMA , DEMA , AMA or T3.
There are two ways to decrease noise using JMA . Increasing the 'LENGTH' parameter will cause JMA to move more slowly and therefore reduce noise at the expense of adding 'lag'
The 'JMA LENGTH', 'PHASE' and 'POWER' parameters offer a way to select the optimal balance between 'lag' and over boost.
Green: Bullish , Red: Bearish .
2. Range filter
Created by Donovan Wall, its function is to filter or eliminate noise and to better determine the price trend in the short term.
First, a uniform average price range 'SAMPLING PERIOD' is calculated for the filter base and multiplied by a specific quantity 'RANGE MULTIPLIER'.
The filter is then calculated by adjusting price movements that do not exceed the specified range.
Finally, the target ranges are plotted to show the prices that will trigger the filter movement.
Green: Bullish , Red: Bearish .
3. Average Directional Index ( ADX Classic) and ( ADX Masanakamura)
It's an indicator designed by Welles Wilder to measure the strength and direction of the market trend. The price movement is strong when the ADX has a positive slope and is above a certain minimum level 'ADX THRESHOLD' and for a given period 'ADX LENGTH'.
The green color of the bars indicates that the trend is bullish and that the ADX is above the level established by the threshold.
The red color of the bars indicates that the trend is down and that the ADX is above the threshold level.
The orange color of the bars indicates that the price is not strong and will surely lateralize.
You can choose between the classic option and the one created by a certain 'Masanakamura'. The main difference between the two is that in the first it uses RMA () and in the second SMA () in its calculation.
4. Parabolic SAR
This indicator, also created by Welles Wilder, places points that help define a trend. The Parabolic SAR can follow the price above or below, the peculiarity that it offers is that when the price touches the indicator, it jumps to the other side of the price (if the Parabolic SAR was below the price it jumps up and vice versa) to a distance predetermined by the indicator. At this time the indicator continues to follow the price, reducing the distance with each candle until it is finally touched again by the price and the process starts again. This procedure explains the name of the indicator: the Parabolic SAR follows the price generating a characteristic parabolic shape, when the price touches it, stops and turns ( SAR is the acronym for 'stop and reverse'), giving rise to a new cycle. When the points are below the price, the trend is up, while the points above the price indicate a downward trend.
5. RSI with Volume
This indicator was created by LazyBear from the popular RSI .
The RSI is an oscillator-type indicator used in technical analysis and also created by Welles Wilder that shows the strength of the price by comparing individual movements up or down in successive closing prices.
LazyBear added a volume parameter that makes it more accurate to the market movement.
A good way to use RSI is by considering the 50 'RSI CENTER LINE' centerline. When the oscillator is above, the trend is bullish and when it is below, the trend is bearish .
6. Moving Average Convergence Divergence ( MACD ) and ( MAC-Z )
It was created by Gerald Appel. Subsequently, the histogram was added to anticipate the crossing of MA. Broadly speaking, we can say that the MACD is an oscillator consisting of two moving averages that rotate around the zero line. The MACD line is the difference between a short moving average 'MACD FAST MA LENGTH' and a long moving average 'MACD SLOW MA LENGTH'. It's an indicator that allows us to have a reference on the trend of the asset on which it is operating, thus generating market entry and exit signals.
We can talk about a bull market when the MACD histogram is above the zero line, along with the signal line, while we are talking about a bear market when the MACD histogram is below the zero line.
There is the option of using the MAC-Z indicator created by LazyBear, which according to its author is more effective, by using the parameter VWAP ( volume weighted average price ) 'Z-VWAP LENGTH' together with a standard deviation 'STDEV LENGTH' in its calculation.
7. Volume Condition
Volume indicates the number of participants in this war between bulls and bears, the more volume the more likely the price will move in favor of the trend. A low trading volume indicates a lower number of participants and interest in the instrument in question. Low volumes may reveal weakness behind a price movement.
With this condition, those signals whose volume is less than the volume SMA for a period 'SMA VOLUME LENGTH' multiplied by a factor 'VOLUME FACTOR' are filtered. In addition, it determines the leverage used, the more volume , the more participants, the more probability that the price will move in our favor, that is, we can use more leverage. The leverage in this script is determined by how many times the volume is above the SMA line.
The maximum leverage is 8.
8. Bollinger Bands
This indicator was created by John Bollinger and consists of three bands that are drawn superimposed on the price evolution graph.
The central band is a moving average, normally a simple moving average calculated with 20 periods is used. ('BB LENGTH' Number of periods of the moving average)
The upper band is calculated by adding the value of the simple moving average X times the standard deviation of the moving average. ('BB MULTIPLIER' Number of times the standard deviation of the moving average)
The lower band is calculated by subtracting the simple moving average X times the standard deviation of the moving average.
the band between the upper and lower bands contains, statistically, almost 90% of the possible price variations, which means that any movement of the price outside the bands has special relevance.
In practical terms, Bollinger bands behave as if they were an elastic band so that, if the price touches them, it has a high probability of bouncing.
Sometimes, after the entry order is filled, the price is returned to the opposite side. If price touch the Bollinger band in the same previous conditions, another order is filled in the same direction of the position to improve the average entry price, (% MINIMUM BETTER PRICE ': Minimum price for the re-entry to be executed and that is better than the price of the previous position in a given %) in this way we give the trade a chance that the Take Profit is executed before. The downside is that the position is doubled in size. 'ACTIVATE DIVIDE TP': Divide the size of the TP in half. More probability of the trade closing but less profit.
█ STOP LOSS and RISK MANAGEMENT.
A good risk management is what can make your equity go up or be liquidated.
The % risk is the percentage of our capital that we are willing to lose by operation. This is recommended to be between 1-5%.
% Risk: (% Stop Loss x % Equity per trade x Leverage) / 100
First the strategy is calculated with Stop Loss, then the risk per operation is determined and from there, the amount per operation is calculated and not vice versa.
In this script you can use a normal Stop Loss or one according to the ATR. Also activate the option to trigger it earlier if the risk percentage is reached. '% RISK ALLOWED' wich is calculated according with: '%EQUITY ON EACH ENTRY'. Only works with Stop Loss on 'NORMAL' or 'BOTH' mode.
'STOP LOSS CONFIRMED': The Stop Loss is only activated if the closing of the previous bar is in the loss limit condition. It's useful to prevent the SL from triggering when they do a ‘pump’ to sweep Stops and then return the price to the previous state.
█ ALERTS
There is an alert for each leverage, therefore a maximum of 8 alerts can be set for 'long' and 8 for 'short', plus an alert to close the trade with Take Profit or Stop Loss in market mode. You can also place Take Profit limit and Stop Loss limit orders a few seconds after filling the position entry order.
- 'MAXIMUM LEVERAGE': It is the maximum allowed multiplier of the % quantity entered on each entry for 1X according to the volume condition.
- 'ADVANCE ALERTS': There is always a time delay from when the alert is triggered until it reaches the exchange and can be between 1-15 seconds. With this parameter, you can advance the alert by the necessary seconds to activate it earlier. In this way it can be synchronized with the exchange so that the execution time of the entry order to the position coincides with the opening of the bar.
The settings are for Bitcoin at Binance Futures (BTC: USDTPERP) in 15 minutes.
For other pairs and other timeframes, the settings have to be adjusted again. And within a month, the settings will be different because we all know the market and the trend are changing.
ابحث في النصوص البرمجية عن "bot"

ADOL_ BOT SYSTEM(ABS)English))
ADOL_ BOT SYSTEM(ABS) : : Entry, Stop Loss, Profit Loss (Liquidation), Breakthrough, Push/Rebound, Support/Resistance, Wave Assistance, Trend Line Assistance, Momentum (Intensity) Signals All indicators //
Concept tree)
Entry) Long is the entry of long, and the short is the entry of short. Start trading after the signal generation peak ~ the next peak. H is the standard for HH breakthrough long and L is for LL breakthrough shot.
Stop loss) The low/high point of the signal bar becomes the stop loss at the time of entry (consider continuous flow). If the wave suddenly breaks before you start doing a profit, a stop loss or a full cut is recommended.
Liquidation) L Blue is a recommended spot for long liquidation and S Blue is a short liquidation. Even if you trade according to the trend, it is recommended to liquidate in installments (or total liquidation) when a liquidation signal occurs.
Use) You can draw a trend line according to the wave flow. The small shape of the wave assists the flow of the wave. Check the down-long and up-short signals, and determine the advantageous section.
Support/Resistance) The support/resistance line is a high probability of an inflection point, but it is often the baseline for a limit trade because it can be retested.
Application) The support/resistance line exerts a strong effect when it is overlapped with the ghost candle and box circle.
Explained by chart:
한국어))
아돌봇시스템(ABS) : : 진입, 손절, 익절(청산), 돌파, 눌림/반등, 지지/저항, 파동보조, 추세선 보조, 모멘텀(강도) 신호 전부 표시기 //
개념트리)
진입) 롱은 롱의 진입, 숏은 숏의 진입 시그널입니다. 시그널 발생봉 ~ 다음봉 이후 거래를 시작합니다. H는 HH돌파롱, L은 LL돌파숏의 기준이 됩니다.
손절) 시그널봉의 저점/고점은 진입시의 손절가가 됩니다(연속된 흐름 고려). 익절을 하기전에 갑자기 웨이브가 깨지면 손절이나 본절이 추천됩니다.
청산) L청은 롱의 청산, s청은 숏의 청산 추천자리입니다. 추세를 따라 트레이딩을 하더라도 청산시그널 발생시 분할청산(or전량청산)을 권장합니다.
활용) 웨이브의 흐름에 맞춰 추세선 긋기를 할 수 있습니다. 웨이브의 작은형은 파동의 흐름을 보조합니다. 내림롱, 오름숏 시그널을 확인하고, 유리한 구간을 판단합니다.
지지/저항) 지지/저항선은 높은 확률의 변곡점이지만, 종종 리테스트를 할 수 있기 때문에 지정가 매매의 기준선이 됩니다.
응용) 지지/저항선은 고스트캔들, 박스권과 중첩시 강력한 효과를 발휘합니다.
차트로 설명 :
use and more strategy - send PM (더 많은 전략과 사용 - PM보내기) ▼ ▼ ▼ ▼

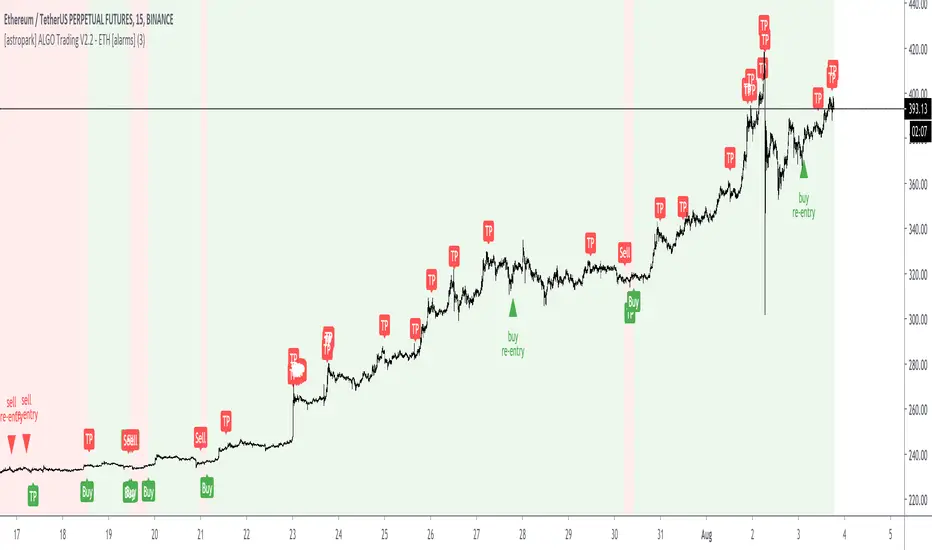
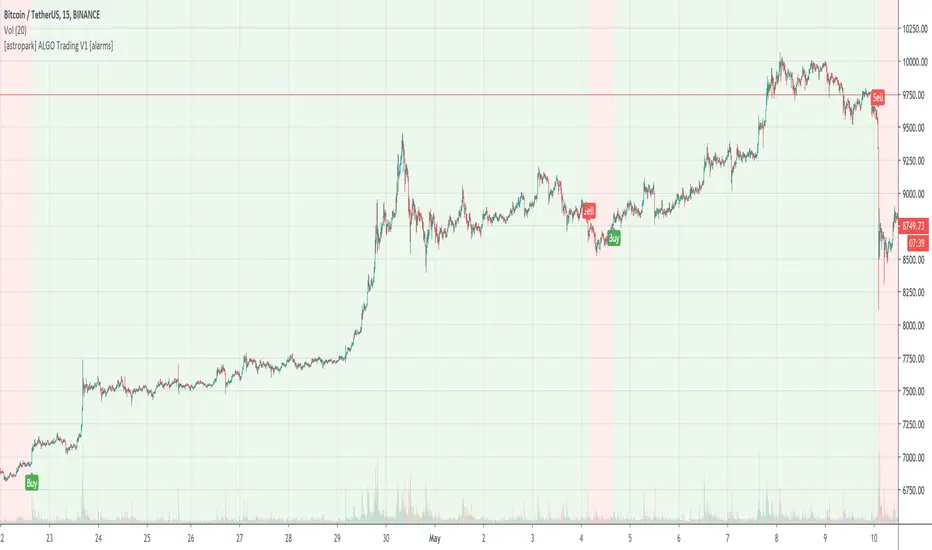
[astropark] ALGO Trading V2.2 - ETH [alarms]Dear Followers,
today another awesome Swing and Scalping Trading Strategy indicator : the upgraded version of ALGO Trading V2 for Binance Ethereum PERP on 15m timeframe!
It is runnable on a bot , just write me in order to help you do it.
If you are a scalper or you are a swing trader, you will love suggested entries for fast and long-lasting profit.
Keep in mind that a proper trailing stop strategy and risk management and money management strategies are very important (DM me if you need any clarification on these points).
This is an upgrade version of ALGO Trading V2 for Ethereum.
You can find ALGO Trading V2 indicator here below:
If you are interested in Bitcoin Trading, you will like for sure ALGO Trading V1.2, which is a customized version for Bitcoin trading:
This strategy has the following options:
enable/disable signals on chart
enable/disable bars and background coloring based on trend
enable/disable a Filter Noise option, which reduces overtrading
enable/disable a Trailing Stop option
enable/disable/config a Take Profit option, with Re-Entry
enable/disable a secret Smart Close Option which may improve profit on your chart (again, check it on you chart if it helps or not)
This strategy only trigger 1 buy (where to start a long trade) or 1 sell (for short trade). If you enable Take Profit / Stop Loss option, consider that many TP can be triggered before trend reversal, so take partial profit on every TP an eventually buy/sell back lower/higher on RE-ENTRY signal to maximize your profit.
This script will let you set all notifications you may need in order to be alerted on each triggered signals.
The one for backtesting purpose can be found by searching for the astropark's "ALGO Trading V2.2" and then choosing the indicator with "strategy" suffix in the name, or you can find here below:
This is not the "Holy Grail", so use proper money and risk management strategies.
This is a premium indicator , so send me a private message in order to get access to this script.
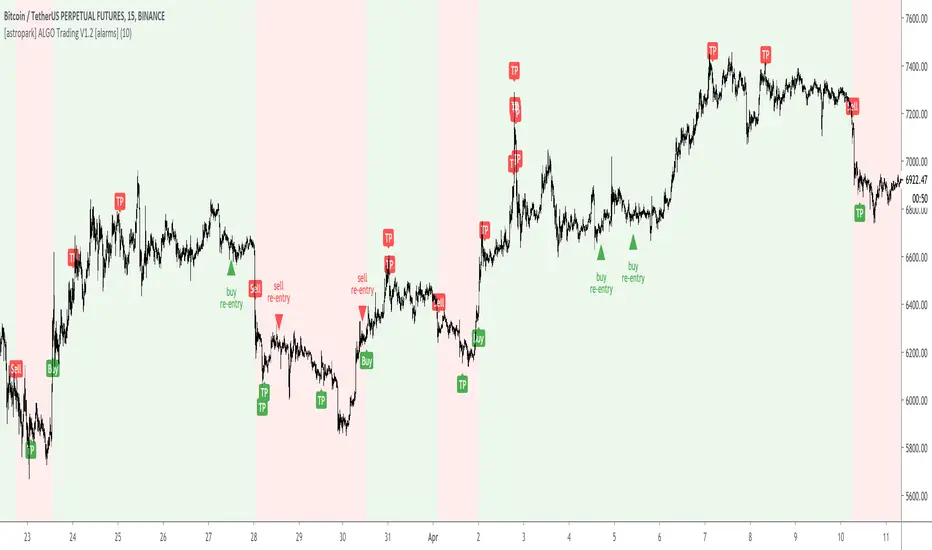
[astropark] ALGO Trading V1.2 [alarms]Dear Followers,
today another awesome Swing and Scalping Trading Strategy indicator : the upgraded version of ALGO Trading V1 for Binance Bitcoin PERP on 15m timeframe!
It is runnable on a bot , just write me in order to help you do it.
If you are a scalper or you are a swing trader, you will love suggested entries for fast and long-lasting profit.
Keep in mind that a proper trailing stop strategy and risk management and money management strategies are very important (DM me if you need any clarification on these points).
This strategy has the following options:
enable/disable signals on chart
enable/disable bars and background coloring based on trend
enable/disable a Filter Noise option, which reduces overtrading
enable/disable a Trailing Stop option
enable/disable/config a Take Profit option, with Re-Entry
enable/disable a secret Smart Close Option which may improve profit on your chart (again, check it on you chart if it helps or not)
This strategy only trigger 1 buy (where to start a long trade) or 1 sell (for short trade). If you enable Take Profit / Stop Loss option, consider that many TP can be triggered before trend reversal, so take partial profit on every TP an eventually buy/sell back lower/higher on RE-ENTRY signal to maximize your profit.
This is not the "Holy Grail", so use proper money and risk management strategies.
This indicator will let you set all alerts you need in order to get notified whenever a new signal is triggered.
To check its backtesting, you should use the strategy version, that you can find by searching for "ALGO Trading V1.2" or here below:
You can check out previous ALGO Trading V1 indicator here below:
This is a premium indicator , so send me a private message in order to get access to this script.
ck - EMA Cross with AlertsDisplays 5 popular EMAs (you can hide any you don’t want to see from the “Styles” screen when editing the config).
Set the values for your EMAs by clicking the cog after adding this indicator to your chart.
A Long or Short signal is fired when EMA1 crosses EMA2 - a cross up is a Long signal, a cross down is a Short signal.
Connect to your Bots (3commas / 3C.exchange recommended) to automate buys and sells!

[astropark] VWAP Crosses [alarms]Dear Followers,
today a new Swing and Scalping Strategy based on WVAP , mainly designed for Bitcoin and High-Cap Cryptocurrencies, like Ethereum. It works also on Forex and Stocks.
It works great since 15m and above till 1D. I suggest you to use it on 15m, 30m or 1h timeframes .
VWAP or "Volume Weighted Average Price" is a volume-based indicator similar to a moving average.
This trading indicator is used to identify market resistance and support levels and is represented as a weighted average price for the treaded volumes.
My strategy will help you identify main support-resistance level to be careful of and it will trigger a buy or a sell depending on how price will intereact with vwaps.
green means we are in a bullish trend, in fact it start with a "buy" signal
red means we are in a bearish trend, in fact it start with a "sell" signal
blue means we are in a moment where trend may change, so be careful and always remember that taking profits is awesome and have a stoploss is a must in trading
The user who wants to use this strategy, especially via an automated bot, must always set a stoploss (example 150$ from entry on bitcoin) or use a proper risk management strategy .
This is not the "Holy Grail", so use it with caution. It's highly suggested to use a proper money management .
This script will let you set all notifications you may need in order to be alerted on each triggered signals.
The one for backtesting purpose can be found here below:
This is a premium indicator , so send me a private message in order to get access to this script.

BTC GRID bot Visualisation. 31 steps/100USDT, simple adjustableBTC GRID bot Visualisation. 31 steps/100USDT, simple adjustable

Savvy Trader BotThis Script uses Customized Indicators that includes price action to determine direction. The Indicator allows full control of settings that allows you to trade a wide range of markets. This indicator has been checked against Cryptocurrencies and Forex. The indicator will print a long or short signal for entry along with a Moving Stoploss and two Take profit targets.

BoilerRoomColdCaller - 3Commas Grid Bot SignalThis is very similar to 3Commas' grid bot, the range is from the previous 7 days' lowest low decreased by 3% to the previous 7 days' highest high increased by 3%, you can also adjust if you want 7 days' highest/lowest close price as your range or highest high and lowest low as your range. 10 buys and 10 sells within the range, the unit price would be (high-low)/19.
The buy signals and the sell signals will be triggered if:
- The previous close is below one specific green line (buy line), and the current close is above that specific green line, or
- The previous close is above one specific green line (buy line), and the current close is below that specific green line
Thus, whether the price is dropping below these lines or rising above these lines, a buy or sell signal will be triggered when they cross green or red lines. Your entry price will be the next open price after this candle's close reaches the lines.
Big thanks to @glaz, who helped me a lot with this script. Please give a like button and share if you like this script. Let me know if you have questions, thanks guys.

Gridbot visualizor and advisor V1.0This scripts visualizes the buy and sell levels as used by gridbots.
It also gives you some recommended settings if you want to use manual mode instead of AI mode, based on timeframe, target grid size etc.
The inputs should be pretty much self explanatory, if you have any questions feel free to drop me a message below.
Have fun, be healthy and profitable!
Jurgenvv ( aka CryptoJur)
This script uses some code or ideas from:
ck-3commas-GRID-bot-Visualisation by ChrisKaye.
How to make the status box to the right was learned from Daveatt his scripts.

Pump AlertsMy very first indicator in Pine Script with two alert conditions for trading bots.
It's based on " Pump Catcher " by @ joepegler
I modified some parts, hopefully improved the usability and enabled alerts, so you can use it to trigger bots like 3commas via webhooks.
Pump Alerts 🚀 attempts to "detect moments of abnormal and accelerating increase in volume" AKA "pumps". Small and big pumps.
I recommend using it on small timeframes like 1 to 15 min and tinkering with the lookback period as well as threshold values.
Other than that it's pretty self-explanatory and beginner-friendly.
Free and Open Source. Let me know how you use it!

[astropark] ALGO Trading V3 [alarms]Dear Followers,
today another awesome Swing and Scalping Trading Strategy indicator, runnable on a bot , which works great on many timeframes (from 1h and above is suggested), just write me in order to help you find correct settings).
It must be said that this strategy works even better on 1m Renko chart!
If you are a scalper or you are a swing trader, you will love suggested entries for fast and long-lasting profit.
Keep in mind that a proper trailing stop strategy and risk management and money management strategies are very important (DM me if you need any clarification on these points).
This is not an evolution of "ALGO Trading V1" or "ALGO Trading V2" , but a twin sister of them.
For your reference, here it is the "ALGO Trading V1" indicator
and here the "ALGO Trading V2"
This strategy has the following options:
enable/disable signals on chart
enable/disable bars and background coloring based on trend
enable/disable a "filter noise" option , which try to reduce overtrading (you can easily check it on backtesting)
enable/disable a Take Profit / Stop Loss option (you can easily check it on backtesting too)
enable/disable a secret SmartOption which may improve profit on your chart (again, check it on you chart if it helps or not)
This strategy only trigger 1 buy or 1 sell. If you enable Take Profit / Stop Loss option, consider that many TP can be triggered before trend reversal, so take partial profit on every TP an eventually buy/sell back lower/higher to maximize your profit.
This script will let you set all notifications you may need in order to be alerted on each triggered signals.
The one for backtesting purpose can be found by searching for the astropark's "ALGO Trading V3" and then choosing the indicator with "strategy" suffix in the name, or you can find here below
Strategy results are calculated on the time window from 1995 to now, so on more than 15 years, using 1000$ as initial capital and working at 1x leverage (so no leverage at all! If you like to use leverage, be sure to use a safe option, like 3x or 5x at most in order to have liquidation price very far).
This is not the "Holy Grail", so use a proper risk management strategy.
This script will let you backtest how the indicator will perform on any chart and timeframe you may like to test and/or trade. Of course results will be very different depending on the chart and timeframe you will open. I tested a lot of charts and always you can find a combination that keep this strategy in profit on swing trading style (and this means that if you can have a daily look at the chart you can always manage to maximize your profit on each trade!)
This is a premium indicator , so send me a private message in order to get access to this script.

[astropark] ALGO Trading V2 [alarms]Dear Followers,
today another awesome Swing and Scalping Trading Strategy indicator, runnable on a bot , which works great on many timeframes (ones between 1h and 1D are suggested, but just write me in order to help you find correct settings).
It must be said that this strategy works even better on 1m Renko chart!
If you are a scalper or you are a swing trader, you will love suggested entries for fast and long-lasting profit.
Keep in mind that a proper trailing stop strategy and risk management and money management strategies are very important (DM me if you need any clarification on these points).
This is not an evolution of "ALGO Trading V1" or "ALGO Trading V3" , but a twin sister of them. Search them on TradingView to know them better.
Here you can find ALGO Trading V1
This strategy has the following options:
enable/disable signals on chart
enable/disable bars and background coloring based on trend
enable/disable a "filter noise" option , which try to reduce overtrading (you can easily check it on backtesting)
enable/disable a Take Profit / Stop Loss option (you can easily check it on backtesting too)
enable/disable a secret SmartOption which may improve profit on your chart (again, check it on you chart if it helps or not)
This strategy only trigger 1 buy or 1 sell. If you enable Take Profit / Stop Loss option, consider that many TP can be triggered before trend reversal, so take partial profit on every TP an eventually buy/sell back lower/higher to maximize your profit.
This script will let you set all notifications you may need in order to be alerted on each triggered signals.
The one for backtesting purpose can be found by searching for the astropark's "ALGO Trading V2" and then choosing the indicator with "strategy" suffix in the name, or you can find here below
Strategy results are calculated on the time window from January 2018 to now, so on more than 2 years, using 1000$ as initial capital and working at 1x leverage (so no leverage at all! If you like to use leverage, be sure to use a safe option, like 3x or 5x at most in order to have liquidation price very far).
This is not the "Holy Grail", so use a proper risk management strategy.
This is a premium indicator , so send me a private message in order to get access to this script.

[astropark] ALGO Trading V1 [alarms]Dear Followers,
today another awesome Swing and Scalping Trading Strategy indicator, runnable on a bot , which works great on Low Timeframes (1h is suggested) but also on even lower ones (till 15m) and on higher ones (no further than 1D), just write me in order to help you find correct settings).
It must be said that this strategy works even better on 1m Renko chart!
If you are a scalper or you are a swing trader, you will love suggested entries for fast and long-lasting profit.
Keep in mind that a proper trailing stop strategy and risk management and money management strategies are very important (DM me if you need any clarification on these points).
This is not an evolution of "ALGO Trading V2" or "ALGO Trading V3" , but a twin sister of them. Search them on TradingView to know them better.
This strategy has the following options:
enable/disable signals on chart
enable/disable bars and background coloring based on trend
enable/disable a "filter noise" option , which try to reduce overtrading (you can easily check it on backtesting)
enable/disable a Take Profit / Stop Loss option (you can easily check it on backtesting too)
enable/disable a secret SmartOption which may improve profit on your chart (again, check it on you chart if it helps or not)
This strategy only trigger 1 buy or 1 sell. If you enable Take Profit / Stop Loss option, consider that many TP can be triggered before trend reversal, so take partial profit on every TP an eventually buy/sell back lower/higher to maximize your profit.
This script will let you set all notifications you may need in order to be alerted on each triggered signals.
The one for backtesting purpose can be found by searching for the astropark's "ALGO Trading V1" and then choosing the indicator with "strategy" suffix in the name, or you can find here below
Strategy results are calculated on the time window from January 2019 to now, so on more than 1 year, using 1000$ as initial capital and working at 1x leverage (so no leverage at all! If you like to use leverage, be sure to use a safe option, like 3x or 5x at most in order to have liquidation price very far).
This is not the "Holy Grail", so use a proper risk management strategy.
This is a premium indicator , so send me a private message in order to get access to this script.
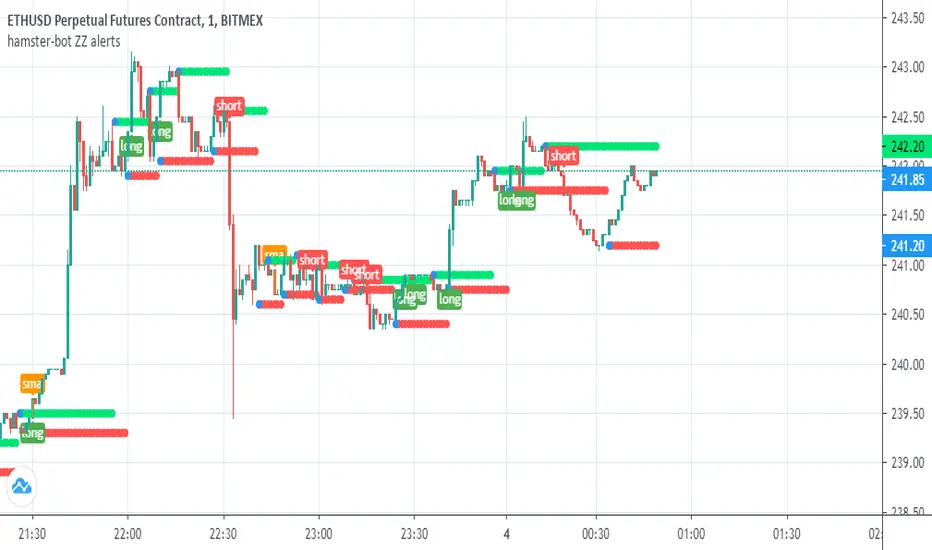
Hull Suite alerts hamster-botThis is a trading strategy on the Hull Suite indicator. 3 Hull variations: HMA , THMA (3HMA), EHMA. The strategy is always in position according to the trend of the indicator. Alerts now work.

NiLUX Trend Scalper TSSL (Alerts)Trend Following Scalping Bot
Great results on pretty much any pair and timeframe
Features:
Dynamic Trend Detection
Long / Short Scalp Alerts
Take Profit (Trailing Stop) & Stop Loss Alerts
TP/SL Plots for Profitview included
This is Donationware 🍺
Leave me a tip, you decide the amount, then send me a DM to get access.
The link to my tip jar is below in the signature

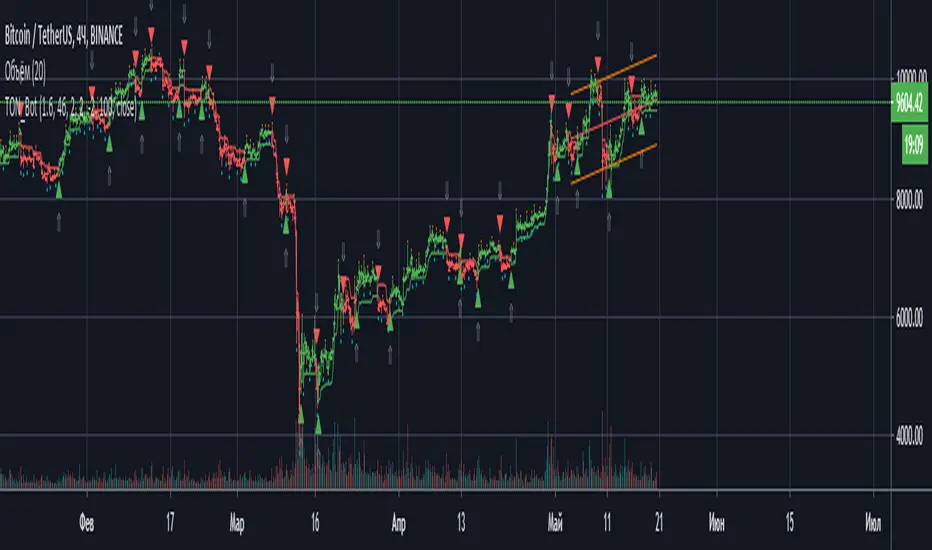
TON BotThis script is based on mathematical calculations of the average price on a chart for a certain period of time. And it shows the impulse moments on a U-turn.
It is recommended to use an indicator (script) using a chart with a time frame of 1 hour. On other timeframes, you can also use it for medium-term trend trading and change some settings.
The indicator (script) is well suited for intraday trading strategy, scalping and short-term medium-term. Inside the day, on the 1 hour timeframe, the indicator determines high and low price values. You must also take into account the direction of the trend on older timeframes, since in the lateral movement the flat indicator can (locally) mislead you.
An interesting characteristic of this (script) bot is the ability to configure alert alerts from the chart in the Telegram channel, that's why it is called that.
Recommended for use with additional technical analysis tools.
Before applying this indicator, be sure to study its behavior on the history of the chart!
HXRO Bot Backtest Time HighlightThis script allows you to highlight the HXROBot backtest interval with the possibility of fragmenting the view to better identify the key areas of your strategy

UT Bot No scammers allowed. I protect CT
This dude on Twitter @TradingScript(UT Bot) tried to take this free script and sell it.
All the inputs he put in are there to make it look complex and don't actually do anything.
The only thing that changes is "Key Value". This is the ATR multiplier and in basic terms determines the sensitivity on the indicator. The original setting by HPotter is 3.5 multiplier (key vaule) and an ATR period of 5.
So yeah I recreated the script.
**If you compare this to that scammers script 95% of the signals are the same, I don't know the exact setting he used..
**HPotter is a Legend