Extended Recursive Bands - Maximum Efficiency With Extra OptionsIntroducing A New Calculation For Efficient Bands Calculation !
Here it is ! The Recursive Bands Indicator, an indicator specially created to be extremely efficient, i think you already know that calculation time is extra important in algorithmic trading, and this is the principal motivation for the creation of the proposed indicator. Originally described in my paper "Pierrefeu, Alex (2019): Recursive Bands - A New Indicator For Technical Analysis" , the indicator framework has been widely used in my previous uploaded indicators, however it would have been a shame to not upload it, however user experience being a major concern for me, i decided to add extra options, which explain the term "extended".
On The Indicator Calculation
You can skip this part if it doesn't interest you. The calculation of the indicator is based on recursion, but i want to explain the mathematical formula described in the paper.
I've seen some users trying to remake it from the calculations, however there was always something weird, and i understand, mathematical notations are always a bit weird, even myself don't always write them correctly/understand them, however this one is relatively simple to understand.
First lets explain each elements of the calculation :
α = smoothing constant, or 2/(length+1)
max/min = maximum and minimum function, max return the greatest input value while min return the lowest one, for example :
max(4,2) = 4 while min(4,2) = 2
the "||" notation mean taking the absolute value, for example : |-1| = abs(-1) = 1
The calculation after the max/min function is called the correction factor, and is the core of the indicator. The last two variables are just here to provide an initial value for upper and lower, basically when we start our calculations we will assign the value of the closing price for upper and lower.
The motivation behind using a smoothing constant in range of (0,1) was to tell the reader that the indicator is easily made adaptive, this is what i did on my adaptive trailing stop indicator by using the efficiency ratio as smoothing variable, the user can use 1/length instead of the provided calculation for alpha.
If you interested on the indicator main logic, it is actually really simple, by using upper = max(price,upper) and lower = min(price,lower) we would get the maximum/minimum price value at time t , therefore upper can only be greater or equal than its precedent value, while lower can only be lower or equal than its precedent value, in order to fix that we subtract/sum upper/lower with a value, this allow the upper band to be lower than its precedent value and lower to be greater than its precedent value, this is the role of the correction factor.
The Indicator
The indicator display one upper and one lower band, every common usages applied to bands indicators such as support/resistance, breakout, trailing stop...etc, can also be applied to this one. length control how reactive the bands are, higher values of length will make the bands cross the price less often.
In order to provide more flexibility for the user i added the option to use various methods for the calculation of the indicator, therefore the indicator can use the average true range, standard deviation, average high-low range, and one totally exclusive method specially designed for this indicator.
Classic Method
This option make the indicator use its classical calculation, this is the most efficient method of all.
Atr Method (atr)
This method use the average true range as correction factor, notice that lower values of length can still produce wide band.
Standard Deviation Method (stdev)
This method use a biased estimate of the standard deviation as correction factor.
The method produce smoother bands that converge more slowly toward the price in comparison with the classic correction factor.
Average High-Low Range Method (ahlr)
This method use the average of the high-low range as correction factor, extremely similar to the average true range.
Rising Falling Volatility (rfv) Method
A new method created for this indicator, this correction factor use the absolute prices changes when price value is greater/lower than any length past values of the price, this allow to have more boxy shaped bands, work best with greater values of length.
The bands can be in contact with this method, a possible fix in the future.
Conclusion
The recursive band indicator is one of my greatest indicators in my opinion (i would love to have yours), as you can see the idea behind it is extremely simple and allow for a super efficient band indicator, which was the original motivation behind it, in order to provide more fun for the users i also added more option for the correction factor, this allow the user to be creative and not get stuck with the original calculation.
Like the trend step indicator family we have almost ended our series on the recursive band framework, 1 more trailing stop will be added in the future, and then we'll have more "boring" stuff until i find something cool again, it shouldn't be long ;)
Thanks for reading !
ابحث في النصوص البرمجية عن "breakout"

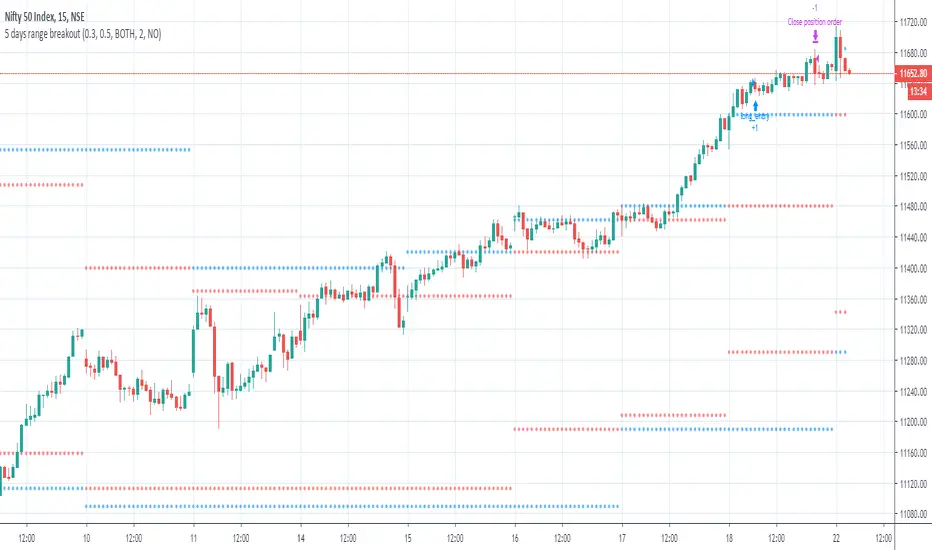
X Period High/Low/MidToday we have a simple, but endlessly versatile, indicator that plots the X Period High/Low/Mid of your chosen market.
Traditionally the 52 week High/Low is used as a breakout signal. However, by changing to an X period, and adding a midway line, we create a more versatile indicator that can be tailored to various markets.
By default it's set at 250 periods (because I like the 250 period moving average), and I generally trade H4 and Daily time frames. But tweak it to your liking, you just have to modify the length periods by your desired time frame and lookback length. E.g. to create a 52 week indicator on the daily time frame, enter a length of 260 in the indicator (5 days per week * 52 weeks = 260).
For the above reason, I haven't made this indicator MTF, as there's no real need. However, if users find it easier I can look at adding it later.
Also, the mid point between an X period high/low is often a good trend-follower, as well as acting as support/resistance . I encourage you to experiment with different ways of using this indicator. Entire systems (if your risk management is correct) can be built and traded from this one indicator.
Good luck.
DD

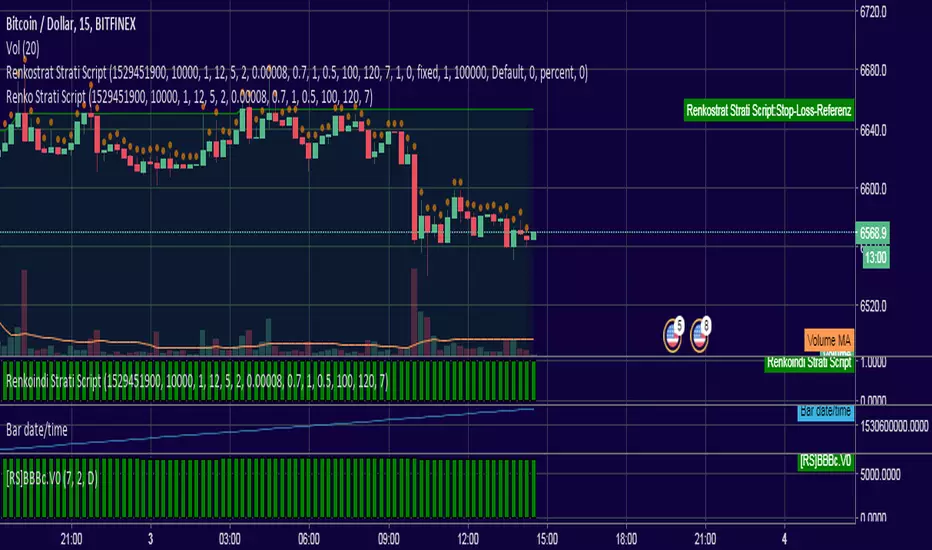
Lancelot RR StrategyDear all,
Free strategy again.
This strategy consists of 2 indicators I think works well with each other as a trend following strategy.
The 2 indicators are Renko chart and Relative Vigor Index.
This is a long-only breakout strategy that aims to capture the majority of the trend.
Works well on BTCUSD XBTUSD, as well as other major liquid Pair.
Please acknowledge my effort by like and follow.
And lastly,
Save Hong Kong, the revolution of our times.

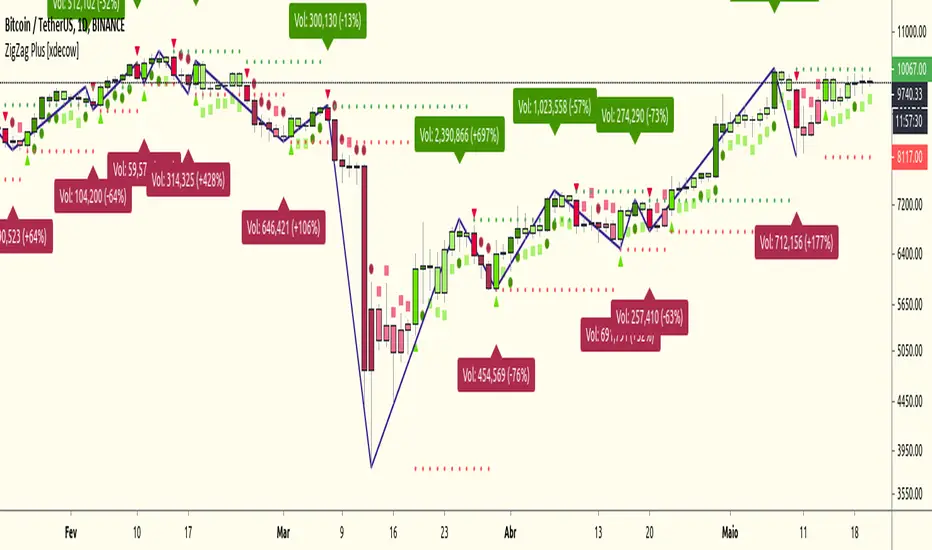
ZigZag Plus [xdecow]A ZigZag Like based on candle close.
A lot of options that can be hide in options.
Triangle/bright - reversal confirmation candle
Circle/dark - higher/lower candle breakout
Square/light - Insidebar
Rounded Bottom Breakout Strategy Moving Averages20-day SMA , 34-day EMA , 50-day SMA and 200-day SMA moving average indicator based on Rick Saddler's Rounded Bottom Reversal Breakout Strategy

Flagging BandsIntroduction
A pun between the word flag and the adjective flagging (less dynamic) , this indicator have two bands who react faster when in contact to the price. Imagine you are under sheets, if you abruptly rise, the sheets will instantaneously go up, then if you abruptly get down, the sheets will fall slowly until being in contact with a surface, this is because of a type of friction called drag or air resistance , this force is described in fluid dynamics and i inspired myself from that for the creation of the indicator.
The indicator
The indicator is made of two bands, one upper band and one lower band, then a weighted average of each bands, this average is weighted depending on which band the price is closer. The length control the period of the indicator, in general higher lengths will create wider bands, you must consider that this parameter behave differently than other ones and may create slower results in comparison with other bands indicators while having the same length period.
The indicator can use a simple breakout methodology (see trailing stop part) but can sometime provide support and resistance points, in fact i believe that when the average variability/volatility of band A is higher than the average variability/volatility of band B and that the price cross band B then price will reverse its direction, this claim is not justified, research is needed.
Trailing Stop Mod
It is possible to make the indicator act as a trailing stop, in order to do so just tick the trailing stop mod box.
The average/bands will automatically disappear being replaced by the trailing stop.
Conclusion
I was just playing around when making the skeleton of the indicator, i hope the code is easy to understand, if you need some kind of explanation just pm me, i'm always open to help people/receive suggestions.
Best Regards

Ichimoku A/D Breakoutthis is basically a clone of the super a/d indicator but we're using a standard ichimoku as the source for the trend instead of the supertrend indicator

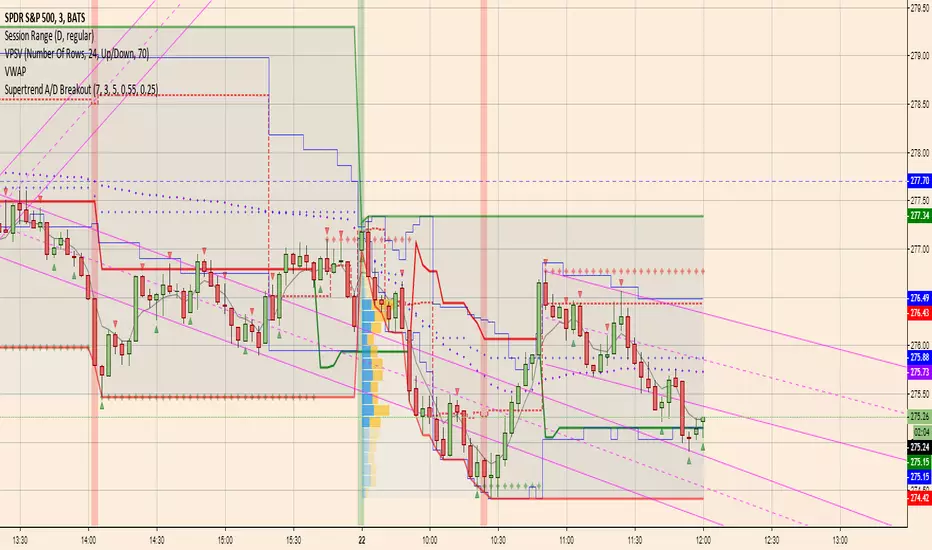
Supertrend A/D BreakoutModified Hoffman A/D:
1. uses standard supertrend to determine up/down direction (previous version used ema crossover)
2. uses improved A/D candlestick patterns
I'm optimistic about this one
Toby Crabel's narrow range with historical volatility1. Find bar with the smallest narrow range for a chosen period. Use hvol for filter.
2. Place stop-order for long position at previous high and stop-order for short at previous low to catch breakout in any direction.
3. Take profit on the next bar.

Hour breakout modelHi guys, this is my first script and i need help to upgrade it
I'm sure this work better if:
1) the breakout line green and red are the max and min of the "time window" between 03 00 and 07 00 (and not only 03 00 like now)
2) put stoploss on the redline for long, and on greenline for short
Thx for any help

High Low ChannelBasic high and low channels, allows for two high and two low channels of specified lengths.
Use for channel breakout trades, basic idea is to go long when the longer high channel is broken and close when shorter low channel is broken, vice versa for shorts
Feel free to leave me a tip if you like this script: 1MprT7YEEWaM6bUcpD7eeHM3Ht8n3R5jP1


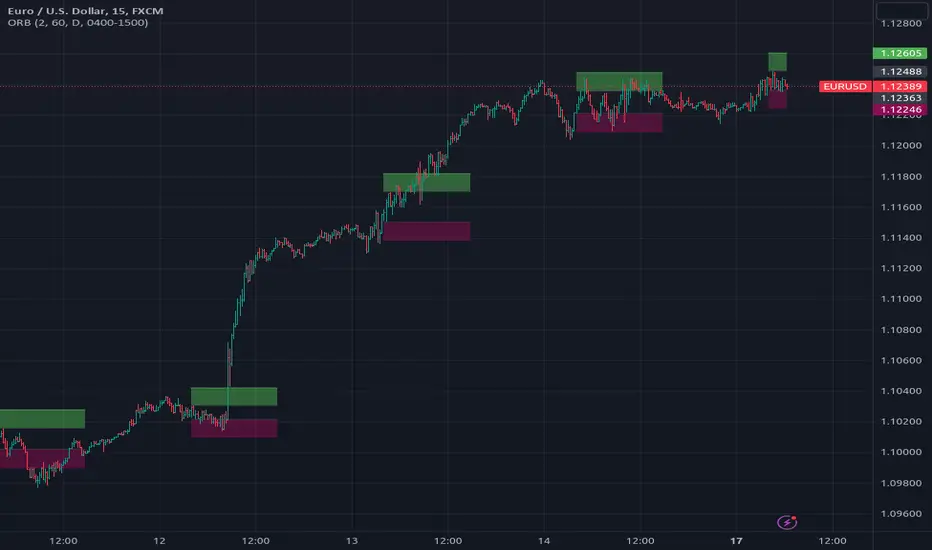
[RS]Open Range Breakout V3Request for DCC/coondawg71
added support for using session.
theres a issue with the session it needs to have the format inverted:
(start-end) to (end-start)
'0000-1500' to '1500-0000'
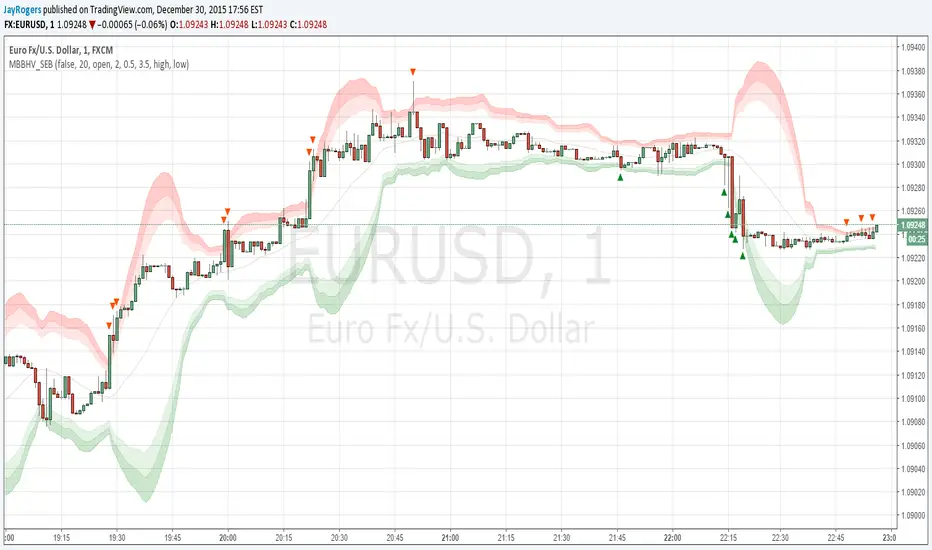
Multi BB Heat Vis - SMA/EMA/Breakout - r2I don't expect to iterate any further on this script, unless any weird issue crops up.
Description and usage detailed in the comments at the top of the script. Cheers!
To repaint or not to repaint, all the relevant sources are exposed as inputs for customisation - so the choice is yours.
Cheers!
CamarillaStrategy -V1 - H4 and L4 breakout - exits addedExits added using trailing stops.
2.6 Profit Factor and 76% Profitable on SPY , 5M - I think it's a pretty good number for an automated strategy that uses Pivots. I don't think it's possible to add volume and day open price in relation to pivot levels -- that's what I do manually ..
Still trying to add EMA for exits.. it will increase profitability. You can play in pinescript with trailing stops entries..


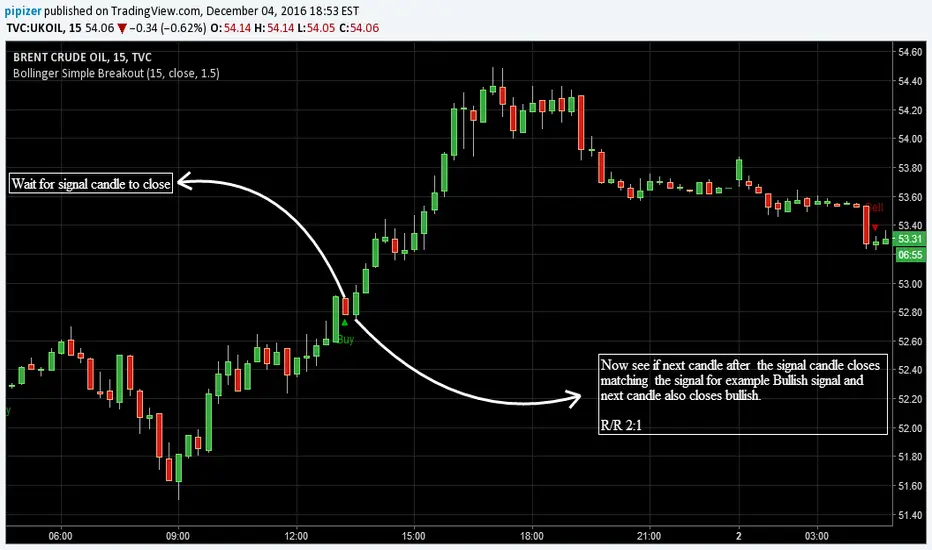
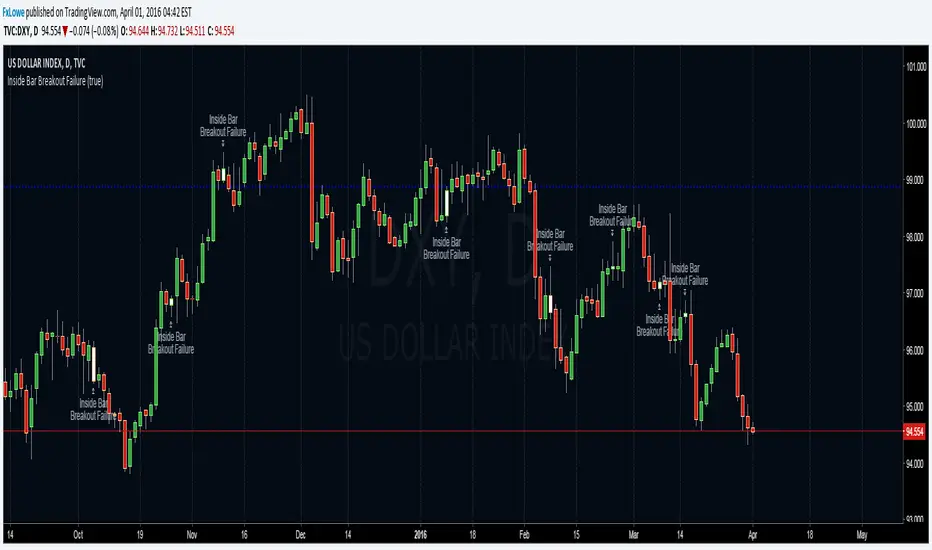
Fakey pattern (Inside Bar False Breakout)Inside Bar + False-Breakout = Fakey pattern
A Fakey pattern can have a pin bar as the false-break bar or not. Fakey’s are a very important and potent price action trading strategy because they can help us identify stop-hunting and provide us with a very good clue as to what price might do next.

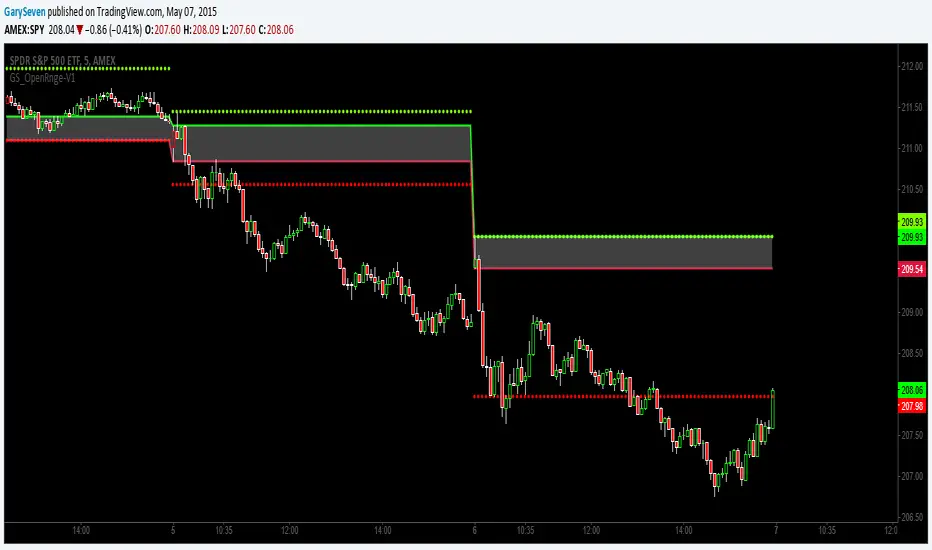
GS_Opening-Range-V1ORB Opening Range Breakout 5 and 3O Minute Indicator
Kudos to Chris Moody for the inspiration to create my first indicator.
The 5 and 30 run together at times but the scalp would be when the equity breaks the 5 go long or short for the scalp and when it breaks the 30 go for the swing trade.
Volatility Resonance CandlesVolatility Resonance Candles visualize the dynamic interaction between price acceleration, volatility, and volume energy.
They’re designed to reveal moments when volatility expansion and directional momentum resonate — often preceding strong directional moves or reversals.
🔬 Concept
Traditional candles display direction and range, but they miss the energetic structure of volatility itself.
This indicator introduces a resonance model, where ATR ratio, price acceleration, and volume intensity combine to form a composite signal.
* ATR Resonance: compares short-term vs. long-term volatility
* Acceleration: captures the rate of price change
* Volume Energy: reinforces the move’s significance
When these components align, the candle color “resonates” — brighter, more intense candles signal stronger volatility–momentum coupling.
⚙️ Features
* Adaptive Scaling
Normalizes energy intensity dynamically across a user-defined lookback period, ensuring consistency in changing market conditions.
* Power-Law Transformation
Optional non-linear scaling (gamma) emphasizes higher-energy events while keeping low-intensity noise visually subdued.
* Divergence Mode
When enabled, colors can invert to highlight energy divergence from candle direction (e.g., bearish pressure during bullish closes).
* Customizable Styling
Full control over bullish/bearish base colors, transparency scaling, and threshold sensitivity.
🧠 Interpretation
* Bright / High-Intensity Candles → Strong alignment of volatility and directional energy.
Often signals the resonant phase of a move — acceleration backed by volatility expansion and volume participation.
* Dim / Low-Intensity Candles → Energy dispersion or consolidation.
These typically mark quiet zones, pauses, or inefficient volatility.
* Opposite-Colored Candles (if divergence mode on) → Potential inflection zones or hidden stress in the trend structure.
⚠️ Disclaimer
This script is for educational purposes only.
It does not constitute financial advice, and past performance is not indicative of future results. Always do your own research and test strategies before making trading decisions.
