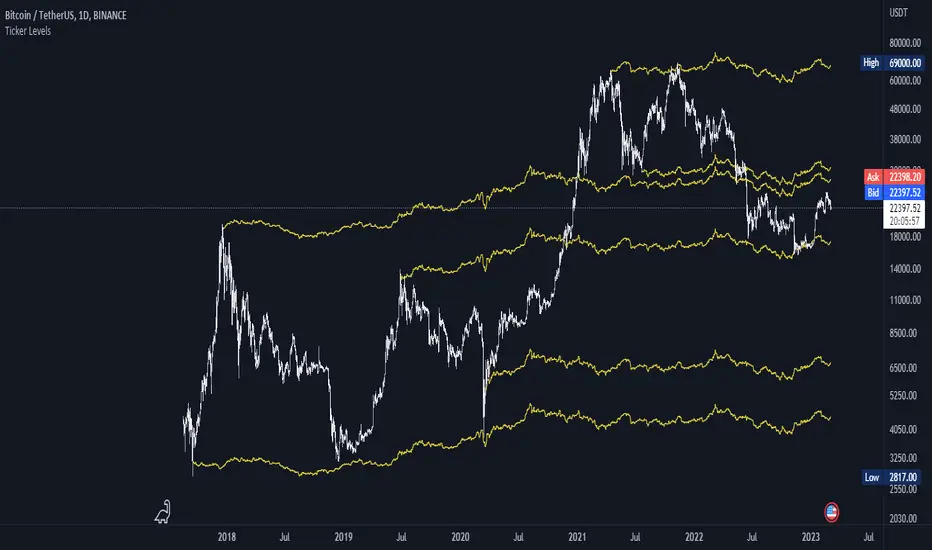
Ticker Ratio LevelsIndicator for constructing levels of price ratios from other tickers.
The user can choose from predefined tickers such as Gold(XAU), DXY, BTC, etc.
How it works:
Takes the important extremum of the closing candle from your current chart and builds a level based on the chart selected in the settings.
This function allows you to determine the price level based on the current price and the price at the time of a certain date. To do this, it first determines the time when the last candle before the specified date occurred. Then the price at the time of this candle and at the current moment is calculated. Finally, the price level is calculated relative to the price at the time of the candle. The result of this calculation will be the price level.
How to Use:
By default, the indicator is set to 1D for the BTC chart. But you can adjust any levels on the assets you are interested in.
You can adjust the levels both in the settings and by moving them around the chart.
Simply click on the indicator name or level, and vertical lines will appear, which you can drag to any location. (The vertical lines serve as the beginning of the calculation point)
Example of work on ETH paired with DXY.
ابحث في النصوص البرمجية عن "btc期权交割时间"
Rotational Gravity OscillatorMade using elements from two Cheatcountry scripts:
Includes a Bollinger Band for bounds that forms a trend follower based on the 0 point.
Includes CheatCountry color code signals, different color scheme. Bright colors are strong signals, ark are weak, green bull, red bear, the basics.
Switches for Bollinger Band color codes, which can actually be useful signals.
This oscillator can be used for divergences, trends, signal strength, confirmation, volatility readings, you name it.
It is a comparative oscillator, that compares adaptively smoothed, weighted modified Change of Gravity oscillators between 2 symbols and multiple lengths to determine directional momentum as one asset compares to another.
The default uses the Crypto TOTAL market cap to help trade cryptocurrencies. You will notice that BTC will give sell signals in uptrends at times. That is because it is being compared to an index of the total Crypto market cap, and since alt-coins move faster, BTC will lag behind this index.
Give CheatCountry a follow, hes one of the MVPs of Tradingview Pinescripters, constantly giving us access to novel new concepts as they are published by professionals.

Cumulative Volume Delta [Aggregated]This Indicator is known as Cumulative Volume Delta (CVD), and it represents the total difference between buying and selling pressure.
This indicator use intrabar analysis to strike a balance between the most straightforward and accurate approaches of computing volume delta.
Intrabar analysis is the most accurate method to determine volume delta on historical bars on our charts when TradingView does not currently have historical tick data available.
What is included in the indicator:
Candle Type CVD
Line Type CVD
Aggregated Data which is derived from different exchanges
● Binance
● Bybit
● OKX
● Delta
● WooNetwork
You can choose between Aggregated Data or Single Data by choice.
Aggregated Data - Gathered Data from multiple exchanges which is summarize and became one.
Single Data - Data on your current chart.
Aggregated Data for CVD is still limited to BTC pair as of the moment. The indicator automatically switches to Single Data Type if the opened chart is not a BTC pair.
Candle Colors are fully customizable just like the Tradingview candle settings.
This indicator is mostly compatible to all Crypto.
NOTE: Most code is derived from my library to keep everything neat and clean.

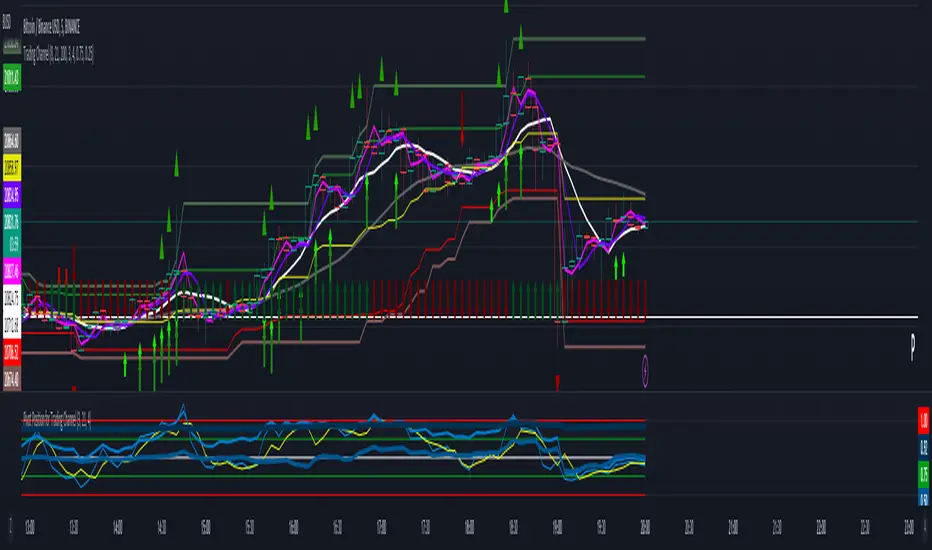
Trading ChannelTrading Channel aims to be a canvas on which to develop any strategy that the user feels comfortable with.
The greatest utility of the script lies in the fact that it plots a channel over the price action, as a support and resistance pivot, within which the price action develops.
It is a script of maximum simplicity in concept and development, but at the same time presents robust support to the price action and a quick visual aid complementary to any indicators that the user works with, feels comfortable with, and uses as a basis for their strategies.
The script includes the following features (most of them disabled by default, available for potential use without the need to add additional indicators):
Fast SMA
Medium SMA
Slow SMA (disabled)
Fast EMA (disabled)
Medium EMA (disabled)
Slow EMA (disabled)
Pivot
Pivot SMA
P Multiplier
Set of resistance and support pivots according to the studies of John L. Person (R3, R2, R1, S1, S2, S3 and midpoints) (disabled by default)
Channel for the current time period in use
Channels for extended time periods (disabled by default)
Various trend, momentum, and overbought/oversold indicating labels (note that the calculations for their representation are based on SMA's even though EMA's are visualized).
SMA's/EMA's
Both are available as both are used as basic indicators for different types of strategies. The default selection of SMA's in this case is based on the fact that the script development is largely based on the studies shared by John L. Person in the area of pivots and by Bill Williams in the area of fractals. Note also that for that same reason the various trend, momentum, and overbought/oversold indicating labels are calculated based on them.
Set of resistance and support pivots
They are included as a consultation tool especially for the higher time periods. They can be used to mark the most interesting supports/resistances and not lose sight of them while operating in lower time periods. Marking monthly, weekly, and daily pivots can be very useful. Additionally, marking S1 and R2 for bullish trends, S1 and R1 for ranges, and S2 and R1 for bearish trends can provide an even more precise framework to work on.
P Multiplier
It is set by default at 4, and is the basis for being able to consider during the use of a specific time frame, the price action with respect to higher time frames. It is the multiplier used for the generation of channels for extended time periods.
Channel for the current time period in use
It is a channel formed by the maximum and minimum closing of the last 21 periods. This value is modifiable and its adjustment depends on the asset under study. 24/7 markets show good results with this adjustment (in the case of BTC really good).
This channel represents a pivot in the form of a yellow middle line, with its support and resistance extremes on the upper green and lower red lines. The same green and red lines, referenced this time to the maximum, are added and serve as possible stop-loss marks.
Channels for extended time periods
Enabling the maximum and minimum channels for extended periods can provide a better idea of the price situation (it is recommended to disable the channel in use and enable the upper one for consultation, it provides a better vision).
Identifying labels:
Following a summary explanation for possible long entries, the same but opposite should be considered for possible short entries:
Small green arrow under candle: indicates possible upward trend (pivot above pivot SMA)
Large green arrow under candle: indicates upward trend (pivot above pivot SMA and above fast SMA)
Green triangle over candle: indicates channel breakout, possible upward momentum (represented as a fractal as its concept is the same)
Green/red arrows at the bottom of the chart: intended to confirm the validity of a signal (should doubt green indications with red lower arrow and vice versa)
Green/red dots at the bottom of the chart: red represents areas of strong resistance and green signals of strong support (with red dots, proceed with caution despite green signals, and vice versa)
Comments
It is emphasized that the basic and most useful functionality of this script is to provide a reliable base on which to develop any strategy, as a framework for working.
If the identifying labels are used, it should be taken into account that the earliest will always be the most reliable and valuable, but their confirmation will always depend on the user's strategy.
Its use in conjunction with the "Pivot Position for Trading Channel" indicator can serve as a base for the development of different strategies, by providing indication of the relative position of the price within the channel.
This script is just a consultation tool with didactic goals, it should not be used as an investment recommendation and the information provided should not be relied upon as such.
------------------------
Trading Channel pretende ser un lienzo sobre el que desarrollar cualquiera que sea la estrategia con la que el usuario se sienta más cómodo.
La mayor utilidad del script radica en que se traza sobre la acción del precio un canal, a modo de pivotes de soporte y resistencia, dentro del cual se desarrolla la acción del precio.
Se trata de un script de máxima sencillez en concepto y desarrollo, pero que a la vez presenta un soporte robusto a la acción del precio y una ayuda rápida visual complementaria a cualquieras que sean los indicadores con los que el usuario trabaje, se sienta más cómodo y utilice como base de sus estrategias.
El script incluye las siguientes funcionalidades (la mayoría desactivadas por defecto, disponibles para su potencial uso sin necesidad de añadir indicadores adicionales):
- SMA rápida
- SMA media
- SMA lenta (desactivada)
- EMA rápida (desactivada)
- EMA media (desactivada)
- EMA lenta (desactivada)
- Pivote
- SMA de pivote
- Multiplicador de P
- Conjunto de pivotes resistencia y soporte de acuerdo a los estudios de John L. Person (R3, R2, R1, S1, S2, S3 y puntos medios) (desactivados por defecto)
- Canal para el periodo temporal en uso
- Canales para periodos temporales extendidos (desactivados por defecto)
- Diversas etiquetas indicativas de cambios de tendencia, de impulso y de sobrecompra y sobreventa (nótese que los cálculos para su representación están basados en SMA's aunque se visualicen EMA's).
SMA's/EMA's
Ambas disponibles pues tanto unas como otras son utilizadas como indicadores básicos para diferentes tipos de estrategias. La selección de SMA's por defecto en este caso se basa en que las bases para desarrollo del script son en gran medida los estudios compartidos por John L. Person en el área de pivotes y de Bill Williams en el área de los fractales. Nótese también que por esa misma razón las diversas etiquetas indicativas de cambios de tendencia, impulso y sobrecompra/sobreventa se calculan en base a ellas.
Conjunto de pivotes resistencia y soporte
Se incluyen como herramienta de consulta sobre todo para los periodos temporales más altos. Pueden utilizarse para marcar los soportes/resistencias de más interés y no perderlos de vista mientras se opera en periodos de tiempo más bajos. De acuerdo a los estudios de John L. Person, marcarse los pivotes mensuales, semanales y diarios puede resultar de mucha utilidad. Adicionalmente, marcar S1 y R2 para tendencias alcistas, S1 y R1 para rangos, y S2 y R1 para tendencias bajistas puede proporcionar un marco aún más preciso sobre el que trabajar.
Multiplicador de p
Está fijado por defecto en 4, y es la base para poder considerar durante el uso de una franja temporal concreta, la acción del precio respecto a franjas temporales superiores. Es el multiplicador utilizado para la generación de los canales para periodos temporales extendidos.
Canal para el periodo temporal en uso
Se trata de un canal conformado por los cierres máximos y mínimos de los últimos 21 periodos. Este valor es modificable y su ajuste depende del activo en estudio. Mercados 24/7 muestran buenos resultados con este ajuste (en el caso de BTC realmente buenos).
Este canal representa en cierta manera un pivote en forma de línea intermedia amarilla, con sus extremos de soporte y resistencia en las líneas verdes superior y roja inferior. Se añaden las mismas líneas verdes y rojas, referenciadas esta vez a los máximos, que sirven como posibles marcas de stop-loss.
Canales para periodos temporales extendidos
Habilitar los máximos y mínimos de canales de periodos extendidos puede proporcionar una mejor idea de la situación del precio (se recomienda deshabilitar el canal en uso y habilitar el superior para consulta, proporciona una mejor visión).
Etiquetas identificativas:
A continuación explicación resumida para posibles entradas en largo, lo mismo pero de modo opuesto debería considerarse para posibles entradas en corto:
Flecha verde pequeña bajo vela: indica inicio de tendencia en alza (pivote por encima de SMA de pivote y ambos por encima de SMA rápida)
Flecha verde grande bajo vela: indica tendencia en alza (pivote por encima de SMA de pivote y ambos por encima de SMA rápida y media)
Triángulo verde sobre vela: indica rotura de canal, posible impulso al alza (representado a modo de fractal pues su concepto es el mismo)
Flechas verdes/rojas a pie de gráfico: pretenden confirmar la validez de una señal (debería dudarse de las indicaciones verdes con flecha inferior roja y viceversa)
Puntos verdes/rojos a pie de gráfico: los rojos representan áreas de fuerte resistencia y los verdes de fuerte soporte (con puntos rojos, proceder con cautela pese a señales verdes, y viceversa)
Comentarios
Se insiste en que la funcionalidad básica y de mayor utilidad de este script es proporcionar una base confiable sobre la que desarrollar cualquier estrategia, a modo de marco de trabajo.
Si se hace uso de las etiquetas identificativas, debe tenerse en cuenta que las más prematuras siempre serán las más confiables y valiosas, pero que su confirmación siempre dependerá de la estrategia por parte del usuario.
Su uso en conjunción al indicador "Pivot Position for Trading Channel" puede servir de base para el desarrollo de diferentes estrategias, al proporcionar indicación de la posición relativa del precio dentro del canal.
Este script es solo una herramienta de consulta con objetivos didácticos, no debe ser utilizado como recomendación de inversión y no se debe confiar en ella como tal.
Seasonal tendency: week-on-week % change and 10yr Averages-shows week-on-week % change, and 10yr averages of these % changes
-scan across the 10yr averages to get a good idea of the seasonality of an asset
-best used on commodities with strong seasonal tendencies (Gold, Wheat, Coffee, Lean hogs etc)
-works only on daily timeframe
-by default it will compare SMA(length) in the following way, BTC: Sunday cf previous Sunday | ES/Gold: Monday cf previous Monday
-for most assets, 5 daily bars in a week (SMA(5)) => that's the default. For BTC can change this to 7.
~~inputs:
-change input year to show any previous decade of asset's history; the table will display over that year on the chart
-choose expression for Average of % change week on week: SMA, ohlc4, vwma, vwap (default SMA)
-choose number of daily bars in a week (i.e. SMA length)
-change label sizes/colors
~~notes:
-When applied to current year: will print the 10yr average for previous weeks in the year; 9yr average for future weeks in the year
-drawings and SMA plot on the above chart are just to show visually how the week's average is calculated, and how this lines up with the label
-current week of year will highlight in large font orange by default
-the first 2 weeks of the year are omitted because of a bug i can't figure out, which throws out bad numbers.
-cannot print all the values for each of previous 10yrs; 'code too long' error. Could likely do this via using matrices but would require a rewrite
17th Dec 2022
@twingall

[XRP][1h] Chanu Delta inspired — Breakeven StrategyHello, this is my first TV contribution. I usually don't publish anything but the script is a quick review of an other contributor (Chanu Delta V3 script )
I reverse engineered this indicator today as I wanted to test it on other contracts. The original version (which aims to be traded on BTC) has been ported to XRP (as btc and xrp prices are narrowly correlated) then modified with a couple of what I believe are improvements:
- No backtest bias even with `security` function.
- Extra backtest bias validation, always trading on next bar as Crossover/under bias is confirmed
- Backtest with 2 ajustable TP, ajustable equity and breakeven option
- The current version is not design to use pyramiding as it would require extra logic to monitor the lifecycle of the position in the context of a study.
- Commented alerts examples with variables available in script scope so you can use them in alerts (just replace strategy with indicator and remove backtest related code block).
- Trade filling assumption set to 10, fees to 0.02 as the are default bybit maker fees and I advice to enter with trailing orders using a max of 2 ticks as offset to lower fees rather than a market order!
- Backtest and Alerts happen on barclose.
- No repaint guaranteed.
There are a thousand ways to improve it (adx/bb based dynamic TP/SL, order lifecycle, pyramiding...) but it seems to be a cool starting point.
Don't forget to have fun!

Trade HourThis script is just finds the best hour to buy and sell hour in a day by checking chart movements in past
For example if the red line is on the 0.63 on BTC/USDT chart it mean the start of 12AM hour on a day is the best hour to buy (all based on
It's just for 1 hour time-frame but you can test it on other charts.
IMPORTANT: You can change time Zone in strategy settings.to get the real hours as your location timezone
IMPORTANT: Its for now just for BTC/USDT but you can optimize and test for other charts...
IMPORTANT: A green and red background color calculated for show the user the best places of buy and sell (green : positive signal, red: negative signals)
settings :
timezone : We choice a time frame for our indicator as our geo location
source : A source to calculate rate of change for it
Time Period : Time period of ROC indicator
About Calculations:
1- We first get a plot that just showing the present hour as a zigzag plot
2- So we use an indicator ( Rate of change ) to calculate chart movements as positive and negative numbers. I tested ROC is the best indicator but you can test close-open or real indicator or etc as indicator.
3 - for observe effects of all previous data we should indicator_cum that just a full sum of indicator values.
4- now we need to split this effects to hours and find out which hour is the best place to buy and which is the best for sell. Ok we should just calculate multiple of hour*indicator and get complete sum of it so:
5- we will divide this number to indicator_cum : (indicator_mul_hour_cum) / indicator_cum
6- Now we have the best hour to buy! and for best sell we should just reverse the ROC indicator and recalculate the best hour for it!
7- A green and red background color calculated for show the user the best places of buy and sell that dynamically changing with observing green and red plots(green : positive signal, red: negative signals) when green plot on 15 so each day on hour 15 the background of strategy indicator will change to 15 and if its go upper after some days and reached to 16 the background green color will move to 16 dynamically.

Spot v Perp aggrRollingVWAPThis indicator is a rolling VWAP that shows an aggregated BTC VWAP for both spot markets and futures markets
Spot VWAP is shown in BTC orange while perp VWAP is shown in blue
This is useful for identifying which market (spot or perps) is pushing trending moves
If the spot VWAP is more closely following the trend, then spot is pushing the move
If the perp VWAP is more closely following the trend, then perps are pushing the move
e.g. In the following picture you can see that the move down was followed much more closely by the spot VWAP, therefore you can assume that the move is being pushed my spot

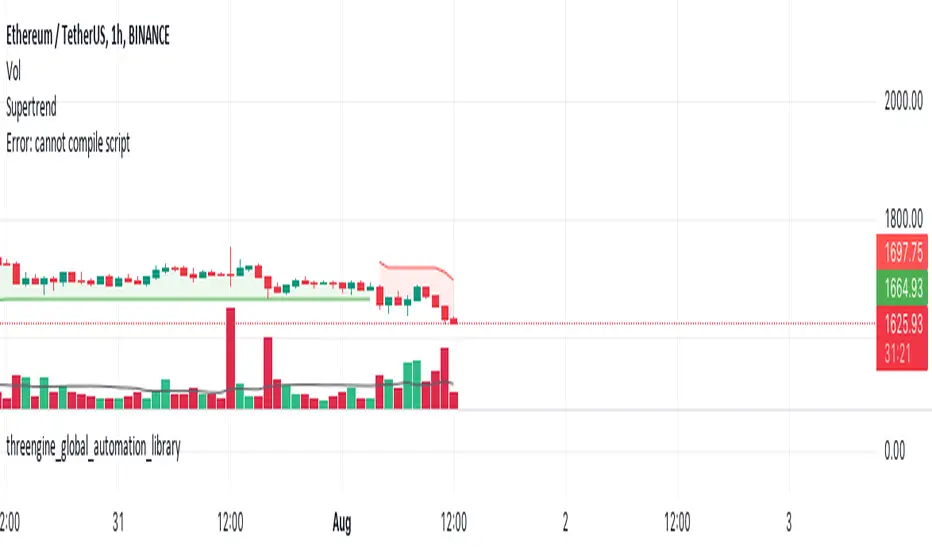
threengine_global_automation_libraryLibrary "threengine_global_automation_library"
A collection of functions used for trade automation
getBaseCurrency()
Gets the base currency for the chart's ticker. Supported trade pairs are USD, USDT, USDC, BTC, and PERP.
Returns: Base currency as a string
getChartSymbol()
Get the current chart's symbol without the base currency appended to it. Supported trade paris are USD, USDT, USDC, BTC, and PERP.
Returns: Ssymbol and base currency
getDecimals()
Calculates how many decimals are on the quote price of the current market
Returns: The current deimal places on the market quote price
checkVar()
Plot a string as a label on the chart to test variable value. Use str.tostring() for any variable that isn't a string.
Returns: Label with stringified variable
getStrategyAlertMessage()
Generates stringified JSON for a limit order that can be passed to the strategy alert_message for a long entry.
Returns: Stringifed JSON for a long entry
taGetAdx()
Calculates the Average Directional Index
Returns: The value of ADX as a float
taGetEma()
Calculates the EMA based on a type, source, and length. Supported types are EMA, SMA, RMA, and WMA.
Returns: The value of the selected EMA
isBetweenTwoTimes()
Checks to see if within a rage based on two times
@retunrs true/false boolean
getAllTradeIDs()
This gets all closed trades and open trades
@retunrs an array of all open and closed trade ID's
getOpenTradeIDs()
This gets all open trades
@retunrs an array of all open trade ID's
orderAlreadyExists()
This checks to see if a provided order id uses the getAllTradeIDs() function to check
@retunrs an array of all open and closed trade ID's
orderCurrentlyExists()
This checks to see if a provided order id uses the getAllTradeIDs() function to check
Returns: an array of all open and closed trade ID's
getContractCount()
calulates the number of contracts you can buy with a set amount of capital and a limit price
Returns: number of contracts you can buy based on amount of capital you want to use and a price
getLadderSteps()
Returns: array of ladder entry prices and amounts based on total amount you want to invest across all ladder rungs and either a range between ladderStart and LadderStop based on specificed number of ladderRungs OR ladderStart, ladderRungs, and LadderSpacingPercent
The Real GBTC Premium (Capriole Investments)The real Grayscale Bitcoin (GBTC) premium / discount.
Charts the premium / discount of GBTC trust versus the Bitcoin spot price.
The GBTC premium / discount is frequently calculated incorrectly as it needs to consider the amount of Bitcoin behind each share of GBTC, which changes over time.
This indicator allows for an estimate of that change through time, a more realistic representation of 1 BTC to 1 BTC within GBTC.
If the chart is red, at a discount = can buy a synthetic Bitcoin (GBTC) at a discount to the underlying asset Bitcoin.
If the chart is green, at a premium = can buy a synthetic Bitcoin (GBTC) at a premium to the underlying asset Bitcoin.
The user should also consider that to-date, GBTC charges an annual fee which depletes the value within the GBTC trust. Grayscale wants to convert GBTC to an ETF, but its applications have so far been rejected by the SEC.
If GBTC is converted to an ETF in the future, we might expect that any GBTC discount shown here will be neutralized; potentially offering an additional return to any holder of GBTC, though this cannot be known for sure until such a conversion occurs.

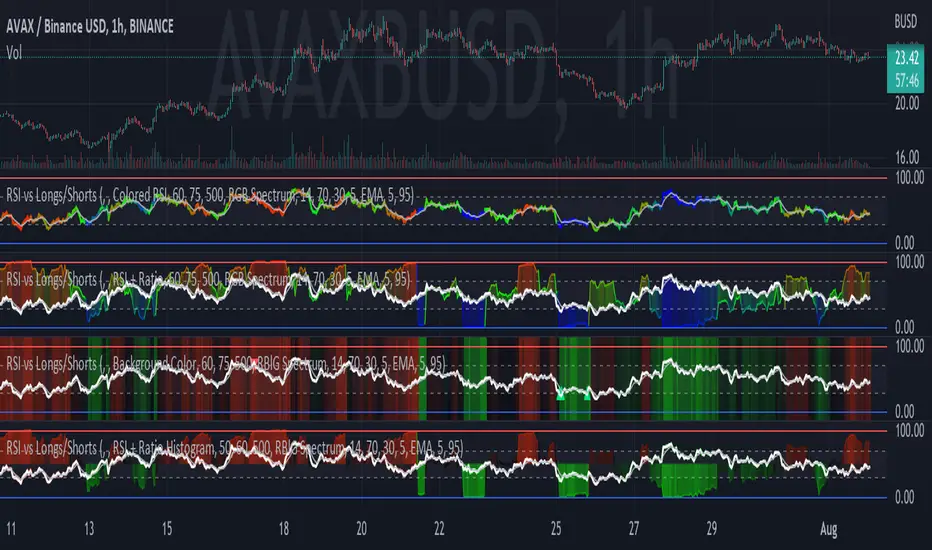
RSI vs Longs/Shorts Margin Ratio Percentage RankThis indicator plots the RSI of the current token and the percentage rank, of the RSI, of the ratio of a long margined token to a short margined token.
By default it plots the RSI of the current token with a color based on percentage rank the RSI of BITFINEX:BTCUSDLONGS divided by BITFINEX:BTCUSDSHORTS, so the assumption is that you are using it on a BTC chart. While you can select any Tradingview symbol for your Long and Short tokens I don't think you will get meaningful results unless you select a long and short margined token that matches your chart symbol, such as BITFINEX:ETHUSDLONGS and BITFINEX:ETHUSDSHORTS if you're trading ETHUSD. Even using margined tokens the results may not be meaningful, if there is not enough trade volume in the token, or if they are being manipulated, so you must backtest everything.
The three plot options are:
• Colored RSI - RSI plotted with colors based on the Longs/Shorts ratio
• Background Color - White RSI plot with Longs/Shorts ratio as background color
• RSI + Ratio - White RSI with Longs/Shorts ratio plotted in color
The chart shows all three options on an hourly BITFINEX:SOLUSD chart with BITFINEX:SOLUSDSHORTS and BITFINEX:SOLUSDLONGS.
By default it also plots a short term moving average and it can also plot the raw ratio rather than the percentage rank if selected.
This script started out as "RSI vs BITFINEX BTC Longs/Shorts Margin Ratio Percentage Rank" by me. I was interested in the ratio of BITFINEX:BTCUSDLONGS to BITFINEX:BTCUSDSHORTS as a measure of market sentiment and how that sentiment would magnify RSI changes. The volatility of the BTCUSDLONGS : BTCUSDSHORTS ratio was too low to get a good read, using a percent rank of the RSI of the ratio made the results more visible. After a discussion with @jason5480 I saw how opening it up to all margined Long / Short pairs was the best way forward. Unfortunately the name no longer matched the script, so I had to publish a new script.
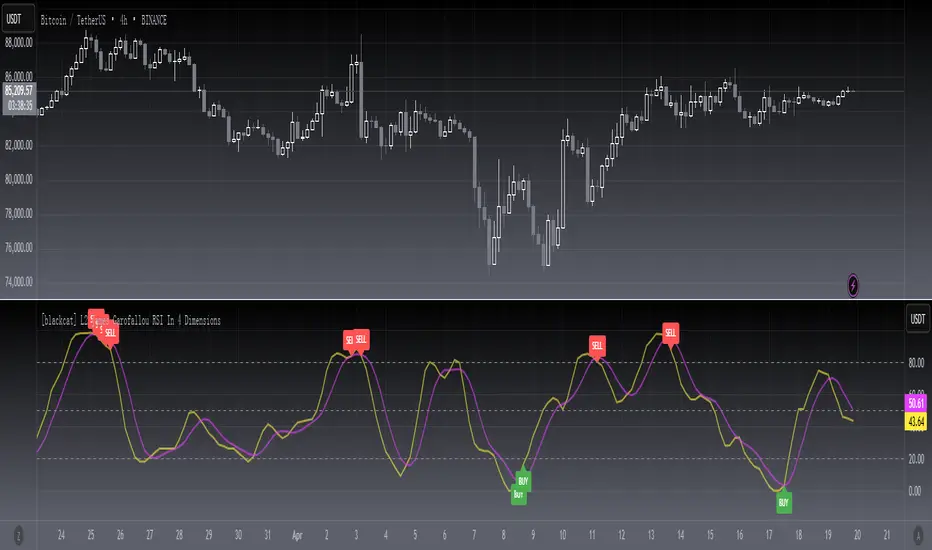
[blackcat] L2 James Garofallou RSI In 4 DimLevel 2
Background
Traders’ Tips of September 2020, the focus is James Garofallou’s article in the September issue, “Tracking Relative Strength In Four Dimensions”.
Function
In “Tracking Relative Strength In Four Dimensions” in this issue, author James Garofallou introduces us to a new method of measuring the relative strength of a security. This new technique creates a much broader reference than would be obtained by using a single security or index and combines several dimensions, as the author calls them, into a single rank value. This study compares a security to another in four dimensions, as explained in the article. James Garofallou presents a metric for a security’s strength relative to 11 major market sectors and over several time periods. All this is squeezed into a single value. The first step is the RS2. It normalizes the security to a market index, then calculates four moving averages and encodes their relations in a returned number. I just modified it by using most BTC-correlated instruments to reflect how BTC response to their performance.
Remarks
This is a Level 2 free and open source indicator.
Feedbacks are appreciated.
RSI correlation with cryptoindices [strategy version]Dear TV'ers,
Hereby the strategy script where the RSI of an altcoin can be compared to one of the selected cryptocap indices. Included are:
-total market cap
-total market cap minus bitcoin
-total market cap others
-total market cap usdt
-cix100 index
-btc dominance
-btc total cap
If the signal crosses over 1, then the altcoin is undervalued compared to the crypto index (and considered a buying signal here). If the signal crosses under 1, then the altcoin is overvalued compared to the selected crypto-index and a short signal is produced.
!!Please note that the selected timeframe for the reference pair should be a higher time of the chart in order to prevent repainting!!!

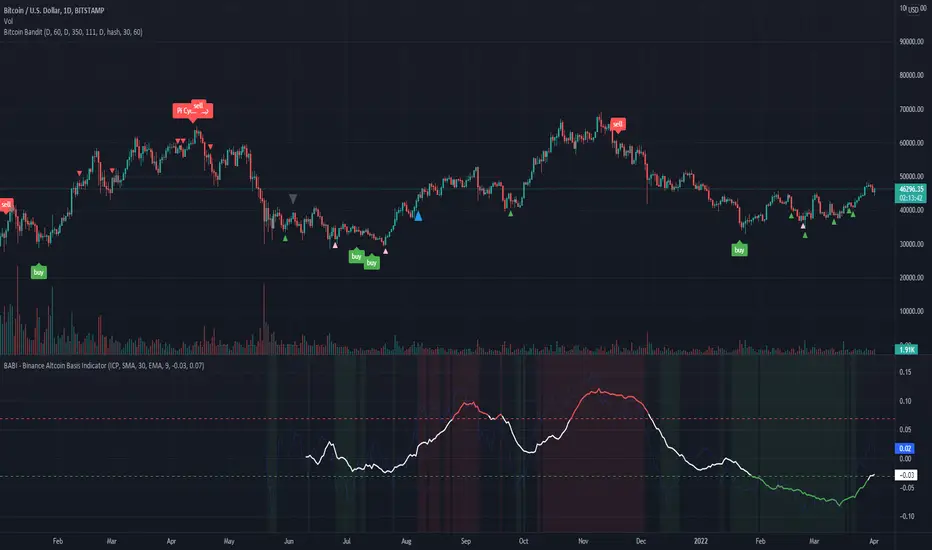
BABI - Binance Altcoin Basis Indicator
This indicator works by taking the basis between various altcoin perpetual futures contracts and spot market indexes on Binance, and then smooths out the data with a basic moving average.
The result is a useful oscillator that shows potential "buy" and "sell" areas.
Simply put, a spot premium is usually bullish and a derivatives premium is usually bearish.
Other versions of this indicator only worked for BTC and ETH, so I have extended its functionality to include popular altcoin trading pairs.
USDT Trading pairs included in this version:
•BTC
•ETH
•LTC
•ICP
•SOL
•LUNA
•GRT
•ATOM
•ADA
•XRP
•ETC
•AVAX
Default setting is BTC. To choose a different oscillator, go to settings and pick your desired crypto.
Thanks for looking. I think you could create a pretty basic trading strategy based on this indicator by simply placing buy and sell orders once the oscillator rises or falls below certain thresholds.
**Credit to @chestbrook on Twitter and Pinnacle_Investor on TradingView
Binance Basis Oscillator ()
Auto Support & Resistance From Option Strike Price + PercentagesAUTO SUPPORT AND RESISTANCE FROM OPTIONS STRIKE PRICES WITH PERCENTAGE GAPS
This is an auto support and resistance level indicator that uses options strike prices or psychological numbers as the relevant levels. Set your starting level or strike price and input the options strike price gaps for that ticker and 15 lines in either direction will automatically populate on the chart. It also has a table in the bottom right corner that tells you how far the current price is from the next closest support and resistance levels.
Everything is easily customizable in the indicator input settings including turning the lines on/off, turning the percentage gaps table on/off, setting the options strike price gaps, setting the starting level, setting the position of the percentage gaps table, changing support and resistance line colors all at once and updating the linewidth of all of the support and resistance lines at once.
***HOW TO USE***
First, go into the indicator settings and set the starting level to use. If you are trading SPY and it is near 450, then set your starting level at 450. If you are trading SQQQ and it is near 38, set your starting level to 38. If you are trading crypto, set your levels to the nearest psychological or round number such as 40,000 for BTC or 2,500 for ETH or 16.50 for LINK.
Second, set your options strike price gaps. If you are trading SPY, this will be 2.5. If you are trading SQQQ this number would be 1. If you are trading crypto, try using psychological price levels instead of strike prices, such as 500, 1000 or 5000 for BTC and 100, 250 or 500 for ETH. For small priced cryptos, use decimals such as .25, .50, etc.
Once these inputs are filled in, 15 levels in each direction will automatically populate on the chart for you.
If price is above a level, it will paint green. If price is below a level it will paint red. These colors represent support and resistance visually for you on the chart and will change dynamically as price moves above or below these levels. These colors can be customized in the indicator input settings to change all lines by only updating one color.
There is a table of percentage gap updates that will tell you in real time how far away the price is from the nearest support and resistance lines so you always know your risk to reward ratios. Each label will also be colored the same as the corresponding support or resistance line as a visual aid.
***MARKETS***
This indicator can be used as a signal on all markets, including stocks, crypto, futures and forex.
***TIMEFRAMES***
This support and resistance indicator can be used on all timeframes.
***TIPS***
Try using numerous indicators of ours on your chart so you can instantly see the bullish or bearish trend of multiple indicators in real time without having to analyze the data. Some of our favorites are our Auto Fibonacci, Directional Movement Index, Volume Profile, Momentum and Money Flow Index in combination with this auto support and resistance indicator. They all have real time Bullish and Bearish labels as well so you can immediately understand each indicator's trend.

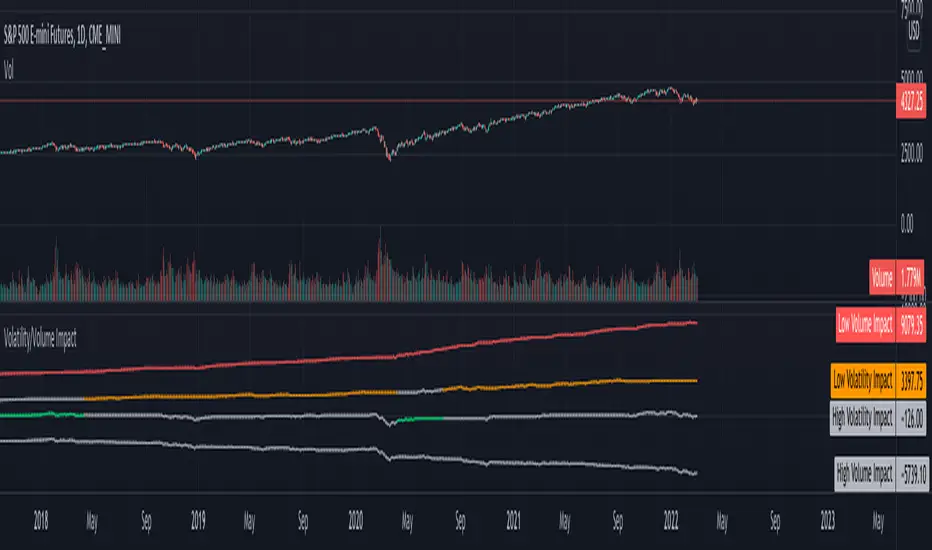
Volatility/Volume ImpactWe often hear statements such as follow the big volume to project possible price movements. Or low volatility is good for trend. How much of it is statistically right for different markets. I wrote this small script to study the impact of Volatility and Volume on price movements.
Concept is as below:
Compare volume with a reference median value. You can also use moving average or other types for this comparison.
If volume is higher than median, increment positive value impact with change in close price. If volume is less than median, then increment negative value impact with change in close price.
With this we derive pvd and nvd which are measure of price change when volume is higher and lower respectively. pvd measures the price change when volume is higher than median whereas nvd measures price change when volume is lower than median.
Calculate correlation of pvd and nvd with close price to see what is impacting the price by higher extent.
Colors are applied to plots which have higher correlation to price movement. For example, if pvd has higher correlation to price movement, then pvd is coloured green whereas nvd is coloured silver. Similarly if nvd has higher correlation to price then nvd is coloured in red whereas pvd is coloured in silver.
Similar calculation also applied for volatility.
With this, you can observe how price change is correlated to high/low volume and volatility.
Let us see some examples on different markets.
Example 1: AMEX:SPY
From the chart snapshot below, it looks evident that SPY always thrive when there is low volatility and LOW VOLUME!!
Example 2: NASDAQ:TSLA
The picture will be different if you look at individual stocks. For Tesla, the price movement is more correlated to high volume (unlike SPY where low volume days define the trend)
Example 3: KUCOIN:BTCUSDT
Unlike stocks and indices, high volatility defined the trend for BTC for long time. It thrived when volatility is more. We can see that high volume is still major influencer in BTC price movements.
Settings are very simple and self explanatory.
Hint: You can also move the indicator to chart overlay for better visualisation of comparison with close price.
"Buy signal" from Cipher B for 3commasThis is another modification for cipher B indicator from VuManChu. I also would like to acknowledge "The Art of Trading" channel in youtube for their mastery pine script course.
This script is designed to send alerts to 3commas platform. In strategy.entry in comment option, you can incorporate your token for your bot.
The buy signal accomplishes only when BTC is above simple moving average (SMA).
When BTC crosses down SMA, any position closes immediately.
The parameters were tuned for this particular plot.

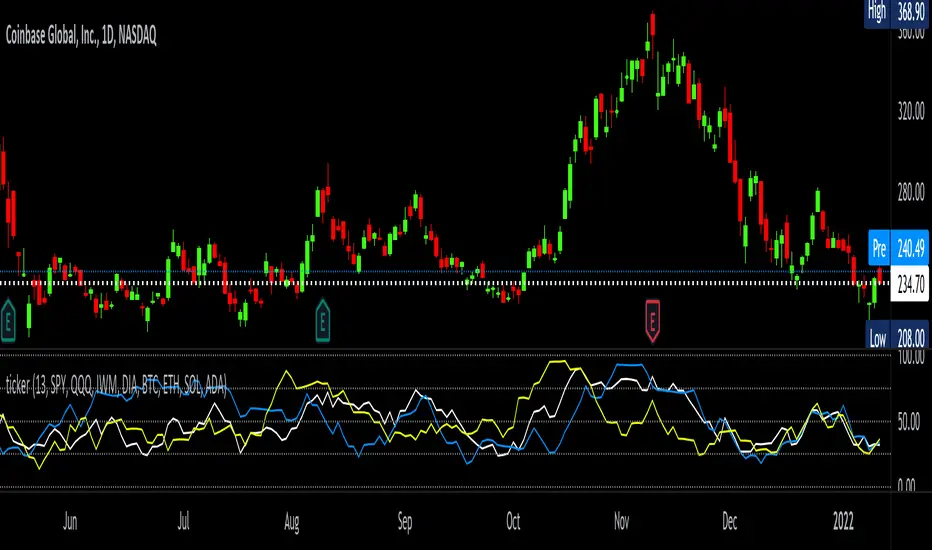
tickerTracker MFI OscillatorDid you ever want to have a neat indicator window in line with your chart showing a different ticker? tickerTracker is a Money Flow Index (MFI) oscillator. The Money Flow Index (MFI) is a technical oscillator that uses price and volume for identifying overbought or oversold conditions in an asset. More or less, everything is connected in the market. The tickerTracker lets you see what is happening with another ticker that you have connected a correlation between them. For my example here, I'm using COIN in the main chart with the tickerTracker displaying BTC, QQQ and COIN Money Flow Index (MFI) in its window. As the end user, you can customize the colors, the length input and the ticker. Like any other indicator, the shorter length input, the more quickly responsive and the longer the length input, the smoother curve print.
Default Values:
MFI Length = 13
Chart ticker = white
SPY = white
QQQ = blue
IWM = yellow
DIA = orange
BTC/USD = yellow
ETH/USD = green
SOL/USD = purple
ADA/USD = red
Do your own due diligence, your risk is 100% your responsibility. This is for educational and entertainment purposes only. You win some or you learn some. Consider being charitable with some of your profit to help humankind. Good luck and happy trading friends...
*3x lucky 7s of trading*
7pt Trading compass:
Price action, entry/exit
Volume average/direction
Trend, patterns, momentum
Newsworthy current events
Revenue
Earnings
Balance sheet
7 Common mistakes:
+5% portfolio trades, capital risk management
Beware of analyst's motives
Emotions & Opinions
FOMO : bad timing, the market is ruthless, be shrewd
Lack of planning & discipline
Forgetting restraint
Obdurate repetitive errors, no adaptation
7 Important tools:
Trading View app!, Brokerage UI
Accurate indicators & settings
Wide screen monitor/s
Trading log (pencil & graph paper)
Big, organized desk
Reading books, playing chess
Sorted watch-list
Checkout my indicators:
Fibonacci VIP - volume
Fibonacci MA7 - price
pi RSI - trend momentum
TTC - trend channel
AlertiT - notification
tickerTracker - MFI Oscillator
www.tradingview.com
Smart RebalanceThis script is based on the portfolio rebalancing strategy. It's designed to work with cryptocurrencies, but it can work with any market.
How portfolio rebalance works?
Let's assume your initial capital is $1000, and you want to distribute it into 4 coins. This script takes the USDT as the stable coin for the initial money, so in case you want other currency, the pairs must be with that fiat as the quote.
Following our example, you would take BTC, ETH, BNB, and FTT. After selecting the coins, it's time to choose how much allocation is on each. Let's put 25% on each. This way, $250 of our capital on each coin.
After selecting the coins and their allocation, you choose the price change ratio for rebalancing. Let's use 1%. Next, you start to watch the markets. The first thing that happens, following our example, is the BTCUSDT price moving 1% up.
That amount hit the ratio of 1% for the rebalance. Hence, you sell 1% of BTC for USDT and redistribute to the other coins, buying 0.25% of each currency to rebalance the portfolio.
Next, ETHUSDT goes 1% down, time to rebalance again. This time, you need to take 0.33% of each other coin and buy ETH, so this way, it's all divided as the chosen allocation.
Why use rebalancing?
Looks easy, right? It is, but very time demanding. Demands even more if you raise the number of coins you want to distribute. Having a system to do that automatically is a must to work efficiently. Rebalancing spreads the risk among multiple currencies. This way, you earn small when it goes up, but you lose small when it goes down.
What this script helps with portfolio rebalance?
This indicator will not buy/sell for you but will help you choose the best markets for your rebalancing. Which coin will work best in that period? Do I need to have more than 8 coins? How much must be my ratio? Those questions you can answer using this indicator.
What this script has?
Start and End dates
The script will work for a certain period. All calculations will be done in that period.
Coin Ratio %
The amount of price movement of each asset that will be used to calculate the rebalancing
Initial Capital and Broker Fee
The amount of capital to be used on the rebalancing and the broker fee you want to use the strategy. The cost will be applied on every trade, buying or selling the coins.
Assets, allocations, and colors
It's possible to select from 2 to 10 assets to be used on the portfolio. Each purchase must have the allocation %. Suppose the sum of the allocations is different from 100%. In that case, a warning message will appear on the chart instead of the statistics.
Panel and tooltips
There is a panel with a summary of the results
Set allocations automatically
There is an option to make the indicator use the daily asset volume from the day before to determine the allocation percentage of each asset. This option is better if you are unsure how much allocation you want to use on each coin.
Use this indicator as a backtest for your rebalancing strategy. The selected market on the chart will not affect the calculation on this indicator, but the time frame will. The higher the time frame, the higher the coin ratio % must be.
About the code
The code is written to use arrays to store the values of each asset, making the calculations on each candle inside the time range. The for-loops are used to reduce the code length and make it easy to change the analysis of all assets. Finally, the script has some comments on the code.

HASHRATE and MINER REVENUEThis script uses daily data points from Quandl which measure Bitcoin mining hashrate, and miner revenue, and averages the two. The two data sets are fairly zigzaggy, so to smooth the data I am use a John Ehlers' filter to reduce the noise. Why did I combine the two? Both have correlation to BTC price action, and by combining hashrate and revenue, I believe it produces a stronger and more accurate signal. At times when the background is green (also displayed with a green square at the bottom), conditions are good in Bitcoinland with miner revenue/hashrate going up. No color in the background and no dot, means the combined miner revenue and hashrate indicator is dropping, but nothing to get worried about. Seeing red dots on the bottom along with a red background signals a rapidly dropping rate of hashrate/miner revenue, and with a fairly strong correlation to the Bitcoin price. Not every red zone foretells a drop in the Bitcoin price, but a significant number of them do. I wrote this script as an early warning system for when to move out of Bitcoin. Use at your own risk. Feel free to modify this code to suit your personal needs. Please only use on BTC /USD pairs with 1D bars. Since there is only one data point per day published by Quandl, it will not give accurate data for shorter timeframes. Enjoy.

TradingGroundhog - Strategy & Fractal V1#-- Public Strategy - No Repaint - Fractals -- Short term
Here I come with another script, more simple than Wavetrend V1. You will love it.
#-- Synopsis --
Another simple idea, on a small time frame (15 min) we buy when the opening price goes below a Bottom fractals and sell when it goes over a Top fractals, but as this script do not use Wavetrends. You should stop by your self to use the script during long lasting downtrends.
I developed the strategy using BTC /EUR 3 MIN BINANCE but it can be applied to many other cryptos, I don't know for forex or others. You can use it for short term (to a month of uptrend) and automated trading.
#-- Graph reading --
And now, how to read it ?
Fractals:
Yellow Flags occur when the opening price goes below a Bottom fractal , it means Buy.
White Flags appear when the opening price goes over a Top fractal , it means Sell.
#-- Parameters --
*** Parameters have been intensively optimized using 10 cryptocurrency markets in order to have potent efficiency for each of them. I would recommend to only change the Can Be touch parameter. For the others, I don't recommend any modifications. The idea behind the script is to be able to switch between markets without having to optimize parameters, less work, easy to target active crypto and therefor limit the risks. ***
Can be touch :
'Filter fractals' : Activate or Disable the filtering fractal operation. If Enable, buy during less risky periods. (Activate is often better)
Can be touch but not necessary :
'VolumeMA' : The Volume corrector used by the fractals
'Extreme window' : The number of price individuals to look for if we want to remove extreme fractals.
Not to touch :
'Long Sop Loss (%)' : The minimal difference of price between a Fractal bottom and the opening price to buy.
#-- Time frame --
Should be used with the following time frames depending on the necessity:
1 MIN
3 MIN (Preferred with the parameters set)
5 MIN
#-- Last words --
The script can be set up to send Tradingview signals to 3comma just by adding comment = " " in strategy.close_all() and strategy.entry().
Good trades !
Disclaimer (As it should always be one to any script)
***
This script is intended for and only to be used for personal purposes only. No such information provided by it constitutes advice or a recommendation for any investment or trading strategy for any specific person. There is no guarantee presented or implied as to the accuracy of specific forecasts, projections, or predictive statements offered by the script. Users of the script agree that its original developer does not take responsibility for any of your investment decisions. Please seek professional advice before trading.
***
# Here are the results from the 20rst of September 2021 with 100% of equity on the BTC /EUR 3 Min and with a capital of 10 000 EUR. So almost, one month.
# As I saw, it goes from +30% to more than +160% (the great SHIB) depending on the selected crypto. It may be negative if you spot a downtrend.

TradingGroundhog - Strategy & Wavetrend V2#-- Public Strategy - No Repaint - Fractals - Wavetrend --
Here I come with another script, a nice and simple strategy based on fractals and Wavetrends.
#-- Synopsis --
A simple idea, on a small time frame (15 min) we buy when the opening price goes below a Bottom fractals and sell when it goes over a Top fractals, but in order to avoid bad and evil downtrends, we use Wavetrends based on a Daily time frame. From it, Tops and Bottoms are extracted. If the opening price goes above Wavetrend Tops, no trades will be conducted during the day. If the price goes below Wavetrend bottoms, no trades will be executed from 1 to N days, until a new Wavetrend bottom is generated.
I developed the strategy using BTC /EUR 15 MIN BINANCE but it can be applied to many other cryptos, I don't know for forex or others. You can use it for long term and automated trading, I implemented the Wavetrend indicator to do so, or for short term if you have spot a long coming uptrend. Test it, look at its profit and long or short period on your crypto of choice.
#-- Graph reading --
And now, how to read it ?
Wavetrends:
Red Backgrounds are associated to No Trade periods. These periods occur when the price goes below a Wavetrend bottom or above a Wavetrend Top. They are here to limit the loss.
Blue Gradient lines represent the past Tops. For each bar, only the increasing values of the Wavetrend tops are acquired. Going from light to dark blue based on the age of the Tops. Thus, if on line goes from dark to light, this means the price is approaching a previous Wavetrend top. In the opposite, if it darken, thus the price say 'buy buy' and go dropping.
Yellow Gradient lines represent the past Bottoms. They are based on the same principe that the blue lines.
Fractals:
Yellow Flags occur when the opening price goes below a Bottom fractal , it means Buy.
White Flags appear when the opening price goes over a Top fractal , it means Sell.
#-- Parameters --
*** Parameters have been intensively optimized using 10 cryptocurrency markets in order to have potent efficiency for each of them. I would recommend to only change the Can Be touch parameter. For the others, I don't recommend any modifications. The idea behind the script is to be able to switch between markets without having to optimize parameters, less work, easy to target active crypto and therefor limit the risks. ***
Can be touch :
'Combined Smoothness' : The number of open individuals used by the Wavetrend. (6 or 9, often 9 is better but with less volatile crypto it will be 6)
'Filter fractals' : Activate or Disable the filtering fractal operation. If Enable, buy during less risky periods. (Disable is often better)
Can be touch but not necessary :
'VolumeMA' : The Volume corrector used by the fractals
'Extreme window' : The number of price individuals to look for if we want to remove extreme fractals.
Not to touch :
'Limit_candle to look on' : Number of candles to use to compute the Wavetrend Tops and Bottoms.
'Length top bottom drawn' : Size of the lines
'Long Sop Loss (%)' : The minimal difference of price between a Fractal bottom and the opening price to buy.
#-- Time frame --
Should be used with the following time frames depending on the necessity:
1 MIN
3 MIN (Interesting for short term profit, may need some parameter ajustements)
5 MIN
15 MIN (Preferred for long term profit, the script was developed on it)
#-- Last words --
The script can be set up to send Tradingview signals to 3comma just by adding comment = " " in strategy.close_all() and strategy.entry().
Good trades !
Disclaimer (As it should always be one to any script)
***
This script is intended for and only to be used for personal purposes only. No such information provided by it constitutes advice or a recommendation for any investment or trading strategy for any specific person. There is no guarantee presented or implied as to the accuracy of specific forecasts, projections, or predictive statements offered by the script. Users of the script agree that its original developer does not take responsibility for any of your investment decisions. Please seek professional advice before trading.
***
# Here are the results from the 1rst of July 2021 with 100% of equity on the BTC /EUR 15 Min and with a capital of 1 000 EUR.
# As I saw, it goes from +20% to more than +100% depending on the selected crypto. Sometimes it's negative but it's quite rare on crypto using the EUR.

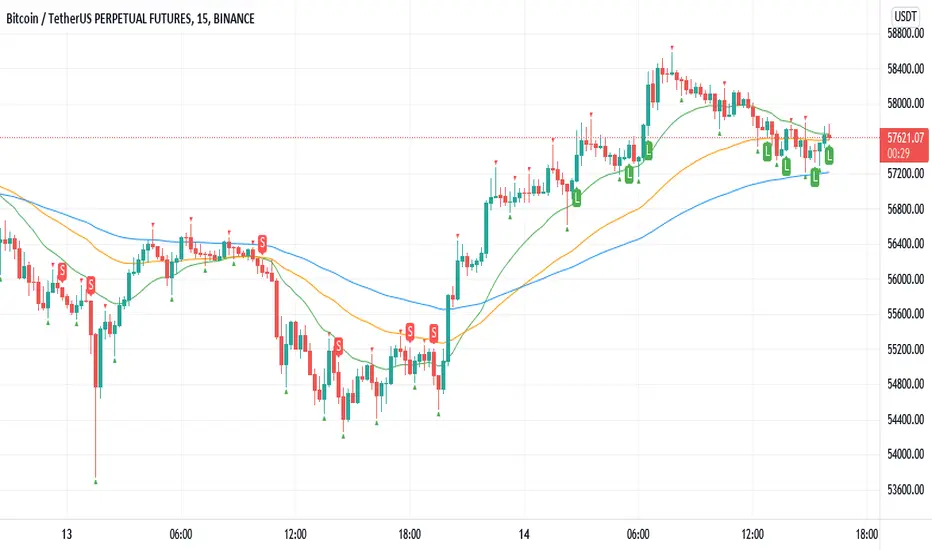
Williams Fractals BUY/SELL signals indicatorThis indicator made with using Williams Fractals, 20 50 100 Moving Averages and Relative Strength Index. You can easily find entry points by using Long (L), Short (S) signals.
This is a 15min scalping strategy for BTC:USDT Perpetual pair. For use different pairs or TFs you may need to change settings.
How to use
****************
When flashing Long (L) or Short (S) signal you should wait until the candle closing for the confirmation.
After that candle closed with the signal, you can enter a trade in next candle opening.
Your SL should be 3.1% from etnry and TP should be 0.5% from entry for best results. (You can use Long Position / Short Position tool in Prediction and Measurement Tools in drawing pannel to calculate this. This settings only for BTC:USDT Perp 15 min TF. For other TFs or Pairs settings may vary. You can easily change these settings and backtest your own.)
After entering a trade you can be ignored next signals until close the trade.
To learn more about this strategy, please try the "Williams Fractals Strategy" I coded. Thank you!