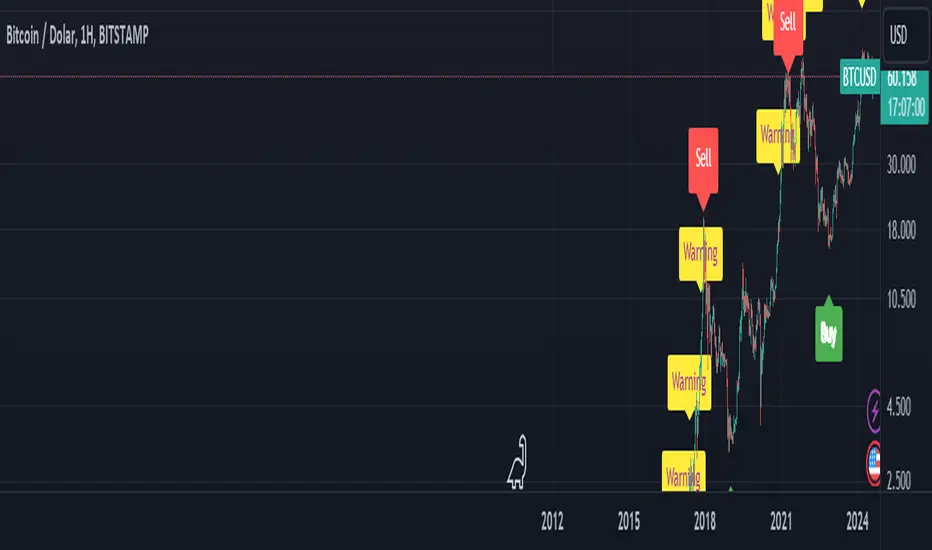
BTC Arcturus IndicatorBTC Arcturus Indicator: This indicator is designed to create buy and sell signals based on the market value of Bitcoin. It also predicts potential market tops with the Pi Cycle Top indicator.
How Does It Work?
1. MVRVZ (Market Value to Realized Value-Z Score) Calculation:
MC: Bitcoin's market cap (Market Cap) is pulled daily from Glassnode data.
MCR: Realized Market Cap of Bitcoin is taken daily from Coinmetrics data.
MVRVZ: It is calculated by dividing the difference between Bitcoin's market value and realized market value by one standard deviation. This value indicates whether the market is overvalued or undervalued.
2. Reception and Warning Signals:
Buy Signal: When MVRVZ falls below the -0.255 threshold value, the indicator gives a "Buy" signal. This indicates that Bitcoin is undervalued and may be a buying opportunity.
Warning Signal: A warning signal turns on when MVRVZ exceeds the threshold value of 2.765. This indicates that the market is approaching saturation and caution is warranted.
3. Tracking the Highest MVRVZ Value:
The indicator records the highest MVRVZ value in the last 10 candlesticks. This value is used to determine whether the market has reached its highest risk levels.
4. Warning Display:
If the MVRVZ value matches the highest value in the last 10 bars and this warning has not been displayed before, a "Warning" signal is displayed.
Once the warning signal is shown, no further warnings are shown for 10 candles.
5. Pi Cycle Top Indicator:
Pi Cycle Top: This indicator predicts Bitcoin tops by comparing two moving averages (350-day and 111-day). If the short-term moving average falls below the long-term moving average, this is considered a sell signal.
The indicator displays this signal with the label "Sell", indicating a potential market top.
User Guide:
Green Buy Signal: It means Bitcoin is cheap and offers a buying opportunity.
Yellow Warning Signal: Indicates that Bitcoin has reached possible profit taking points and caution should be exercised.
Red Sell Signal: Indicates that Bitcoin has reached market saturation and it may be appropriate to sell.
ابحث في النصوص البرمجية عن "btc走势预测"
BTC outperform atrategy### Code Description
This Pine Script™ code implements a simple trading strategy based on the relative prices of Bitcoin (BTC) on a weekly and a three-month basis. The script plots the weekly and three-month closing prices of Bitcoin on the chart and generates trading signals based on the comparison of these prices. The code can also be applied to Ethereum (ETH) with similar effectiveness.
### Explanation
1. **Inputs and Variables**:
- The user selects the trading symbol (default is "BINANCE:BTCUSDT").
- `weeklyPrice` retrieves the closing price of the selected symbol on a weekly interval.
- `monthlyPrice` retrieves the closing price of the selected symbol on a three-month interval.
2. **Plotting Data**:
- The weekly price is plotted in blue.
- The three-month price is plotted in red.
3. **Trading Conditions**:
- A long position is suggested if the weekly price is greater than the three-month price.
- A short position is suggested if the three-month price is greater than the weekly price.
4. **Strategy Execution**:
- If the long condition is met, the strategy enters a long position.
- If the short condition is met, the strategy enters a short position.
This script works equally well for Ethereum (ETH) by changing the symbol input to "BINANCE:ETHUSDT" or any other desired Ethereum trading pair.

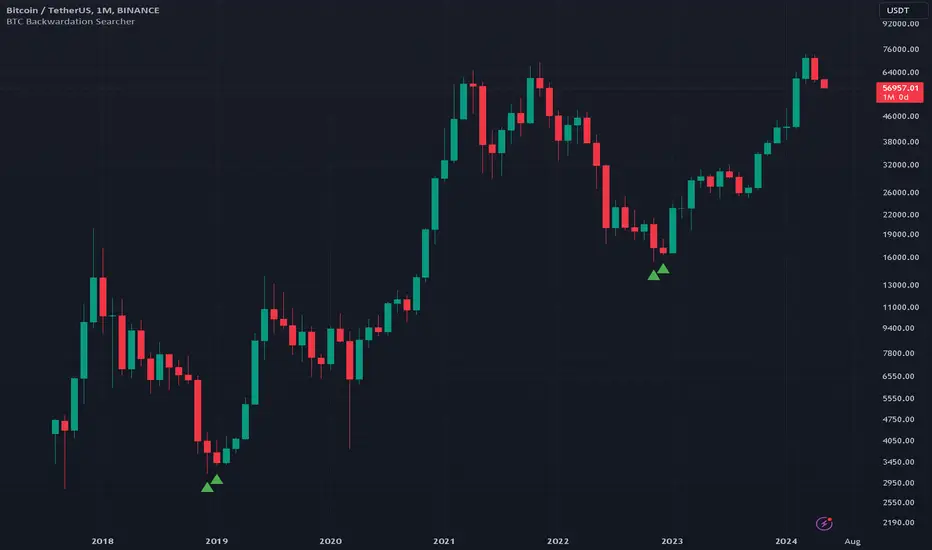
BTC Backwardation SearcherThis Pine Script code is a custom indicator named "BTC Backwardation Searcher" designed for the TradingView platform. The indicator aims to identify and visualize the price difference between two Bitcoin futures contracts: CME:BTC1! and CME:BTC2!.
Here's a breakdown of the code:
1. The script fetches the daily close prices of CME:BTC1! and CME:BTC2! using the security() function.
2. It calculates the percentage price difference between the two contracts using the formula: (btc1Price - btc2Price) / btc2Price * 100.
3. The script also calculates the price difference for the previous two days (2 days ago and 3 days ago) using the same formula.
4. Two conditions are defined:
(1) dailyGreenCondition: If the price difference is greater than or equal to 0.3% for three
consecutive days, including the current day and the previous two days.
(2) dailyRedCondition(commented): If the price difference is less than or equal to -1% for three consecutive days, including the current day and the previous two days.
(I commented it out because I don't think it's useful.)
5. The plotshape() function is used to display green triangles on the chart when the dailyGreenCondition is met, and red triangles when the dailyRedCondition is met. These triangles are displayed on the daily, weekly, and monthly timeframes.
The purpose of this indicator is to help traders identify potential trading opportunities based on the price difference between the two Bitcoin futures contracts. The green triangles suggest a bullish scenario where CME:BTC1! is significantly higher than CME:BTC2!, while the red triangles indicate a bearish scenario where CME:BTC2! is significantly lower than CME:BTC1!.
However, it's important to note that this indicator should be used in conjunction with other technical analysis tools and fundamental analysis. Traders should also consider their risk tolerance, investment goals, and market conditions before making any trading decisions based on this indicator.
BTC Supply in Profits and Losses (BTCSPL) [AlgoAlpha]Description:
🚨The BTC Supply in Profits and Losses (BTCSPL) indicator, developed by AlgoAlpha, offers traders insights into the distribution of INDEX:BTCUSD addresses between profits and losses based on INDEX:BTCUSD on-chain data.
Features:
🔶Alpha Decay Adjustment: The indicator provides the option to adjust the data against Alpha Decay, this compensates for the reduction in clarity of the signal over time.
🔶Rolling Change Display: The indicator enables the display of the rolling change in the distribution of Bitcoin addresses between profits and losses, aiding in identifying shifts in market sentiment.
🔶BTCSPL Value Score: The indicator optionally displays a value score ranging from -1 to 1, traders can use this to carry out strategic dollar cost averaging and reverse dollar cost averaging based on the implied value of bitcoin.
🔶Reversal Signals: The indicator gives long-term reversal signals denoted as "▲" and "▼" for the price of bitcoin based on oversold and overbought conditions of the BTCSPL.
🔶Moving Average Visualization: Traders can choose to display a moving average line, allowing for better trend identification.
How to Use ☝️ (summary):
Alpha Decay Adjustment: Toggle this option to enable or disable Alpha Decay adjustment for a normalized representation of the data.
Moving Average: Toggle this option to show or hide the moving average line, helping traders identify trends.
Short-Term Trend: Enable this option to display the short-term trend based on the Aroon indicator.
Rolling Change: Choose this option to visualize the rolling change in the distribution between profits and losses.
BTCSPL Value Score: Activate this option to show the BTCSPL value score, ranging from -1 to 1, 1 implies that bitcoin is extremely cheap(buy) and -1 implies bitcoin is extremely expensive(sell).
Reversal Signals: Gives binary buy and sell signals for the long term

BTC Indicator By Megalodon TradingThis indicator is designed help you see the potential reversal zones and it helps you accumulate for the long run.
This combines price data on any chart. The chart isolates between 0 and -100. Below -80 is a buy, above -20 is a sell location.
In these locations, try to Slowly Buy and Slowly Sell (accumulate...)
Story Of This Indicator
~I was always obsessed with Fibonacci and used Fibonacci all the time. Thus, i wanted to make a tool to see buying locations and selling locations.
Instead of drawing fibonacci's and manually interpreting buy/sell locations, i wanted algorithms to do the job for me. So, i created this algorithm and many more like it.
If you think i did a good job and want to do further work with me, feel free to contact.
I have a ton of other tools that can change everything for your trading/investing.
Best wishes
~Megalodon
BTC Dominance Exclude Stablecoins(USDT, USDC, DAI)This index's goal is to show the true bitcoin dominance relative to other risky crypto assets, excluding the diluting effects of those ever-increasing stablecoin(USDT, USDC, DAI)'s market cap. In this index, we can see the BTC dominance has been solid increasing & construct bottom during recent fear/bear.
Xiaolai Chen
Sept 14th 2022

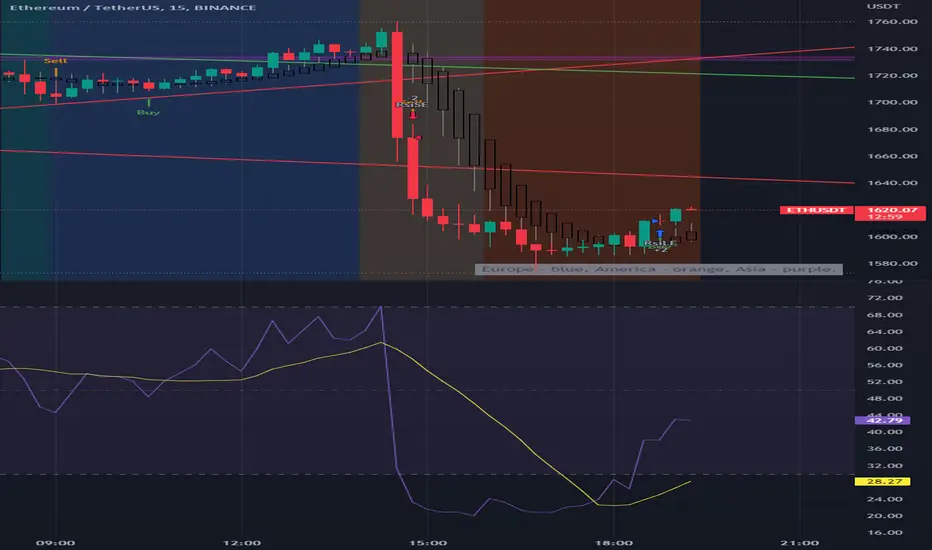
BTC Europe-America-Asia market backgrounds - 1h max frameMarket indicator - Europe - America - Asia.
Based on my trading experience. Therefore, time zones are of different sizes.
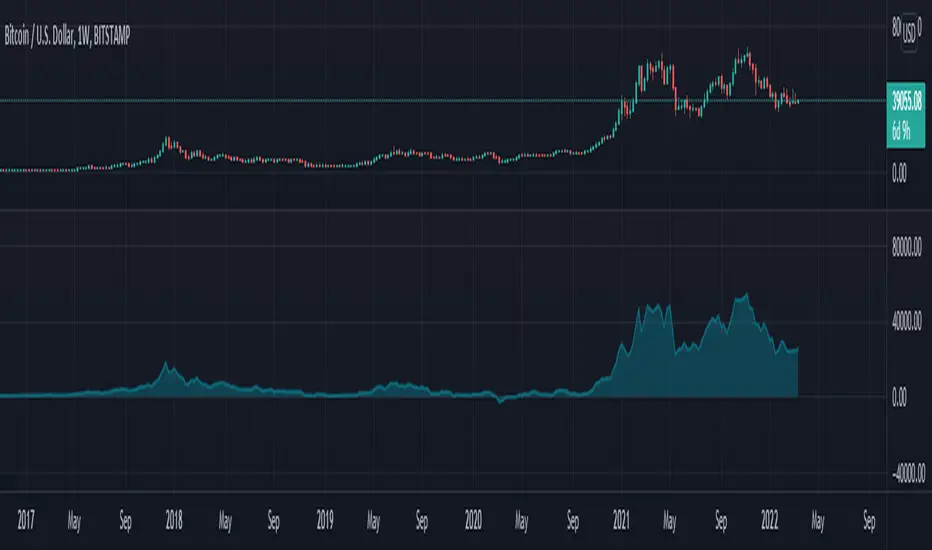
BTC spot volumeIndicator with aggregated volume for all the most actively traded bitcoin spot markets.
Can be denominated in either US dollars or the number of coins traded.
Can be displayed as stacked volume or an index that shows the percentage market share each market has.
In the settings you can exclude any market so that it only shows the individual and total volume of the markets you're interested in.
The currency it's traded against is always specified (e.g. USDT, BUSD, ...).
It's public and free for anyone to use.

BTC perpetual swaps volumeIndicator with aggregated volume for all the most actively traded bitcoin perpetual swaps.
Can be denominated in either US dollars or the number of coins traded.
Can be displayed as stacked volume or an index that shows the percentage market share each contract has.
In the settings you can exclude any contract so that it only shows the individual and total volume of the markets you're interested in.
"Linear" or "inverse" refers to the type of perpetual swap contract it is.
Inverse contracts use coin margin, so in this case BTC.
Linear contracts use some type of dollar equivalent margin like USDT for example.
The margin is always specified for the linear contracts.
It's public and free for anyone to use.

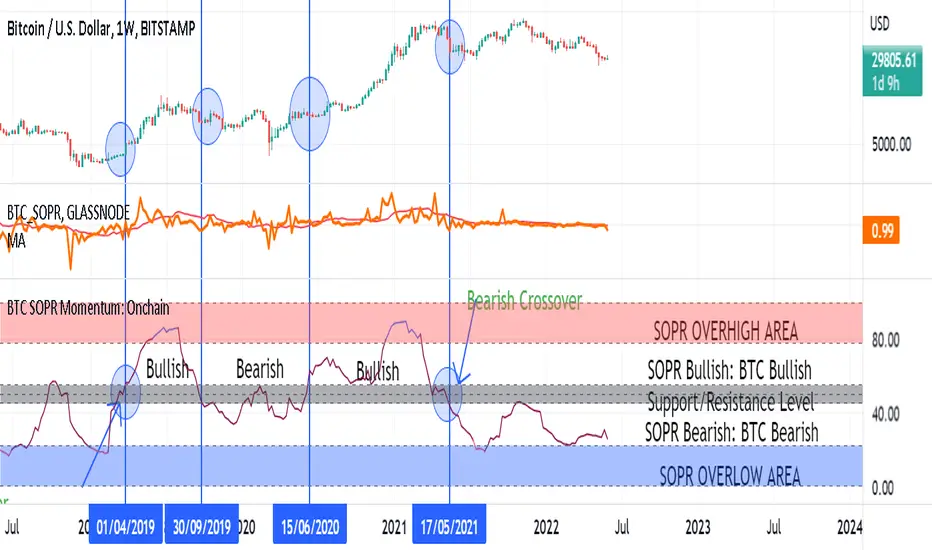
BTC SOPR Momentum: OnchainThis Onchin metric is based on SOPR data
Use this metric on daily and weekly timeframes:
SOPR:
The Spent Output Profit Ratio (SOPR) is computed by dividing the realized value (in USD) divided by the value at creation (USD) of a spent output. Or simply: price sold / price paid. Renato Shirakashi created this metric. When SOPR > 1, it means that the owners of the spent outputs are in profit at the time of the transaction; otherwise, they are at a loss. You can find "SOPR" in tradingview indicators
BTC SOPR Momentum: Onchain
This metric is based on SOPR Momentum. I made some changes to it so that its momentum can be checked.
Interpretation:
If the indicator is above the gray level of resistance/support, bitcoin has an uptrend and Bullish bias
If the indicator is below the resistance/ support level, bitcoin has a downtrend and Bearish Bias
Crossup the gray level is a long signal
Cross-down the gray level is a shorts signal
Entering and exit of the indicator to the overhigh area means creating a top
Entering and leaving the indicator to the overflow area means creating a bottom
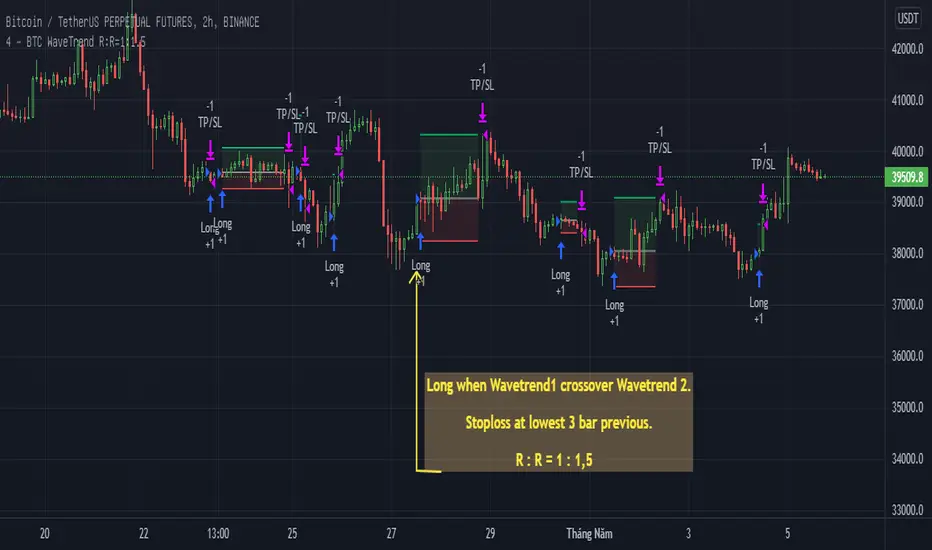
BTC WaveTrend R:R=1:1.5In this strategy, I used Wavetrend indicator (Lazy Bear).
It is very simple and easy to understanding: Long when Wavetrend1 crossover Wavetrend2 and they are less than a limit value (not buy when price overbought). Stoploss at lowest 3 bar previous. R:R = 1:1,5.
About other shortterm strategies for crypto market, you can view my published strategies.
BTC Price vs COP Spread Chart Wanted to create a spread chart using BTC and some cost of production estimates. In any commodity using COP is a great way to define "value" and typically there's about 100-150% markup for investors to keep in mind when using this metric in their analysis. Thanks to Grimm for the spread idea/request. #PMAFTW // Original cop code taken from;
BTC Gravity OscillatorThis indicator is a deviation of a Center of Gravity Oscillator corrected for the diminishing returns of Bitcoin.
I've set up this indicator for it to be used on the weekly timeframe. The indicator oscillates between 0 and 10, where 0 indicates oversold conditions and 10 indicates overbought conditions.
The indicator plots in any BTCUSD spot, futures , BLX index and BTCEUR .
It paints in all time frames, but Weekly time frame is the correct one to interpret the 'official' read of it.

BTC Futures BasisShows various basis percentages in a table and plots historical basis. Also has an alert function for backwardation events. Useful for tracking bullish/bearish sentiment in BTC futures markets.
*Currently displays March and June futures for the following exchanges: Bitmex, Binance, Deribit, Okex, and FTX
Also displays CME Continuous Next Contract. All of the symbols are customizable.
-----------
Market-wide backwardation usually occurs during a heavy sell-off (such as a liquidation cascade).
**For getting alerts of backwardation events, I recommend creating an alert on the 1 minute chart with the condition "Any alert() function call". Alert level is customizable as well.
-----------
*NOTE!! : Futures contracts expire (obviously), so the contract symbols will need to be updated periodically. I will try to keep them updated going into the future.
**NOTE2!! : The alert() function does not track the CME contract. This is to avoid false triggers.

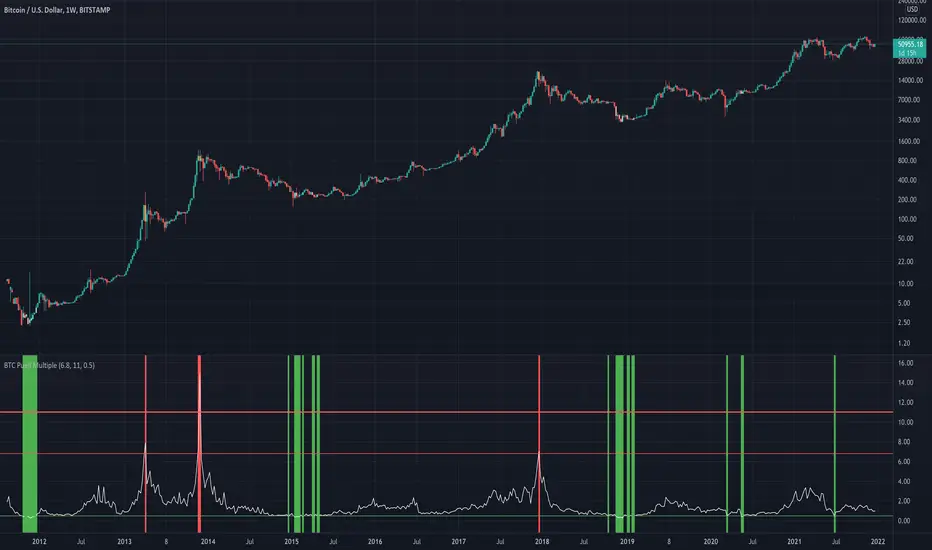
BTC Puell Multiple with alert functionThe Puell Multiple examines the fundamentals of mining profitability and the way they shape market cycles. It is calculated by taking a ratio of daily coin issuance (in USD) and the 365 moving average of daily coin issuance (in USD).
Interpretation of the Puell Multiple can generally be considered in the following framework:
high values indicate that current miner profitability if high compared to the yearly average. As such, the incentive for miners to liquidate their treasuries is high and greater sell pressure may be expected.
Low values indicate that current miner profitability is low compared to the yearly average. As such, income stress may become a factor, and some miners may need to start reducing hash-power by switching off rigs. This increases the hash-share of remaining miners who can then sell fewer coins to cover their operations, reducing their impact on liquid supply.
Halving events will drop the current coin issuance by 50% relative to the preceding year creating an immediate halving of the Puell Multiple also. The effect on miner profitability will thus be as per the point on low values above.
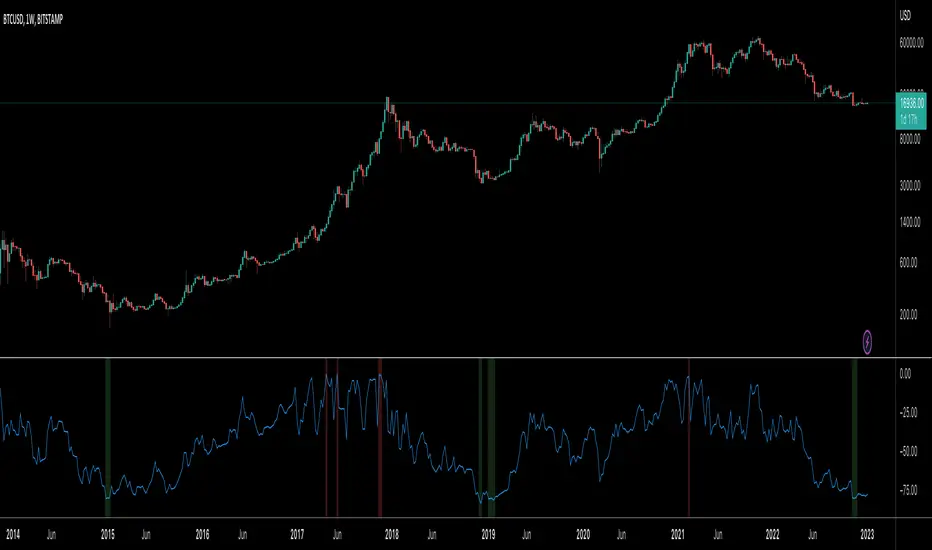
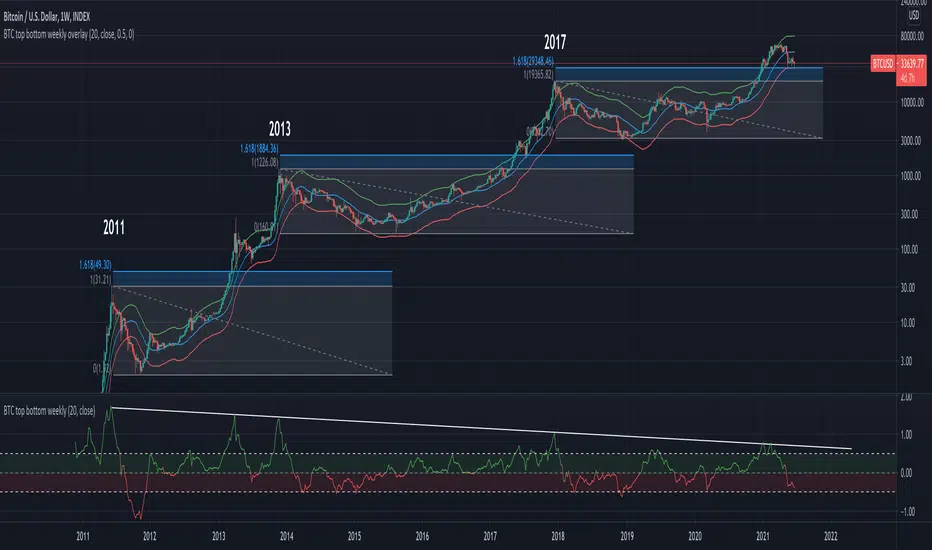
BTC top bottom weekly oscillatorThis indicator is based on the 20 weekly simple moving average and it could be used to help finding potential tops and bottoms on a weekly BTC chart.
This version uses an "oscillator" presentation, it fluctuates around the value zero.
The indicator plots 0 when the close price is near the 20 weekly moving average.
If it's below 0 it reflects the price being below the 20 weekly moving average, and opposite for above.
IT's possible to see how many times the price has hit the 0.5 coef support. In one case it hit 0.6 showing that the 0.5 support can be broken.
The indicator is calculated as Log(close / sma(close))
Instructions:
- Use with the symbol INDEX:BTCUSD so you can see the price since 2010
- Set the timeframe to weekly
Optionals:
- change the coef to 0.6 for a more conservative bottom
- change the coef to 0.4 for a more conservative top
BTC aggregated volume Index [Benson]Aggregate 10 most significant BTC trading pairs' volume on the market.
Bitfinex:BTCUSD
Bitstamp:BTCUSD
Coinbase:BTCUSD
Kraken:BTCUSD
Kraken:BTCEUR
Bitflyer:BTCJPY
BINANCE:BTCUSDT
HUOBI:BTCUSDT
OKEX:BTCUSDT
Bitstamp:BTCEUR
Setting (user input)
1. You can set length to see how SMA moves. Default is 7.
2. You can set std difference. If the volume is difference*std higher than average, the pillar would be orange, if difference*std is less than average, the pillar would be green, otherwise the pillar would be black. Default is 1.
3. You can set the volume in USD or in BTC. Default is in USD.

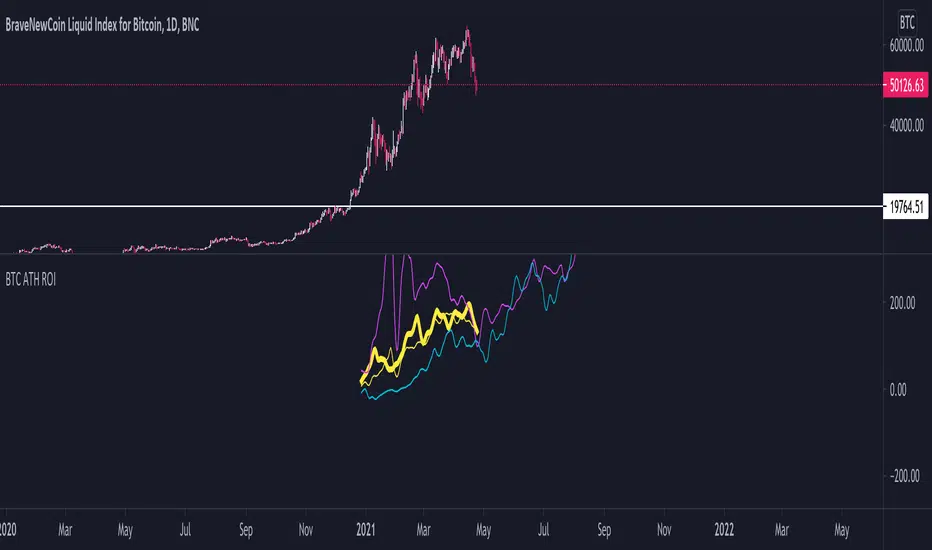
BTC ATH ROIThis indicator shows the ROI % of Bitcoin from when it passed its ATH of the previous bull cycle. I found it interesting that each time it crossed its ATH it took around 260-280 days to peak for each one. This bull run seems to follow between both of the previous bull runs including this recent dip.
There are a couple issues I want to fix but can't figure out:
1. You need to completely scroll out and move towards 2013 on the Daily chart for all 3 lines to show up. Would be nice to load all of that data at the start.
2. I can't query the value of the plots after they have been offset. This would be useful to create a prediction bias for the current plot so would could see where btc might go.
If you peeps know of a way to load all data or query plot values after offsets, please share. That would be awesome.
BTC Multi Exchange Perpetual PremiumThis script tracks the premium/discount of Bitcoin perpetual contracts at various exchanges.
The premium/discount is calculated against an index price. The index price is calculated from spot exchange prices and are weighted as follows:
Bitstamp:28,81%
Bittrex:5,5%
Coinbase: 38,07%
Gemini: 7,34%
Kraken: 20,28
The difference between this script and other available scripts, is that exciting script seems to only focus on one exchange. This script is also open source.

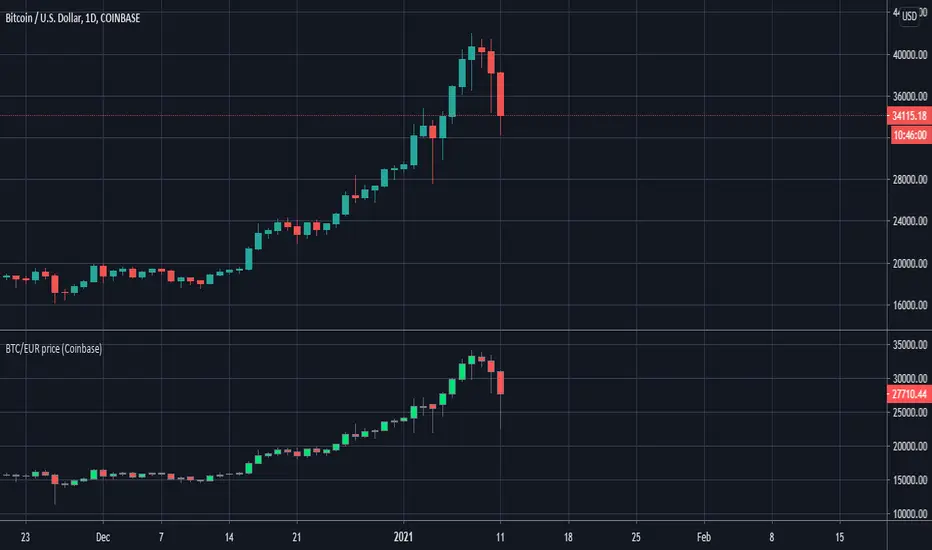
BTC Premium (Grayscale & Coinbase)This indicator plots the bitcoin premium on Grayscale and Coinbase in %.

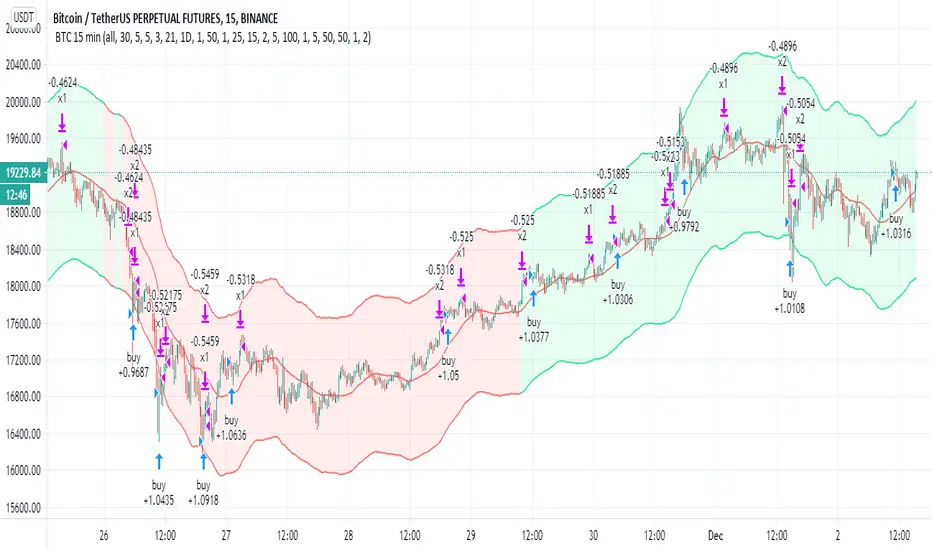
BTC 15 minThis strategy try to catch the uptrend mainly (seems to work on BTC 15 less on others)
the aim is to get 2% in uptrend which is more easy to do then to search only for lowest
since it buy in uptrend it can risky if market change direction
there are two take profit (1% and 2% ) , you take out 50% of equity after the first 1% gain
the stop loss and re buy set 5%
so you exit after 5 % loss and re buy it again at lower price
the aim here is to do leverage trades so you can calculate your risk or lot and the leverage power you want
now set on 100% lot leverage X1
you can try any combination you want but when you do leverage trading you need to do things that the back tester of TV cannot do so well
for example if you put 100X leverage you will be liquidated at 1%
50=2%
20=5%
10=10%
5=20%
you need that your stop loss will be above the liquidation level
stop loss are shit in margin trades as they can kick you out very fast and you will lose many good trades
so I prefer 5X max 10 X trade (this bot can work by himself but i prefer to do it manually for this kind of trades.
all u need to do is to choose what risk you want to have (3% of lot? 5%, 10% or higher )
so this tool try to give you upward buy strategy that aim to get longs at upward trends (short targets that are more easy to get )
and to use leverage as way to make more profit (now bot set to no leverage )
be wise with your money :)
the bot not suppose to repaint but if you find repaint issue then let me know
buy system is based on cross of linear over modified non repainted HMA that set to 1 min (so it buy the uptrend only+ filter based on ema that try not to start cycle of buy in down traade
sell is not so important is mainly cased on percentage channel seen
trend color on Chanel not related to the buy and sell system
BTC risk gagueThis indicator measures the risk of buying/selling BTC at a certain price. It calculates the percentage difference between the 20 weekly SMA and price at the weekly close. This indicator is designed to be used under weekly scale.