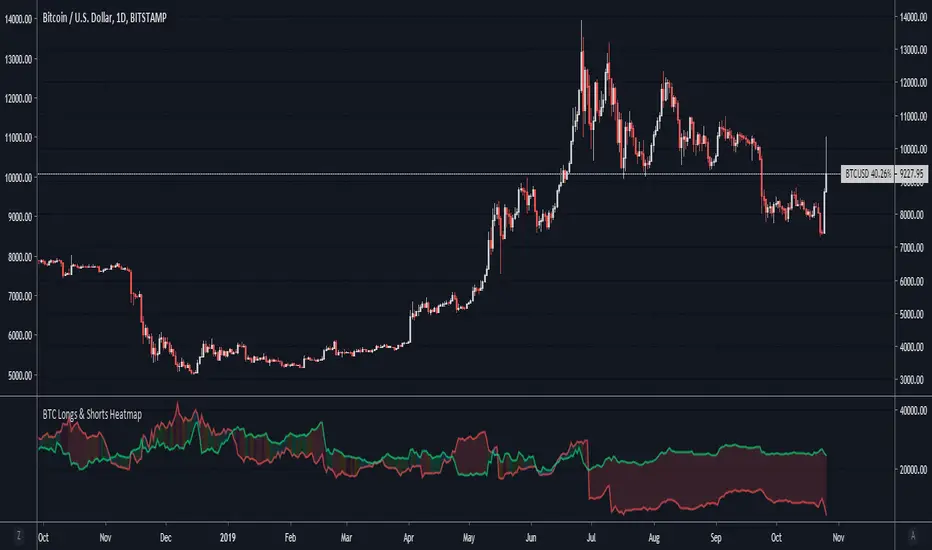
BTC Longs & Shorts HeatmapBitfinex Bitcoin Long and Short positions visualization with colored background.
Original author: @autemox
ابحث في النصوص البرمجية عن "btc走势预测"
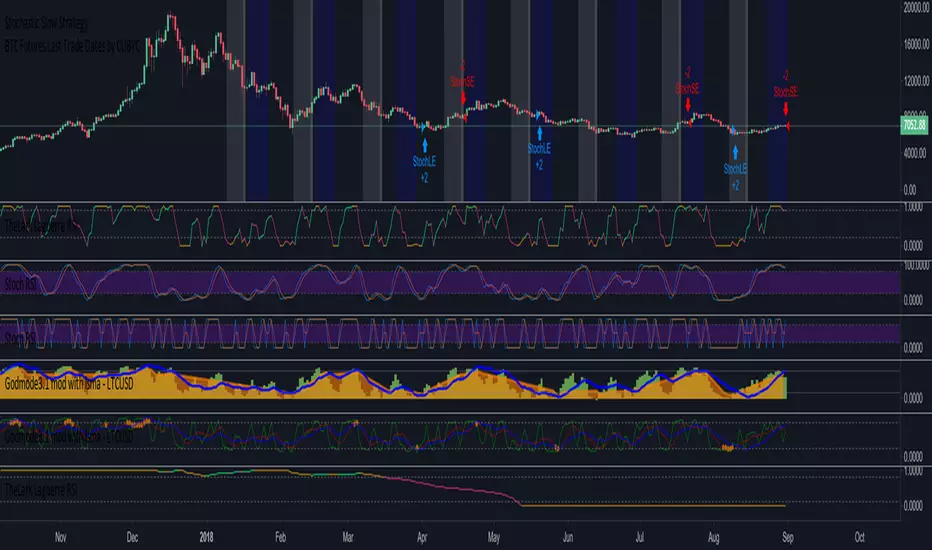
BTC Daily Strategy BFStrategy based on code by @CredibleHulk so thanks for that.
This is a strategy for the Daily Bitcoin chart which uses the MACD, RSI, Stochastic RSI and a moving average.
The conditions for long or short signals depend on the indicators above crossing user-defined thresholds.
Long signal = (Stochastic RSI k value is below Stochastic Sell Threshold) AND EITHER (MACD delta crosses above MACD Threshold OR RSI crosses above RSI Threshold)
Short signal = (MACD delta crosses below 0) AND EITHER (Close Price - an SMA of the ohlc4 values crosses below the DMA threshold OR Stochastic RSI k value is above Stochastic Sell Threshold)
INSTRUCTIONS
Green background = go long
Red background = go short
You can adjust stop loss values for long or short signals in settings as well as all parameters for the indicators.

BTC Halvening 3 Bull Peak CrossThe 350dma x2 and 111dma Cross Predicting Bitcoin Halvening #3 Bull market end.
Don't change any settings Except the colors. Bitcoin Halvening #4 will require a slight adjustment as noted in the script notes.
This has been brought to you by the time traveller.


BTC Swinger v1Daily interval swing trading algorithm based on momentum techniques using ATR Stops. Made by Kory Hoang from Stably.
Shout out to the Advanced Crypto Asset Trading crew! ;)

BTC Volume Index [v2018-11-21] @ LekkerCryptisch.nlIndicates the volume trend:
~50 = short term volume is the same as long term volume
> 50 = short term volume is higher than long term volume (i.e. trend is rising volume)
< 50 = short term volume is lower than long term volume (i.e. trend is declining volume)

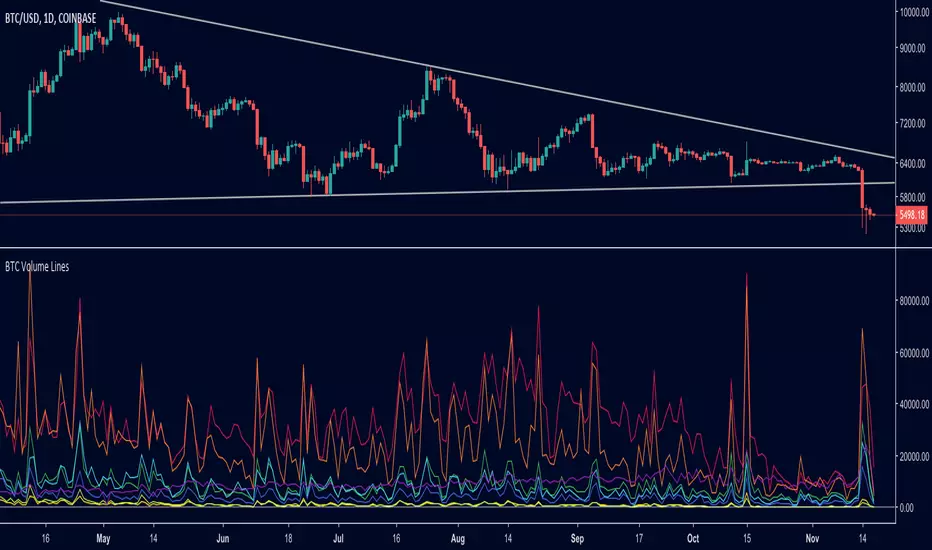
BTC Volume Lines [v2018-11-17] @ LekkerCryptisch.nlCombine the volume of 8 BTCUSD exchanges in one graph.
Three use cases:
1) See the absolute volumes in one graph
2) See the relative volumes in one graph
3) See the deviation of the EMA the volumes in one graph
BTC Combined VolumeI edited an existing script to include Bitmex volume. I'm no expert at this but I hope it works!
Cheers,
G

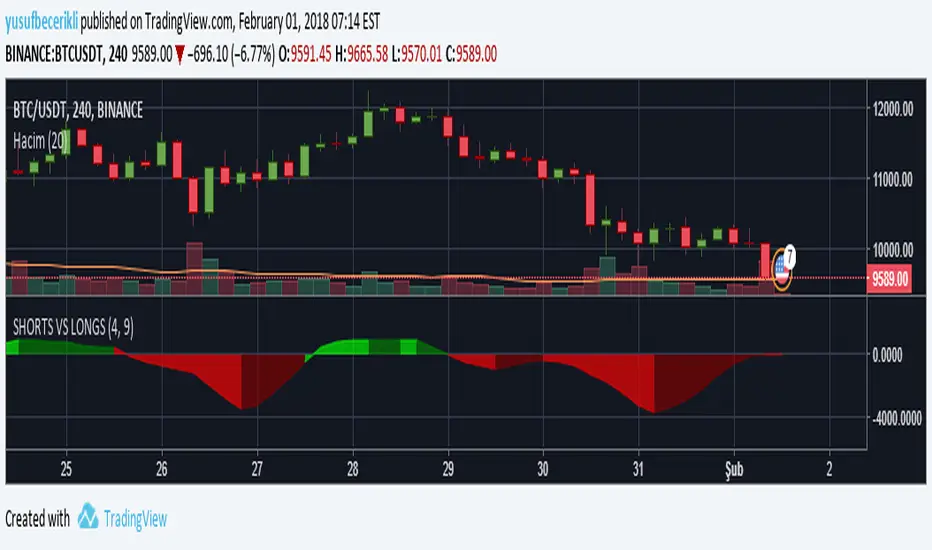
BTC longs n' shortsA indicator that neatly shows you BitFinex margin longs and shorts that can be put on any chart!

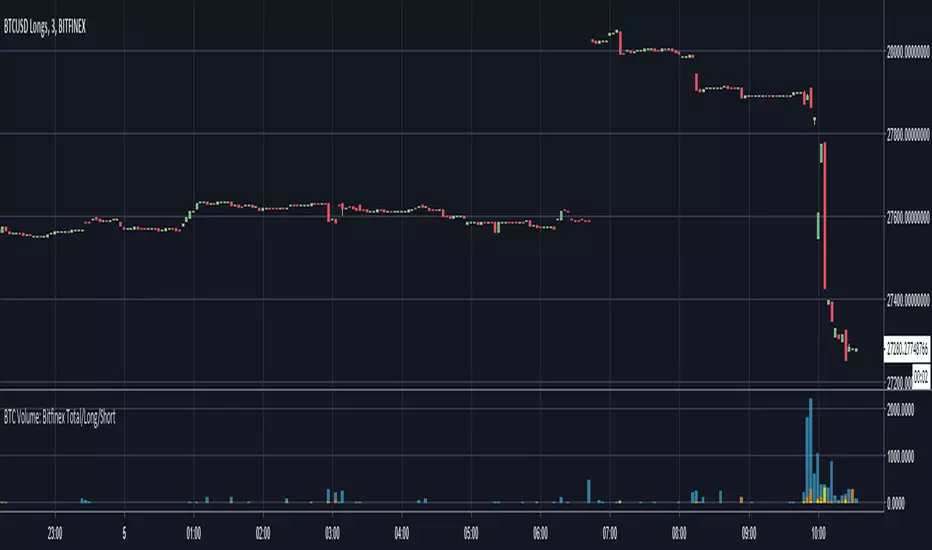
BTC Volume: Bitfinex Total/Long/ShortQuick little script to show Bitfinex LONG/SHORT positions in context to overall volume on the TF. Works best on small TFs to eliminate fluctuation in margin positions impacting the 'accuracy' of volume.
Base Color Scheme
Blue: Total Bitfinex traded volume
Yellow: Assumed Volume of BTCUSDLONGS (Close Position - Open Position)
Orange: Assumed Volume of BTCUSDSHORTS (Close Position - Open Position)
Work is based on conversations and community interaction through Crypto Traders Pro.
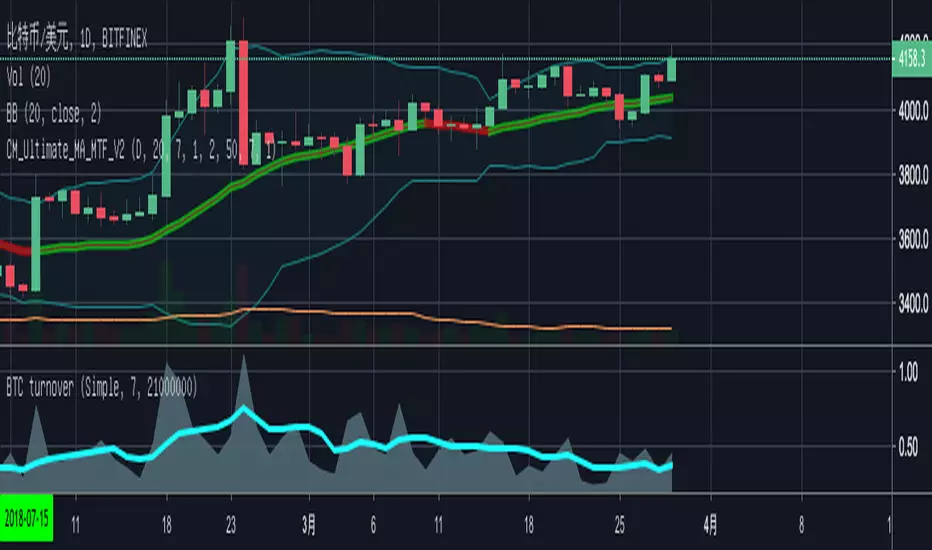
BTC Turn Over Rate (Multi-Exchange) [v2018-08-22]Turnover rate is used to judge the period when the main chip is concentrated and dispersed.


BTC Prices (BFX,BITS,CB,BINANCE)Minimal price tracker. Publishing just in case it deletes itself two times. Haha.
Color coded. It will be easy to add other exchanges if need be.

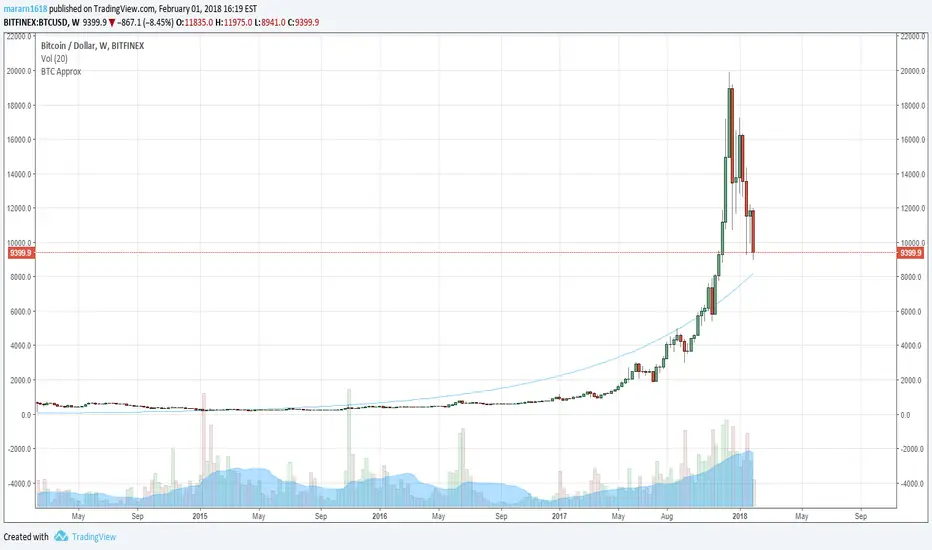
BTC Approximation (BETI) - Bitcoin Exponential Trend//based on
//https://www.wolframalpha.com/input/?i=e+%5E+(+0.00331836433279664++(+number+of+seconds+since+jul+17,+2010+12pm+UTC%2F86400%2Fseconds+)+-0.120774828196607+)
//https://bitcointalk.org/index.php?topic=470453.680