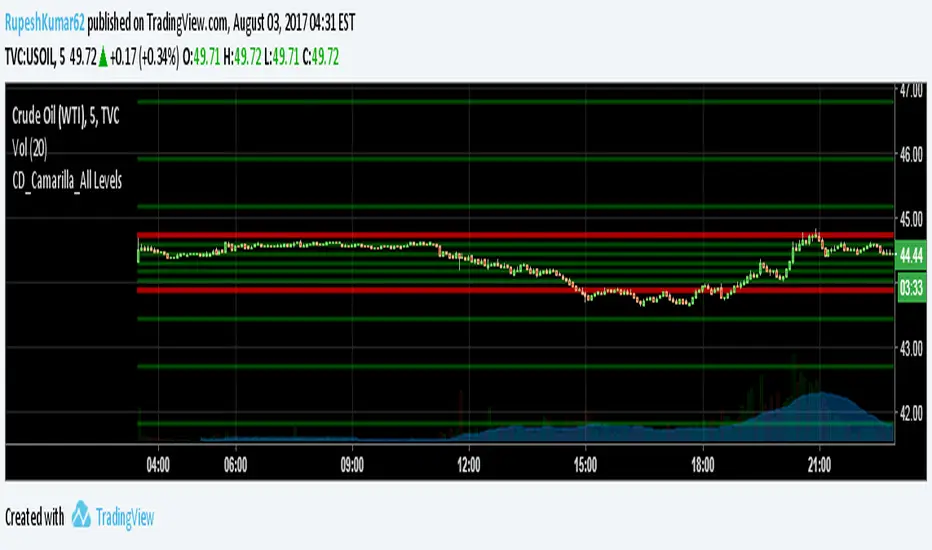
Hybrid Pivot Zones [DW]This is an experimental study designed to identify potential areas of support and resistance using a hybrid between Camarilla and Fibonacci pivot calculations.
The levels are calculated by taking 110% of the previous interval's range multiplied by 8.33%, 16.67%, 25%, 50%, 61.8%, 78.6%, 100%, 127.2%, 141.4%, and 161.8%, then adding them above and below the interval open.
Custom bar colors are included.
ابحث في النصوص البرمجية عن "camarilla"


All in one pivot by AkhileshCamarilla Trade Setup:
Sell Opportunity:
H3 Reversal Trade
Entry - H3
Stop Loss - H4
Target - L3
L4 Breakout Trade
Entry - L4
Stop Loss - L3
Target - L5
Buy Opportunity:
L3 Reversal Trade
Entry - L3
Stop Loss - L4
Target - H3
H4 Breakout Trade
Entry - H4
Stop Loss - H3
Target - H5
Trade Type:
Scalping trading
Intraday trading
CPR Trade Setup:
1. Narrow CPR indicates Trending market
2. Wide CPR indicates Sideways market


Camarilla all level with mid line This camrilla has mid line which is exact works as mid line of previous day
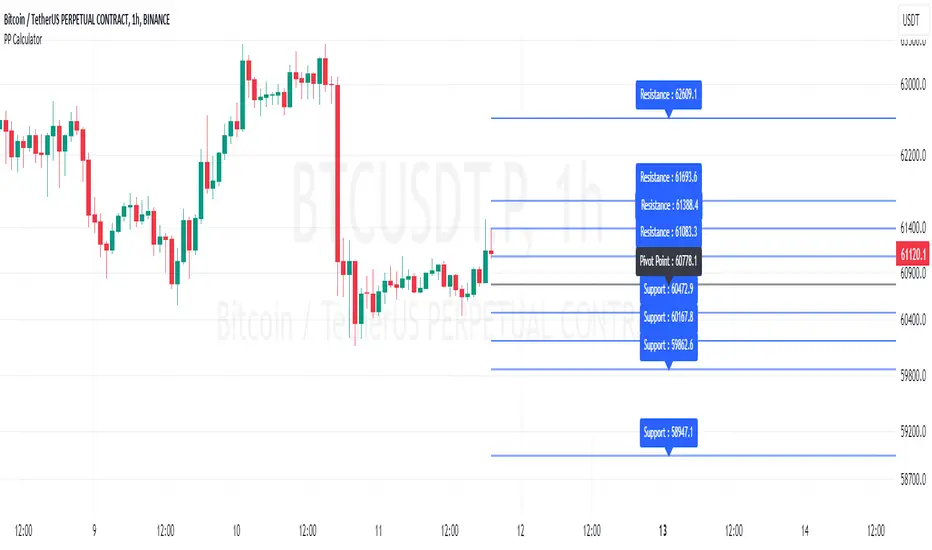
Pivot Point Calculator [JP&Dia]English User Guide
Script Name: Pivot Point Calculator
What Does This Script Do? This script calculates classic and Camarilla pivot points used in financial markets. Pivot points are used to identify key support and resistance levels, and this script helps traders better understand market movements.
How to Use It?
Add the script to your charts on TradingView.
Enter your desired time frame in the “Enter Time Frame” field (e.g., M, W, D).
Choose either or both “Classic Pivot” and “Camarilla Pivot” options to display them.
The script will automatically calculate the pivot points and display them on the chart.
Why Is This Script Unique? This script combines both classic and Camarilla pivot calculations, allowing users to easily utilize both pivot styles through a single script.
How Can People Benefit? Traders can use this script to identify potential buy-sell points and market trends. They can also conduct their market analyses more efficiently and effectively.
Script Adı: Pivot Noktası Hesaplayıcı
Script Ne İşe Yarar? Bu script, finansal piyasalarda kullanılan klasik ve Camarilla pivot noktalarını hesaplar. Pivot noktaları, önemli destek ve direnç seviyelerini belirlemek için kullanılır ve bu script, yatırımcıların piyasa hareketlerini daha iyi anlamalarına yardımcı olur.
Nasıl Kullanılır?
Scripti TradingView’deki grafiklerinize ekleyin.
“Zaman Dilimi Girin” alanına istediğiniz zaman dilimini girin (Örneğin: M, W, D).
“Classic Pivot” ve “Camarilla Pivot” seçeneklerinden birini veya her ikisini de seçerek gösterilmesini sağlayabilirsiniz.
Script otomatik olarak pivot noktalarını hesaplayacak ve grafik üzerinde gösterecektir.
Neden Özgü Bir Script? Bu script, hem klasik hem de Camarilla pivot hesaplamalarını birleştirir ve kullanıcıların her iki pivot stilini de tek bir script üzerinden kolayca kullanmalarını sağlar.
İnsanlar Nasıl Faydalanabilir? Yatırımcılar, bu scripti kullanarak potansiyel alım-satım noktalarını ve piyasa trendlerini belirleyebilirler. Ayrıca, piyasa analizlerini daha verimli ve etkili bir şekilde yapabilirler.
SHA Multi Pivot Points -v1.0.0🔎Using Pivot Points in Trading
Traders use PPs to help determine predefined support and resistance levels to guide their trading strategies. In addition, traders identify potential price reversals, trend direction, and breakout opportunities:
Trend identification: PPs act as a reference level to gauge market sentiment. If the price opens above the PP and remains above it, traders interpret this as an uptrend. Conversely, if the price opens below the pivot point and stays below, it suggests a downtrend.
Support and resistance determination: Pivot levels are natural barriers where price reactions frequently occur. Traders may enter long positions near support levels, expecting a price bounce, or if the price approaches resistance levels, traders may consider shorting the asset.
Breakout trading: When the price breaks above resistance or support, it may indicate strong momentum for further movement.
Reversal identification: Traders also look for failed breakouts or price rejections at pivot levels to anticipate reversals.
Trading strategy combinations: Traders can improve accuracy by combining PPs with other technical analysis indicators.
1. Camarilla Pivot Points
📌 Overview:
Developed by Nick Scott in 1989, Camarilla Pivot Points are designed for short-term, intraday trading. Unlike traditional pivots, Camarilla levels are tighter and more responsive, making them useful in volatile markets.
📐 Key Levels:
It generates eight levels:
- Resistance: Initial Level (R1), Mid-range Level (R2), Sell Reversal Level (R3), Breakout Level (R4)
- Support: Initial Level (S1), Mid-range Level (S2), Buy Reversal Level (S3), Breakout Level (S4)
✅ How to Use:
- S1/R1 + RSI or volume divergence to confirm weak momentum and early reversals.
- S2/R2 with price action patterns to enter early on major moves before L3/H3 get tested.
- S3/R3: Mean-reversion zones → price often reverses.
- Break of S4/R4: Strong breakout → trend-following signal.
- Combine with volume or candlestick confirmation for entries.
🔹 2. Floor (Standard) Pivot Points
📌 Overview:
This is the most traditional pivot method, widely used by floor traders. It’s symmetrical and provides a clear central pivot point with equally spaced support and resistance levels.
📐 Key Levels:
- Povit Points : Average price (PPs)
- Resistance : First price ceiling (R1), Stronger ceiling (R2), Extreme resistance (R3)
- Support : First price floor (S1), Stronger floor (S2), Extreme support (S3)
✅ How to Use:
- Above PPs = bullish bias; Below PPs = bearish bias.
- S1/R1 are most used for intraday targets.
- S2–S3/R2–R3 indicate potential extreme moves.
- Often used in combination with momentum indicators.
🔹 3. Woodie Pivot Points
📌 Overview:
Woodie’s pivot formula gives double weight to the closing price, emphasizing the most recent session's sentiment.
📐 Key Levels:
- Povit Points : Weighted average (PPs)
- Resistance : First price ceiling (R1), Stronger resistance (R2)
- Support : First price floor (S1), Stronger support (S2)
✅ How to Use:
- Works best in fast-moving markets.
- PPs acts as a momentum-based balance level.
- Good for scalpers and momentum traders.
🔹 4. Fusion Pivot Points
📌 Overview:
This method differs significantly — it calculates only one support and one resistance level, adjusting based on the relationship between the open and close.
📐 Key Levels:
- Povit Points : Single directional (PPs)
- Resistance : Potential ceiling (R)
- Support : Potential floor (S)
✅ How to Use:
- Not symmetrical → more responsive to price behavior.
- Best for breakout or reversal strategies.
- Use when you're expecting directional momentum.
🔹 5. Classic Pivot Points (Traditional)
📌 Overview:
Also known as Standard or Traditional Pivot Points, this is the default method used by most charting platforms. It offers a balanced and simple framework.
📐 Key Levels:
- Povit Points : Central price level (PPs)
- Resistance : First ceiling (R1), Stronger resistance (R2), Extreme resistance (R3)
- Support : First floor (S1), Stronger floor (S2), Extreme support (S3)
✅ How to Use:
- PPs is the market’s equilibrium point.
- Helps define market structure, bias, and trade zones.
- Combine with order blocks, RSI, or MACD for confirmation.
📊 Summary Comparison :
1. Camarilla Pivot Points
- Focus : Mean Reversion & Breakouts
- Best Use : Scalping, Day Trading
2. Floor Pivot Points
- Focus : General Support/Resistance
- Best Use : Intraday, Swing
3. Woodie Pivot Points
- Focus : Recent Close Emphasis
- Best Use : Momentum Trading
4. Fusion Pivot Points
- Focus : Trend/Breakout
- Best Use : Directional Breakouts
5. Classic Povit Points
- Focus : Market Structure
- Best Use : General Use
⚠️ Disclaimer
The information and tools provided in this script are for educational and informational purposes only. They do not constitute financial advice, investment recommendations, or a solicitation to buy or sell any financial instrument.
Trading in the financial markets involves risk of loss and is not suitable for every investor. You are solely responsible for your trading decisions. Always do your own research, use proper risk management, and consult a licensed financial advisor before making any financial decisions.

Demo GPT - Day Trading Scalping StrategyOverview:
This strategy is designed for day trading and scalping, utilizing a combination of technical indicators, candlestick patterns, and volume analysis to determine entry and exit points. It focuses on capturing short-term price movements while ensuring that trades are executed under specific market conditions.
Key Components:
Technical Indicators Used:
Exponential Moving Average (EMA): The strategy uses the 20-period EMA to identify the trend direction. The EMA smooths out price data, helping traders make more informed decisions about potential buy or sell signals.
Volume Weighted Average Price (VWAP): VWAP is used to measure the average price a security has traded at throughout the day, based on both volume and price. This indicator helps assess whether the current price is above or below the average trading price.
Camarilla Pivot Points: The strategy calculates four levels of Camarilla pivots (S2, S3, R2, R3) based on the highest and lowest prices over the last 14 daily candles. These levels act as potential support and resistance zones, guiding entry and exit decisions.
Candlestick Analysis:
Buy Condition: A buy signal is triggered when:
The first candle (previous candle) is green (close > open).
The second candle (current candle) is also green and opens above the first candle.
The volume of the current candle exceeds the 20-period moving average of volume, indicating strong buying interest.
Sell Condition: A sell signal is triggered when:
The first candle is red (close < open).
The second candle opens below the first red candle.
The volume of the current candle also exceeds the 20-period moving average of volume, indicating strong selling pressure.
Position Management:
The strategy enters a long position (buy) when the buy condition is met and closes the long position when the sell condition is met. This approach aims to capture upward momentum while avoiding extended exposure to downside risks.
Trading Settings:
Capital Management: The strategy uses 100% of available capital for each trade, allowing for maximum exposure to potential gains.
Commission and Slippage: The script includes settings for a commission rate of 0.1% and slippage of 3, accounting for trading costs and potential price changes during order execution.
Date Filtering: The strategy allows users to set a start date (January 1, 2018) and an end date (December 31, 2069) for trade execution, providing flexibility in backtesting and live trading.
Visualization:
The script plots the 20 EMA, VWAP, and the Camarilla pivot levels on the chart for visual reference.
Buy and sell signals are visually represented with shapes on the chart, making it easy to identify potential trade opportunities at a glance.
Volume is plotted in a separate pane to assess trading activity, and a horizontal line at zero provides a reference point.
Summary:
This Day Trading Scalping Strategy is designed to exploit short-term price movements by using a combination of EMAs, VWAP, and Camarilla pivot levels, alongside candlestick patterns and volume analysis. It is well-suited for traders looking to make quick trades based on real-time market conditions while maintaining a disciplined approach to entry and exit points. The strategy is highly visual, allowing traders to quickly assess market conditions and make informed trading decisions.
Feel free to modify or adjust any aspects of the strategy according to your specific trading goals or preferences!

Pivot Points Level [TradingFinder] 4 Methods + Reversal lines🔵 Introduction
"Pivot Points" are places on the price chart where buyers and sellers are most active. Pivot points are calculated based on the previous day's price data and serve as reference points for traders to make decisions.
Types of Pivot Points :
Floor
Woodie
Camarilla
Fibonacci
🟣 Floor Pivot Points
Floor pivot points are widely used in technical analysis. The central pivot point (PP) serves as the main level of support or resistance, indicating the potential direction of the trend.
The first to third levels of resistance (R1, R2, R3) and support (S1, S2, S3) provide additional signals for potential trend reversals or continuations.
Floor Pivot Points Formula :
Pivot Point (PP): (H + L + C) / 3
First Resistance (R1): (2 * P) - L
Second Resistance (R2): P + H - L
Third Resistance (R3): H + 2 * (P - L)
First Support (S1): (2 * P) - H
Second Support (S2): P - H + L
Third Support (S3): L - 2 * (H - P)
🟣 Camarilla Pivot Points
Camarilla pivot points include eight levels that closely align with support and resistance. These points are particularly useful for setting stop-loss and profit targets.
Camarilla Pivot Points Formula :
Fourth Resistance (R4): (H - L) * 1.1 / 2 + C
Third Resistance (R3): (H - L) * 1.1 / 4 + C
Second Resistance (R2): (H - L) * 1.1 / 6 + C
First Resistance (R1): (H - L) * 1.1 / 12 + C
First Support (S1): C - (H - L) * 1.1 / 12
Second Support (S2): C - (H - L) * 1.1 / 6
Third Support (S3): C - (H - L) * 1.1 / 4
Fourth Support (S4): C - (H - L) * 1.1 / 2
🟣 Woodie Pivot Points
Woodie pivot points are similar to floor pivot points but place more emphasis on the closing price. This method often results in different pivot levels than the floor method.
Woodie Pivot Points Formula :
Pivot Point (PP): (H + L + 2 * C) / 4
First Resistance (R1): (2 * P) - L
Second Resistance (R2): P + H - L
First Support (S1): (2 * P) - H
Second Support (S2): P - H + L
🟣 Fibonacci Pivot Points
Fibonacci pivot points use the standard floor pivot points and then apply Fibonacci retracement levels to the range of the previous trading period. The common retracement levels used are 38.2%, 61.8%, and 100%.
Fibonacci Pivot Points Formula :
Pivot Point (PP): (H + L + C) / 3
Third Resistance (R3): PP + ((H - L) * 1.000)
Second Resistance (R2): PP + ((H - L) * 0.618)
First Resistance (R1): PP + ((H - L) * 0.382)
First Support (S1): PP - ((H - L) * 0.382)
Second Support (S2): PP - ((H - L) * 0.618)
Third Support (S3): PP - ((H - L) * 1.000)
These pivot point calculations help traders identify potential support and resistance levels, enabling more informed decision-making in their trading strategies.
🔵 How to Use
🟣 Two Methods for Trading Pivot Points
There are two primary methods for trading pivot points: trading with "pivot point breakouts" and trading with "price reversals."
🟣 Pivot Point Breakout
A breakout through pivot lines provides a significant signal to the trader, indicating a change in market sentiment. When an upward breakout occurs and the price crosses these lines, a trader can enter a long position and place their stop-loss below the pivot point (P).
Similarly, if a downward breakout happens, a short order can be placed below the pivot point.
When trading with pivot point breakouts, if the upward trend breaks, the first and second support levels can be the trader's profit targets. In a downward trend, the first and second resistance levels will serve this role.
🟣 Price Reversal
Another method for trading pivot points is waiting for the price to reverse from the support and resistance levels. To execute this strategy, one should trade in the opposite direction of the trend as the price reverses from the pivot point.
It's worth noting that although traders use this tool in higher time frames, it yields better results in shorter time frames such as one-hour, 30-minute, and 15-minute intervals.

ICT KillZones + Pivot Points [TradingFinder] Support/Resistance 🟣 Introduction
Pivot Points are critical levels on a price chart where trading activity is notably high. These points are derived from the prior day's price data and serve as key reference markers for traders' decision-making processes.
Types of Pivot Points :
Floor
Woodie
Camarilla
Fibonacci
🔵 Floor Pivot Points
Widely utilized in technical analysis, floor pivot points are essential in identifying support and resistance levels. The central pivot point (PP) acts as the primary level, suggesting the trend's likely direction.
The additional resistance levels (R1, R2, R3) and support levels (S1, S2, S3) offer further insight into potential trend reversals or continuations.
🔵 Camarilla Pivot Points
Featuring eight distinct levels, Camarilla pivot points closely correspond with support and resistance, making them highly effective for setting stop-loss orders and profit targets.
🔵 Woodie Pivot Points
Similar to floor pivot points, Woodie pivot points differ by placing greater emphasis on the closing price, often resulting in different pivot levels compared to the floor method.
🔵 Fibonacci Pivot Points
Fibonacci pivot points combine the standard floor pivot points with Fibonacci retracement levels applied to the previous trading period's range. Common retracement levels used are 38.2%, 61.8%, and 100%.
🟣 Sessions
Financial markets are divided into specific time segments, known as sessions, each with unique characteristics and activity levels. These sessions are active at different times throughout the day.
The primary sessions in financial markets include :
Asian Session
European Session
New York Session
The timing of these major sessions in UTC is as follows :
Asian Session: 23:00 to 06:00
European Session: 07:00 to 14:25
New York Session: 14:30 to 22:55
🟣 Kill Zones
Kill zones are periods within a session marked by heightened trading activity. During these times, trading volume surges and price movements become more pronounced.
The timing of the major kill zones in UTC is :
Asian Kill Zone: 23:00 to 03:55
European Kill Zone: 07:00 to 09:55
New York Kill Zone: 14:30 to 16:55
Combining kill zones and pivot points in financial market analysis provides several advantages :
Enhanced Market Sentiment Analysis : Aligns key price levels with high-activity periods for a clearer market sentiment.
Improved Timing for Trade Entries and Exits : Helps better time trades based on when price movements are most likely.
Higher Probability of Successful Trades : Increases the accuracy of predicting market movements and placing profitable trades.
Strategic Stop-Loss and Profit Target Placement : Allows for precise risk management by strategically setting stop-loss and profit targets.
Versatility Across Different Time Frames : Effective in both short and long time frames, suitable for various trading strategies.
Enhanced Trend Identification and Confirmation : Confirms trends using both pivot levels and high-activity periods, ensuring stronger trend validation.
In essence, this integrated approach enhances decision-making, optimizes trading performance, and improves risk management.
🟣 How to Use
🔵 Two Approaches to Trading Pivot Points
There are two main strategies for trading pivot points: utilizing "pivot point breakouts" and "price reversals."
🔵 Pivot Point Breakout
When the price breaks through pivot lines, it signals a shift in market sentiment to the trader. In the case of an upward breakout, where the price crosses these pivot lines, a trader might enter a long position, placing their stop-loss just below the pivot point (P).
Conversely, if the price breaks downward, a short position can be initiated below the pivot point. When using the pivot point breakout strategy, the first and second support levels can serve as profit targets in an upward trend. In a downward trend, these roles are filled by the first and second resistance levels.
🔵 Price Reversal
An alternative method involves waiting for the price to reverse at the support and resistance levels. To implement this strategy, traders should take positions opposite to the prevailing trend as the price rebounds from the pivot point.
While this tool is commonly used in higher time frames, it tends to produce better results in shorter time frames, such as 1-hour, 30-minute, and 15-minute intervals.
Three Strategies for Trading the Kill Zone
There are three principal strategies for trading within the kill zone :
Kill Zone Hunt
Breakout and Pullback to Kill Zone
Trading in the Trend of the Kill Zone
🔵 Kill Zone Hunt
This strategy involves waiting until the kill zone concludes and its high and low lines are established. If the price reaches one of these lines within the same session and is strongly rejected, a trade can be executed.
🔵 Breakout and Pullback to Kill Zone
In this approach, once the kill zone ends and its high and low lines stabilize, a trade can be made if the price breaks one of these lines decisively within the same session and then pulls back to that level.
🔵 Trading in the Trend of the Kill Zone
Kill zones are characterized by high trading volumes and strong trends. Therefore, trades can be placed in the direction of the prevailing trend. For instance, if an upward trend dominates this area, a buy trade can be entered when the price reaches a demand order block.

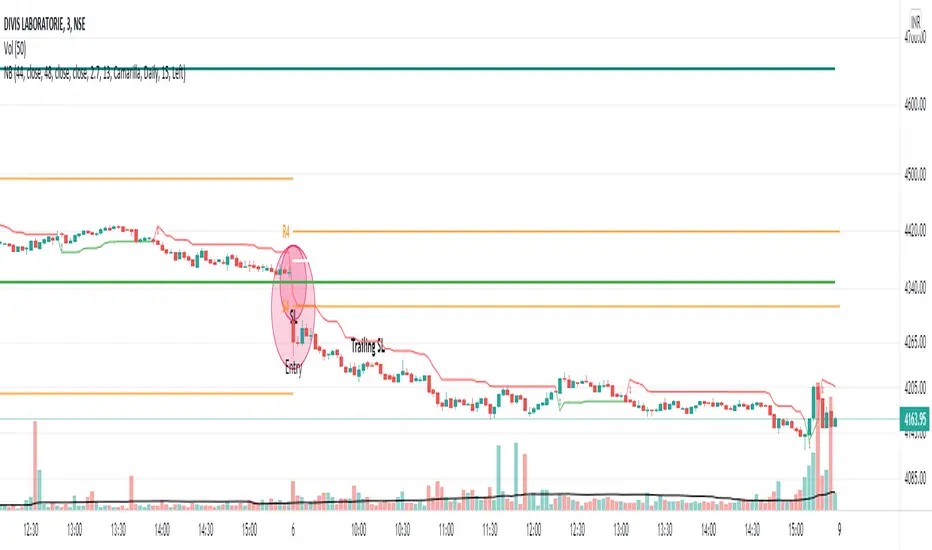
NoBrain BreakoutUse 3min. Time frame.
Buy Stock Selection:-
When Close Price Cross Monthly Standard Pivot R1 & Monthly Standard Pivot R1 is Greater than Previous Day High( PDH ) Or Close.
Price must be Above 44 MA ,48 EMA & Vwap
***Buy When 3min Candle closed Above Camarilla R4 or Monthly Standard Pivot R1 whichever is High.
Sell Stock Selection:-
When Close Price Cross Monthly Standard Pivot S1 & Monthly Standard Pivot S1 is Less than Previous Day Low( PDL ) Or Close.
Price must be Below 44 MA ,48 EMA & Vwap
***Sell When 3min Candle closed Below Camarilla S4 or Monthly Standard Pivot S1 whichever is Low.
Trading time for
1st wave 9.30am to 10.45am.
2nd wave 12.45pm to 2.45pm.
(Based on NSE/ BSE India)
Indicators:-
1) Pivot Points Standard - Time Frame monthly.only select R1
2) Pivot Points Camarilla- Only select R4.
3) SMA 44
4) EMA 48
5) Vwap
6) For Trailing Stop Loss use SuperTrend- Length-13 Factor-2.7 or Length-15 Factor-3 (3min Timeframe)
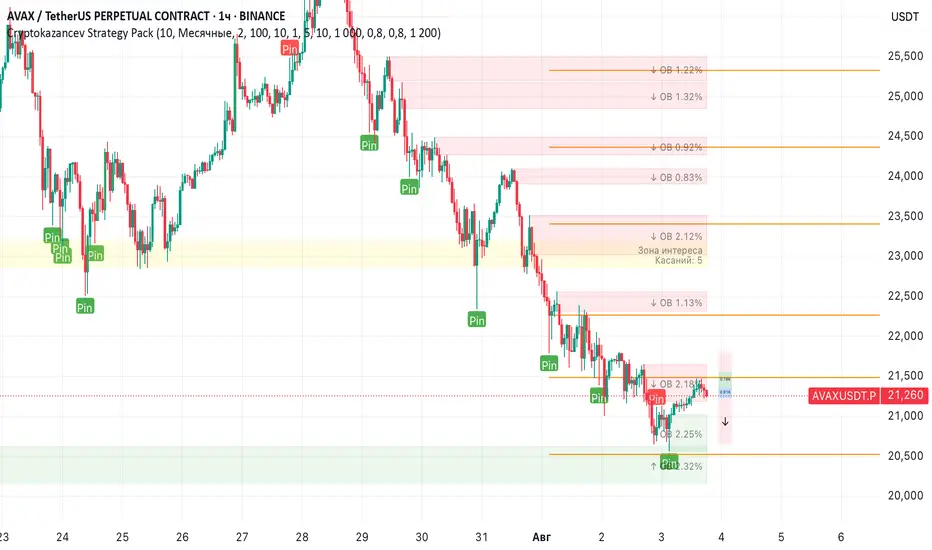
Cryptokazancev Strategy PackCryptokazancev Strategy Pack
Комплексный инструмент для анализа рыночной структуры / Comprehensive Market Structure Analysis Tool
🇷🇺 Описание на русском
Cryptokazancev Strategy Pack by ZeeZeeMon - это мощный набор инструментов для технического анализа, включающий:
• Ордерблоки (Order Blocks) с настройкой количества и цветов
• Пивоты (Pivot Points) различных таймфреймов
• Рыночную структуру с зонами Фибоначчи (0.618, 0.786)
• Разворотные конструкции (пинбары и поглощения)
• Зоны интереса на основе скопления свингов
📊 Основные функции:
1. Ордерблоки
- Автоматическое определение бычьих/медвежьих OB
- Настройка максимального количества блоков (до 30)
- Кастомизация цветов
2. Пивоты
- Поддержка таймфреймов: Дневные/Недельные/Месячные/Квартальные/Годовые
- Уровни Camarilla (P, R1-R4, S1-S4)
3. Рыночная структура
- Четкое определение тренда (UP/DOWN)
- Ключевые уровни Фибо (0.618 и 0.786)
- Настройка глубины анализа (10-1000 баров)
4. Разворотные конструкции
- Обнаружение пинбаров
- Обнаружение поглощений
- Настройка чувствительности
5. Зоны интереса
- Алгоритм кластеризации свингов
- Настройка через ATR-мультипликатор
- Лимит отображаемых зон
🇬🇧 English Description
ZeeZeeMon Pack is a comprehensive market analysis toolkit featuring:
• Order Blocks with customizable count and colors
• Pivot Points for multiple timeframes
• Market Structure with Fibonacci zones
• Reversal patterns (pinbars and engulfings)
• Interest Zones based on swing clustering
📊 Key Features:
1. Order Blocks
- Auto-detection of bullish/bearish OB
- Configurable max blocks (up to 30)
- Custom color schemes
2. Pivot Points
- Supports: Daily/Weekly/Monthly/Quarterly/Yearly
- Camarilla levels (P, R1-R4, S1-S4)
3. Market Structure
- Clear trend detection (UP/DOWN)
- Key Fibonacci levels (0.618 & 0.786)
- Adjustable analysis depth (10-1000 bars)
4. Reversal Patterns
- Smart pinbar detection
- ATR-based engulfing filter
- Sensitivity adjustment
5. Interest Zones
- Swing clustering algorithm
- ATR-multiplier configuration
- Display limit (up to 10 zones)
⚙️ Technical Highlights:
• Built with Pine Script v5
• Performance-optimized
• Well-commented code
• Flexible settings system
⚠️ Важно / Important:
Индикатор в бета-версии. Тестируйте перед использованием в реальной торговле.
This is BETA version. Please test before live trading.
💬 Поддержка / Support:
Комментарии к скрипту / Script comments section
Auto-Pivot Levels with Alerts and 4 methods [ChartWhizzperer]🚀 Auto-Pivot Levels – Dynamic Edition
Now with
Live Mode,
4 Pivot Methods
PineConnector-Ready Alerts!
Free, Open Source, Pine Script v6-compliant.
🟢 NEW: Live Mode (Ultra-Dynamic, Repainting) – Switchable in UI!
Instantly switch between Classic (session-based, repaint-free) and Live (rolling window, real-time, repainting) using the simple checkbox in the settings!
Live Mode recalculates all pivots on every tick/bar, using the current high/low/close for the chosen session (daily, weekly, monthly).
Perfect for:
Scalping and high-frequency trading
Real-time bot/automation setups (PineConnector-ready)
Fast-moving or breakout markets
Classic Mode: For traditional, stable levels based on confirmed session data – ideal for backtesting and trading history.
📊 Four Calculation Methods (Choose What Fits YOU):
1️⃣ Classic
Standard pivot calculation.
Based on previous session’s High, Low, Close.
Simple, proven, and suitable for any asset.
2️⃣ Fibonacci
Projects levels using Fibonacci ratios of the prior session’s range.
Great for traders who want to align pivots with fib retracements and extensions.
3️⃣ Camarilla
Uses unique multipliers for support/resistance, focusing on mean reversion and volatility.
Popular among futures and forex day traders.
4️⃣ Woodie
Puts extra weight on previous Close for more responsive pivots.
Often used in trending or choppy conditions.
Switch methods anytime in the UI – the script recalculates instantly and keeps your chart clean!
🔔 Level-Specific Alerts – PineConnector Ready!
Dedicated alert for EVERY level and direction (Up/Down):
Pivot (P), R1, R2, R3, S1, S2, S3
No configuration hassle:
All alerts are pre-defined in the TradingView Alert Panel.
Machine-readable message format:
PIVOT=R1 DIR=UP SYMBOL={{ticker}} PRICE={{close}}
Direct plug-and-play with PineConnector, webhooks, Discord, Telegram, bots, and other automation tools.
Never miss a breakout, reversal, or key support/resistance touch.
🛠 Powerful Customization & Performance
Session selection: Daily, Weekly, Monthly (choose what suits your trading style).
Show/hide any level (Pivot, R1–R3, S1–S3) for minimal chart clutter.
Color selection for each level to match your theme or highlight key pivots.
Auto-cleanup: Old lines and labels are cleared on every recalculation or session change for maximum performance and visual clarity.
Zero runtime errors: Strict Pine Script v6 practices for stability.
💡 How To Use – Quick Start
Add the indicator to your TradingView chart.
Pick your calculation method (Classic, Fibonacci, Camarilla, Woodie).
Set session type (Daily, Weekly, Monthly).
Switch between Classic and Live Mode with a single click in settings.
Customize your levels (on/off, colors).
Open the Alert Panel, select any pre-configured alert (e.g. "R2 Cross Down"), and go live!
Connect with PineConnector or any webhook system instantly using the pre-formatted alert messages.
🤖 Who Is It For?
Active scalpers & bot traders: Live Mode + PineConnector-ready alerts = instant, automated reactions.
Swing and position traders: Use Classic Mode for stable, repaint-free levels.
Strategy developers: Seamless integration into automated and manual trading workflows.
🏷 License & Community
Open Source, Non-Commercial:
Free for personal & educational use under CC BY-NC-SA 4.0.
Feedback, bug reports & ideas:
Drop a comment, or contact me for feature requests.
Trade smart. Trade dynamic. Unlock the true power of pivots – with ChartWhizzperer !

Multi Pivot Point & Central Pivot Range - Nadeem Al-QahwiThis indicator combines four advanced trading modules into one flexible and easy-to-use script:
Traditional Pivot Points:
Calculates classic support and resistance levels (PP, R1–R5, S1–S5) based on previous session data. Ideal for identifying key turning points and mapping out the daily, weekly, or monthly structure.
Camarilla Levels:
Provides six upper and lower pivot levels (H1–H6, L1–L6) derived from volatility and closing price formulas. Especially effective for intraday reversal, mean reversion, and finding overbought/oversold extremes.
Central Pivot Range (CPR):
Plots the median, top, and bottom of the value area each session. CPR width instantly highlights whether the market is likely to trend (narrow CPR) or remain range-bound (wide CPR).
Developing CPR projects the evolving range for the current period—essential for real-time analysis and pre-market planning.
Dynamic Zone Levels (DZL):
Automatically detects and highlights clusters of pivots to reveal high-probability support/resistance zones, filtering out market “noise.”
DZL alerts notify you whenever price breaks or retests these key areas, making it easier to spot momentum trades and avoid false signals.
Key Features:
Multi-timeframe flexibility: Use with daily, weekly, monthly, yearly, or custom timeframes—even rare ones like biyearly and decennial.
Modular design: Activate or hide any system (Traditional, Camarilla, CPR, DZL) as you need.
Bilingual interface: Every setting and label is shown in both English and Arabic.
Full customization: Control visibility, color, style, and placement for every level and label.
Historical depth: Plot up to 5,000 pivot/zones back for deep analysis and backtesting.
Smart alerts: Get instant notifications on true S/R breakouts or retests (from DZL).
How to Use:
Trend Trading:
Watch for a very narrow CPR to identify potential trending days—trade in the breakout direction above/below the CPR.
Range Trading:
When CPR is wide, expect sideways movement. Fade reversals at R1/S1 or within the CPR boundaries.
Breakouts:
Use DZL alerts to capture momentum as price breaks or retests dynamic support/resistance zones.
Multi-Timeframe Confluence:
Combine CPR and pivot levels from multiple timeframes for higher-probability entries and exits.
All calculations and logic are fully open.

Share market aasan haiDear Friends
Topic: Trade With CPR + Camarilla Setup
Camarilla Trade Setup:
Sell Opportunity:
H3 Reversal Trade
Entry - H3
Stop Loss - H4
Target - L3
L4 Breakout Trade
Entry - L4
Stop Loss - L3
Target - L5
Buy Opportunity:
L3 Reversal Trade
Entry - L3
Stop Loss - L4
Target - H3
H4 Breakout Trade
Entry - H4
Stop Loss - H3
Target - H5
Trade Type:
Scalping trading
Intraday trading
CPR Trade Setup:
1. Narrow CPR indicates Trending market
2. Wide CPR indicates Sideways market
How To trade using this setup:
When ever there is a Narrow CPR we need to look for Breakout Trades (H4 or L4 Breakout Trade Setup)
When ever there is a Wide CPR we need to look for Reversal Trade (L3 or H3 Reversal Trade Setup)

Multi PivotsThis script is meant for day traders. It's based on the CPR concepts. The pivots plots based on the timeframe, means less that 15minuts it will plot daily pivots, less that daily tf, it plots weekly and then monthly. It also includes Camarillas, ADR levels, Fibonacci levels based on last 500 candles, Fib pivots, Pivot zones, developing pivot, Vwap, Dashboard shows RSI,ADX,Vwap,SuperTrend and day price difference. Options available to plot Day HighLow, Initial Balance levels as well. There is option to show running CPR which highlights virgin CPR. It can plot next day pivots as well
I dont own any of codes or ideas in the script. Codes are taken from different scripts and altered based on the requirements. Kudos to all the great pinecoders who provided their codes as public which helps everyone. Thanks

TrendMaster Pro 2.3 with Alerts
Hello friends,
A member of the community approached me and asked me how to write an indicator that would achieve a particular set of goals involving comprehensive trend analysis, risk management, and session-based trading controls. Here is one example method of how to create such a system:
Core Strategy Components
Multi-Moving Average System - Uses configurable MA types (EMA, SMA, SMMA) with short-term (9) and long-term (21) periods for primary signal generation through crossovers
Higher Timeframe Trend Filter - Optional trend confirmation using a separate MA (default 50-period) to ensure trades align with broader market direction
Band Power Indicator - Dynamic high/low bands calculated using different MA types to identify price channels and volatility zones
Advanced Signal Filtering
Bollinger Bands Volatility Filter - Prevents trading during low-volatility ranging markets by requiring sufficient band width
RSI Momentum Filter - Uses customizable thresholds (55 for longs, 45 for shorts) to confirm momentum direction
MACD Trend Confirmation - Ensures MACD line position relative to signal line aligns with trade direction
Stochastic Oscillator - Adds momentum confirmation with overbought/oversold levels
ADX Strength Filter - Only allows trades when trend strength exceeds 25 threshold
Session-Based Trading Management
Four Trading Sessions - Asia (18:00-00:00), London (00:00-08:00), NY AM (08:00-13:00), NY PM (13:00-18:00)
Individual Session Limits - Separate maximum trade counts for each session (default 5 per session)
Automatic Session Closure - All positions close at specified market close time
Risk Management Features
Multiple Stop Loss Options - Percentage-based, MA cross, or band-based SL methods
Risk/Reward Ratio - Configurable TP levels based on SL distance (default 1:2)
Auto-Risk Calculation - Dynamic position sizing based on dollar risk limits ($150-$250 range)
Daily Limits - Stop trading after reaching specified TP or SL counts per day
Support & Resistance System
Multiple Pivot Types - Traditional, Fibonacci, Woodie, Classic, DM, and Camarilla calculations
Flexible Timeframes - Auto-adjusting or manual timeframe selection for S/R levels
Historical Levels - Configurable number of past S/R levels to display
Visual Customization - Individual color and display settings for each S/R level
Additional Features
Alert System - Customizable buy/sell alert messages with once-per-bar frequency
Visual Trade Management - Color-coded entry, SL, and TP levels with fill areas
Session Highlighting - Optional background colors for different trading sessions
Comprehensive Filtering - All signals must pass through multiple confirmation layers before execution
This approach demonstrates how to build a professional-grade trading system that combines multiple technical analysis methods with robust risk management and session-based controls, suitable for algorithmic trading across different market sessions.
Good luck and stay safe!

Pivot Points)Pivot Point Display:
Calculate and draw the Pivot Point line (center point).
Calculate and display Support and Resistance levels.
Types of Pivot Calculation Methods:
Classic (default)
Ability to select other methods such as Fibonacci, Camarilla, Woodie's (but not yet implemented in the code).
Support and Resistance Lines:
Four resistance levels (R1, R2, R3, R4) in red.
Four support levels (S1, S2, S3, S4) in bright green.
Ability to adjust line thickness:
The user can change the thickness of the lines.
Value Labeling:
Display a numerical value for Pivot, resistance and support next to each level.
Automatic Update:
Delete previous lines and labels and draw new lines on the last candle.
Works on all timeframes:
This indicator works on different timeframes such as 1 minute, 5 minutes, 1 hour, 4 hours, daily, weekly and monthly.
