IsAlgo - Manual Channel► Overview:
Manual Channel is a strategy that allows traders to manually insert channel lines and set the lines’ width. Trades are opened when the price hits one of the lines and bounces back, with the expectation that it will move towards the opposite line. This strategy offers flexibility in configuring channel lines and trading behavior.
► Description:
The Manual Channel strategy is based on the use of manually defined channel lines to guide trading decisions. Traders start by marking four key points on the chart to create the channel. The first two points share the same time but different prices, and the last two points also share the same time but different prices. This method allows traders to place the channel lines precisely based on their analysis and insights. Additionally, the strategy allows for adjusting the width of the channel lines, which acts as a buffer zone around the main lines.
Once the channel is established, the strategy continuously monitors the price movements in relation to these lines. When the price touches one of the channel lines, the strategy opens a trade with the expectation that the price will bounce back and move towards the opposite line. For example, if the price hits the lower channel line, a long trade (buy) might be opened with the anticipation that the price will rise to the upper channel line. Conversely, if the price hits the upper channel line, a short trade (sell) might be opened expecting the price to fall to the lower channel line.
The strategy offers several options for managing trades. Traders can choose to close a trade when the price reaches the opposite channel line, capturing the expected movement within the channel. Additionally, if the price breaks outside the channel, traders have the option to close trades immediately or stop further trade executions to avoid potential losses.
↑ Channel Example:
↓ Channel Example:
► Features and Settings:
⚙︎ Channel: Define the time and prices of the four main points of the channel lines, and set the lines’ width.
⚙︎ Entry Candle: Specify the minimum and maximum body size and the body-to-candle size ratio for entry candles.
⚙︎ Trading Session: Define specific trading hours during which the strategy operates, restricting trades to preferred market periods.
⚙︎ Trading Days: Specify active trading days to avoid certain days of the week.
⚙︎ Backtesting: Perform backtesting for a selected period to evaluate strategy performance. This feature can be deactivated if not needed.
⚙︎ Trades: Configure trade direction (long, short, or both), position sizing (fixed or percentage-based), maximum number of open trades, and daily trade limits.
⚙︎ Trades Exit: Set profit/loss limits, specify trade duration, or exit based on channel breaks.
⚙︎ Stop Loss: Choose from various stop-loss methods, including fixed pips, ATR-based, or highest/lowest price points within a specified number of candles. Trades can also be closed after a certain number of adverse candle movements.
⚙︎ Break Even: Adjust stop loss to break even once predefined profit levels are reached, protecting gains.
⚙︎ Trailing Stop: Implement a trailing stop to adjust the stop loss as the trade becomes profitable, securing gains and potentially capturing further upside.
⚙︎ Take Profit: Set up to three take-profit levels using methods such as fixed pips, ATR, or risk-to-reward ratios. Alternatively, specify a set number of candles moving in the trade’s direction.
⚙︎ Alerts: Comprehensive alert system to notify users of significant actions, including trade openings and closings. Supports dynamic placeholders for take-profit levels and stop-loss prices.
⚙︎ Dashboard: Visual display on the chart providing detailed information about ongoing and past trades, aiding users in monitoring strategy performance and making informed decisions.
► Backtesting Details:
Timeframe: 15-minute EURUSD chart
Initial Balance: $10,000
Order Size: 10 units
Commission: 0.05%
Slippage: 5 ticks
This strategy opens trades around a manually drawn channel, which results in a smaller number of closed trades.
ابحث في النصوص البرمجية عن "candle"

J2S Backtest: 123-Stormer StrategyThis backtest presents the 123-Stormer strategy created by trader Alexandre Wolwacz "Stormer". The strategy is advocates and shared by the trader through his YouTube channel without restrictions.
Note :
This is not an investment recommendation. The purpose of this study is only to share knowledge with the community on tradingview.
What is the purpose of the strategy?
The strategy is to buy the 123-Stormer pattern at the bottom of an uptrend and sell the 123-Stormer pattern at the top of a downtrend, aiming for a short stop for a long profit target.
To which timeframe of a chart is it applicable to?
Recommended for weekly and daily charts, as the signals are more reliable, being that strategy a good option for swing and position trading.
What about risk management and success rate?
The profit target is established by the author as being twice the risk assumed. Also according to the author, the strategy is mathematically positive, reaching around 65% of success rate in tradings.
How are the trends identified in this strategy?
Two averages are plotted to indicate the trend, a fast EMA average with an 8-week close and a slow EMA average with an 80-week close.
Uptrend happens whenever the fast EMA is above the slow EMA and prices are above the fast EMA. In this case, we should start looking for a LONG entry based on the signal of the 123-Stromer pattern to buying.
On the other hand, downtrend happens when the fast EMA is below the slow EMA and prices are below the fast EMA. In this case, we should start looking for a SHORT entry based on the signal of the 123-Stromer pattern to selling.
How to identify the 123-Stormer pattern for a LONG entry?
This pattern consists of three candles. The first candle has a higher low than the second candle's low, and the third candle has a higher low than the second candle's low. In this pattern, we will buy as soon as a trade occurs above the third candle's high, placing a stop as soon as a trade occurs below the second candle's low, with profit target twice the risk assumed. In another words, the amplitude of the prices of the three candles from the third candle’s high upwards. (you can use fibonacci extension to determine your stops and profit targets).
Importantly, the low of the three candles must be above the fast EMA average and in an uptrend.
How to identify the 123-Stormer pattern for a SHORT entry?
This pattern consists of three candles. The first candle has a lower high than the second candle's high, and the third candle has a lower high than the second candle's high. In this pattern, we will sell as soon as a trade occurs below the third candle's low, placing a stop as soon as a trade occurs above the second candle's high, with profit target twice the risk assumed. In other words, the amplitude of prices of the three candles from the third candle’s low down (you can use fibonacci extension to determine your stops and profit targets).
Importantly, the high of the three candles must be below the fast average and in a downtrend.
Tips and tricks
According to the author, the best signal for both LONG or SHORT entry is when the third candle is a inside bar of second candle.
Backtest features
Backtest parameters are fully customizable. The user chooses to validate only LONG or SHORT entries, or both. It is also possible to determine the specific time period for running the backtests, as well as setting a threshold in candels for entry by the 123-Stormer pattern.
Furthermore, for validation purposes, you can choose to activate the best signal of the pattern recommended by the author of the strategy, as well as change the values of the EMA averages or even deactivate them.
Final message
Feel free to provide me with any improvement suggestions for the backtest script. Bear in mind, feel free to use the ideas in my script in your studies.

Amiya's Doji / Hammer / Spinning Top Breakout Strategy v5How it works
1. Pattern Detection (Previous Candle):
• Checks if total shadow length ≥ 2 × body.
• Checks if candle height (high − low) is between 10 and 21.5 points.
• If true → marks that candle as a potential Doji, Hammer, or Spinning Top.
2. Long Setup:
• LTP (close) crosses above previous candle high.
• Previous candle is a valid pattern candle.
• Stop Loss = 3 points below previous candle low.
• Take Profit = 5 × (high − low) of previous candle added to previous high.
3. Short Setup:
• LTP (close) crosses below previous candle low.
• Previous candle is a valid pattern candle.
• Stop Loss = 3 points above previous candle high.
• Take Profit = 5 × (high − low) of previous candle subtracted from previous low.
4. Visualization:
• Yellow background highlights pattern candles.
• Green ▲ and Red ▼ markers show entry points.
Deep yellow candles → represent Doji / Hammer / Spinning Top patterns
• Green triangle → Buy signal
• Red triangle → Sell signal
• Dotted green line + label → Target
• Dotted red line + label → Stop loss
• Gray background → Outside trading hours
• Auto close → All trades square off at 3:29 PM IST

Inside Candle StrategyIntroduction
The Inside Candle Breakout Strategy leverages the concept of inside candles as a primary signal for potential breakouts. Unlike common trend-following or scalping strategies, this method focuses on the volatility squeeze indicated by inside candles and aims to capture the momentum that follows these periods of consolidation. The strategy's originality lies in its specific integration of timeframes for signal detection and its application across diverse market conditions without relying on conventional trend indicators.
Strategy Description and Mechanics
Inside Candle Identification: At the heart of this strategy is the detection of inside candles, defined as candles fully contained within the range of the preceding candle. This pattern signifies a temporary balance between buyers and sellers, often preceding significant price movements. The strategy scans for these candles within a user-specified timeframe in the input section of the settings of the strategy, allowing for tailored signal generation based on individual trading preferences.
Entry Points and Market Entries: Upon identifying an inside candle and only once this candle closes, the strategy prepares to enter a trade in the direction of the breakout. Trades are executed in the timeframe selected on the chart, ensuring that entry points are aligned with real-time market movements. This process highlights the strategy's adaptability, making it suitable for various trading styles, from day trading to swing trading.
Overlay Indicator for Enhanced Market Analysis: Accompanying the breakout signals is an overlay indicator comprising two moving averages and a volatility cloud. This feature serves as a secondary tool for market analysis, offering insights into the prevailing market trend and volatility levels. While it doesn't influence the entry or exit signals directly, it provides traders with additional context for refining their decisions, enhancing the strategy's utility. This assistance tool is composed by one moving average and a second line which is calculated adding or subtracting the historical volatility of the asset on the moving average, depending on his momentum.
Strategy Results and Commitment to Realism
Backtesting Protocol: In our commitment to transparency and realism, backtesting results are derived from a dataset that ensures a sufficient number of trades (over 100) to validate the strategy's effectiveness. This approach underscores our dedication to providing traders with reliable and actionable insights.
Risk Management and Trade Sizing: Recognizing the importance of sustainable trading practices, the strategy incorporates strict risk management guidelines. Trades are sized to ensure that only a small percentage of equity is risked on a single trade, adhering to widely accepted risk tolerance levels. The initial account size for this script is set to 10000$.
Strategy Defaults and Justification: The default properties of the strategy, including the risk-reward ratio, average length for moving averages, and other parameters, are carefully chosen based on extensive testing and analysis. These settings represent a balanced approach, aiming to optimize the strategy's performance across a variety of market conditions.
Strategy Components:
- Inside Candles: An inside candle occurs when a candle's high and low are completely contained within the high and low of the previous candle. This pattern indicates a period of consolidation or indecision in the market, often preceding a significant price movement. The strategy detects inside candles based on the user-selected timeframe, allowing traders to capture potential breakouts.
Indicator Overlays:
- Moving Average: A simple moving average (SMA) is calculated over a user-defined length (`Average Length`), providing a dynamic baseline to gauge the market's direction. The strategy offers an option (`Show Moving Average`) to display or hide this moving average on the chart, giving traders control over the visual complexity.
- Volatility Measurement: Alongside the moving average, the strategy assesses market volatility using the standard deviation of the closing prices over the same period defined by the `Average Length`. The moving average is adjusted upwards or downwards by this volatility measure, creating a dynamic channel that reflects the current market conditions.
- Color Gradients for Volatility: The strategy uses a color gradient to fill the area between the moving average and its volatility-adjusted counterpart. This gradient visually represents the volatility level, transitioning from gray (low volatility) to a lighter shade (higher volatility), aiding in the assessment of market sentiment and volatility.
Trading Entries:
- Long Entry: A long position is triggered when the closing price exceeds the high of an inside candle, indicating potential bullish momentum. The strategy places a stop-loss at the low of the inside candle and sets a take-profit level based on the predefined risk-reward ratio (`RR Ratio`).
- Short Entry: Conversely, a short position is initiated when the closing price falls below the low of an inside candle, suggesting bearish pressure. A stop-loss is set at the high of the inside candle, with the take-profit level adjusted according to the risk-reward ratio.
Customization Settings:
- Timeframe: Traders can select the desired timeframe for inside candle detection, tailoring the strategy to fit various trading styles and time horizons.
- RR Ratio: The risk-reward ratio is adjustable, allowing traders to manage the potential risk and return of each trade according to their risk tolerance.
- Average Length: This setting determines the period over which the moving average and volatility are calculated, affecting the sensitivity of the strategy to price movements.
- Visual Settings: Users can customize the appearance of the strategy on their charts, including the colors of the moving average and volatility lines, as well as the line width, enhancing chart readability and personal preference adherence.
Disclaimer
Trading involves significant risk, and it is crucial for traders to conduct their own due diligence before engaging with any strategy. The Inside Candle Breakout Strategy is presented for informational purposes only and does not constitute financial advice.

New Rate - PREMIUM v2New Rate - PREMIUM v2
New Rate - PREMIUM v2 is an intraday Opening Range Breakout (ORB) strategy built around a strict one-trade-per-day execution model.
The strategy defines a price range using the first N candles of a user-defined session, freezes the High/Low at the close of candle N, and places OCO stop orders exactly at those levels. The first breakout fills, the opposite order is canceled, and no further trades are allowed until the next trading day.
This script is published for educational and research purposes, with documented mechanics and backtest settings to support transparency and reproducibility.
How the strategy works
Session range construction
The user selects a minutes-based timeframe, a session start time, and the number of candles N. During the session window, the strategy tracks the highest High and lowest Low formed by the first N candles. These candles are visually highlighted on the chart.
Range freeze
When candle N closes, the range is locked. Horizontal High/Low lines are drawn and extended forward. An optional 50% midpoint can be displayed for reference.
OCO breakout execution
Immediately after the range is frozen, the strategy places:
A buy stop at the frozen High
A sell stop at the frozen Low
Orders are linked using OCO (One-Cancels-Other) logic. When one side fills, the opposite order is automatically canceled.
Exit management
Two exit frameworks are available:
Tick-based exits: stop-loss and take-profit are fixed distances in ticks from entry.
Risk/Reward exits: optional stop at the opposite side of the range, with TP calculated as RR × risk.
Both modes can display SL/TP boxes projected forward for visual review.
Daily execution lock
After the first filled trade of the day, the strategy blocks any new entries until the next daily reset. This enforces strict discipline and prevents over-trading.
Visual features
Configurable High/Low lines and labels (color, style, width, alignment)
Optional midpoint (50%) line
Session background highlight with adjustable opacity
Optional SL/TP boxes with configurable colors, borders, and projection length
Weekday filter (trade only selected days)
Settings used for the published backtest (replication)
The performance screenshots included with this publication were generated using the following configuration:
Market & chart
Symbol: FX:XAUUSD
Timeframe: 15 minutes
Session & range
Session start: as configured on chart (exchange time)
Range candles (N): 1
Auto range end: enabled (TF × N)
Line extension: 20 bars
Exits
Exit mode: SL/TP by ticks
Stop-loss: 1500 ticks
Take-profit: 2000 ticks
Weekdays
Monday to Friday enabled
Strategy Properties (TradingView settings)
Initial capital: 1,000 USD
Commission: 0.1 (as set in Strategy Properties)
Slippage: 1 tick
Users should adjust commission, slippage, and position sizing to match their own broker and execution conditions.
Backtest context and limitations
This strategy uses stop orders that may fill intrabar depending on TradingView’s execution model.
Results vary by symbol, timeframe, session selection, and trading costs.
Past performance does not guarantee future results.
This script is not financial advice.
Originality and usefulness
While opening-range breakouts are a known concept, this strategy’s implementation focuses on:
Exact range-freeze timing: orders are armed precisely at the close of the N-th candle.
True OCO + hard daily lock: one-and-done execution enforced at the engine level.
Dual exit framework: fixed-tick and RR exits analyzed with the same SL/TP visual logic.
Operational safeguards: weekday filters and drawing limits designed for stable long-term backtesting.

Strategy:Reversal-CatcherWhat
This is a plain and vanilla reversal based strategy for intraday (15m) timeframe on Futures prices of the assets.
Now what all it comprises of?
It finds out the dynamic support & resistance from Bollinger Band (20 period, 1.5 std dev).
It finds out the potential divergence of price deviation from 5 period exponential moving average (EMA).
If the previous candle (N-1) shows a divergence it confirms the reversal by checking the present candle (N) to be closed inside the Bollinger Band.
It confirms the momentum by checking RSI shows a crossover/crossunder to oversold (30) / overbought (70) region.
It also confirms whether the trend is up (then only reversal trade to short) or down (then only reversal trade to long). The trend is checked with EMA-21 and EMA-50.
Re-affirmation Condition : It re-affirms the position of two successive candles called as `hhLLong` and `hhLLShort` in the script.
Why
In Indian context, retail participants are pre-dominantly (yes- 80% of Indian daily volume) Options buyers mainly in weekly indices (Nifty, BankNifty, FinNifty, CNXMidcap, Sensex, Bankx .. well everyday is expiry now in India, except -- Thank God -- Saturday & Sunday).
And in Index Options the momentum plays a big role.
If one can catch a good reversal point the potential of high Risk-to-Reward trade (hence earn handsomely) is very likely (please note: there is no holy grail in trading. Nothing works 100%).
So this is the attempt to catch a reversal.
Re-affirmation of Reversal
hhLLong : It's a reversal point after an uptrend. It checks the relative positioning of current candle compared to that of previous candle. [The details are in the script. Check for variable hhLLong in script.
hhLLShort : It's a reversal point after a downtrend. It checks the relative positioning of current candle compared to that of previous candle. [The details are in the script. Check for variable hhLLShort in script.
Unique-ness
What's unique in it? Why we decided to publicly share this:
Already given the context of The Great Indian Options Buyers community. It should be helpful to them, we believe.
It takes Very Less Number of Trades with High Accuracy . Please check the result in NSE:NIFTY1! in 15m timeframe. 71% accuracy with roughly a trade in a month.
There is no point giving brokers' the brokerages taking 10 trades a day and ending not-so-good EoD. Better lets take less trades with better result possibility. .
Mention
There are many people uses this variation of Bolling Band, 5EMA
Many people use RSI, trends and relative positioning of candles.
--> We are grateful to all of them. It's really difficult to mention everyone's name. But all people somehow influence the thought process. Thanks for all of them.
Statutory Disclaimer
There is no silver bullet / holy grail in trading. Nothing works 100% time. One has to be careful about the loss (s)he can bear in case of the trade goes against.
We, as the author of this script, is not responsible for any trading or position decision one is taken based on the outcome of this.
It is our sole discretion to change, add, delete the portion or withdraw the whole script without any prior notice or intimation.
In Indian Context : We are not SEBI registered, will never be SEBI registered.

HK Percentile Interpolation One
This script is designed to execute a trading strategy based on Heikin Ashi candlesticks, moving averages, and percentile levels.
Please note that you should keep your original chart in normal candlestick mode and not switch it to Heikin Ashi mode. The script itself calculates Heikin Ashi values from regular candlesticks. If your chart is already in Heikin Ashi mode, the script would be calculating Heikin Ashi values based on Heikin Ashi values, which would produce incorrect results.
The strategy begins trading from a start date that you can specify by modifying the `startDate` parameter. The format of the date is "YYYY MM DD". So, for example, to start the strategy from January 1, 2022, you would set `startDate = timestamp("2022 01 01")`.
The script uses Heikin Ashi candlesticks, which are plotted in the chart. This approach can be useful for spotting trends and reversals more easily than with regular candlestick charts. This is particularly useful when backtesting in TradingView's "Rewind" mode, as you can see how the Heikin Ashi candles behaved at each step of the strategy.
Buy and sell signals are generated based on two factors:
1. The crossing over or under of the Heikin Ashi close price and the 75th percentile price level.
2. The Heikin Ashi close price being above certain moving averages.
You have the flexibility to adjust several parameters in the script, including:
1. The stop loss and trailing stop percentages (`stopLossPercentage` and `trailStopPercentage`). These parameters allow the strategy to exit trades if the price moves against you by a certain percentage.
2. The lookback period (`lookback`) used to calculate percentile levels. This determines the range of past bars used in the percentile calculation.
3. The lengths of the two moving averages (`yellowLine_length` and `purplLine_length`). These determine how sensitive the moving averages are to recent price changes.
4. The minimum holding period (`holdPeriod`). This sets the minimum number of bars that a trade must be kept open before it can be closed.
Please adjust these parameters according to your trading preferences and risk tolerance. Happy trading!

Tristan's Box: Pre-Market Range Breakout + RetestMarket Context:
This is designed for U.S. stocks, focusing on pre-market price action (4:00–9:30 AM ET) to identify key support/resistance levels before the regular session opens.
Built for 1 min and 5 min timelines, and is intended for day trading / scalping.
Core Idea:
Pre-market range (high/low) often acts as a magnet for price during regular hours.
The first breakout outside this range signals potential strong momentum in that direction.
Retest of the breakout level confirms whether the breakout is valid, avoiding false moves.
Step-by-Step Logic:
Pre-Market Range Identification:
Track high and low from 4:00–9:30 AM ET.
Draw a box spanning this range for visual reference and calculation.
Breakout Detection:
When the first candle closes above the pre-market high → long breakout.
When the first candle closes below the pre-market low → short breakout.
The first breakout candle is highlighted with a “YOLO” label for visual confirmation.
Retest Confirmation:
Identify the first candle whose wick touches the pre-market box (high touches top for short, low touches bottom for long).
Wait for the next candle: if it closes outside the box, it confirms the breakout.
Entry Execution:
Long entry: on the confirming candle after a wick-touch above the pre-market high.
Short entry: on the confirming candle after a wick-touch below the pre-market low.
Only the first valid entry per direction per day is taken.
Visuals & Alerts:
Box represents pre-market high/low.
Top/bottom box border lines show the pre-market high / low levels cleanly.
BUY/SELL markers are pinned to the confirming candle.
Added a "YOLO" marker on breakout candle.
Alert conditions trigger when a breakout is confirmed by the retest.
Strategy Type:
Momentum breakout strategy with confirmation retest.
Combines pre-market structure and risk-managed entries.
Designed to filter false breakouts by requiring confirmation on the candle after the wick-touch.
In short, it’s a pre-market breakout momentum strategy: it uses the pre-market high/low as reference, waits for a breakout, and then enters only after a confirmation retest, reducing the chance of entering on a false spike.
Always use good risk management.

Strategi FVG 09:31 (Pro)FVG 09:31 Strategy (Pro)
In short, this is an automated trading strategy (bot) for TradingView designed to execute buy or sell orders based on a Fair Value Gap (FVG) pattern. The strategy is highly specific, as it only triggers on the 1-minute timeframe and looks for an FVG that forms precisely at 09:32 AM New York time.
Main Purpose of the Strategy
The primary goal of this script is to identify and capitalize on short-term price imbalances, known as Fair Value Gaps (FVGs). It operates during a specific, high-volatility window right after the U.S. stock market opens, often referred to by traders as the "Silver Bullet" session. By automating the detection and execution, it aims to trade these fleeting opportunities with precision.
How the Strategy Works
The strategy follows a clear, step-by-step logical flow on your chart.
1. Time & Timeframe Restriction
1-Minute Timeframe: The strategy is hard-coded to work only on the 1-minute (1m) chart. A warning label will appear on your chart if you apply it to any other timeframe.
Specific Time Window: The core logic activates only between 09:32 and 09:33 AM New York time. It searches for an FVG pattern formed by the three candles from 09:29, 09:30, and 09:31, with the pattern confirmation happening on the close of the 09:31 candle.
2. Fair Value Gap (FVG) Detection
An FVG is a three-candle pattern that signals a price imbalance.
Bullish FVG (Potential Buy): Occurs when the low of the first candle is higher than the high of the third candle. The space between these two prices is the FVG zone.
Bearish FVG (Potential Sell): Occurs when the high of the first candle is lower than the low of the third candle. The space between these two prices is the FVG zone.
If this pattern is detected at the target time, the strategy draws a colored box on the chart to visualize the FVG zone (aqua for bullish, fuchsia for bearish).
3. Entry Logic
The strategy provides two user-selectable methods for entering a trade:
Retracement (Immediate Entry): The strategy will open a position with a market order as soon as the price retraces back into the identified FVG zone.
For a Bullish FVG, a Long (buy) position is opened when the price drops to touch the upper boundary of the FVG.
For a Bearish FVG, a Short (sell) position is opened when the price rises to touch the lower boundary of the FVG.
Limit Order (Pending Entry): The strategy places a pending limit order at the edge of the FVG zone.
For a Bullish FVG, a Buy Limit order is placed at the upper boundary of the FVG.
For a Bearish FVG, a Sell Limit order is placed at the lower boundary of the FVG.
Order Expiration: If the limit order is not filled within a specified number of candles (default is 15), it is automatically canceled to avoid chasing a stale setup.
4. Exit Logic
Once a position is active, the strategy automatically manages the exit by setting a Take Profit (TP) and Stop Loss (SL) level. You can choose between two types:
Ticks (Fixed Points): You define a fixed profit target and loss limit in ticks (the smallest price movement). For example, a 200-tick TP and a 100-tick SL.
Last Swing (Dynamic Levels): The TP and SL are set dynamically based on the most recent swing high or swing low.
For a Long position: Take Profit is set at the last swing high; Stop Loss is at the last swing low.
For a Short position: Take Profit is set at the last swing low; Stop Loss is at the last swing high.
5. Daily Management
At the start of each new trading day, the script performs a reset. All variables, including any FVG data from the previous day, are cleared. This ensures the strategy only acts on fresh signals from the current day and cancels any pending orders from the day before.
Explanation of Settings (Inputs)
Here is what each user-configurable setting does:
Entry Type: Choose your preferred entry method: Retracement or Limit Order.
Order Expiration (Candles): Applies only to the Limit Order type. Sets how many candles an unfilled order will remain active before being canceled.
Stop Loss Type: Choose Ticks for a fixed-distance stop loss or Last Swing for a dynamic level.
Take Profit Type: Choose Ticks for a fixed-distance profit target or Last Swing for a dynamic level.
Pivot Lookback (SL/TP Swing): Defines how many candles the script looks back to identify the most recent swing high/low for the Last Swing SL/TP type.
Contract Size: The quantity or lot size for each trade.
Take Profit (in Ticks): The profit target distance if using the Ticks type.
Stop Loss (in Ticks): The maximum loss distance if using the Ticks type.

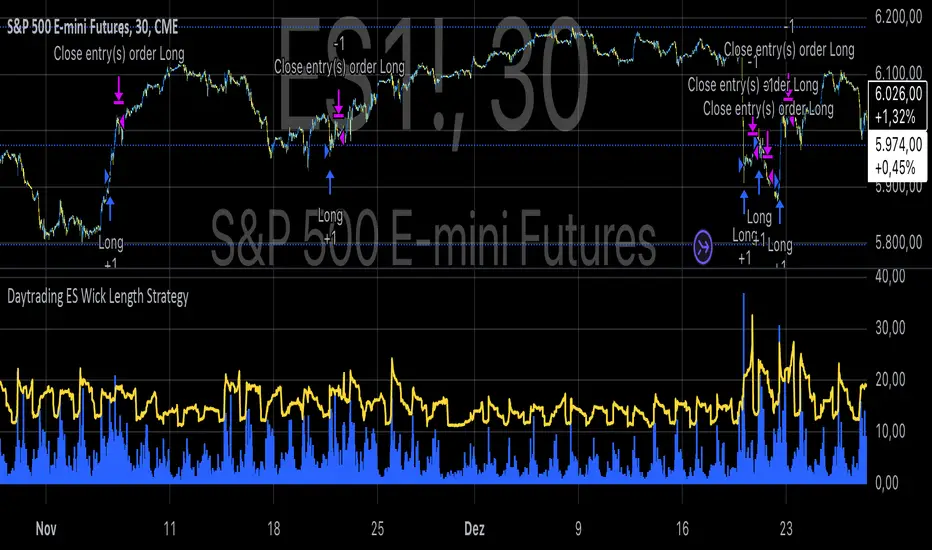
Daytrading ES Wick Length StrategyThis Pine Script strategy calculates the combined length of upper and lower wicks of candlesticks and uses a customizable moving average (MA) to identify potential long entry points. The strategy compares the total wick length to the MA with an added offset. If the wick length exceeds the offset-adjusted MA, the strategy enters a long position. The position is automatically closed after a user-defined holding period.
Key Features:
1. Calculates the sum of upper and lower wicks for each candlestick.
2. Offers four types of moving averages (SMA, EMA, WMA, VWMA) for analysis.
3. Allows the user to set a customizable MA length and an offset to shift the MA.
4. Automatically exits positions after a specified number of bars.
5. Visualizes the wick length as a histogram and the offset-adjusted MA as a line.
References:
• Candlestick wick analysis: Nison, S. (1991). Japanese Candlestick Charting Techniques.
• Moving averages: Brock, W., Lakonishok, J., & LeBaron, B. (1992). “Simple Technical Trading Rules and the Stochastic Properties of Stock Returns”. Journal of Finance.
This strategy is suitable for identifying candlesticks with significant volatility and long wicks, which can indicate potential trend reversals or continuations.
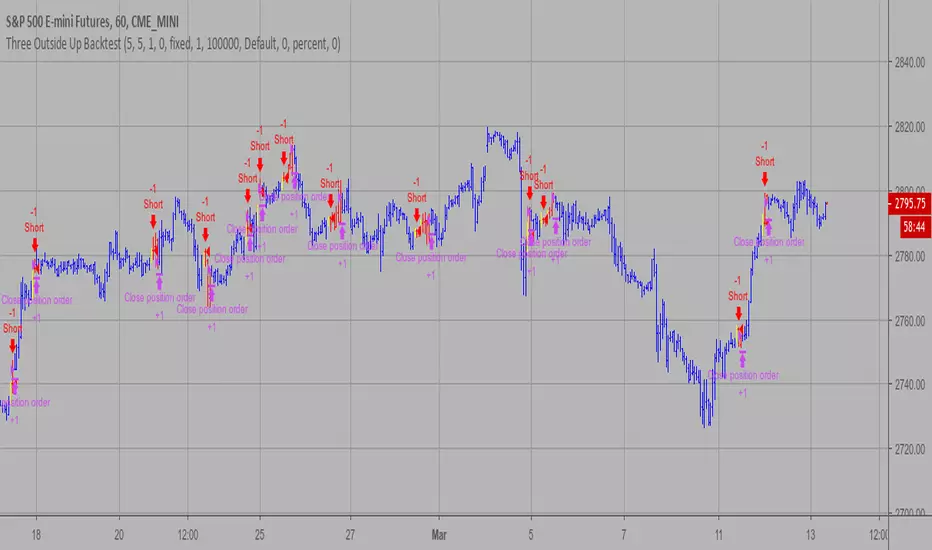
Three Outside Up Backtest This is a three candlestick bullish reversal pattern consisting of a bullish
engulfing pattern formed by the first two candlesticks then followed by an up
candlestick with a higher close than the prior candlestick.
WARNING:
- For purpose educate only
- This script to change bars colors.
Three Outside Down Backtest This is a three candlestick bearish reversal pattern consisting of a bearish
engulfing pattern formed by the first two candlesticks then followed by a down
candlestick with a lower close than the prior candlestick.
WARNING:
- For purpose educate only
- This script to change bars colors.

DCA-Integrated Trend Continuation StrategyIntroducing the DCA-Integrated Trend Continuation Strategy 💼💰
The DCA-Integrated Trend Continuation Strategy represents a robust trading methodology that harnesses the potential of trend continuation opportunities while seamlessly incorporating the principles of Dollar Cost Averaging (DCA) as a risk management and backup mechanism. This strategy harmoniously blends these two concepts to potentially amplify profitability and optimize risk control across diverse market conditions.
This strategy is well-suited for both trending and ranging markets. During trending markets, it aims to capture and ride the momentum of the trend while optimizing entry points. In ranging markets or pullbacks, the DCA feature comes into play, allowing users to accumulate more assets at potentially lower prices and potentially increase profits when the market resumes its upward trend. This cohesive approach not only enhances the overall effectiveness of the strategy but also fosters a more resilient and adaptable trading approach in ever-changing market dynamics.
💎 How it Works:
▶️ The strategy incorporates a customizable entry signal based on candlestick patterns, enabling the identification of potential trend continuation opportunities. By focusing on consecutive bullish candles, it detects the presence of bullish momentum, indicating an optimal time to enter a long position.
To refine the precision of the signals, traders can set a specific percentage threshold for the closing price of the candle, ensuring it is above a certain percentage of its body. This condition verifies strong bullish momentum and confirms significant upward movement within the candle, thereby increasing the reliability of the signal.
In addition, the strategy offers further confirmation by examining the relationship between the closing price of the signal candle and its previous candles. If the closing price of the signal candle is higher than its preceding candles, it provides an additional layer of assurance before entering a position. This approach is particularly effective in detecting sharp movements and capturing significant price shifts, as it focuses on identifying instances where the closing price shows clear strength and outperforms the previous candle's price action. By prioritizing such occurrences, the strategy aims to capture robust trends and capitalize on notable market movements.
▶️ During market downturns, the strategy incorporates intelligent management of price drops, offering flexibility through fixed or customizable price drop percentages. This unique feature allows for additional entries at specified drop percentages, enabling traders to accumulate positions at more favorable prices.
By strategically adjusting the custom price drop percentages, you can optimize your entry points to potentially maximize profitability. Utilizing lower percentages for initial entries takes advantage of price fluctuations, potentially yielding higher returns. On the other hand, employing higher percentages for final entries adopts a more cautious approach during significant market downturns, emphasizing enhanced risk management. This adaptive approach ensures that the strategy effectively navigates challenging market conditions while seeking to optimize overall performance.
▶️ To enhance performance and mitigate risks, the strategy integrates average purchase price management. This feature dynamically adjusts the average buy price percentage decrease after each price drop, expediting the achievement of the target point even in challenging market conditions. By reducing recovery times and ensuring investment safety, this strategy optimizes outcomes for traders.
▶️ Risk management is at the core of this strategy, prioritizing the protection of capital. It incorporates an account balance validation mechanism that conducts automatic checks prior to each entry, ensuring alignment with available funds. This essential feature provides real-time insights into the affordability of price drops and the number of entries, enabling traders to make informed decisions and maintain optimal risk control.
▶️ Furthermore, the strategy offers take profit options, allowing traders to secure gains by setting fixed percentage profits from the average buy price or using a trailing target. Stop loss protection is also available, enabling traders to set a fixed percentage from the average purchase price to limit potential losses and preserve capital.
▶️ This strategy is fully compatible with third-party trading bots, allowing for easy connectivity to popular trading platforms. By leveraging the TradingView webhook functionality, you can effortlessly link the strategy to your preferred bot and receive accurate signals for position entry and exit. The strategy provides all the necessary alert message fields, ensuring a smooth and user-friendly trading experience. With this integration, you can automate the execution of trades, saving time and effort while enjoying the benefits of this powerful strategy.
🚀 How to Use:
To effectively utilize the DCA-Integrated Trend Continuation Strategy, follow these steps:
1. Choose your preferred DCA Mode - whether by quantity or by value - to determine how you want to size your positions.
2. Customize the entry conditions of the strategy to align with your trading preferences. Specify the number of consecutive bullish candles, set a desired percentage threshold for the close of the signal candle relative to its body, and determine the number of previous candles to compare with.
3. Adjust the pyramiding parameter to suit your risk tolerance and desired returns. Whether you prefer a more conservative approach with fewer pyramids or a more aggressive stance with multiple pyramids, this strategy offers flexibility.
4. Personalize the price drop percentages based on your risk appetite and trading strategy. Choose between fixed or custom percentages to optimize your entries in different market scenarios.
5. Configure the average purchase price management settings to control the percentage decrease in the average buy price after each price drop, ensuring it aligns with your risk tolerance and strategy.
6. Utilize the account balance validation feature to ensure the strategy's actions align with your available funds, enhancing risk management and preventing overexposure.
7. Set take profit options to secure your gains and implement stop loss protection to limit potential losses, providing an additional layer of risk management.
8. Use the date and time filtering feature to define the duration during which the strategy operates, allowing for specific backtesting periods or integration with a trading bot.
9. For automated trading, take advantage of the compatibility with third-party trading bots to seamlessly integrate the strategy with popular trading platforms.
By following these steps, traders can harness the power of the DCA-Integrated Trend Continuation Strategy to potentially maximize profitability and optimize their trading outcomes in both trending and ranging markets.
⚙️ User Settings:
To ensure the backtest result is representative of real-world trading conditions, particularly in the highly volatile Crypto market, the default strategy parameters have been carefully selected to produce realistic results with a conservative approach. However, you have the flexibility to customize these settings based on your risk tolerance and strategy preferences, whether you're focusing on short-term or long-term trading, allowing you to potentially achieve higher profits. The backtesting was conducted using the BTCUSDT pair in 15-minute timeframe on the Binance exchange. Users can configure the following options:
General Settings:
- Initial Capital (Default: $10,000)
- Currency (Default: USDT)
- Commission (Default: 0.1%)
- Slippage (Default: 5 ticks)
Order Size Management:
- DCA Mode (Default: Quantity)
- Order Size in Quantity (Default: 0.01)
- Order Size in Value (Default: $300)
Strategy's Entry Conditions:
- Number of Consecutive Bullish Candles (Default: 3)
- Close Over Candle Body % (Default: 50% - Disabled)
- Close Over Previous Candles Lookback (Default: 14 - Disabled)
- Pyramiding Number (Default: 30)
Price Drop Management:
- Enable Price Drop Calculations (Default: Enabled)
- Enable Current Balance Check (Default: Enabled)
- Price Drop Percentage Type (Default: Custom)
- Average Price Move Down Percentage % (Default: 50%)
- Fixed Price Drop Percentage % (Default: 0.5%)
- Custom Price Drop Percentage % (Defaults: 0.5, 0.5, 0.5, 1, 3, 5, 5, 10, 10, 10)
TP/SL:
- Take Profit % (Default: 3%)
- Stop Loss % (Default: 100%)
- Enable Trailing Target (Default: Enabled)
- Trailing Offset % (Default: 0.1%)
Backtest Table (Default: Enabled)
Date & Time:
- Date Range Filtering (Default: Disabled)
- Start Time
- End Time
Alert Message:
- Alert Message for Enter Long
- Alert Message for Exit Long
By providing these customizable settings, the strategy allows you to tailor it to your specific needs, enhancing the adaptability and effectiveness of your trading approach.
🔐 Source Code Protection:
The source code of the DCA-Integrated Trend Continuation Strategy is designed to be robust, reliable, and highly efficient. Its original and innovative implementation merits protecting the source code and limiting access, ensuring the exclusivity of this strategy. By safeguarding the code, the integrity and uniqueness of the strategy are preserved, giving users a competitive edge in their trading activities.

Heikin Ashi Wick Strategy
🔥 Heikin Ashi Wick Momentum Strategy
“Trade momentum decay before the trend breaks.
>> FOCUS ON WICKS, NOT ONLY CANDLE COLOR<<
What Makes This Different (Traffic Driver)
✔ Uses Heikin Ashi wicks (almost nobody does this correctly)
✔ Captures trend continuation, not breakouts
✔ Exits before momentum collapse, not after
✔ Non-repainting
✔ Clean charts, instant readability
This Strategy Is REALLY Trading
This is a Heikin Ashi momentum-decay system:
• Enters when trend is strong but not euphoric
• Exits when:
o Trend stops probing higher
o Sellers gain relative strength
It avoids:
• Chasing strong breakout candles
• Holding through momentum rollovers
Candle Type Used: Heikin Ashi (manually calculated)
NOTE: The script does not use regular candles.
It reconstructs Heikin Ashi (HA) candles from raw OHLC:
• HA Close = average of open, high, low, close
• HA Open = midpoint of prior HA candle (smoothed)
• HA High / Low = extremes of HA open/close vs real high/low
➡️ This filters noise and emphasizes trend structure and momentum.
Strengths
✅ Works well in strong, smooth trends
✅ Very clean logic (no indicators)
✅ Non-repainting
✅ Early exits protect capital
Best Use
This works best on:
• Daily timeframe
• Strong trend ETFs / megacaps
o QQQ
o SPY
o NVDA, MSFT, AAPL
• When combined with:
o EMA 21 trend filter (your preference)
o Market regime filter (e.g., above 50/200 SMA)
o Rising 10 EMA and 20 EMA
________________________________________
8️⃣ Weaknesses (Important)
⚠️ No stop loss (only structure-based exits)
⚠️ Can exit too early in explosive trends
⚠️ Will chop in sideways markets
⚠️ No volatility filter (ATR, EMA, regime)
How to Avoid the Weaknesses — Summary
Turn the setup from a concept into a robust strategy by adding these controls:
1. Trade Only Trends
o Require price above EMA-21 (optionally EMA-21 > EMA-50)
o Eliminates chop and sideways markets
2. Improve Exits (Avoid Leaving Winners Too Early)
o Partial exit when upper wick disappears
o Full exit only when lower wick dominates
o Optional: require 2 consecutive exit candles
3. Add Risk Protection
o Use a volatility stop: ~1.5× ATR(14) below entry or below HA swing low
o Protects against gaps and sudden reversals
4. Filter Weak Signals
o Require meaningful wick size (≈30–40% of candle range)
o Avoids low-quality indecision candles
5. Avoid Bad Volatility
o Skip entries when ATR is expanding aggressively
o Focus on calmer, controllable trends
6. Limit Time in Trade
o Add a max bars hold (e.g., 10–15 bars on daily)
o Prevents capital getting stuck in fading trends
⚠️ Educational use only. Not financial advice. Trading involves risk and losses can exceed expectations. Past performance does not guarantee future results. Use at your own risk.

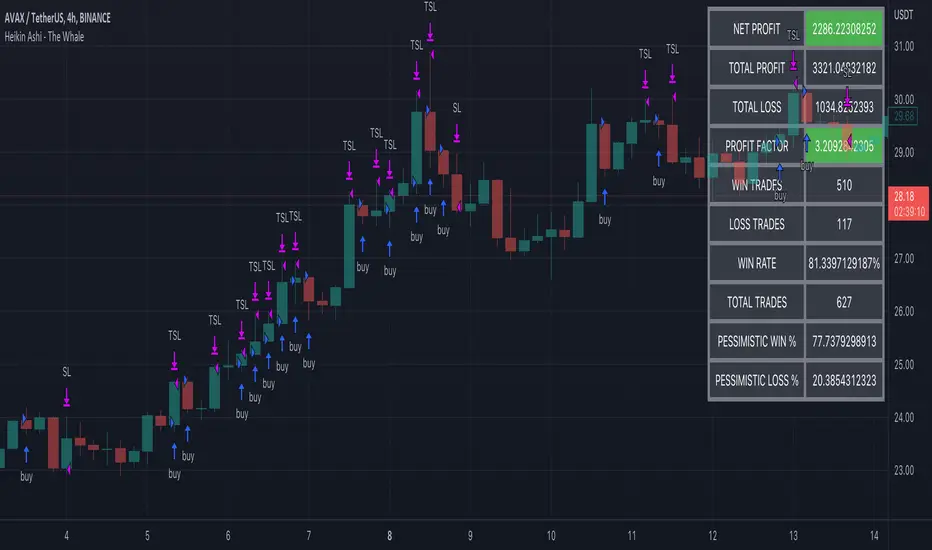
Heikin Ashi - The WhaleThe strategy is based on Heikin Ashi calculation, you do not need to switch the candle to HA.
The HA is used as a base entry, if a candle or two candles are bullish, then is valid to open a position, you can select the validation, one or two candles.
Also, the strategy mainly uses volume indicators as a confluence, you can select VWAP , VWMA , and Volume Oscillator, in addition to ADX which has two ways to validate the entry.
Base entry: One or two bullish HA candles (candles without a lower wick)
Confluence Indicators:
ADX: Will give a positive signal only if ADX is above the threshold, or if +DI is above -DI, or both.
VWAP: will give a positive signal if HA close is above VWAP.
VWMA: composite of 3 MA (20, 25, 50). There are multiple options to set it as confluence, the first option is to check if the short is bigger than the long and long is bigger than the base. The other options are to check the close status, which is bigger than which MA. You can find the description of each option in the strategy box
The sell is based on trailing stop loss (TSL), while the stop loss is based lowest X candle, the strategy will look back to the lowest number of the HA candles and set it as stop loss.
Options Scalper v2 - SPY/QQQHere's a comprehensive description of the Options Scalper v2 strategy:
---
## Options Scalper v2 - SPY/QQQ
### Overview
A multi-indicator confluence-based scalping strategy designed for trading SPY and QQQ options on short timeframes (1-5 minute charts). The strategy uses a scoring system to generate high-probability CALL and PUT signals by requiring alignment across multiple technical indicators before triggering entries.
---
### Core Logic
The strategy operates on a **scoring system (0-9 points)** where both bullish (CALL) and bearish (PUT) conditions are evaluated independently. A signal only fires when:
1. A recent EMA crossover occurred (within the last 3 bars)
2. The direction's score meets the minimum threshold (default: 4 points)
3. The signal's score is higher than the opposite direction
4. Enough bars have passed since the last signal (cooldown period)
5. Price action occurs during valid trading sessions
---
### Indicators Used
| Indicator | Purpose | CALL Condition | PUT Condition |
|-----------|---------|----------------|---------------|
| **9/21 EMA Cross** | Primary trigger | Fast EMA crosses above slow | Fast EMA crosses below slow |
| **200 EMA** | Trend filter | Price above 200 EMA | Price below 200 EMA |
| **RSI (14)** | Momentum filter | RSI between 45-65 | RSI between 35-55 |
| **VWAP** | Institutional level | Price above VWAP | Price below VWAP |
| **MACD (12,26,9)** | Momentum confirmation | MACD line > Signal line | MACD line < Signal line |
| **Stochastic (14,3)** | Overbought/Oversold | Oversold or K > D | Overbought or K < D |
| **Volume** | Participation confirmation | Spike on green candle | Spike on red candle |
| **Price Structure** | Breakout detection | Higher high formed | Lower low formed |
---
### Scoring Breakdown
**CALL Score (Max 9 points):**
- Recent EMA cross up: +2 pts
- EMA alignment (fast > slow): +1 pt
- RSI in bullish range: +1 pt
- Above VWAP: +1 pt
- MACD bullish: +1 pt
- Volume spike on green candle: +1 pt
- Stochastic setup: +1 pt
- Above 200 EMA: +1 pt
- Breaking higher high: +1 pt
**PUT Score (Max 9 points):**
- Recent EMA cross down: +2 pts
- EMA alignment (fast < slow): +1 pt
- RSI in bearish range: +1 pt
- Below VWAP: +1 pt
- MACD bearish: +1 pt
- Volume spike on red candle: +1 pt
- Stochastic setup: +1 pt
- Below 200 EMA: +1 pt
- Breaking lower low: +1 pt
---
### Risk Management
The strategy uses **ATR-based dynamic stops and targets**:
| Parameter | Default | Description |
|-----------|---------|-------------|
| Stop Loss | 1.5x ATR | Distance below entry for longs, above for shorts |
| Take Profit | 2.0x ATR | Creates a 1:1.33 risk-reward ratio |
Positions are also closed on:
- Opposite direction signal (flip trade)
- Take profit or stop loss hit
---
### Session Filtering
Trades are restricted to high-liquidity periods by default:
- **Morning Session:** 9:30 AM - 11:00 AM EST
- **Afternoon Session:** 2:30 PM - 3:55 PM EST
This avoids choppy midday price action and captures the highest volume periods.
---
### Input Parameters
| Parameter | Default | Description |
|-----------|---------|-------------|
| Fast EMA | 9 | Fast moving average period |
| Slow EMA | 21 | Slow moving average period |
| Trend EMA | 200 | Long-term trend filter |
| RSI Length | 14 | RSI calculation period |
| RSI Overbought | 65 | Upper RSI threshold |
| RSI Oversold | 35 | Lower RSI threshold |
| Volume Multiplier | 1.2x | Volume spike detection threshold |
| Min Signal Strength | 4 | Minimum score required to trigger |
| Crossover Lookback | 3 | Bars to consider crossover "recent" |
| Min Bars Between Signals | 5 | Cooldown period between signals |
---
### Visual Elements
**Chart Plots:**
- Green line: 9 EMA (fast)
- Red line: 21 EMA (slow)
- Gray line: 200 EMA (trend)
- Purple dots: VWAP
**Signal Markers:**
- Green triangle up + "CALL" label: Buy call signal
- Red triangle down + "PUT" label: Buy put signal
- Small circles: EMA crossover reference points
**Info Table (Top Right):**
- Real-time CALL and PUT scores
- RSI, MACD, Stochastic values
- VWAP and 200 EMA position
- Recent crossover status
- Current signal state
---
### Alerts
| Alert Name | Trigger |
|------------|---------|
| CALL Entry | Standard call signal fires |
| PUT Entry | Standard put signal fires |
| Strong CALL | Call signal with score ≥ 6 |
| Strong PUT | Put signal with score ≥ 6 |
---
### Recommended Usage
| Setting | 0DTE Scalping | Intraday Swings |
|---------|---------------|-----------------|
| Timeframe | 1-2 min | 5 min |
| Min Signal Strength | 5-6 | 4 |
| ATR Stop Mult | 1.0 | 1.5 |
| ATR TP Mult | 1.5 | 2.0 |
| Option Delta | 0.40-0.50 | 0.30-0.40 |
---
### Key Improvements Over v1
1. **Requires actual crossover** - Eliminates false signals from simple trend continuation
2. **Balanced scoring** - Both directions evaluated equally, highest score wins
3. **Signal cooldown** - Prevents overtrading with minimum bar spacing
4. **Multi-indicator confluence** - 8 factors must align for signal generation
5. **Volume-candle alignment** - Volume spikes only count when matching candle direction
---
### Disclaimer
This strategy is for educational purposes. Backtest thoroughly before live trading. Options trading involves significant risk of loss. Past performance does not guarantee future results.

Premarket Gap MomoTrader(SC)🚀 Pre-Market Momentum Trader | Dynamic Position Sizing 🔥
📈 Trade explosive pre-market breakouts with confidence! This algorithmic strategy automatically detects high-momentum setups, dynamically adjusts position size, and ensures risk control with a one-trade-per-day rule.
⸻
🎯 Key Features
✅ Pre-Market Trading (4:00 - 9:30 AM EST) – Only trades during the most volatile session for early breakouts.
✅ Dynamic Position Sizing – Adapts trade size based on candle strength:
• ≥90% body → 100% position
• ≥85% body → 50% position
• ≥75% body → 25% position
✅ 1 Trade Per Day – Avoids overtrading by allowing only one high-quality trade daily.
✅ Momentum Protection – Stays in the trade as long as:
• Every candle remains green (no red candles).
• Each new candle has increasing volume (confirming strong buying).
✅ Automated Exit – Closes position if:
• A red candle appears.
• Volume fails to increase on a green candle.
⸻
🔍 How It Works
📌 Entry Conditions:
✔️ Candle gains ≥5% from previous close.
✔️ Candle is green & body size ≥75% of total range.
✔️ Volume >15K (confirming liquidity).
✔️ Occurs within pre-market session (4:00 - 9:30 AM EST).
✔️ Only the first valid trade of the day is taken.
📌 Exit Conditions:
❌ First red candle after entry → Exit trade.
❌ First green candle with lower volume → Exit trade.
⸻
🏆 Why Use This?
🔹 Eliminates Fake Breakouts – No trade unless volume & momentum confirm.
🔹 Prevents Overtrading – Restricts to one quality trade per day.
🔹 Adaptable to Any Market – Works on stocks, crypto, or forex.
🔹 Hands-Free Execution – No manual chart watching required!
⸻
🚨 Important Notes
📢 Not financial advice. Trading involves risk—always backtest & practice on paper trading before using real money.
📢 Enable pre-market data in your TradingView settings for accurate results.
📢 Optimized for 1-minute & 5-minute timeframes.
🔔 Like this strategy? Leave a comment, share your results, and don’t forget to hit Follow for more strategies! 🚀🔥

TrendGuard Scalper: SSL + Hama Candle with Consolidation ZonesThis TradingView script brings a powerful scalping strategy that combines the SSL Channel and Hama Candles indicators with a special twist—consolidation detection. Designed for traders looking for consistency in various markets like crypto, forex, and stocks, this strategy highlights clear trend signals, risk management, and helps filter out risky trades during consolidation periods.
Why Use This Strategy?
Clear Trend Detection:
With the SSL Channel, you’ll know exactly when the market is in an uptrend (green) or downtrend (red), giving you straightforward entry points.
Short-Term Trend Precision with Hama Candles:
By calculating unique EMAs for open, high, low, and close, the Hama Candles show the strength and direction of short-term trends. Combined with the Hama Line, it gives you a solid confirmation on whether the trend is strong or about to reverse, allowing for precise entries and exits.
Avoiding Choppy Markets:
Thanks to ATR-based consolidation detection, this strategy identifies low-volatility periods where the market is “choppy” and less predictable. During these times, a yellow background appears on the chart, warning you to hold off on trades, reducing the likelihood of entering losing trades.
Built-In Risk Management:
With adjustable Take Profit and Stop Loss levels based on price movements, you can set and forget your trades, with a safety net if the market turns against you. The strategy automatically closes positions if the price returns to the Hama Candle, keeping your risk low.
How It Works:
Long Position: When both the SSL and Hama indicators show a green trend, and the price is above the Hama Candles, the strategy opens a long position. Take Profit triggers at your chosen risk-to-reward ratio, while Stop Loss protects you just below the Hama Line.
Short Position: When both indicators align in red and the price is below the Hama Candles, the strategy opens a short. Similar to longs, Stop Loss is set just above the Hama Line, and Take Profit is at your defined level.
Start Trading Confidently
Test this strategy with different settings and discover how it can perform across various assets. Whether you're trading Bitcoin, forex pairs, or stocks, this system has the flexibility and robustness to help you spot profitable trends and avoid risky zones. Try it today on a 30-minute timeframe to see how it aligns with your trading goals, and let the consolidation detection guide you away from false signals.
Happy trading, and may the trends be with you! 📈

2nd Grade StrategyThis is a strategy to complement the 2GT indicator. It utilises the same rules as 2GT.
This is comprises of multiple popularly used indicators to help decide on whether to go long or short. This indicator will overlay the MA lines and background colours on your chart.
The heikin-ashi colour will be shown as the background colour. This will help you identify a trend more easily while using bars, candles, hollow candles, etc. When the background is green, it means that it is a green HA and vice versa.
The blue MA line is for showing the short-term trend. The red MA line is for showing the medium-term trend. You can select the moving average flavour of your choice in the settings.
The yellow MA line is the long-term trend that is mainly used as a filter to indicate bullish/bearish trend. The MA type for this filter can be different from the short/mid term MA.
This indicator will also show Stochastic crossovers (GC, DC, BC) on the chart. This will help to always keep your eye on the chart candles.
In the settings, you can also turn on/off bullish/bearish signals.
Rules for bullish signals on this indicator:-
1. MA: Blue > Red > Yellow (FastMA > SlowMA > FilterMA)
2. Stochastic: K > D and both are heading upwards
3. 2nd Green HA
When 2 out of the 3 rules are met, the candle background will be Aqua in colour. When all 3 rules are met, the candle background will be Green .
Rules for bearish signals on this indicator:-
1. MA: Yellow > Red > Blue (FilterMA > SlowMA > FastMA)
2. Stochastic: D > K and both are heading downwards
3. 2nd Red HA
When 2 out of the 3 rules are met, the candle background will be Orange in colour. When all 3 rules are met, the candle background will be Red .
Do note that you can hide any of these elements in via the settings.
If you find this useful, do smash the LIKE and FOLLOW button.
WSLM

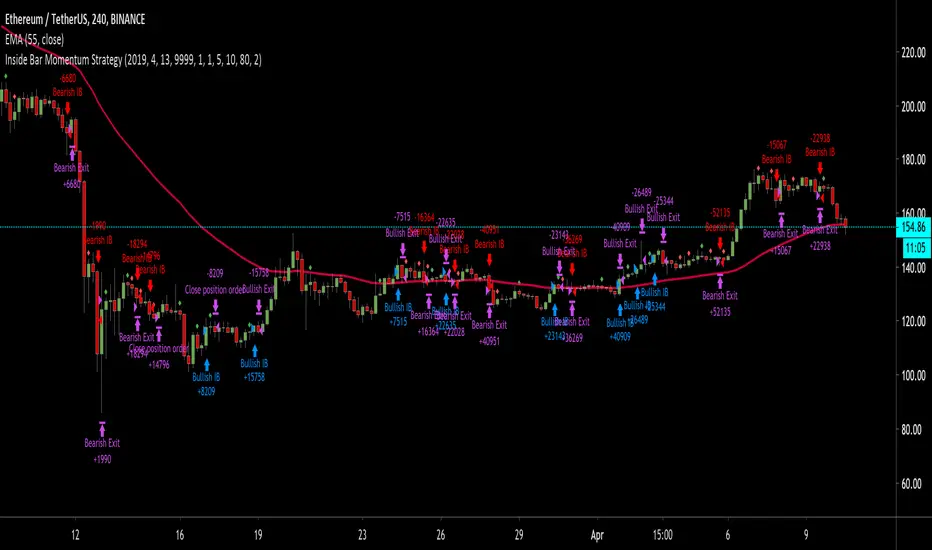
Inside Bar Momentum StrategyDescription for the strategy:
It's an inside bar momentum trade, looking for candlestick formations breakout and trading momentum with a short stop and target to 80% of the initial candle.
The entry is on a break of the original candle, stop loss is at 20% of the candle range (from the entry).
In case there's a new inside bar formation, all existing orders and trades are cancelled and new orders are placed for the new levels.
HSI First 30m Candle Strategy (5m Chart)## HSI First Candle Breakout Strategy
USE on 10m TF for max profit rate.
**The HSI First Candle Breakout Strategy** is a systematic trading approach tailored for Hang Seng Index Futures during the main Hong Kong day session. The strategy is designed to capture early market momentum by reacting to the first significant move of the day.
### How It Works
- **Reference Candle:** At the start of each day session (09:00), the high and low of the first 15-minute candle are recorded.
- **Breakout Trigger:**
- A **buy (long) trade** is initiated if price breaks above the first candle’s high.
- A **sell (short) trade** is initiated if price breaks below the first candle’s low.
- **Stop Loss & Take Profit:**
- Stop-loss is placed on the opposite side of the reference candle.
- Take-profit target is set at a distance equal to the size of the reference candle (1R).
- **Filters:**
- Skip the day if the first candle’s range exceeds 200 index points.
- Only the first triggered direction is traded per session.
- All trades are closed before the market closes if neither target nor stop is hit.
- **Execution:** The strategy works best on intraday charts (5m or 15m) and is ideal for traders seeking disciplined, systematic intraday setups.
### Key Features
- Captures the day’s initial momentum burst.
- Strict risk management with predefined stops and targets.
- One trade per day, reducing overtrading and noise.
- Clear-cut, rule-based, and objective system—no discretion required.
**This strategy offers a transparent and robust framework for traders to systematically capture high-probability breakouts in the Hang Seng Index Futures market.**

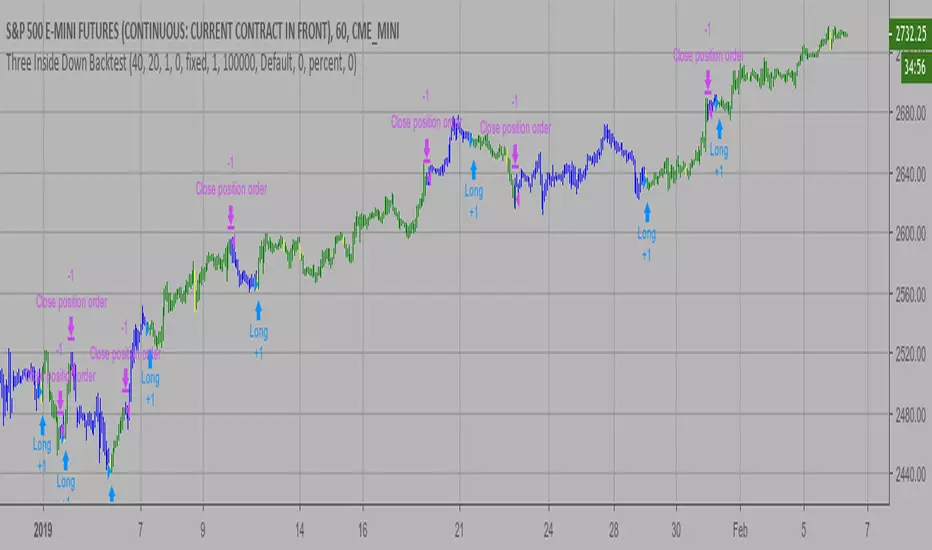
Three Inside Up Backtest This is a three candlestick bullish reversal pattern consisting of a
bullish harami pattern formed by the first 2 candlesticks then followed
by up candlestick with a higher close than the prior candlestick.
WARNING:
- For purpose educate only
- This script to change bars colors.

Three Inside Down Backtest This is a three candlestick bearish reversal pattern consisting of a bearish
harami pattern formed by the first 2 candlesticks then followed by down
candlestick with a lower close than the prior candlestick.
WARNING:
- For purpose educate only
- This script to change bars colors.