Fibonacci Vision ProFibonacci Precision Signals Pro | Smart Buy & Sell Alerts
━━━━━━━━━━━━━━━━━━━━━━━━━━━━━━━━━━━━━━━━━━━━━━━━━━━━
OVERVIEW
This indicator combines Fibonacci mathematics with advanced signal filtering to deliver precise buy and sell signals. It automatically detects swing structure, calculates the key 0.618 retracement level, and generates signals only when multiple confirmation factors align.
Clean. Accurate. Professional.
━━━━━━━━━━━━━━━━━━━━━━━━━━━━━━━━━━━━━━━━━━━━━━━━━━━━
HOW IT WORKS
The script identifies swing highs and lows, then calculates Fibonacci retracement levels automatically. When price interacts with the 0.618 zone and all filters confirm, a signal appears:
▲ buy — Long entry opportunity
▼ sell — Short entry opportunity
━━━━━━━━━━━━━━━━━━━━━━━━━━━━━━━━━━━━━━━━━━━━━━━━━━━━
6-LAYER CONFIRMATION SYSTEM
Every signal must pass through:
Trend Direction Analysis
Fibonacci Level Interaction
EMA Trend Filter (50-period default)
RSI Momentum Validation (14-period default)
Volume Spike Detection
Candlestick Pattern Recognition (Pin bars, Engulfing, Momentum candles)
This multi-layer approach significantly reduces false signals.
━━━━━━━━━━━━━━━━━━━━━━━━━━━━━━━━━━━━━━━━━━━━━━━━━━━━
BUILT-IN RISK MANAGEMENT
Every trade includes automatic stop loss and take profit levels:
Stop Loss: 100 pips
Take Profit: 200 pips
Risk-Reward Ratio: 1:2
Adjust these values in settings to match your trading style.
━━━━━━━━━━━━━━━━━━━━━━━━━━━━━━━━━━━━━━━━━━━━━━━━━━━━
KEY FEATURES
✅ Automatic Fibonacci calculation — no manual drawing
✅ Multi-timeframe compatibility — M15 to Daily
✅ Universal market support — Forex, Crypto, Stocks, Indices
✅ Clean minimalist signals — white triangles with text
✅ Customizable filters — adjust sensitivity to your preference
✅ Built-in alerts — never miss a signal
✅ No repainting — signals remain fixed once confirmed
━━━━━━━━━━━━━━━━━━━━━━━━━━━━━━━━━━━━━━━━━━━━━━━━━━━━
Swing Detection:
Swing Length — Controls sensitivity to market structure (default: 10)
Confirmation Bars — Bars required to confirm signal (default: 1)
Signal Filters:
EMA Trend Filter — Toggle trend confirmation on/off
EMA Length — Adjust trend filter period (default: 50)
RSI Filter — Toggle momentum confirmation on/off
RSI Length — Adjust momentum period (default: 14)
Volume Filter — Toggle volume confirmation on/off
Volume Multiplier — Set volume threshold (default: 1.2x average)
Risk Management:
Stop Loss Pips — Set your stop loss distance (default: 100)
Take Profit Pips — Set your profit target (default: 200)
Pip Value — Adjust for your instrument (0.0001 for most Forex, 0.01 for JPY pairs)
Visuals:
Show Signals — Toggle signal visibility
Show Cloud — Toggle Fibonacci zone visibility
━━━━━━━━━━━━━━━━━━━━━━━━━━━━━━━━━━━━━━━━━━━━━━━━━━━━
BEST PRACTICES
Use on H1 or H4 timeframes for optimal results
Trade in direction of the higher timeframe trend
Avoid trading during major news events
Combine with proper position sizing
Always use the built-in stop loss
Be patient — quality signals over quantity
━━━━━━━━━━━━━━━━━━━━━━━━━━━━━━━━━━━━━━━━━━━━━━━━━━━━
MARKETS SUPPORTED
Forex — All major, minor, and exotic pairs
Crypto — BTC, ETH, and altcoins
Stocks — Any equity on TradingView
Indices — S&P500, NASDAQ, DAX, FTSE, etc.
Commodities — Gold, Silver, Oil, etc.
━━━━━━━━━━━━━━━━━━━━━━━━━━━━━━━━━━━━━━━━━━━━━━━━━━━━
WHY FIBONACCI?
The 0.618 ratio (Golden Ratio) is observed by traders worldwide. When price retraces to this level, it often:
Reverses direction
Finds support or resistance
Creates high-probability entry opportunities
This script automates the detection of these key moments.
━━━━━━━━━━━━━━━━━━━━━━━━━━━━━━━━━━━━━━━━━━━━━━━━━━━━
ALERTS INCLUDED
Set up notifications to receive signals on:
Mobile push notifications
Desktop popups
Email alerts
Webhook integrations
Never miss a trading opportunity again.
━━━━━━━━━━━━━━━━━━━━━━━━━━━━━━━━━━━━━━━━━━━━━━━━━━━━
WHAT MAKES THIS DIFFERENT
Most indicators give too many signals. This one focuses on quality.
Most indicators clutter your chart. This one keeps it clean.
Most indicators ignore risk management. This one includes it.
Most indicators work on one market. This one works on all.
━━━━━━━━━━━━━━━━━━━━━━━━━━━━━━━━━━━━━━━━━━━━━━━━━━━━
DISCLAIMER
This indicator is a trading tool, not financial advice. Trading involves substantial risk of loss. Past performance does not guarantee future results. Always use proper risk management and never trade with money you cannot afford to lose. Test on a demo account before trading live.
ابحث في النصوص البرمجية عن "candle"

Fractional Candlestick Long Only Experimental V10Fractional Candlestick Long-Only Strategy – Technical Description
This document provides a professional English description of the "Fractional Candlestick Long Only Experimental V6" strategy using pure CF/AB fractional kernels and wavelet-based filtering.
1. Fractional Candlesticks (CF / AB)
The strategy computes two fractional representations of price using Caputo–Fabrizio (CF) and Atangana–Baleanu (AB) kernels. These provide long-memory filtering without EMA approximations. Both CF and AB versions are applied to O/H/L/C, producing fractional candlesticks and fractional Heikin-Ashi variants.
2. Trend Stack Logic
Trend confirmation is based on a 4-component stack:
- CF close > AB close
- HA_CF close > HA_AB close
- HA_CF bullish
- HA_AB bullish
The user selects how many components must align (4, 3, or any 2).
3. Wavelet Filtering
A wavelet transform (Haar, Daubechies-4, Mexican Hat) is applied to a chosen source (e.g., HA_CF close). The wavelet response is used as:
- entry filter (4 modes)
- exit filter (4 modes)
Wavelet modes: off, confirm, wavelet-only, block adverse signals.
4. Trailing System
Trailing stop uses fractional AB low × buffer, providing long-memory dynamic trailing behavior. A fractional trend channel (CF/AB lows vs HA highs) is also plotted.
5. Exit Framework
Exit options include: stack flip, CF

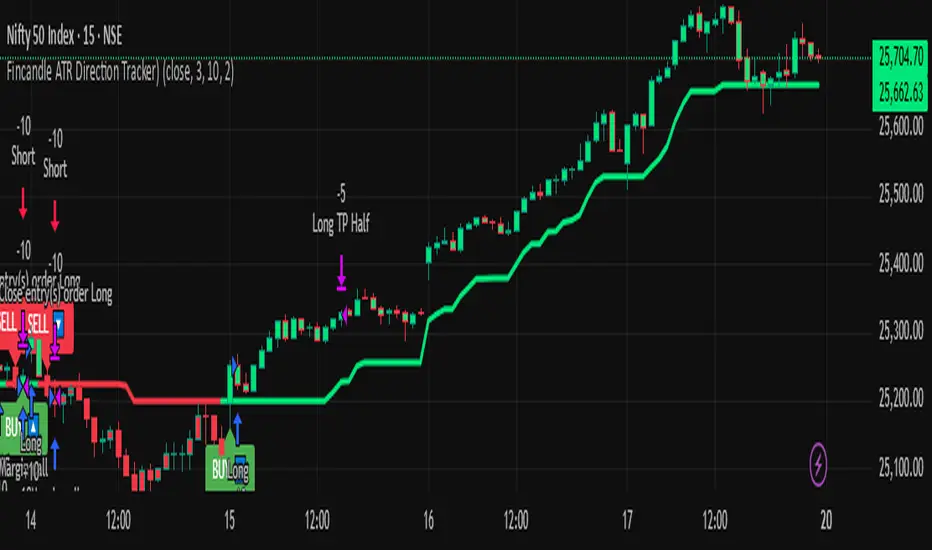
Fincandle ATR Direction TrackerOverview
The Fincandle ATR Direction Tracker is a strategy designed to capture momentum moves in the market using a dynamic ATR-based trailing stop. It identifies strong momentum candles and filters signals using trend alignment with moving averages.
Partial exits allow users to take a portion of profit at a predefined ATR multiple while keeping the remaining position open until the opposite signal occurs.
How It Works
Momentum Detection:
Measures candle body size relative to the Average True Range (ATR).
A candle is considered momentum if its body size exceeds ATR × Multiplier.
Trend Filter:
Uses two moving averages (Fast MA and Slow MA) to determine the market trend.
Bullish trend: Fast MA > Slow MA → long trades allowed
Bearish trend: Fast MA < Slow MA → short trades allowed
Trend filter can be toggled on or off.
ATR Trailing Stop:
A dynamic trailing stop adapts to price volatility.
Crossing above the trail triggers a buy signal, crossing below triggers a sell signal.
Partial Exit / Take Profit:
Step 1: Exit 50% of the position when price moves a configurable multiple of ATR in your favor.
Step 2: Close the remaining position when the opposite signal occurs (e.g., price crosses below/above the ATR trail).
How to Use
Add the strategy to any chart (stocks, indices, forex, crypto).
Configure ATR period, sensitivity, take profit multiple, and moving average lengths to suit the timeframe and asset.
Monitor buy/sell markers and dynamic ATR trail on the chart.
Optional: Set alerts for real-time notifications when signals trigger.
Adjust partial exit multiplier to control risk/reward.
Example Settings
ATR Period: 10
ATR Sensitivity: 3 × ATR
Take Profit: 2 × ATR
Fast MA: 50
Slow MA: 200
Partial Exit: 50% of position at take profit, remaining exits on opposite signal
Key Features
Adaptive ATR trailing stop for volatility-based entries/exits.
Trend alignment filter with Fast/Slow MA.
Partial exit logic for better risk management.
Visual BUY/SELL markers and alerts.
Fully Pine Script v6 compatible.
Disclaimer
This strategy is for educational and analytical purposes only.
It does not guarantee profits. Traders should always use proper risk management.
Bearish Wick Reversal█ STRATEGY OVERVIEW
The "Bearish Wick Reversal Strategy" identifies potential bullish reversals following significant bearish price rejection (long lower wicks). This counter-trend approach enters long positions when bearish candles show exaggerated downside wicks relative to closing prices, then exits on bullish confirmation signals. Includes optional EMA trend filtering for improved reliability.
█ What is a Bearish Wick?
A price rejection pattern where:
Bearish candle (close < open) forms with extended lower wick
Wick represents failed selloff: Low drops significantly below close
Measured as: (Low - Close)/Close × 100 (Negative percentage indicates downward extension)
█ SIGNAL GENERATION
1. LONG ENTRY CONDITION
Bearish candle forms with close < open
Lower wick exceeds user-defined threshold (Default: -1% of close price)
The signal occurs within the specified time window
If enabled, the close price must also be above the 200-period EMA (Exponential Moving Average)
2. EXIT CONDITION
A Sell Signal is generated when the current closing price exceeds the highest high of the previous seven bars (`close > _highest `). This indicates that the price has shown strength, potentially confirming the reversal and prompting the strategy to exit the position.
█ PERFORMANCE OVERVIEW
Ideal Market: Volatile instruments with frequent price rejections
Key Risk: False signals in sustained bearish trends
Optimization Tip: Test various thresholds
Filter Impact: EMA reduces trades but improves win rate and reduces drawdown

Liquidity Sweep + BOS Retest System — Prop Firm Edition🟦 Liquidity Sweep + BOS Retest System — Prop Firm Edition
A High-Probability Smart Money Strategy Built for NQ, ES, and Funding Accounts
🚀 Overview
The Liquidity Sweep + BOS Retest System (Prop Firm Edition) is a precision-engineered SMC strategy built specifically for prop firm traders. It mirrors institutional liquidity behavior and combines it with strict account-safe entry rules to help traders pass and maintain funding accounts with consistency.
Unlike typical indicators, this system waits for three confirmations — liquidity sweep, displacement, and a clean retest — before executing any trade. Every component is optimized for low drawdown, high R:R, and prop-firm-approved risk management.
Whether you’re trading Apex, TakeProfitTrader, FFF, or OneUp Trader, this system gives you a powerful mechanical framework that keeps you within rules while identifying the market’s highest-probability reversal zones.
🔥 Key Features
1. Liquidity Sweep Detection (Stop Hunt Logic)
Automatically identifies when price clears a previous swing high/low with a sweep confirmation candle.
✔ Filters noise
✔ Eliminates early entries
✔ Locks onto true liquidity grabs
2. Automatic Break of Structure (BOS) Confirmation
Price must show true displacement by breaking structure opposite the sweep direction.
✔ Confirms momentum shift
✔ Removes fake reversals
✔ Ensures institutional intent
3. Precision Retest Entry Model
The strategy enters only when price retests the BOS level at premium/discount pricing.
✔ Zero chasing
✔ Extremely tight stop loss placement
✔ Prop-firm-friendly controlled risk
4. Built-In Risk & Trade Management
SL set at swept liquidity
TP set by user-defined R:R multiplier
Optional session filter (NY Open by default)
One trade at a time (no pyramiding)
Automatically resets logic after each trade
This prevents overtrading — the #1 cause of evaluation and account breaches.
5. Designed for Prop Firm Futures Trading
This script is optimized for:
Trailing/static drawdown accounts
Micro contract precision
Funding evaluations
Low-risk, high-probability setups
Structured, rule-based execution
It reduces randomness and emotional trading by automating the highest-quality SMC sequence.
🎯 The Trading Model Behind the System
Step 1 — Liquidity Sweep
Price must take out a recent high/low and close back inside structure.
This confirms stop-hunting behavior and marks the beginning of a potential reversal.
Step 2 — BOS (Break of Structure)
Price must break the opposite side swing with a displacement candle. This validates a directional shift.
Step 3 — Retest Entry
The system waits for price to retrace into the BOS level and signal continuation.
This creates optimal R:R entry with minimal drawdown.
📈 Best Markets
NQ (NASDAQ Futures) – Highly recommended
ES, YM, RTY
Gold (XAUUSD)
FX majors
Crypto (with high volatility)
Works best on 1m, 2m, 5m, or 15m depending on your trading style.
🧠 Why Traders Love This System
✔ No signals until all confirmations align
✔ Reduces overtrading and emotional decisions
✔ Follows market structure instead of random indicators
✔ Perfect for maintaining long-term funded accounts
✔ Built around institutional-grade concepts
✔ Makes your trading consistent, calm, and rules-based
⚙️ Recommended Settings
Session: 06:30–08:00 MST (NY Open)
R:R: 1.5R – 3R
Contracts: Start with 1–2 micros
Markets: NQ for best structure & volume
📦 What’s Included
Complete strategy logic
All plots, labels, sweep markers & BOS alerts
BOS retest entry automation
Session filtering
Stop loss & take profit system
Full SMC logic pipeline
🏁 Summary
The Liquidity Sweep + BOS Retest System is a complete, prop-firm-ready, structure-based strategy that automates one of the cleanest and most reliable SMC entry models. It is designed to keep you safe, consistent, and rule-compliant while capturing premium institutional setups.
If you want to trade with confidence, discipline, and prop-firm precision — this system is for you.
Good Luck -BG

Velocity SmartMoney Engine work - Delta Exchange📈 Velocity SmartMoney Engine
Adaptive Breakout & Order Block Strategy with Dynamic Risk Control
---
🔍 Overview
The Velocity SmartMoney Engine is a next-generation trading strategy that fuses Smart Money breakout logic , Order Block structure detection , and Supertrend-based directional filtering into one precision-built system.
It identifies institutional-level breakouts , manages positions with ATR-based adaptive risk , and executes disciplined exits using stop-loss, trailing stop, and profit target logic.
Designed for swing and short-term system traders, this strategy performs excellently on BTC, ETH, NIFTY, BANKNIFTY, Gold, and major FX pairs — best on 15m to 4h timeframes .
---
⚙️ Core Components
1️⃣ Smart Money Breakout Logic
Detects real breakouts using dynamic support/resistance pivots.
Confirms entries only during strong volatility bursts.
Avoids false breakouts in sideways markets.
2️⃣ Order Block Gap Detection
Finds institutional imbalance zones (Smart Money footprints).
Bullish gaps = Long bias; Bearish gaps = Short bias.
Works with candle confirmation and momentum validation.
3️⃣ Supertrend Directional Filter
Trades only in direction of Supertrend bias.
Exits instantly when Supertrend flips.
Prevents entries against dominant trend.
4️⃣ ATR-Based Risk & Volatility Filter
Uses ATR × multiplier for adaptive stop sizing.
Volatility filter ensures trades trigger only during active markets.
Avoids whipsaw zones.
---
💰 Position Management
Stop-Loss: Adaptive ATR-based.
Take-Profit: Default 5% target (editable input).
Trailing Stop: Auto-adjusts to lock profits.
No-Exit Hold: Hold position for defined candles before exits.
Supertrend Flip Exit: Instant trend-based closure.
---
🧠 Built-In Trade Discipline
One-trade-per-bar guard prevents duplicate entries.
Volatility-weighted breakout validation.
Clean and conflict-free exit hierarchy.
---
🎯 Key Features
✅ Smart Money breakout + Order Block fusion
✅ Supertrend-based trend confirmation
✅ ATR dynamic stop + 5% profit target
✅ Adaptive trailing logic
✅ One-trade-per-bar control
✅ Works across Crypto, Indices, FX, Commodities
✅ Ideal for 1h–4h swing setups
---
📊 Recommended Settings
Parameter | Typical Value | Purpose
--- | --- | ---
Levels Period | 20 | Pivot lookback for S/R zones
Volatility Filter | 20–40 | Filters out low-momentum areas
ATR Multiplier | 1.5 | Adjust stop size by volatility
Supertrend Length | 10 | ATR period for trend bias
Supertrend Multiplier | 3.0 | Supertrend sensitivity
Target Profit | 5% | Default take-profit level
---
⚡ Suggested Use
• Best suited for swing entries on 1H / 4H charts .
• Combine with session filters or trend confluence for automation.
• Ideal as a base module for TradingView + Broker integrations .
---
🧩 Disclaimer
This script is for educational purposes only .
Past performance does not guarantee future returns.
Use responsibly. The developer assumes no liability for financial losses.
---
💬 Community & Access
Developed by: Shubham Singh
Version: Velocity SmartMoney Engine v1.0
For premium modules & automation: DM "Velocity Access" on chat to request access.
---
© 2025 Velocity SmartMoney Engine — All Rights Reserved

3-Candle Reversal Pattern-vahid2star3-Candle Reversal Zones + Hammer Confirmation (with Risk Management & Alerts)
This script combines 3-candle reversal detection, hammer confirmations, and smart demand/supply zone plotting into a single tool designed for both discretionary and automated traders.
🔍 Core Logic
3-Candle Reversal Pattern
Candle-1: Strong move in one direction (big body).
Candle-2: Doji-like candle (high shadow/body ratio).
Candle-3: Reversal candle in the opposite direction (large body relative to Candle-2).
A gap after Candle-3 is required for extra confirmation.
Hammer Confirmation (Hammer-1 & Hammer-2)
After a valid 3-candle setup, the script searches for a hammer pattern near the zone.
Hammer-1: Draws a box directly on the hammer range if followed by a strong confirming candle.
Hammer-2: If another hammer forms after the confirmation candle and holds for N bars (configurable), a second hammer box is drawn.
Demand & Supply Zones
For bullish setups, a demand zone is created from the Candle-2 low to the Candle-1 low.
For bearish setups, a supply zone is created from the Candle-2 high to the Candle-1 high.
Zones extend to the right until price interacts with them.
🛠 Filters & Quality Controls
Trend filter (optional):
Only draw zones if price respects higher-timeframe EMA200 slope and LTF EMA alignment.
Market structure filter:
Require higher-high / higher-low (for bullish) or lower-high / lower-low (for bearish).
ATR filter:
Zones must have a minimum height relative to ATR.
Overlap control:
Avoid drawing zones that overlap too heavily with existing ones.
Cooldown:
Restrict consecutive zones of the same type within a user-defined bar distance.
🎯 Risk Management & Strategy
Dynamic position sizing:
Trade size is automatically calculated from account equity, risk %, and leverage.
Stop-loss & Take-profit:
SL placed just beyond the zone ± buffer ticks.
TP automatically set at user-defined Reward:Risk ratio (e.g., 3:1).
Capital protection:
Trades respect max leverage and risk per position settings.
⚡ Alerts
The script provides one-time alerts for each zone:
🔔 First Touch Alert → Triggered when price first touches a demand, supply, or hammer box.
Each zone only fires one alert, avoiding duplicates on re-touch or trade exit.
📊 Visuals
Demand zones: Green boxes.
Supply zones: Red boxes.
Hammer boxes: Blue (bullish) / Orange (bearish).
Used zones: Greyed out after price fills them.
Outcomes: Zones change to green if TP is hit, red if SL is hit.
Optional labels mark “Bullish zone ✓”, “Bearish zone ✓”, “Hammer-1 ✓”, or “Hammer-2 ✓” when confirmed.
🔧 Settings Overview
Core pattern ratios (C1/C2, C3/C2 size multipliers).
Doji definition (shadow/body ratio).
Hammer search depth, confirmation delay, and strictness.
Risk % per trade, leverage cap, stop buffer, RR ratio.
Visual styling (colors, max box count, labels).
Trend, structure, ATR, overlap, and cooldown filters.
Option to disable orders (use as indicator + alerts only).
⚠️ Disclaimer
This script is a technical analysis tool intended for educational purposes.
It does not guarantee profits. Use proper risk management and test thoroughly before applying in live trading.
✨ With its combination of 3-candle reversals, hammer confirmations, and smart filtering, this script is designed to reduce noise, highlight high-probability zones, and give traders both visual structure and actionable alerts.

No Wick Strategy (No-wick candles) — by Sh1n1gam1**No Wick Strategy - Momentum Trading System**
This strategy identifies and trades "no wick" or "minimal wick" candles, which often indicate strong directional momentum and conviction in the market.
**STRATEGY CONCEPT:**
The No Wick Strategy capitalizes on candles that show strong directional commitment - bullish candles with little to no bottom wick (buyers in control from the start) and bearish candles with little to no top wick (sellers dominating from the open).
**HOW IT WORKS:**
📈 **LONG ENTRIES:**
- Identifies bullish candles with minimal/no bottom wick
- Places buy limit order slightly below the signal candle's open
- Enters only during specified trading session
📉 **SHORT ENTRIES:**
- Identifies bearish candles with minimal/no top wick
- Places sell limit order slightly above the signal candle's close
- Enters only during specified trading session
**KEY FEATURES:**
✅ Customizable trading session (New York timezone)
✅ Flexible wick threshold (0% for strict, up to X% for flexibility)
✅ ATR-based stop loss for dynamic risk management
✅ Configurable risk-reward ratio via TP multiplier
✅ Auto-cancellation of unfilled orders after X bars
✅ Body size filters (minimum and maximum)
✅ Visual signals and pending order levels
✅ Position status display
**RISK MANAGEMENT:**
- Stop Loss: Based on ATR multiplier
- Take Profit: Multiple of stop loss distance
- One position at a time
- No pyramiding or position flipping
**RECOMMENDED TIMEFRAMES:**
- M1 and M5 for scalping
- M15 and H1 for day trading
- H4 and Daily for swing trading
**MARKETS:**
Suitable for forex pairs, indices (NQ, ES), commodities, and liquid stocks.
**DEFAULT SETTINGS:**
- Trading Session: 09:30-11:00 ET (NY morning session)
- ATR SL Multiplier: 1.5
- TP Multiplier: 2.0 (2:1 RR ratio)
- Wick Threshold: 5%
- Order Cancellation: 5 bars
**TIPS FOR OPTIMIZATION:**
1. Adjust trading session to match your market's most active hours
2. Test different wick thresholds (0-10%) based on market volatility
3. Optimize body size filters for your specific instrument
4. Backtest different ATR multipliers for your risk tolerance
5. Consider market conditions - works best in trending markets
**IMPORTANT NOTES:**
- Uses limit orders for better entry prices
- Does not close opposing positions (no position flipping)
- Respects trading session boundaries strictly
- All times are in America/New_York timezone
**AUTHOR:** Sh1n1gam1
**VERSION:** 1.0
**SUPPORT:** Comments and suggestions welcome!
Happy Trading! 📊

Forex Hammer and Hanging Man StrategyThe strategy is based on two key candlestick chart patterns: Hammer and Hanging Man. These chart patterns are widely used in technical analysis to identify potential reversal points in the market. Their relevance in the Forex market, known for its high liquidity and volatile price movements, is particularly pronounced. Both patterns provide insights into market sentiment and trader psychology, which are critical in currency trading, where short-term volatility plays a significant role.
1. Hammer:
• Typically occurs after a downtrend.
• Signals a potential trend reversal to the upside.
• A Hammer has:
• A small body (close and open are close to each other).
• A long lower shadow, at least twice as long as the body.
• No or a very short upper shadow.
2. Hanging Man:
• Typically occurs after an uptrend.
• Signals a potential reversal to the downside.
• A Hanging Man has:
• A small body, similar to the Hammer.
• A long lower shadow, at least twice as long as the body.
• A small or no upper shadow.
These patterns are a manifestation of market psychology, specifically the tug-of-war between buyers and sellers. The Hammer reflects a situation where sellers tried to push the price down but were overpowered by buyers, while the Hanging Man shows that buyers failed to maintain the upward movement, and sellers could take control.
Relevance of Chart Patterns in Forex
In the Forex market, chart patterns are vital tools because they offer insights into price action and market sentiment. Since Forex trading often involves large volumes of trades, chart patterns like the Hammer and Hanging Man are important for recognizing potential shifts in market momentum. These patterns are a part of technical analysis, which aims to forecast future price movements based on historical data, relying on the psychology of market participants.
Scientific Literature on the Relevance of Candlestick Patterns
1. Behavioral Finance and Candlestick Patterns:
Research on behavioral finance supports the idea that candlestick patterns, such as the Hammer and Hanging Man, are relevant because they reflect shifts in trader psychology and sentiment. According to Lo, Mamaysky, and Wang (2000), patterns like these could be seen as representations of collective investor behavior, influenced by overreaction, optimism, or pessimism, and can often signal reversals in market trends.
2. Statistical Validation of Chart Patterns:
Studies by Brock, Lakonishok, and LeBaron (1992) explored the profitability of technical analysis strategies, including candlestick patterns, and found evidence that certain patterns, such as the Hammer, can have predictive value in financial markets. While their study primarily focused on stock markets, their findings are generally applicable to the Forex market as well.
3. Market Efficiency and Candlestick Patterns:
The efficient market hypothesis (EMH) posits that all available information is reflected in asset prices, but some studies suggest that markets may not always be perfectly efficient, allowing for profitable exploitation of certain chart patterns. For instance, Jegadeesh and Titman (1993) found that momentum strategies, which often rely on price patterns and trends, could generate significant returns, suggesting that patterns like the Hammer or Hanging Man may provide a slight edge, particularly in short-term Forex trading.
Testing the Strategy in Forex Using the Provided Script
The provided script allows traders to test and evaluate the Hammer and Hanging Man patterns in Forex trading by entering positions when these patterns appear and holding the position for a specified number of periods. This strategy can be tested to assess its performance across different currency pairs and timeframes.
1. Testing on Different Timeframes:
• The effectiveness of candlestick patterns can vary across different timeframes, as market dynamics change with the level of detail in each timeframe. Shorter timeframes may provide more frequent signals, but with higher noise, while longer timeframes may produce more reliable signals, but with fewer opportunities. This multi-timeframe analysis could be an area to explore to enhance the strategy’s robustness.
2. Exit Strategies:
• The script incorporates an exit strategy where positions are closed after holding them for a specified number of periods. This is useful for testing how long the reversal patterns typically take to play out and when the optimal exit occurs for maximum profitability. It can also help to adjust the exit logic based on real-time market behavior.
Conclusion
The Hammer and Hanging Man patterns are widely recognized in technical analysis as potential reversal signals, and their application in Forex trading is valuable due to the market’s high volatility and liquidity. This strategy leverages these candlestick patterns to enter and exit trades based on shifts in market sentiment and psychology. Testing and optimization, as offered by the script, can help refine the strategy and improve its effectiveness.
For further refinement, it could be valuable to consider combining candlestick patterns with other technical indicators or using multi-timeframe analysis to confirm patterns and increase the probability of successful trades.
References:
• Lo, A. W., Mamaysky, H., & Wang, J. (2000). Foundations of Technical Analysis: Computational Algorithms, Statistical Inference, and Empirical Implementation. The Journal of Finance, 55(4), 1705-1770.
• Brock, W., Lakonishok, J., & LeBaron, B. (1992). Simple Technical Trading Rules and the Stochastic Properties of Stock Returns. The Journal of Finance, 47(5), 1731-1764.
• Jegadeesh, N., & Titman, S. (1993). Returns to Buying Winners and Selling Losers: Implications for Stock Market Efficiency. The Journal of Finance, 48(1), 65-91.
This provides a theoretical basis for the use of candlestick patterns in trading, supported by academic literature and research on market psychology and efficiency.

SuperTrend Trapping Candle StrategyHello traders!
How this indicator works?
The main functionality of this indicator is to find entry based upon SuperTrend indicator. This indicator helps us to find trapping candle to enter into the market.
What is a trapping candle?
A trapping candle is a candle that shows strength in opposite direction to SuperTrend. This helps us to enter in a trade before the move start in the current trend's direction. There are two types of trapping candles signals I have added currently:
1. Volume is high than previous candle in the opposite direction.
2. 3 candles of opposite direction with decreasing volume .
How to enter in a trade in uptrend market?
SuperTrend shows a green signal
A green triangle formed below red candle
Enter into the trade when price is above red candle high
SL could be place below red candle or swing low if it is near
How to enter in a trade in downtrend market?
SuperTrend shows a red signal
A red triangle formed above green candle
Enter into the trade when price is below green candle low
SL could be place above green candle high or swing high if it is near
How to avoid to enter in a trade in sideways market?
You can follow price action strategies
Or you can follow some indicator to find sideways market
Indicator settings and how to change?
ATR Length - For SuperTrend, this is default value.
Factor - For SuperTrend, changed to 2 to provide fast signals.
Candle Height - For trapping candle price, default set to 0.003% of the current price.

Nifty & BN 2 Candle Theory Back Testing and Alert Notification How To Initiate Long Trade-in Index Future/ Buy Call Options – 3 Min TF
▪ If The Index Futures Trades Above The VWAP, the Following Parameters are Checked For 2 Candle Theory on the long side
▪ RSI Trades Above 50 & Between 50-75/80
▪ Volume Of 2 Consecutive Bars Is Above 50 K for BN & 125 K For Nifty
▪ All the indicators (Parabolic SAR, Super Trend, VMA, VWAP) Below the Candles
▪ When the above conditions are met enter In 3rd Candle, With 1st Candle High As SL
How I Initiate Short Trade-In Index Future/ Buy Put Options – 3 Min TF
▪ If The Index Futures Trades Below The VWAP, the Following Parameters are Checked For 2 Candle Theory on the short side
▪ RSI Trades Below 40 & Between 40-25/20
▪ Volume Of 2 Consecutive Bars Is Above 50 K for BN & 125 K For Nifty
▪ All the Indicators (Parabolic SAR, Super Trend, VMA, VWAP) Above The Candles
▪ When the above conditions are met enter In 3rd Candle, With 1st Candle High As SL
The indicator checks the above and notifies to enter a long trade and short trade respectively. There is also volume cutoff and change in the volumes respectively, also non-trading times that can be set.

Bollinger Bands %B - Belt Holds & Inner CandlesThis is a simple strategy that uses Bollinger Bands %B represented as a histogram combined with Candle Beltholds and Inside candles for entry signals, and combines this with "buy" and "sell" zones of the %B indicator, to buy and sell based on the zones you set.
How to use:
Long when in the green zone and an inside candle (which is highlighted in white) or a bullish belt hold (which is highlighted in yellow), and sell when inside a red zone and has an inside candle or a bearish belt hold (which is highlighted in purple) or the stop loss or take profit is hit.
Short when in the red zone and an inside candle (which is highlighted in white) or a bearish belt hold (which is highlighted in purple), and sell when inside a green zone and has an inside candle or a bullish belt hold (which is highlighted in yellow) or the stop loss or take profit is hit.
Stop loss / take profit selection:
Choose which performs best for you, ATR based uses the average true range, and % based is based on a set percent of loss or profit.
Heikin-Ashi candles strategy CRYPTO Long termThis is a simple and efficient trading strategies which relies entirely on Heikin ashi candles logic, but used with normal candles in order to avoid false signals.
For entry we have
Long condition : when we have a green candle and previous close was lower than the previous open(previous candle was red)
For short: when we have a short candle and previous cande was green.
For the better function of this strategy, is best to use big timeframes like 12h or 1day or even higher than that.
If you have any questions, please let me know !

MA Candles Supertrend StrategySimple strategy which is derived by below method:
1. Calculate moving average of High, Low, Open and Close and make candles of them.
2. Derive supertrend on the moving average candles.
3. Generate buy and sell signals based on supertrend direction combined with higher timeframe high-low condition

BEST Engulfing + Breakout StrategyHello traders
This is a simple algorithm for a Tradingview strategy tracking a convergence of 2 unrelated indicators.
Convergence is the solution to my trading problems.
It's a puzzle with infinite possibilities and only a few working combinations.
Here's one that I like
- Engulfing pattern
- Price vs Moving average for detecting a breakout
Definition
Take out the notebooks :) and some coffee (good for focus). I'm bullish in coffee
The engulfing pattern is a two-candle reversal pattern.
The second candle completely ‘engulfs’ the real body of the first one, without regard to the length of the tail shadows.
The bullish Engulfing pattern appears in a downtrend and is a combination of one red candle followed by a larger green candle
The bearish Engulfing pattern appears in a downtrend and is a combination of one green candle followed by a larger red candle
Example: imgur.com
We're bored sir... what's the point of all this?
In summary, an engulfing is a pattern to track reversals. (the whole TradingView audience stands up now giving a standing ovation)
Adding the Price vs Moving average filters allows to track reversals with momentums (half of the audience collapsed because this is too awesome)
Ok sir... you picked up my interest
I included some cool backtest filters:
- date range filtering
- flexible take profit in USD value (plotted in blue)
- flexible stop loss in USD value (plotted in red)
All the best
Dave

WaveTrend with Pump Candle Rejection [Reuter]This is my first script, a strategy I tested on the ADABTC pair, 30m Time Frame.
To made this strat I used the Wave Trend Oscillator from LazyBear and some calculations to measure the confirmation candle and the previous candle.
The idea for this strat is to enter the market on a lower level through the wt1-wt2, catching a possible bounce back. For us to not get so much in trouble, I made a candle meter, so we don`t enter on a pumped candle.
It`s a simple script, you can apply to other pair and markets, but you need to play around with the settings to match the best conditions. Still have to see if I can minimize the bear market buys with other indicator.
If you liked my idea and it helped you give this strat a like!
BTC: 3HDgosPC7s45D2nAC6pUfFuyt5ZS94wrBQ
Nano: xrb_3qr1aa4ey6odbxr1hrrthehg3oif58sgreopbj4i74d7wqs1bmbxmmuaicse

specific breakout FiFTOStrategy Description: 10:14 Breakout Only
Overview This is a time-based intraday trading strategy designed to capture momentum bursts that occur specifically after the 10:14 AM candle closes. It operates on the logic that if price breaks the high of this specific candle within a short window, a trend continuation is likely.
Core Logic & Rules
The Setup Candle (10:14 AM)
The strategy waits specifically for the minute candle at 10:14 to complete.
Once this candle closes, the strategy records its High price.
Defining the Entry Level
It calculates a trigger price by taking the 10:14 High and adding a user-defined Buffer (e.g., +1 point).
Formula: Entry Level = 10:14 High + Buffer
The "Active Window" (Expiry)
The trade setup does not remain open all day. It has a strict time limit.
By default, the setup is valid from 10:15 to 10:20.
If the price does not break the Entry Level by the expiry time (default 10:20), the setup is cancelled and no trade is taken for the day.
Entry Trigger
If a candle closes above the Entry Level while the window is open, a Long (Buy) position is opened immediately.
Exits (Risk Management)
Stop Loss: A fixed number of points below the entry price.
Target: A fixed number of points above the entry price.
Visual & Automation Features
Visual Boxes: Upon entry, the strategy draws a "Long Position" style visual on the chart. A green box highlights the profit zone, and a red box highlights the loss zone. These boxes extend automatically until the trade closes.
JSON Alerts: The strategy is pre-configured to send data-rich alerts for automation (e.g., Telegram bots).
Entry Alert: Includes Symbol, Entry Price, SL, and TP.
Exit Alerts: Specific messages for "Target Hit" or "SL Hit".
Summary of User Inputs
Entry Buffer: Extra points added to the high to filter false breaks.
Fixed Stop Loss: Risk per trade in points.
Fixed Target: Reward per trade in points.
Expiry Minute: The minute (10:xx) at which the setup becomes invalid if not triggered.

NQ2K SSS# Intelligent Trend Identification
**Adaptive Channels**: Utilizes dynamically adjusted volatility channels that automatically optimize parameters based on market volatility
**Bull-Bear Judgment**: Monitors trend direction changes in real-time, accurately capturing bull-to-bear conversion opportunities
**Signal Confirmation**: Multiple condition verification ensures the reliability of trading signals
# ⏰ Precise Timing Control
**Scheduled Execution**: Built-in intelligent timing trading system that automatically executes during optimal periods
**Cross-day Processing**: Comprehensive handling of overnight positions and cross-trading day logic
**Time Filtering**: Customizable trading time windows to focus on high-probability periods
# 🛡️ Strict Risk Control System
**Automatic Stop Loss**: Risk control mechanism based on fixed percentage
**Position Management**: Zero pyramiding strategy, strictly controlling single exposure risk
**Real-time Monitoring**: Continuous tracking of position status, timely execution of risk control measures
# 📊 Professional Visualization
**Trend Visualization**: Clearly displays current trend direction and strength
**Signal Marking**: Intuitive buy/sell point markers and trend conversion prompts
**Candlestick Coloring**: Real-time candlestick color changes reflect bull-bear power comparison
# Applicable Markets
**Main Products**: Stock index futures, commodity futures, forex, and other products with moderate volatility
**Time Frames**: Suitable for multiple time periods, recommended for daily or 4-hour charts
**Market Conditions**: Particularly suitable for markets with clear trends and moderate volatility
# Strategy Advantages
**Clear Rules**: All trading logic is fully quantified, avoiding subjective judgment interference
**Strong Adaptability**: Dynamic parameter adjustment mechanism adapts to different market environments
**Rigorous Execution**: Strict timing control and risk management system
**Intuitive and Easy to Use**: Clear chart displays and signal prompts for easy monitoring and decision-making

INTRA DAY BEAST The Intraday Beast doesn’t follow trends… it detects them before they roar.
It watches the market’s rhythm, waits in silence, and strikes only when the odds are loaded in its favor.
This isn’t your average flashy indicator — it doesn’t bark at every candle.
When it moves, it means business.
Each signal is a calculated attack — clean, disciplined, and deadly precise.
But listen carefully…
⚠️ The Beast hates boredom.
If your stock has no volume, no volatility, no life — it won’t even wake up.
Feed it only the hottest stocks, the wildest moves, and the loudest markets.
Then, and only then, you’ll see what this creature can do.
💬 Trade smart. Stay patient. Wait for chaos — then let the Beast strike.

Strategy Builder v1.0.0 [BigBeluga]🔵 OVERVIEW
The Strategy Builder combines advanced price-action logic, smart-money concepts, and volatility-adaptive momentum signals to automate high-quality entries and exits across any market. It blends trend recognition, market structure shifts, order block reactions, imbalance (FVG) signals, liquidity sweeps, candlestick confirmations, and oscillator-powered divergences into one cohesive engine.
Whether used as a full automation workflow or as a structured confirmation framework, this strategy provides a disciplined, rules-driven method to trade with logic — not emotion.
🔵 BACKTEST WINDOW CONTROL
This module allows you to restrict strategy execution to a specific historical period.
Ideal for performance isolation, regime testing, and forward-walk validation.
Limit Backtest Window
Enabling this option activates custom date filters for the backtest engine.
Start — Define the starting date & time for backtesting
End — Define the ending date & time for backtesting
Only trades and signals inside this window are executed
Reduces computation load on large datasets
Useful for testing specific market environments (e.g., bull cycles, crash periods, sideways regimes)
🔵 SIGNAL GLOSSARY (Advanced Technical Explanation)
Traders can build long and short setups using up to 6 configurable entry conditions for each direction.
Every condition can be set as Bullish or Bearish and mapped to any signal source — allowing deep customization
Below is the full internal logic overview of every signal available in the Strategy Builder.
Signals are based on trend models, volatility structures, liquidity logic, oscillator behavior, and market structure mapping.
Trend Signals (Low-Lag Trend Engine)
Uses a proprietary low-lag baseline + momentum gradient model to detect directional bias.
Trend Signal — Momentum breaks above/below adaptive trend baseline.
Trend Signal+ — Stronger trend confirmation using volatility-weighted momentum.
Trend Signal Any — Triggers when any bullish/bearish trend signal appears.
SmartBand & Retests (Adaptive Volatility Bands)
Dynamic envelope that contracts/expands with volatility & trend strength.
SmartBand Retest — Price retests dynamic band and rejects, confirming continuation.
ActionWave Signals (Impulse-Pullback Engine)
Tracks wave behavior, acceleration and deceleration in price.
ActionWave — Detects directional impulse strength vs pullback weakness.
ActionWave Cross — Momentum acceleration threshold crossed → trend ignition.
Magnet Signals (Liquidity Gravity + Mean Reversion Bias)
Detects zones where price is being drawn due to liquidity voids or imbalance.
Magnet — Trend and liquidity pressure align, creating directional “pull.”
MagnetBar Low Momentum — Low-volatility compression → pre-breakout condition.
Flow Trend (Directional Flow State + ATR Envelope)
Higher-timeframe bias confirmation + dynamic volatility filter.
FlowTrend — Confirms major directional bias (uptrend or downtrend).
FlowTrend Retest — Price tests HTF flow band and rejects → trend resume.
Voltix (Volatility Expansion Pulse)
Detects regime shift from quiet accumulation → trending expansion.
Voltix — Breakout volatility signature, trend acceleration trigger.
Candlestick Pattern (Algorithmic Price Action Recognition)
Auto-recognizes meaningful reversal or continuation candle formations.
Candlestick Pattern — Confirms momentum reversal/continuation via candle logic.
OrderBlock Logic (Institutional Footprint System)
Institutional demand/supply zone tracking with mitigation logic.
Order Block Touch — Price taps institutional zone → reaction filter.
Order Block Break — OB invalidation → institutional flow shift.
Market Structure Engine (Swing Logic + Volume Confirmation)
Tracks major swing breaks and structural reversals.
BoS — Break of Structure in trend direction (continuation bias).
ChoCh — Change of Character — early reversal marker.
Fair Value Gaps (Imbalance & Volume Displacement)
Identifies inefficiencies caused by rapid displacement moves.
FVG Created — Price leaves inefficiency behind.
FVG Retest — Price returns to rebalance inefficiency → reaction zone.
Liquidity Events (Stop-Run & Reversal Logic)
Detects stop-hunt events and liquidity sweeps.
SFP — Swing failure & wick sweep → reversal confirmation.
Liquidity Created — New equal highs/lows form liquidity pool.
Liquidity Grab — Sweep through liquidity line followed by rejection.
Support / Resistance Break Logic
Adaptive zone recognition + momentum confirmation.
Support/Resistance Cross — Zone decisively broken → structural shift.
Pattern Breakouts (Market Geometry Engine)
Tracks breakout from compression & expansion formations.
Channel Break — Channel breakout → trend acceleration.
Wedge Break — Break from contraction wedge → burst of momentum.
Session Logic (Opening Range Behavior)
Session-based volatility trigger.
Session Break — Break above/below session opening range.
Momentum / Reversal Oscillator Suite
Oscillator-driven exhaustion & reversal signals.
Nautilus Signals — Momentum reversal signature (oscillator shift).
Nautilus Peak — Momentum peak → exhaustion risk.
OverSold/Overbought ❖ — Extreme exhaustion zones → reversal setup.
DipX Signals ✦ — Dip buy / Dip sell timing, micro-reversal engine.
Advanced Divergence Engine
Momentum/price disagreement layer with multi-trigger confirmation.
Normal Divergence — Classic divergence reversal.
Hidden Divergence — Trend continuation divergence.
Multiple Divergence — Multiple divergence confirmations stacked → high confidence.
🔧 Adjustable Signal Logic
Some signals in this system can be additionally refined through the strategy settings panel.
This allows traders to tune internal behavior for different market regimes, assets, and volatility conditions.
🔵 LONG / SHORT EXIT CONDITIONS
This section allows you to automate exits using the same advanced market conditions available for entries.
Each exit rule consists of:
Toggle — Enable/disable individual exit rule.
Direction Filter — Trigger exit only if selected market bias appears (Bullish/Bearish).
Signal Type — Choose which market event triggers the exit (same list as entry conditions).
When the active conditions are met, the strategy automatically closes the current position — ensuring emotion-free risk management and systematic trade control.
🔵 TAKE PROFIT & STOP LOSS SYSTEM
This strategy builder provides a fully dynamic risk-management engine designed for both systematic traders and discretionary confirmation users.
Take Profit Logic
Scale out of trades progressively or exit fully using algorithmic TP levels.
Up to 3 Take-Profit targets available
Choose TP calculation method:
• ATR-based distance (volatility-adaptive targets)
• %-based distance (fixed percentage from entry)
Define Size — ATR multiplier or % value
Custom Exit Size per TP (e.g., 25% / 25% / 50%)
Visual TP plotting on chart for clarity
Stop Loss Logic
Automated protection logic for every trade.
Two SL Modes:
• Fixed Stop Loss — static SL from entry
• Trailing Stop Loss — SL follows price as trade progresses
Distance options:
• ATR multiplier (adapts to volatility)
• %-based from entry (fixed distance)
SL dynamically draws on chart for transparency
Trailing SL behavior:
Follows price only in profitable direction
Never moves against the trade
Locks profits as trend develops
🔵 Strategy Dashboard
A compact on-chart performance dashboard is included to help monitor live trade status and backtest results in real time.
It displays key metrics:
Start Capital — Initial account balance used in simulation.
Position Size — % of capital allocated per trade based on user settings (It changes if the trade hits take profits, when more than one take profit is selected).
Current Trade — Shows active trade direction (Long / Short) and real-time % return from entry.
Closed Trades — Counter of completed positions, useful for reading sample size during testing.
🔵 CONCLUSION
The Strategy Builder brings together a powerful suite of smart-money and momentum-driven signals, allowing traders to automate robust trade logic built on modern market structure concepts. With access to trend filters, order blocks, liquidity events, divergence signals, volatility cues, and session-based triggers, it provides a deeply adaptive trade engine capable of fitting many market environments.

SMC Strategy with RSI/OB at Market PriceTakes trade using smc with rsi confirmation
Buy Signal Triggers When:
Scenario 1 (Immediate Touch): Price touches/enters bullish OB boundaries AND previous candle closed with RSI ≤ 35
Scenario 2 (Close Inside): Current candle closes inside bullish OB AND current RSI ≤ 35
Sell Signal Triggers When:
Scenario 1 (Immediate Touch): Price touches/enters bearish OB boundaries AND previous candle closed with RSI ≥ 65
Scenario 2 (Close Inside): Current candle closes inside bearish OB AND current RSI ≥ 65
SMC 自動交易 - 4HR- BTC適用# SMC Automated Trading Strategy Whitepaper - Stepped Enhanced Edition
## 1. Strategy Overview
This strategy is designed based on the Smart Money Concept (SMC), integrating Order Block (OB), Change of Character (CHoCH), and strict pullback confirmation conditions. The goal is to enhance trading accuracy and strictly control risk, specifically tailored for trading competitions, meeting the requirements of stability and efficiency.
### Core Strategy Concepts:
- Precise identification of key trend reversal points.
- Strict pullback confirmation to avoid chasing tops or bottoms.
- Clear risk management and take-profit mechanisms to maintain stable risk-reward ratio.
- Supports trading time filtering (Kill Zone) to capture prime volatility windows.
- Multiple visual aids for quick in-trade signal recognition.
## 2. Strategy Logic Flow
### 1. Kill Zone (Optional Activation)
- Default trading time: Taiwan time 15:00 - 18:00.
- Purpose: Focus on high-volatility periods to reduce false signals in choppy markets.
### 2. Order Block Detection
- Current candle range exceeds the previous candle by a specified multiplier (default 0.8).
- Bullish OB: Bullish candle with expanded range.
- Bearish OB: Bearish candle with expanded range.
- Flexible OB sensitivity adjustment according to market volatility.
### 3. Change of Character (CHoCH)
- Initial trend reversal confirmation:
- Bullish CHoCH: Close above previous candle’s high.
- Bearish CHoCH: Close below previous candle’s low.
### 4. Pullback Confirmation (Core Condition)
- Avoid premature entries by requiring a pullback to the prior OB:
- Long: Pullback touches the previous Bullish OB high.
- Short: Pullback touches the previous Bearish OB low.
### 5. Fair Value Gap (FVG) Detection (Optional)
- Detect price imbalances as additional confirmation signals.
## 3. Entry Logic
### Long Position:
- Previous Bullish OB is formed.
- Current candle completes a pullback to the prior OB high.
- Current candle closes above the previous high (CHoCH confirmation).
- (Optional) Within Kill Zone.
### Short Position:
- Previous Bearish OB is formed.
- Current candle completes a pullback to the prior OB low.
- Current candle closes below the previous low (CHoCH confirmation).
- (Optional) Within Kill Zone.
## 4. Risk Management & Exit Strategy
### Stop Loss:
- Long: Current candle’s low minus buffer points (default 50 points).
- Short: Current candle’s high plus buffer points (default 50 points).
### Take Profit:
- Default Risk-Reward Ratio (RR): 2.0 (customizable).
- Automatically calculates target take-profit level.
### Full Automation:
- This is a fully automated strategy. Orders are placed automatically upon conditions being met, requiring no manual intervention.
## 5. Visual Aids
- Bullish OB: Green upward triangle.
- Bearish OB: Red downward triangle.
- Bullish CHoCH: Blue circle.
- Bearish CHoCH: Orange circle.
- FVG: Highlighted zones (optional).
> **Advantage:** Quick market status recognition during trades, improving strategy transparency.
## 6. Strategy Advantages
✅ Dual trend reversal confirmation: OB + CHoCH.
✅ Strict pullback requirement to reduce false breakouts.
✅ Clear risk control and stable risk-reward ratio.
✅ Visual aids + time filter for clear in-trade decisions.
✅ Fully automated trading reduces human error.
## 7. Application Scenarios
- Trading competitions: Designed for high win-rate and strict risk control.
- FTMO and similar evaluation challenges.
- Intraday or swing trading strategy frameworks.
- High-volatility assets: Crypto / Forex / Index CFDs.
## 8. Risk Warning
- Strategy is based on historical backtesting; live trading should consider slippage and liquidity risks.
- During high volatility periods, use proper money management tools and strictly execute stop losses.
## 9. Version Note
Version: Stepped Enhanced Edition (Updated April 2025)
Developer: natwad3000

Ramen & OJ V1Ramen & OJ V1 — Strategy Overview
Ramen & OJ V1 is a mechanical price-action system built around two entry archetypes—Engulfing and Momentum—with trend gates, session controls, risk rails, and optional interval take-profits. It’s designed to behave the same way you’d trade it manually: wait for a qualified impulse, enter with discipline (optionally on a measured retracement), and manage the position with clear, rules-based exits.
Core Idea (What the engine does)
At its heart, the strategy looks for a decisive candle, then trades in alignment with your defined trend gates and flattens when that bias is no longer valid.
Entry Candle Type
Engulfing: The body of the current candle swallows the prior candle’s body (classic momentum shift).
Momentum: A simple directional body (close > open for longs, close < open for shorts).
Body Filter (lookback): Optional guard that requires the current body to be at least as large as the max body from the last N bars. This keeps you from chasing weak signals.
Primary MA (Entry/Exit Role):
Gate (optional): Require price to be above the Primary MA for longs / below for shorts.
Exit (always): Base exit occurs when price closes back across the Primary MA against your position.
Longs: qualifying bullish candle + pass all enabled filters.
Shorts: mirror logic.
Entries (Impulse vs. Pullback)
You choose how aggressive to be:
Market/Bars-Close Entry: Fire on the bar that confirms the signal (respecting filters and sessions).
Retracement Entry (optional): Instead of chasing the close, place a limit around a configurable % of the signal candle’s range (e.g., 50%). This buys the dip/sells the pop with structure, often improving average entry and risk.
Flip logic is handled: when an opposite, fully-qualified signal appears while in a position, the strategy closes first and then opens the new direction per rules.
Exits & Trade Management
Primary Exit: Price closing back across the Primary MA against your position.
Interval Take-Profit (optional):
Pre-Placed (native): Automatically lays out laddered limit targets every X ticks with OCO behavior. Each rung can carry its own stop (per-rung risk). Clean, broker-like behavior in backtests.
Manual (legacy): Closes slices as price steps through the ladder levels intrabar. Useful for platforms/brokers that need incremental closes rather than bracketed OCOs.
Per-Trade Stop: Choose ticks or dollars, and whether the $ stop is per position or per contract. When pre-placed TP is on, each rung uses a coordinated OCO stop; otherwise a single hard stop is attached.
Risk Rails (Session P&L Controls)
Session Soft Lock: When a session profit target or loss limit is hit, the strategy stops taking new trades but does not force-close open positions.
Session Hard Lock: On reaching your session P&L limit, all orders are canceled and the strategy flattens immediately. No new orders until the next session.
These rails help keep good days good and bad days survivable.
Filters & How They Work Together
1) Trend & Bias
Primary MA Gate (optional): Only long above / only short below. This keeps signals aligned with your primary bias.
Primary MA Slope Filter (optional): Require a minimum up/down slope (in degrees over a defined bar span). It’s a simple way to force impulse alignment—green light only when the MA is actually moving up for longs (or down for shorts).
Secondary MA Filter (optional): An additional trend gate (SMA/EMA, often a 200). Price must be on the correct side of this higher-timeframe proxy to trade. Great for avoiding countertrend picks.
How to combine:
Use Secondary MA as the “big picture” bias, Primary MA gate as your local regime check, and Slope to ensure momentum in that regime. That three-layer stack cuts a lot of chop.
2) Volatility/Exhaustion
CCI Dead Zone Filter (optional): Trades only when CCI is inside a specified band (default ±200). This avoids entries when price is extremely stretched; think of it as a no-chase rule.
TTM Squeeze Filter (optional): When enabled, the strategy avoids entries during a squeeze (Bollinger Bands inside Keltner Channels). You’re effectively waiting for the release, not the compression itself. This plays nicely with momentum entries and the slope gate.
How to combine:
If you want only the clean breaks, enable Slope + Squeeze; if you want structure but fewer chases, add CCI Dead Zone. You’ll filter out a lot of low-quality “wiggle” trades.
3) Time & Market Calendar
Sessions: Up to two session windows (America/Chicago by default), with background highlights.
Good-Till-Close (GTC): When ON, trades can close outside the session window; when OFF, all positions are flattened at session end and pending orders canceled.
Market-Day Filters: Skip US listed holidays and known non-full Globex days (e.g., Black Friday, certain eves). Cleaner logs and fewer backtest artifacts.
How to combine:
Run your A-setup window (e.g., cash open hour) with GTC ON if you want exits to obey system rules even after the window, or GTC OFF if you want the book flat at the bell, no exceptions.
Practical Profiles (mix-and-match presets)
Trend Rider: Primary MA gate ON, Slope filter ON, Secondary MA ON, Retracement ON (50%).
Goal: Only take momentum that’s already moving, buy the dip/sell the pop back into trend.
Structure-First Pullback: Primary MA gate ON, Secondary MA ON, CCI Dead Zone ON, Retracement 38–62%.
Goal: Filter extremes, use measured pullbacks for better R:R.
Break-Only Mode: Slope ON + Squeeze filter ON (avoid compression), Body filter ON with short lookback.
Goal: Only catch clean post-compression impulses.
Session Scalper: Tight session window, GTC OFF, Interval TP ON (small slices, short rungs), per-trade tick stop.
Goal: Quick hits in a well-defined window, always flat after.
Automation Notes
The system is built with intrabar awareness (calc_on_every_tick=true) and supports bracket-style behavior via pre-placed interval TP rungs. For webhook automation (e.g., TradersPost), keep chart(s) open and ensure alerts are tied to your order events or signal conditions as implemented in your alert templates. Always validate live routing with a small-size shakedown before scaling.
Tips, Caveats & Good Hygiene
Intrabar vs. Close: Backtests can fill intrabar where your broker might not. The pre-placed mode helps emulate OCO behavior but still depends on feed granularity.
Slippage & Fees: Set realistic slippage/commission in Strategy Properties to avoid fantasy equity curves.
Session Consistency: Use the correct timezone and verify that your broker’s session aligns with your chart session settings.
Don’t Over-stack Filters: More filters ≠ better performance. Start with trend gates, then add one volatility filter if needed.
Disclosure
This script is for educational purposes only and is not financial advice. Markets carry risk; only trade capital you can afford to lose. Test thoroughly on replay and paper before using any automated routing.
TL;DR
Identify a decisive candle → pass trend/vol filters → (optionally) pull back to a measured limit → scale out on pre-planned rungs → exit on Primary MA break or session rule. Clear, mechanical, repeatable.
