EMA 1 & SALMA Intersection StrategyTrading Strategy: EMA 1 & SALMA Crossover System
This strategy is a Trend-Following system that focuses on the direct interaction between the price (represented by EMA 1) and a smoothed trendline (SALMA). Instead of relying on the color changes of the indicator, it uses mechanical crossover signals to enter and exit trades.
1. Indicators Used
EMA 1 (Exponential Moving Average): Since the period is 1, it effectively represents the Current Price. It reacts instantly to every market move.
SALMA v3.0 (Smoothed Adaptive Lattice Moving Average): A double-smoothed moving average that acts as the "Base Line" or "Trend Support/Resistance."
RSI (Relative Strength Index): Used as a Momentum Filter to ensure we don't trade against the market's strength.
2. Buy (Long) Entry Rules
You enter a Long position when the following conditions are met:
The Crossover: The EMA 1 (Price) crosses ABOVE the SALMA line. This indicates that the short-term momentum is shifting higher than the average trend.
The Filter (RSI): The RSI must be above 50. This confirms that the buyers are in control and the upward move has enough strength.
3. Sell (Short) Entry Rules
You enter a Short position when the following conditions are met:
The Crossunder: The EMA 1 (Price) crosses BELOW the SALMA line. This indicates a breakdown in price action.
The Filter (RSI): The RSI must be below 50. This confirms that the sellers are dominating and the downward momentum is real.
4. Key Advantages of This System
Objectivity: You don't guess based on the color of the line; you wait for a clear physical break (cross) of the line.
Precision: By using EMA 1, you get the earliest possible entry signal compared to slower moving averages.
False Signal Protection: The RSI 50 filter prevents you from entering "weak" trades where the price crosses the line but lacks the volume or momentum to continue.
ابحث في النصوص البرمجية عن "candle"

[STRATEGY] Adaptive Multi Factor Trend TradingDaily Filters
Close vs. short/long daily SMAs (customizable) defines directional priority.
Use the daily Short Long MA spread (or ATR‑normalized) to filter out range‑bound conditions and reduce false breakouts.
30‑Minute Entry Logic
Buy
Daily bullish regime confirmed
High breaks above the trend
Protected by trailing take‑profit and fixed stop‑loss.
Sell #1
Daily bearish regime confirmed
Low breaks below the trend
Long MA slope must be strong (trend‑quality filter).
Sell #2
Day‑session only, limited to high‑probability hours
Triggered by an aggregated bear score (multi‑factor stack) + a downward linear‑regression slope
Friday uses special thresholds/intervals (event‑risk control).
Multi‑Factor Framework
MACD, RSI, Stoch (KD), Ichimoku, CCI, PSAR, Williams %R, Heikin Ashi, Bias, Force Index, plus regression‑slope.
Signals are stacked into bull/bear totals and used as filters or weights—no single indicator dominance.
Risk & Position Management
Fixed TP/SL + trailing TP across entry types
Position size adapts to recent performance (loss‑streak counter) and slope state
Auto pause when the loss streak hits the threshold (configurable duration).
Trading‑Day Controls
Optional pre‑holiday blackout list
Date‑range limiter for backtests or deployment windows.
Design Intent
The goal is to keep net P&L stable while lifting win rate.
In strong‑trend environments, the system leans into trend signals (Sell #1 / Buy).
In short‑term chop, Sell #2 timing and the slope filter reduce noise and avoid low‑quality entries.

KSE-100 PSX Long Strategy by KadunagraDeveloped from a academic part of the doctoral research of Kadunagra on digital finance and automation at **** University in Australia, this strategy implements a "Campaign-Based Adaptive Execution" framework. It moves beyond simple entries and exits by treating each market engagement as a multi-phase campaign with distinct operational states. The system intelligently identifies cyclical turning points, then employs a feedback-driven approach to capital allocation—reinforcing successful momentum with pyramiding while deploying controlled defensive averaging during temporary setbacks. By anchoring its exit mechanism to dynamically updated market structure rather than static profit targets, the algorithm seeks to capture cyclical momentum while maintaining disciplined risk parameters. This research-driven approach represents an evolution toward state-aware algorithmic systems that adapt their tactics in real-time based on market phase recognition.

RF SMC Strategy V1.7 PROD.RF SMC PRO V1.7 is a multi-timeframe Smart Money Concepts framework that builds a rule-based view of market structure and then trades directly off that structure. It’s designed for traders who want to systematize SMC logic, keep their charts readable, and automate their trading.
Instead of relying on lagging oscillators, the strategy continuously tracks the active price levels and reacts to structural shifts in real time. It does this on multiple time frames, to find the best entries, and entry models, based on specific criteria.
There are multiple entry models, based on the lower time frame structure, using the higher time frame bias, to find those sniper entries. You can use a combination of different entry models as well to find the highest win rate set-ups.
Risk management is fully structure-based. Stops are always placed beyond the current structure high/low, with a few different take profit models:
Fixed RR – simple R-multiple targeting off the structure-based stop.
HTF Weak High/Low – targets the opposing side of the active HTF leg.
Opposite CHoCH – stays in the trade, until the LTF structure flips against the position. Meaning your winners can run, and losers have the ability to be cut early.
Key Features:
Multi-timeframe functionality
Primary and optional secondary HTF bias filters.
Discount/premium gating
Entry model combinations
TP models
Extra filtering based on days, sessions, and other bias filters.
Get Access on Whop Here: whop.com

EmmTech FVG Instantaneous Mitigation Strategy Only buy once SMA is above rsi and sell when sma is below RSI


Prop-Firm Ready 2% Drawdown Double-Digit PF 72% AccuracyPerformance snapshot (Strategy Tester):
• ~72% win rate
• Double-digit profit factor (11+)
• ~1.39% maximum drawdown
• 36 trades over a multi-month window
• 1-contract baseline (scalable)
This system was engineered specifically to solve the hardest problem in trading:
high return with institutional-grade drawdown control.
Prop-firm ready by design:
• Drawdown remains well below common prop-firm limits
• No martingale, no grid, no averaging down
• Controlled trade frequency with asymmetric risk/reward
• Capital efficiency prioritized over trade count
What this is:
A turnkey, all-factor trading system that integrates trend, momentum, volatility, and structural confirmation into a single execution framework. Independent engines operate in parallel to capture non-correlated opportunity while the core system maintains directional exposure.
What this is not:
• Not curve-fit
• Not over-leveraged
• Not dependent on winning every trade
The objective is simple:
extract maximum capital growth per unit of drawdown.
This script is published for full performance transparency.
Source code and inputs are protected.
Additional system details and updates:
www.empireostrading.com

FluxMA ProFluxMA Pro
FluxMA Pro is an intraday trend-following strategy based on moving-average cross signals , with built-in execution filters (time window + weekdays), direction control, and an optional strict one-trade-per-day rule.
The system enters when price crosses the selected moving average, and manages risk using fixed SL/TP in ticks . For clarity and auditing, it plots the MA and draws risk (SL) / reward (TP) zones on the chart.
This script is published for educational and research purposes , with documented mechanics and replication settings to support transparency and reproducibility.
How the strategy works
Signal engine (MA cross)
A base Moving Average (MA) is computed from a selectable price source.
A Long signal triggers when price crosses above the MA.
A Short signal triggers when price crosses below the MA.
Execution filters
Time filter : trades only inside the configured window (supports overnight windows correctly).
Weekday filter : enable/disable trading by day (Mon–Sun).
Direction filter : run Long only , Short only , or Both .
One trade per day (optional) : if enabled, once a trade is placed, no new trades are allowed until the next daily reset.
Risk management (ticks)
Stop-loss and take-profit are set using fixed distances in ticks from entry.
Orders are placed with a stop and a limit exit to keep execution auditable.
Visual audit layer
Plots the Moving Average on the chart.
Draws SL/TP zones as boxes that extend while the position is open.
Adds entry labels (“buy” / “sell”) for quick review in replays and optimizations.
Visual features
MA plot with selectable MA type (SMA/EMA/WMA/RMA) and length.
Risk/Reward boxes projected from entry (SL zone + TP zone).
Entry labels with configurable styling (label/flag) and colors.
Settings used for the published backtest (replication)
The performance screenshots included with this publication were generated using the following configuration:
Market & chart
Symbol : XAUUSD (FXCM feed)
Timeframe : 15 minutes
Date range : 02 Jan 2025 → 07 Nov 2025
Inputs (Strategy settings)
Source : Close
MA type : SMA
MA length : 10
Stop Loss : 1400 ticks
Take Profit : 2000 ticks
Time filter : enabled — 06:00 to 22:15 (exchange time)
Weekday filter : enabled — Monday to Sunday enabled
Direction : Long only
One trade per day : enabled
TradingView Strategy Properties used
Initial capital : 1,000 USD
Commission : 0.2 (as set in Strategy Properties)
Slippage : 1 tick
Backtest snapshot (as shown)
Net Profit : +727.41 USD (+72.74%)
Max Drawdown : 200.25 USD (12.71%)
Total Trades : 218
Win Rate : 52.29% (114 / 218)
Profit Factor : 1.485
Backtest context and limitations
Stop/limit fills may occur intrabar depending on TradingView’s execution model and bar magnifier assumptions.
Results vary by symbol, timeframe, broker feed, spreads, commissions, slippage, and session selection.
Past performance does not guarantee future results.
This script is not financial advice.
Originality and usefulness
While MA-cross strategies are a known concept, FluxMA Pro focuses on an execution-grade implementation designed for testing and disciplined deployment:
Execution guardrails : optional one-trade-per-day lock + direction filter to prevent over-trading and strategy drift.
Session handling done properly : time windows support overnight logic (no “broken window” edge cases).
MA modularity : SMA/EMA/WMA/RMA selection enables controlled experiments without rewriting logic.
Auditable visuals : SL/TP zones and labels allow fast review of behavior during replays, optimization, and multi-asset scans.

Heikin Ashi Color Flip StrategyManual HA calculation → no repainting
✔ Entry on first green after red
✔ Exit on first red after green
✔ process_orders_on_close = false → orders execute on next bar open
✔ Logic is clean and readable
How to make it your kind of strategy (next step)
Given your past preferences, the best upgrade is:
• Trade only when price > EMA 21
• Or only when SPY > EMA 50 & VIX < 20
• Exit on price close below EMA 21 (your preferred rule)
Consider the following to increase win rate and decrease drawdown:
• Add EMA-21 exit instead of HA red
• Add SPY/VIX regime filter
• Give you real QQQ daily backtest metrics
• Convert this into a scan/alert-only indicator
Disclaimer:
This indicator is provided for educational and informational purposes only and does not constitute financial, investment, or trading advice. The signals generated by this indicator are not guaranteed to be accurate or profitable. Past performance is not indicative of future results. Trading and investing involve substantial risk, and you should perform your own analysis and consult a qualified financial professional before making any trading decisions. The author is not responsible for any financial losses incurred from the use of this indicator.

HMA1//@version=5
strategy("黄金 HMA + SuperTrend 趋势增强策略", overlay=true, initial_capital=10000, default_qty_type=strategy.percent_of_equity, default_qty_value=10)
// --- 1. 输入参数 ---
// HMA 参数
hmaLen = input.int(55, "HMA 长度", minval=1, group="HMA 设置")
// SuperTrend 参数
stFactor = input.float(3.0, "SuperTrend 乘数", step=0.1, group="SuperTrend 设置")
stPeriod = input.int(10, "SuperTrend ATR 周期", group="SuperTrend 设置")
// 离场设置
useAtrSl = input.bool(true, "启用 ATR 动态止损", group="风险管理")
atrSlMult = input.float(2.0, "止损 ATR 倍数", step=0.1, group="风险管理")
// --- 2. 指标计算 ---
// 计算 HMA
hmaValue = ta.hma(close, hmaLen)
// 计算 SuperTrend
= ta.supertrend(stFactor, stPeriod)
// 计算 ATR(用于止损)
atr = ta.atr(14)
// --- 3. 绘图 ---
plot(hmaValue, "HMA 趋势线", color=hmaValue > hmaValue ? color.green : color.red, linewidth=2)
plot(stValue, "SuperTrend 线", color=stDirection < 0 ? color.new(color.teal, 0) : color.new(color.maroon, 0), linewidth=2)
// --- 4. 交易逻辑 ---
// 做多条件:
// 1. 价格在 HMA 之上 且 HMA 正在向上拐头
// 2. SuperTrend 变为看涨方向 (stDirection < 0)
longCondition = close > hmaValue and hmaValue > hmaValue and stDirection < 0
// 做空条件:
// 1. 价格在 HMA 之下 且 HMA 正在向下拐头
// 2. SuperTrend 变为看跌方向 (stDirection > 0)
shortCondition = close < hmaValue and hmaValue < hmaValue and stDirection > 0
// --- 5. 执行与止损逻辑 ---
var float longStop = na
var float shortStop = na
// 入场逻辑
if (longCondition)
longStop := close - (atr * atrSlMult)
strategy.entry("Long", strategy.long, comment="HMA+ST 多")
if (shortCondition)
shortStop := close + (atr * atrSlMult)
strategy.entry("Short", strategy.short, comment="HMA+ST 空")
// 离场逻辑:当 SuperTrend 反转或触及 ATR 止损时离场
if (strategy.position_size > 0)
strategy.exit("Exit Long", "Long", stop=longStop, limit=na, when=stDirection > 0, comment="多单离场")
if (strategy.position_size < 0)
strategy.exit("Exit Short", "Short", stop=shortStop, limit=na, when=stDirection < 0, comment="空单离场")
// 填充背景色以示趋势
fill(plot(stValue), plot(open > close ? open : close), color = stDirection < 0 ? color.new(color.green, 90) : color.new(color.red, 90))

Opening Range Breakout & Targets [Strategy] (Fixed + Alerts)This strategy backtests a classic Opening Range Breakout approach using a configurable opening range window (time-based OR or custom session). Once the opening range is completed, the strategy waits for price to break above ORH (Opening Range High) or below ORL (Opening Range Low) and enters in the direction of the breakout.
Targets are derived directly from the opening range width:
OR Width = ORH − ORL
Target Step = OR Width × Target %
Take-profit is placed at the selected Target # (T1, T2, etc.)
An optional Daily Bias filter can be enabled to reduce false breakouts by comparing today’s opening range midpoint (ORM) to the previous session’s ORM. When bias is active, breakouts against the bias can require a stronger confirmation (break beyond the first target step).
Risk management is configurable via multiple stop options:
Stop at Opposite OR
Stop at OR Midpoint
Stop at 1× Target Step
Or disable stops for custom management
Includes support for:
Long/Short/Both modes
One trade per session option
Optional exit on opposite breakout
Separate alert conditions (when used with the companion indicator)
Note: This is a backtesting tool. Always validate results across symbols/timeframes and account for slippage/commissions before live use.


Smart Money Bot [MTF Confluence Edition]Uses multi-time frame analysis and supply and demand strategy.
Best used when swing trading.

USOIL BOS Retest Strategy 2.0 This is generating 4.73% return nothing wow but will form the base of my trading engine

Simple ICT Sweep + FVG (LuxAlgo Swings FIXED)something i created if anyone can improve it or change for better visual

ETH UU Reversion Strategy Strategy Overview
The "ETH UU Reversion Strategy" is a sophisticated mean-reversion trading system designed to capture price reversals at standard deviation extremes. Unlike typical strategies that enter trades immediately at market price, this script employs a proprietary **Limit Order Execution Mechanism** combined with volatility filtering to optimize entry prices and reduce slippage.
Originality & Key Features
This script addresses the common pitfalls of standard Bollinger Band strategies by introducing advanced order management logic:
1. Limit Order Execution:** Instead of market orders, the strategy calculates an optimal entry price based on ATR offsets. This allows traders to capitalize on "wicks" and secure better risk-reward ratios.
2. Smart Timeout Logic:To prevent "catching a falling knife," pending orders are automatically cancelled if not filled within a customizable number of bars (default: 15). This ensures orders do not remain active when market structure shifts.
3. Dynamic Risk Recalculation:** Stop Loss (SL) and Take Profit (TP) levels are recalculated at the exact moment of execution using the real-time ATR, ensuring risk parameters adapt to current market volatility.
How to Use
1. Setup: Apply the strategy to ETH/USDT (or other crypto pairs) on 15m or 1h timeframes.
2. Configuration:
* Adjust `BB Length` and `RSI Length` to fit your timeframe.
* Set `Order Timeout` to define how long a pending order should remain active.
* Toggle `Use ADX Filter` to avoid trading against strong trends.
3. *Visuals: The chart displays distinct labels for pending orders (Gray), active entries (Blue/Red), and cancellations, providing full transparency of the strategy's logic.
Risk Disclaimer
This script is for educational and quantitative analysis purposes only. Past performance regarding backtesting or live trading does not guarantee future results. Cryptocurrency trading involves high risk and high volatility. Please use proper risk management and trade at your own discretion.
-------------------------------------------------------------
Chinese Translation (中文说明)
策略概述
“ETH UU 均值回归策略”是一个旨在捕捉标准差极端位置价格反转的交易系统。与立即以市价入场的典型策略不同,本策略采用独特的**挂单执行机制**结合波动率过滤,以优化入场价格并减少滑点。
原创性与核心功能
本脚本通过引入高级订单管理逻辑,解决了普通布林带策略的常见缺陷:
1. 挂单交易模式: 策略不使用市价单,而是根据 ATR 偏移计算最佳入场价(Limit Orders)。这允许交易者捕捉K线的“影线”,获得更好的盈亏比。
2. 智能超时撤单: 为了防止“接飞刀”,如果挂单在指定K线数内(默认15根)未成交,系统会自动撤单。这确保了当市场结构发生变化时,旧的挂单不会被错误触发。
3. 动态风控重算: 止损和止盈在成交的瞬间根据实时 ATR 重新计算,确保风控参数始终适应当前的市场波动率。
风险提示
本脚本仅供教育和量化分析使用。回测或实盘的过往表现并不预示未来结果。加密货币交易具有极高的风险和波动性,请务必做好仓位管理,并自行承担使用本策略的风险。

Multi-MA + RSI Pullback Strategy (Jordan)1️⃣ Strategy logic I’ll code
From your screenshots:
Indicators
• EMAs: 600 / 200 / 100 / 50
• RSI: length 6, levels 80 / 20
Rules (simplified so a script can handle them):
• Use a higher-timeframe trend filter (15m or 1h) using the EMAs.
• Take entries on the chart timeframe (you can use 1m or 5m).
• Long:
• Higher-TF trend is up.
• Price is pulling back into a zone (between 50 EMA and 100 EMA on the entry timeframe – this approximates your 50–61% retrace).
• RSI crosses below 20 (oversold).
• Short:
• Higher-TF trend is down.
• Price pulls back between 50 & 100 EMAs.
• RSI crosses above 80 (overbought).
• Exits: ATR-based stop + take-profit with adjustable R:R (2:1 or 3:1).
• Max 4 trades per day.
News filter & “only trade gold” you handle manually (run it on XAUUSD and avoid news times yourself – TradingView can’t read the economic calendar from code).

Trend Following $ZEC - Multi-Timeframe Structure Filter + Revers# Trend Following CRYPTOCAP:ZEC - Strategy Guide
## 📊 Strategy Overview
Trend Following CRYPTOCAP:ZEC is an enhanced Turtle Trading system designed for cryptocurrency spot trading, combining Donchian Channel breakouts, multi-timeframe structure filtering, and ATR-based dynamic risk management for both long and short positions.
---
## 🎯 Core Features
1. Multi-Timeframe Structure Filtering
- Uses Swing High/Low to identify market structure
- Customizable structure timeframe (default: 1 minute)
- Only enters trades in the direction of the trend, avoiding counter-trend positions
2. Reverse Signal Exit
- No fixed stop-loss or fixed-period exits
- Exits only when a reverse entry signal triggers
- Maximizes trend profits, reduces premature exits
3. ATR Dynamic Pyramiding
- Adds positions when price moves 0.5 ATR in favorable direction
- Supports up to 2 units maximum (adjustable)
- Pyramid scaling to enhance profitability
4. Complete Risk Management
- Fixed position size (5000 USD per unit)
- Commission fee 0.06% (Binance spot rate)
- Initial capital 10,000 USD
---
## 📈 Trading Logic
Entry Conditions
✅ Long Entry:
- Close price breaks above 20-period high
- Structure trend is bullish (price breaks above Swing High)
✅ Short Entry:
- Close price breaks below 20-period low
- Structure trend is bearish (price breaks below Swing Low)
Add Position Conditions
- Long: Price rises ≥ 0.5 ATR
- Short: Price falls ≥ 0.5 ATR
- Maximum 2 units including initial entry
Exit Conditions
- Long Exit: When short entry signal triggers (price breaks 20-period low + structure turns bearish)
- Short Exit: When long entry signal triggers (price breaks 20-period high + structure turns bullish)
---
## ⚙️ Parameter Settings
Channel Settings
- Entry Channel Period: 20 (Donchian Channel breakout period)
- Exit Channel Period: 10 (reserved parameter, actually uses reverse signal exit)
ATR Settings
- ATR Period: 20
- Stop Loss ATR Multiplier: 2.0 (reserved parameter)
- Add Position ATR Multiplier: 0.5
Structure Filter
- Swing Length: 160 (Swing High/Low calculation period)
- Structure Timeframe: 1 minute (can change to 5/15/60, etc.)
Position Management
- Maximum Units: 2 (including initial entry)
- Capital Per Unit: 5000 USD
---
## 🎨 Visualization Features
Background Colors
- Light Green: Bullish structure
- Light Red: Bearish structure
- Dark Green: Long entry
- Dark Red: Short entry
Optional Display (Default: OFF)
- Entry/exit channel lines
- Structure high/low lines
- ATR stop-loss line
- Next add position indicator
- Entry/exit labels
---
## 📱 Alert Message Format
Strategy sends notifications on entry/exit with the following format:
- Entry: `1m Long EP:428.26`
- Add Position: `15m Add Long 2/2 EP:429.50`
- Exit: `1m Close Long Reverse Signal`
Where:
- `1m`/`15m` = Current chart timeframe
- `EP` = Entry Price
---
## 💰 Backtest Settings
Capital Allocation
- Initial Capital: 10,000 USD
- Per Entry: 5,000 USD (split into 2 entries)
- Leverage: 0x (spot trading)
Trading Costs
- Commission: 0.06% (Binance spot VIP0)
- Slippage: 0
---
## 🎯 Use Cases
✅ Best Scenarios
- Trending markets
- Moderate volatility assets
- 1-minute to 4-hour timeframes
⚠️ Not Suitable For
- Highly volatile choppy markets
- Low liquidity small-cap coins
- Extreme market conditions (black swan events)
---
## 📊 Usage Recommendations
Timeframe Suggestions
| Timeframe | Trading Style | Suggested Parameter Adjustment |
|-----------|--------------|-------------------------------|
| 1-5 min | Scalping | Swing Length 100-160 |
| 15-30 min | Short-term | Swing Length 50-100 |
| 1-4 hour | Swing Trading | Swing Length 20-50 |
Optimization Tips
1. Adjust swing length based on backtest results
2. Different coins may require different parameters
3. Recommend backtesting on 1-minute chart first before live trading
4. Enable labels to observe entry/exit points
---
## ⚠️ Risk Disclaimer
1. Past Performance Does Not Guarantee Future Results
- Backtest data is for reference only
- Live trading may be affected by slippage, delays, etc.
2. Market Condition Changes
- Strategy performs better in trending markets
- May experience frequent stops in ranging markets
3. Capital Management
- Do not invest more than you can afford to lose
- Recommend setting total capital stop-loss threshold
4. Commission Impact
- Frequent trading accumulates commission fees
- Recommend using exchange discounts (BNB fee reduction, etc.)
---
## 🔧 Troubleshooting
Q: No entry signals?
A: Check if structure filter is too strict, adjust swing length or timeframe
Q: Too many labels displayed?
A: Turn off "Show Labels" option in settings
Q: Poor backtest performance?
A:
1. Check if the coin is suitable for trend-following strategies
2. Adjust parameters (swing length, channel period)
3. Try different timeframes
Q: How to set alerts?
A:
1. Click "Alert" in top-right corner of chart
2. Condition: Select "Strategy - Trend Following CRYPTOCAP:ZEC "
3. Choose "Order filled"
4. Set notification method (Webhook/Email/App)
---
## 📞 Contact Information
Strategy Name: Trend Following CRYPTOCAP:ZEC
Version: v1.0
Pine Script Version: v6
Last Updated: December 2025
---
## 📄 Copyright Notice
This strategy is for educational and research purposes only.
All risks of using this strategy for live trading are borne by the user.
Commercial use without authorization is prohibited.
---
## 🎓 Learning Resources
To understand the strategy principles in depth, recommended reading:
- "The Complete TurtleTrader" - Curtis Faith
- "Trend Following" - Michael Covel
- TradingView Pine Script Official Documentation
---
Happy Trading! Remember to manage your risk 📈

Strategia S&P 500 vs US10Y YieldThis strategy explores the macroeconomic relationship between the equity market (S&P 500) and the debt market (10-Year Treasury Yield). Historically, rapid spikes in bond yields often exert downward pressure on equity valuations, leading to corrections or bear markets.
The goal of this strategy is capital preservation. It attempts to switch to cash when yields are rising too aggressively and re-enter the stock market when the bond market stabilizes.

Keltner Channels Strategy NewThe strategy is chenging the same as an original copy, but this one is for tests, so I will publish it and check results

2 Dip/Tepe + Destek/Direnç + Tek Sinyal Stratejisi⭐ A Brief Summary of What the Strategy Does
🎯 1) Market analysis is being released (bottom-top analysis)
It automatically finds pivot bottoms and pivot tops on the strategic chart. Then:
If the bottoms are rising (HL – High Low): the trend is upward
If the tops are falling (LH – Lower High): the trend is downward
it interprets this.
🎯 2) Support and resistance lines are formed
Last pivot top = resistance line
Last pivot bottom = support line
These lines are automatically drawn on the chart.
🎯 3) Breakout is expected according to the trend structure
For LONG:
The last two bottoms will be rising bottoms
The price will rise above the last resistance line
This gives a single LONG signal.
For SHORT:
The last two peaks will be falling peaks
The price will fall below the support line
This gives a single SHORT signal.

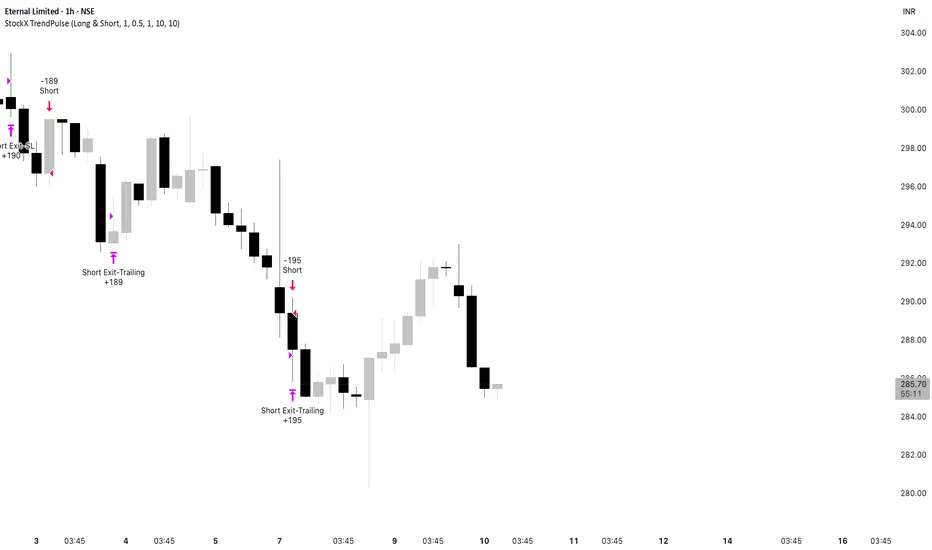
StockX TrendPulseThis is one of our premium, high-grade trading scripts built specifically for highly liquid stocks. It’s a fully automated system designed to deliver consistent performance, adapt to changing market conditions, and maintain strict risk control. With enhanced trade management and built-in performance tracking, it provides a reliable, disciplined framework for stock traders who demand precision and robustness.
StockX TrendPulse removes emotion from trading decisions and provides complete transparency through detailed performance metrics. The strategy is fully backtested and ready for live deployment.
Ready to Trade Like a Pro?
StockX TrendPulse is a premium strategy with limited availability.
Email brijamohanjha@gmail.com
to request access and pricing.
YCGH Crypto ultimate Breakout StrategyAdvanced Momentum Breakout Strategy - Optimized for crypto markets, proven effective on equities
Core Features:
Multi-layered signal generation combining volatility expansion and momentum confirmation
Adaptive risk management with dynamic stops, profit targets, and trailing mechanisms
Systematic position sizing with configurable leverage (designed for perpetual/margin trading)
Volatility regime filters to avoid false breakouts during low-momentum periods
Optional trend alignment for directional bias confirmation
Comprehensive backtesting with realistic slippage and commission modeling
Daily drawdown limits for capital preservation
Performance:
Applicable across multiple timeframes (1H, 4H, Daily)
Works on both spot and derivatives markets
Long and short position capability
Interested in using this strategy? This is a paid service. For access to the complete script and implementation support, email: brijamohanjha@gmail.com
