高频策略优化版-空头Open Condition Reversal: Change the condition of the TEMA fast line above the slow line to the condition of the fast line below the slow line RSI condition from " buy above the threshold " to " short below the threshold ", and adjust the default threshold from 30 to 70 (more suitable for shorting overbought area) moving average direction judgment from up to down stop-loss direction adjustment: Short stop-loss Settings above the entry price (entry price * (1 + i _ sl) ) Short stop-loss set below the entry price (entry price * (1-tp) Tracking stop-loss level adjusted to below the entry price MACD logic adjustment: Preferred use of the bearish pattern as a short signal bullish pattern for closing risk management: Maintained a dynamic stop-loss mechanism, adjusted to protect the market from the bottom of the visual stop-loss strategy: The visual marking of the ACD energy column is convenient for monitoring signals to be fully tested before use, especially for adjusting RSI thresholds and stop-loss parameters to suit the characteristics of specific trading varieties.
ابحث في النصوص البرمجية عن "candle"

AstraAlgo BacktesterOVERVIEW
The AstraAlgo Backtester allows traders to simulate and evaluate trading strategies directly on TradingView. By simulating trades across different timeframes and markets, it provides valuable insights into win rates, drawdowns, and overall strategy effectiveness.
SIGNAL MODES
Signal Modes generate proprietary trade signals based on live price data. Users can choose between Off, Basic, Advanced, or Custom modes to evaluate strategies under different conditions and refine their trading approach.
ADJUSTABLE BACKTESTING
Parameters for historical simulations can be customized to test different market conditions and trading scenarios. This allows traders to measure strategy performance, including win rate, profit/loss, and risk/reward ratios, helping refine and optimize strategies before live execution.
BAR COLORING
Bar Coloring highlights bullish and bearish bars on historical charts, allowing traders to visually assess trend direction and trade outcomes during backtesting. This makes it easier to analyze momentum and strategy effectiveness at a glance.
ASTRA CLOUD
Astra Cloud overlays dynamic support and resistance levels on live price data. These zones adapt automatically to past market movements, helping traders identify areas where trades would have reacted, aiding strategy evaluation and optimization.

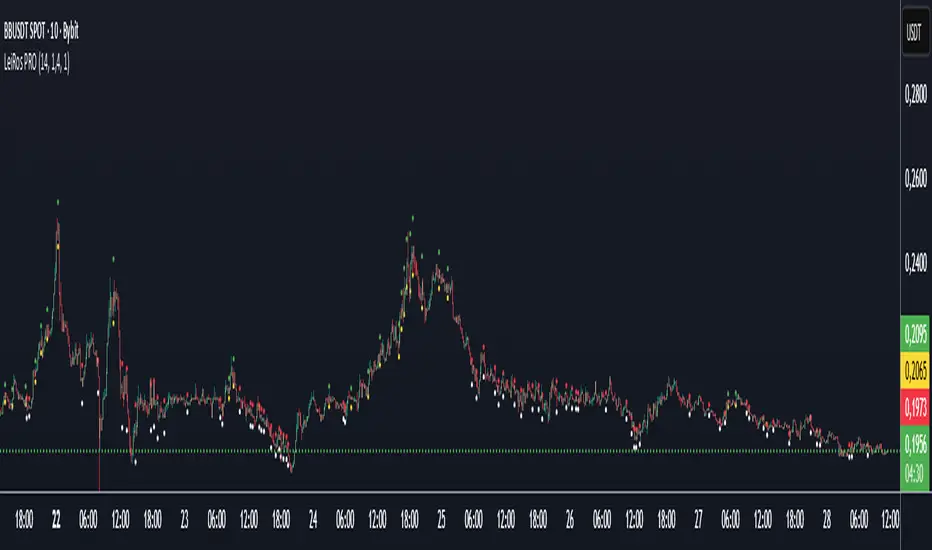
LeiRos PRO — Smart Entry & Target System⚡ Short Description
LeiRos PRO is more than an indicator.
It is an intelligent next-generation analytical tool designed to visualize the true trajectory of market movement.
It reveals the hidden mechanics of price — the attraction points where liquidity is collected and extremes are updated before reversal.
🟢 During bullish phases, the market often reaches for previous highs.
Green points of LeiRos PRO highlight the levels price is most likely to reach before completing the impulse.
⚪ In bearish phases, the market tends to sweep uncollected lows.
White points indicate where stop hunts and local reversals commonly occur.
Built upon the interaction of EMA20 / EMA50 / EMA200, volatility analysis and momentum strength,
LeiRos PRO doesn’t just mark levels — it displays realistic targets price is drawn to with high probability.
📈 The higher the timeframe, the clearer and more stable the picture becomes.
On H1 and above, the plotted points act as reference zones for those seeking structured, logical price behavior rather than noise.
💡 The main advantage of LeiRos PRO is clarity — it removes guessing.
You see where price tends to move and where impulses are likely to end.
This is not theory — it’s market behavior visualized.
📘 Full Description
LeiRos PRO is a proprietary analytical tool created to precisely visualize directional bias, target zones, and protective stop areas.
It combines trend structure, volatility, and price action logic — helping traders see the key areas where the market’s intent becomes clear.
📈 Core Features:
Automatic trend detection: analyzes direction using EMA20, EMA50, and EMA200 to define the dominant side of the market.
Target visualization (Take-Profit): marks potential liquidity-grab zones where price often completes its move.
Protective stop zones (Stop-Loss): highlights areas where logical stops can be placed based on current structure.
Adaptive to timeframe: higher timeframes provide cleaner and more reliable reference points, suitable for short-, medium-, and long-term analysis.
⚙️ Recommended Use:
As a visual analytical tool for confirming trade direction.
On lower TFs — for identifying intraday entry points and potential objectives.
On higher TFs (H1 and above) — for building overall market context and defining major targets.
Marked points are not entry signals,
but contextual reference zones showing potential areas of liquidity collection or impulse completion.
⚠️ Disclaimer:
LeiRos PRO is an analytical and visualization tool, not a trading signal or guarantee of results.
All trading decisions, entries, exits, and risk management remain solely the responsibility of the user.
✳️ Note:
This indicator is part of the LeiRos Project, which develops intelligent systems for advanced market analysis and visualization.
Displayed levels adapt dynamically to volatility and timeframe, providing a flexible view of current market structure.
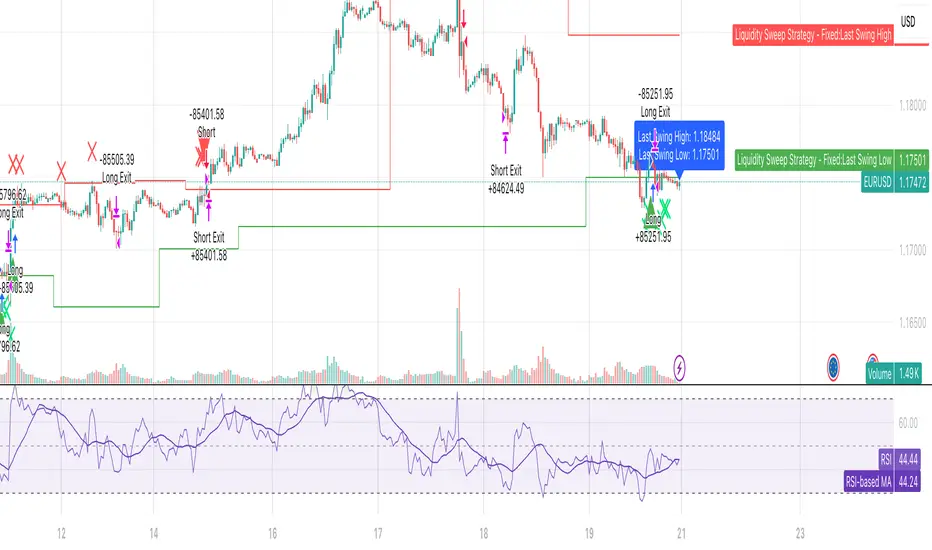
Liquidity SweeperStrategy Overview
This Pine Script implements a Liquidity Sweep Trading Strategy, a sophisticated approach that capitalizes on market manipulation tactics commonly used by institutional traders. The strategy identifies when price "sweeps" above recent swing highs or below swing lows to trigger stop losses and grab liquidity, then quickly reverses direction - creating high-probability trading opportunities.
Core Concept: What is a Liquidity Sweep?
A liquidity sweep occurs when:
Price breaks above a swing high (or below a swing low) to trigger retail stop losses
Institutional players absorb this liquidity at favorable prices
Price quickly reverses back into the previous range
This creates a "fake breakout" or "stop hunt" pattern
The strategy exploits these manipulative moves by entering trades in the direction of the reversal.
How the Strategy Works
1. Swing Point Detection
Uses a lookback period (default: 20 bars) to identify significant swing highs and lows
Employs proper pivot point detection using ta.highestbars() and ta.lowestbars()
Only considers confirmed swing points (not just recent highs/lows)
2. Liquidity Sweep Identification
High Sweep (Short Setup):
Price moves above the last swing high (triggering buy stops)
Same bar closes back below the swing high (showing rejection)
Low Sweep (Long Setup):
Price moves below the last swing low (triggering sell stops)
Same bar closes back above the swing low (showing support)
3. Confirmation Process
Requires price to stay within the swept range for a specified number of bars (default: 3)
This confirms the sweep was genuine and not just normal volatility
Prevents false signals and improves trade quality
4. Entry Logic
Long Entries: Triggered after confirmed low sweeps
Short Entries: Triggered after confirmed high sweeps
5. Risk Management
Stop Loss: Placed at a multiple of ATR (default: 1.5x) from entry price
Take Profit: Risk/Reward ratio based (default: 2:1)
Position Sizing: 10% of equity per trade (configurable)
Red X-crosses: High sweeps detected
Green X-crosses: Low sweeps detected
Red triangles (down): Short entry signals
Green triangles (up): Long entry signals
Horizontal lines: Current swing high/low levels
Info label: Shows last detected swing levels
Optimal Conditions:
Timeframes: 1H, 4H, and Daily work best
Market Conditions: Ranging and trending markets both suitable
Volatility: Moderate to high volatility preferred
Session Times: Most effective during active trading sessions
Strengths:
✅ Exploits institutional manipulation tactics
✅ Clear entry/exit rules with defined risk
✅ Works across multiple asset classes
✅ Includes proper confirmation to reduce false signals
✅ Visual clarity for manual verification
✅ Reasonable risk/reward parameters
Limitations:
⚠️ Requires patience - not a high-frequency strategy
⚠️ Market dependent - fewer signals in low volatility periods
⚠️ Needs sufficient lookback data for swing identification
⚠️ May have drawdown periods during strong trending moves
⚠️ Requires understanding of market structure concepts
Best Practices for Users
Optimization Tips:
Adjust lookback period based on timeframe (shorter for lower TFs)
Test different confirmation periods for your market
Consider market session times when backtesting
Use alongside volume analysis for additional confirmation
Risk Management:
Never risk more than 2-3% per trade of total capital
Consider reducing position size during high-impact news
Monitor correlation if trading multiple pairs simultaneously
Use additional filters (trend, support/resistance) for confluence
Backtesting Recommendations:
Test on at least 6 months of historical data
Include different market conditions (trending, ranging, volatile)
Consider transaction costs and slippage in results
Forward test on demo before live implementation
Expected Results
Based on typical liquidity sweep strategy performance:
Disclaimer
This strategy is based on market structure analysis and institutional trading behavior patterns. Past performance doesn't guarantee future results. Users should:
Thoroughly backtest before live trading
Start with small position sizes
Understand the underlying concepts before implementation
Consider combining with other analysis methods
Always use proper risk management
The strategy works best when traders understand the psychological and structural elements of liquidity sweeps rather than just following signals blindly.
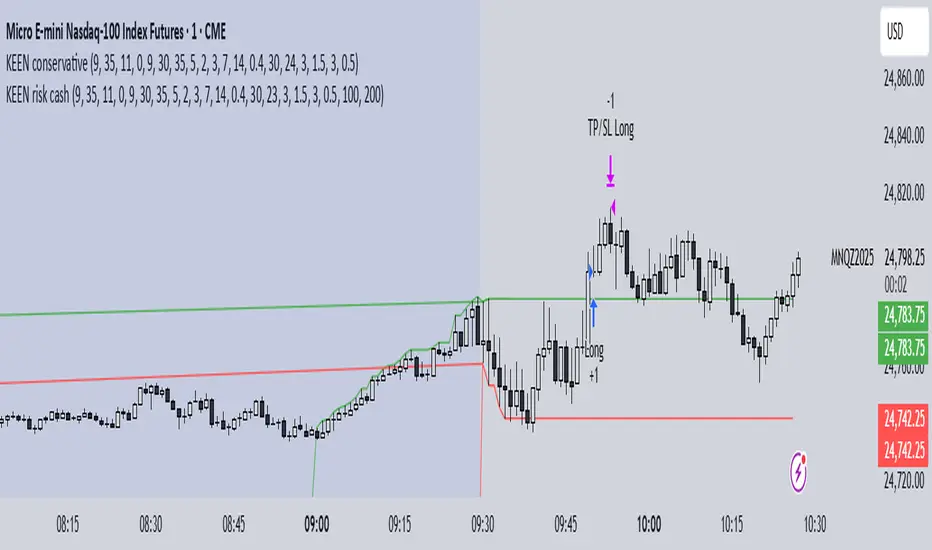
KEEN risk cashthis strategy is based on orb 5 minutes and is set off for risk per trade and take profit.
try yourself and let me know how it works
BSL/SSL Sweep + FVG Strategy Jobin (c) The New York ATM Model is a structured intraday strategy designed to capture algorithmic stop-hunts and reversals during the New York session open. It focuses on liquidity sweeps—either Buy-Side or Sell-Side—followed by a confirmation using Fair Value Gaps (FVGs).

Structure Strategycreated to spot key area needed to take valid trades in most market conditions. use beside RSI MACD

C25_EngulfingEngulfing Testing Script. Best used for 5m MNQ futures. Can work on others with tweaks to parameters

7Lots v27Lots strategy
The strategy is a counter-trend with a return to the moving average. Based on the DCA strategy, but greatly simplified to 7 lots (limit orders) and using the default martingale x2.5
Strategy description
Two moving averages are used. The first MA can be used as a filter for opening a position and also closing if the second MA is disabled. If both are enabled, then the position is closed by the second MA, and the first is used as a filter. There is also a separate take profit and if the price does not reach it, the position will be closed when returning to the MA, which will act as a stop loss, but the risk of liquidation is still present since the strategy does not have a regular classic stop loss.
Main parameters
TP & SL - selection of closing a position only by MA or take profit + MA. If only MA is selected, the strategy ignores the take profit value and always closes the position by MA.
MA settings
MA length from 1 to 200
Sliding type ALMA, SMA, EMA, VWMA, WMA, RMA
MA data - Open, High, Low, Close, HL2, HL3, OHLC4, OC2
MA shift in %. The MA shift is set in % above or below the current prices. For the First MA, this function allows you to use it as a filter for opening a position. For example, if you specify a shift much lower, for example -1% or -2%, then there will be less noise for opening a position, but this affects the number of transactions.
DCA group settings
Take profit %. Set the take profit as usual, but if the price does not reach the take profit, then the closing will occur by MA when the price returns to its values.
Take profit from. There is a choice of take profit from the average position, or by closing the previous bar. The latter increases the profit factor, but also increases the risk of liquidation if the strategy is used on perpetual contracts or futures.
Position Entry % - specifies the condition for opening a position. 0% - opening will occur immediately. 2% - opening will occur when the price falls 2% below the bar closing if the Long mode is set. If Short, then vice versa.
Grid Scale - classic progressive grid step
Next comes the setup of lots as a percentage of the deposit. Simply specify how many percent of each lot will be used from the total deposit. By default, a percentage for each lot is already allocated according to Martingale with a multiplier of x2.5, but you can calculate your own. You can specify 0, then the lot will be disabled.
Leverage. By default, 1.
Extra lot. This is the 7th lot that I decided to allocate separately from the main grid, since it is not always really needed. And it is calculated from the last lot of the grid. You can set it to how much lower percentage of the last lot to set it for and also what percentage of the deposit it will use. If you trade futures, then this lot, as an auxiliary one, can greatly average the position in case of strong volatility in the market.
Next, you can specify the start and end dates of transactions.
The table displays the total percentage of the deposit involved in trading at the moment. By default, all lots and leverage are set to 100% deposit load. The table also shows the number of transactions of the last 5-6 lots and extra, so that you can understand how many of them there were throughout the history of trading and possibly draw some conclusions for yourself. Especially useful for extra lots. Max Historical Drawdown (%) shows the historical price drop at the moment from the average open position. This will make it possible to analyze what leverage this strategy could withstand over the entire trading history. The date of this drop is also indicated.
For novice traders, it is recommended to use only on spot without the risk of liquidation. It is also best to use large time frames to see the whole picture, but you can also use a minute chart, there are no restrictions, everything is in your hands.
Tips. If you use minute charts, it is better to greatly increase the length of the MA from 20 and above. Hourly charts from 1-7. It is better to set up on spot and if you need futures, then use the same settings from spot, but with correction for futures. This strategy does not work well in Short, but shows excellent results for Long even when the market falls. When selecting settings, take into account sharp market fluctuations, Max Historical Drawdown (%) will show you this information in the table. You need to set up from the first MA, when you set up for the best result, then turn on the second MA and transfer the settings of the first MA to the second. Then fine-tune both MAs. The results can increase significantly, but this is not always the case. Sometimes just one MA is enough
The strategy is paid, tested with my own experience and money since 2022. Own development for opening a position.

Ajay Nayak - EMA ATR Trailinge strategy RSI aur RSI ke SMA ke crossover par CALL aur PUT signal generate karti hai.
Saath me ATR based stoploss aur crossover target bhi diya gaya hai.
Algo trading ke liye useful hai.

swapstrategy-Reversal StrategyGenerate buy and sell signals and reverses position when chart turn buy or sell side

Rev Smart Pivot V5.0 by SJKimRev Smart Pivot V5.0 by SJKim
Rev Smart Pivot V5.0 by SJKim
Rev Smart Pivot V5.0 by SJKim

fero.Laplace + MA TP/SL Strategy (10m)//@version=5Labne is a good technique for generating logic or theory.

fero.karma algoUnderstand what stocks, currencies (forex), and cryptocurrencies are. Learn common terms like bull market, bear market, volatility, and liquidity.
Study Analysis: There are two main types of analysis:

Intraday Alpha Pro - ORB + Trend/MomentumOverview
This is a pure intraday trading strategy designed for active traders seeking to capitalize on short-term price movements using two complementary modules: Opening Range Breakout (ORB) and Trend/Momentum. The strategy operates strictly within a user-defined trading session, automatically flattening all positions at session end to avoid overnight carry. It employs a points-based exit system with a trailing stop that activates only after the target is reached, ensuring disciplined risk management. Optional Martingale position sizing is included for users who prefer aggressive scaling after losses.Key Features Pure Intraday, No Carry: Trades are confined to a user-defined session (default: 9:15 AM–3:25 PM, Monday–Sunday). All positions are closed at session end.
Non-Repainting: Entries are evaluated only on confirmed bar closes (barstate.isconfirmed), ensuring no lookahead or repainting.
Dual Signal Modules: Opening Range Breakout (ORB): Captures breakouts above/below the high/low of a user-defined opening range (default: 9:15 AM–9:30 AM).
Trend/Momentum: Combines EMA (9/21) crossovers, RSI filters, volume confirmation, and an optional 200-period MA trend filter for robust trend-following signals.
Points-Based Exits: Uses fixed stop-loss (slPoints, default 16 points) and take-profit (tpPoints, default 32 points) distances. Once the take-profit level is reached, a trailing stop (trailDistPts, default 10 points) activates, ratcheting monotonically to lock in gains.
Martingale Sizing (Optional): Allows position size increases after losses (up to maxQtyInput) with a reset option after wins.
Cooldown Period: Prevents immediate re-entries after exits using a configurable cooldown (cooldownBars).
Flexible Inputs: Toggle long/short entries, enable/disable ORB or Trend/Momentum modules, and customize all parameters (e.g., MA lengths, RSI thresholds, volume multiplier).
Visuals & Alerts: Plots ORB high/low lines and moving averages (9, 21, 200). Includes alerts for long/short entries and end-of-day flattening.
How It Works Session Management: Trades only within the specified tradeSes (default: 9:15 AM–3:25 PM). The ORB module uses a separate orbSes (default: 9:15 AM–9:30 AM) to calculate breakout levels. Positions are closed automatically at session end.
Entry Conditions: ORB: Long when price closes above the ORB high after the ORB session ends; short when price closes below the ORB low.
Trend/Momentum: Long on fast MA (default EMA 9) crossing above slow MA (default EMA 21), with RSI above rsiBuy (default 55), volume exceeding volMult (default 1.5x prior bar), and price above the 200-period MA (if enabled). Shorts use the inverse.
Exit Logic: Stop-loss is set at entry price ± slPoints.
Take-profit is monitored using a running high/low since entry. Once price moves tpPoints in profit, the stop trails at trailDistPts behind the current price, adjusting only in the favorable direction (never loosening).
Exits use strategy.exit with stop only (no limit orders).
Position Sizing: Default size is baseQtyInput (minimum 1 contract). With useMartingale enabled, size increases by martingaleFactor after a loss, capped at maxQtyInput. If resetOnWin is true, size resets to baseQtyInput after a winning trade.
Cooldown: After an exit, no new trades are allowed for cooldownBars to prevent overtrading.
Futures-Safe Volume: Volume filter accommodates markets with missing or zero volume data (e.g., futures), ensuring signals aren’t blocked unnecessarily.
Inputs Trading Session: tradeSes (e.g., "0915-1525:1234567") and orbSes (e.g., "0915-0930:1234567").
Toggles: enableLong, enableShort, useORB, useTrendMom, useTrendFilter (200-MA).
Trend/Momentum: maType (EMA/SMA), fastLen (9), slowLen (21), trendLen (200), rsiLen (14), rsiBuy (55), rsiSell (45), volMult (1.5).
Exits: slPoints (16), tpPoints (32), trailDistPts (10).
Martingale: useMartingale, baseQtyInput, maxQtyInput, martingaleFactor, resetOnWin.
Cooldown: cooldownBars (1).
Legacy (Ignored): tp1RR, tp2RR, tp3RR, tp1Pct, tp2Pct, tp3Pct, stepTrail for backward compatibility.
Usage Notes Best suited for liquid, intraday markets (e.g., futures like ES, NQ, or forex pairs).
Adjust slPoints, tpPoints, and trailDistPts to match instrument volatility.
Use useMartingale cautiously, as it increases risk after losses.
Ensure tradeSes and orbSes align with your market’s trading hours.
Alerts can be set for long/short entries and EOD flattening.
The strategy avoids lookahead and repainting, ensuring reliability in live trading.
Risk Warning
Trading involves significant risk. Backtest thoroughly and use appropriate risk management. The Martingale option can amplify losses if not carefully monitored. Past performance is not indicative of future results.

FVG Ultra Assertive - Individual Filters (mtbr)FVG Ultra Assertive - Individual Filters (mtbr)
What this script offers:
This strategy detects and highlights FVGs (Fair Value Gaps) on the chart, providing traders with a visual and systematic approach to identify potential price inefficiencies. The script plots bullish and bearish FVG zones using customizable boxes and labels, allowing users to easily spot high-probability trading areas. In addition, it opens and closes simulated trades based on the detected FVGs, enabling full backtesting and strategy performance evaluation. It integrates multiple independent filters to validate the strength of each FVG signal before entering a trade.
How it works:
The script identifies:
Bullish FVGs when the current low is higher than the high of two bars ago.
Bearish FVGs when the current high is lower than the low of two bars ago.
Once an FVG is detected, it applies three optional independent filters:
GAP/ATR Filter:
Measures the FVG size relative to the Average True Range (ATR). Only gaps exceeding a user-defined multiple of ATR are considered valid.
Support/Resistance (S/R) Filter:
Uses pivot points to check if the FVG overlaps with recent high/low pivot levels within a tolerance percentage. This ensures the gap aligns with meaningful market levels.
Stochastic Filter:
Applies a stochastic oscillator to confirm momentum. Bullish FVGs are validated when stochastic values are oversold, and bearish FVGs when overbought.
After passing the selected filters, the strategy opens trades:
LONG FVG for bullish signals (buy)
SHORT FVG for bearish signals (sell)
The strategy automatically closes positions when an opposite signal appears, generating a backtest report with trades, profits, and statistics. The final bullish or bearish FVG signals are plotted as colored boxes on the chart with labels “BULL FVG” or “BEAR FVG” for immediate visual reference.
How to configure it for use:
Use GAP/ATR Filter: Enable or disable the ATR-based filter and adjust the ATR period (ATR Length) and minimum gap multiplier (Minimum Gap x ATR).
Use S/R Filter: Enable or disable the pivot-based S/R filter. Configure the pivot lookback periods (Pivot Left and Pivot Right) and the tolerance percentage (Gap Tolerance %).
Use Stochastic Filter: Enable or disable stochastic confirmation. Adjust the K and D lengths (Stoch K Length and Stoch D Length) and the overbought/oversold thresholds (Stoch Overbought and Stoch Oversold).
Colors: Customize the colors for bullish and bearish FVGs (FVG Bull and FVG Bear) to match your chart preferences.
Usage Tips:
Apply this strategy to any timeframe; shorter timeframes generate more frequent FVGs, while higher timeframes highlight stronger gaps.
Combine FVG signals with other technical analysis tools for better trade confirmation.
Use the box and label visualization to quickly scan charts for trade opportunities without cluttering the chart.
The strategy’s trades (LONG and SHORT) provide backtesting results and performance statistics for each signal.

Advanced Supertrend ADX Strategy with Highest ReturnOverview
This sophisticated trading strategy combines the proven Supertrend indicator with advanced momentum filters and trend strength analysis to identify high-probability long entries in trending markets.
Key Features
✅ Supertrend-Based Signals: Uses optimized ATR calculations for reliable trend detection
✅ Advanced Momentum Filtering: Multiple proprietary momentum filters ensure entry quality
✅ Trend Strength Validation: ADX-based confirmation prevents false signals in weak trends
✅ Intelligent Risk Management: Dynamic stop-loss system based on price action
✅ Visual Stop Loss Indicators: Clear visual representation of risk levels
How It Works
The strategy enters long positions when:
Supertrend indicator confirms bullish trend reversal
Proprietary momentum conditions align for optimal entry timing
Trend strength exceeds minimum threshold (ADX > 20)
Multiple timeframe momentum filters confirm signal quality
Ideal For
Trending markets (stocks, forex, crypto, indices)
Swing trading timeframes (15m to 4H work best)
Traders seeking systematic, rule-based entries
Risk-conscious traders wanting clear stop levels
Settings
ATR Period: Adjustable for different volatility environments (default: 10)
Supertrend Factor: Fine-tune sensitivity (default: 3.0)
ADX Parameters: Customize trend strength requirements
Performance Notes
Long-only strategy optimized for uptrending markets
Works best in trending conditions, may underperform in choppy markets
Designed for systematic execution with clear entry/exit rules
Disclaimer
Past performance does not guarantee future results. Always use proper risk management and position sizing appropriate for your account size. This is just for education purpose only and not recomanded for trading in s


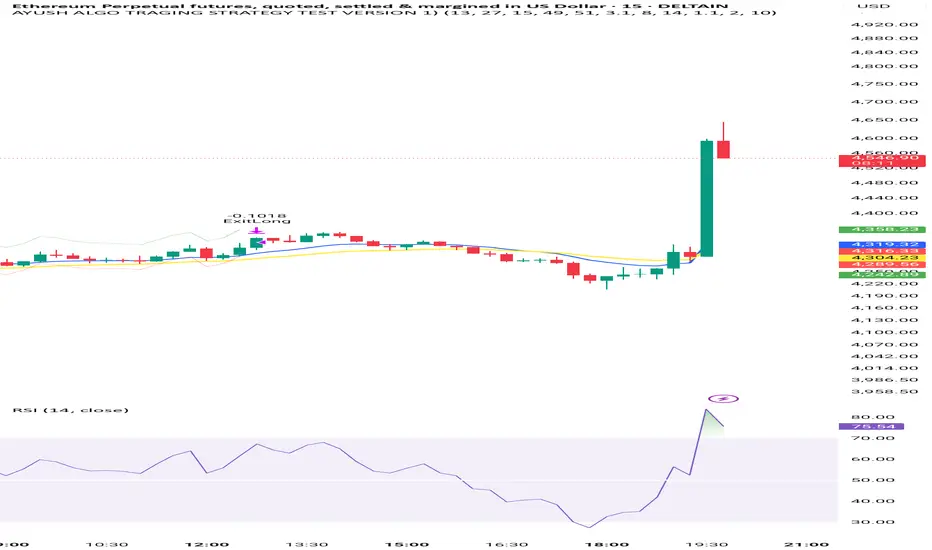
AYUSH ALGO TRAGING STRATEGY TEST VERSION 1)Very good strategy , it uses two moving avg crossovers and also rsi and atr for confirmation, this strategy is fully automated
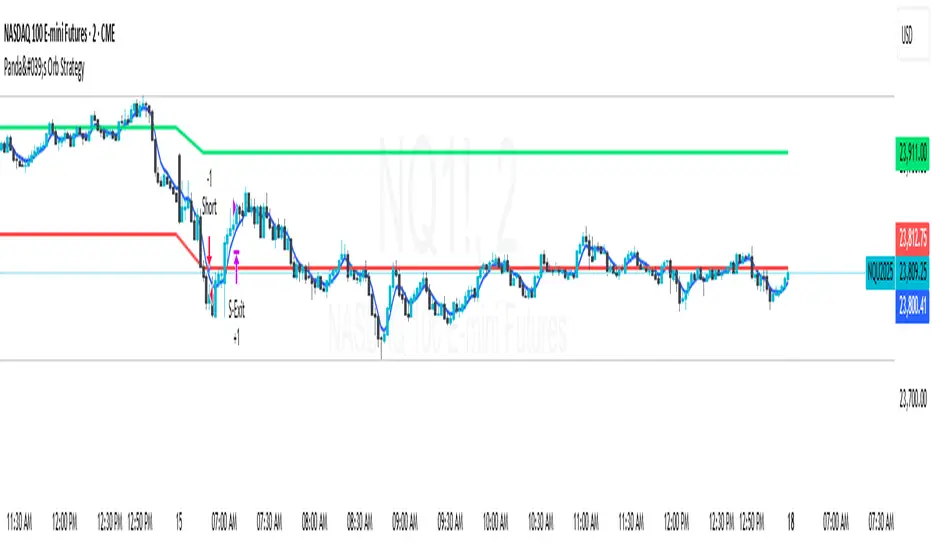
Panda's Orb StrategyORB strategy I created using ChatGBT!
Please message me for any bugs or recomendations!

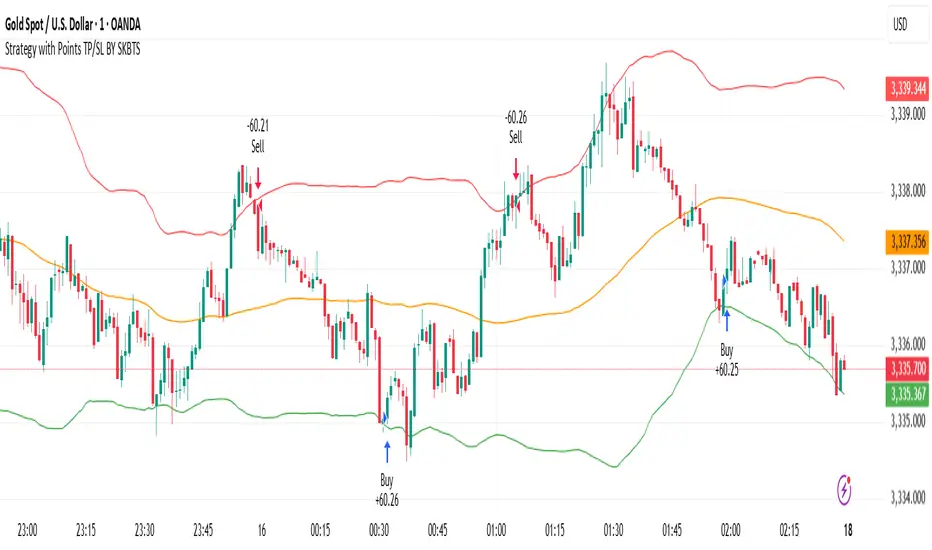
STRATEGY WITH POINT TP/SL BY SKBTSThe formula for the standard middle band is simply a moving average, often set to 20 periods:
Middle Band = 20-period moving average (close)
The upper and lower bands are calculated from the standard deviation, which measures how dispersed the price data is from the average.
Upper Band = Middle Band + (2 standard deviations of 20-period close)
Lower Band = Middle Band - (2 standard deviations of 20-period close)
The key inputs are the 20-period moving average, the number of standard deviations (typically 2), and the 20-period standard deviation. The bands will expand and contract based on the standard deviation value.
Some traders increase the standard deviation multiplier to 2.1 or 2.2 to make the bands looser and more sensitive. Decreasing the number of periods for the moving average and standard deviation will also increase sensitivity.
Adaptive ATR Guardian [自适应 ATR 守护者]自适应ATR守护者 | Adaptive ATR Guardian
——多品种智能交易防护策略 | Multi-Asset Intelligent Trading Protection Strategy
核心功能 | Core Features
1. 自动识别交易品种| Automatic Asset Detection
• 智能识别BTC/USD、XAU/USD等品种
• Auto-detects assets (e.g., BTC/USD, XAU/USD)
• 动态调整参数:ATR倍数、止盈止损比例
• Dynamic parameter tuning (ATR multipliers, TP/SL ratios)
2. 自适应ATR风控 | Adaptive ATR Risk Control
• 基于真实波动率(ATR)动态计算止盈止损
• TP/SL levels adjust with ATR volatility
• 参数自动优化:BTC(3xTP/1.5xSL) ,黄金(2xTP/1xSL)
• Auto-optimized: BTC (3xTP/1.5xSL), Gold (2xTP/1xSL)
3. 实时动态跟踪 | Real-Time Tracking
• 持仓期间止盈止损线实时更新
• Live TP/SL line updates during trades
• 可视化提示:绿色止盈线、红色止损线
• Visual cues: Green TP line, Red SL line
4. 趋势跟随逻辑 | Trend-Following Logic
• 双均线交叉(9MA & 21MA)触发信号
• Dual MA crossover (9MA & 21MA) for entries
• 金叉做多 / 死叉做空
• Long on Golden Cross, Short on Death Cross
5. 专业可视化界面 | Professional Visualization
• 图表标签显示关键参数
• On-chart label shows settings
• 自适应K线范围展示所有标记
• Auto-adjusts plot ranges for clarity
