3 Candle Strike StretegyMainly developed for AMEX:SPY trading on 1 min chart. But feel free to try on other tickers.
Basic idea of this strategy is to look for 3 candle reversal pattern within trending market structure. The 3 candle reversal pattern consist of 3 consecutive bullish or bearish candles,
followed by an engulfing candle in the opposite direction. This pattern usually signals a reversal of short term trend. This strategy also uses multiple moving averages to filter long or short
entries. ie. if the 21 smoothed moving average is above the 50, only look for long (bullish) entries, and vise versa. There is option change these moving average periods to suit your needs.
I also choose to use Linear Regression to determine whether the market is ranging or trending. It seems the 3 candle pattern is more successful under trending market. Hence I use it as a filter.
There is also an option to combine this strategy with moving average crossovers. The idea is to look for 3 candle pattern right after a fast moving average crosses over a slow moving average.
By default , 21 and 50 smoothed moving averages are used. This gives additional entry opportunities and also provides better results.
This strategy aims for 1:3 risk to reward ratio. Stop losses are calculated using the closest low or high values for long or short entries, respectively, with an offset using a percentage of
the daily ATR value. This allows some price fluctuation without being stopped out prematurely. Price target is calculated by multiplying the difference between the entry price and the stop loss
by a factor of 3. When price target is reach, this strategy will set stop loss at the price target and wait for exit condition to maximize potential profit.
This strategy will exit an order if an opposing 3 candle pattern is detected, this could happen before stop loss or price target is reached, and may also happen after price target is reached.
*Note that this strategy is designed for same day SPY option scalping. I haven't determined an easy way to calculate the # of contracts to represent the equivalent option values. Plus the option
prices varies greatly depending on which strike and expiry that may suits your trading style. Therefore, please be mindful of the net profit shown. By default, each entry is approximately equal
to buying 10 of same day or 1 day expiry call or puts at strike $1 - $2 OTM. This strategy will close all open trades at 3:45pm EST on Mon, Wed, and Fri.
**Note that this strategy also takes into account of extended market data.
***Note pyramiding is set to 2 by default, so it allows for multiple entries on the way towards price target.
Remember that market conditions are always changing. This strategy was only able to be back-tested using 1 month of data. This strategy may not work the next month. Please keep that in mind.
Also, I take no credit for any of the indicators used as part of this strategy.
Enjoy~
ابحث في النصوص البرمجية عن "candle"

Renko Candles OverlayHello All,
For long time I got many request for Renko Candles and now here it's, Renko Candles Overlay . I tried to make almost everything optional, so you can play with the options as you want.
Let see the options:
Method: the option for brick scaling method: ATR, ATR/2, ATR/4, Percent, Traditional
- ATR Period: period for Average True Range and it's valid if the method is ATR
- ATR/2 Period: period for Average True Range and it's valid if the method is ATR/2
- ATR/4 Period: period for Average True Range and it's valid if the method is ATR/4
- Traditional: User-defined brick size, it's valid if the method is Traditional
- Percent: Percent of Close price, it's valid if the method is Percent
if the method is not Traditional (fixed brick size) then Brick size is calculated/updated when new bricks added. so The box sizes may be different because of the calculation is dynamic.
Levels & Lines for new Bricks: if you enable this option then the script shows the levels for new brick
Change Bar Color: optionally the script changes the bar color by using direction of the bricks
and some other options for coloring.
The script shows the bricks for visible area, which is approximately 280 candles. so if you change the width and number of the bricks then number of bricks that is shown is adjusted automatically to fit the screen. you can see the examples below:
The script shows the levels to new brick as a line and label:
Because of real-time bar is not confirmed until the candle close, the script shows the bricks as Unconfirmed , and unconfirmed bricks shown in different color:
You can change the width of the bricks (width is 10 in following example):
Optionally candle colors are changde by the direction of the bricks:
If you have any recommendation then please drop a comment under the script ;)
Enjoy!

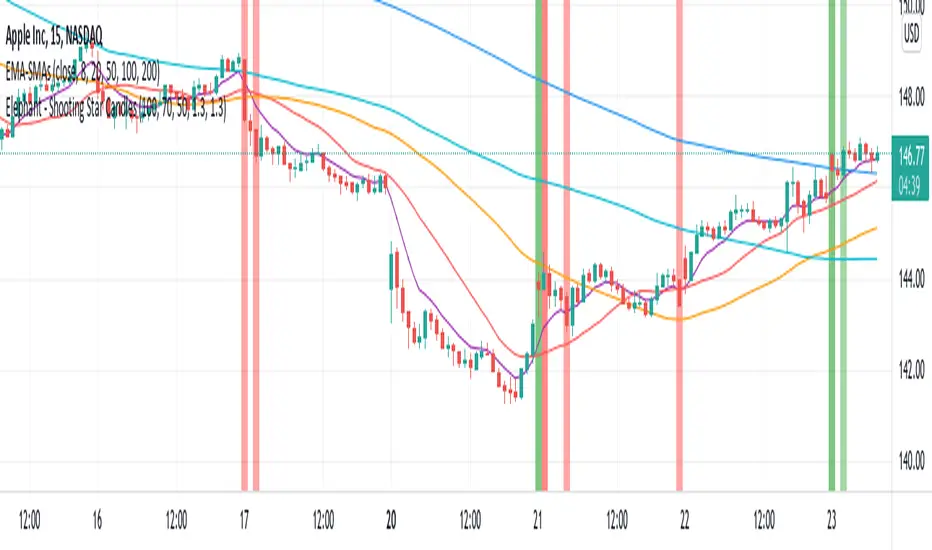
Elephant - Shooting Star CandlesThis script aims to show elephant and shootingstar candles. Body for elephant are at least 70% of the whole candle. Shootingstar have a body of 35% times the lenht of the full candle. Both are searched with 1.3 Standard Deviations as noise within 100 bars. Colors are ploted if closes above/below 200 SMA
HTF Candles by Prosum SolutionsOverview of Features
This indicator was inspired by the work of "informanerd" in the script called "HTF Candles" as well as the built-in script called "Multi-Time Period Charts" by TradingView. The script will provide a highly customizable interface to specify the higher timeframe resolution for the candlesticks, the type of candle, as well as various styling options for the body, borders and wicks.
Usage Information
The indicator can be applied to any chart at any time frame, but resolutions less than 1 minute may demonstrate gaps between bars and the candles may not render properly.
When the "Same as chart" option is chosen for the "Resolution" field, the indicator will attempt to find a higher timeframe resolution to ensure the candlesticks are drawn.
Enjoy! 👍
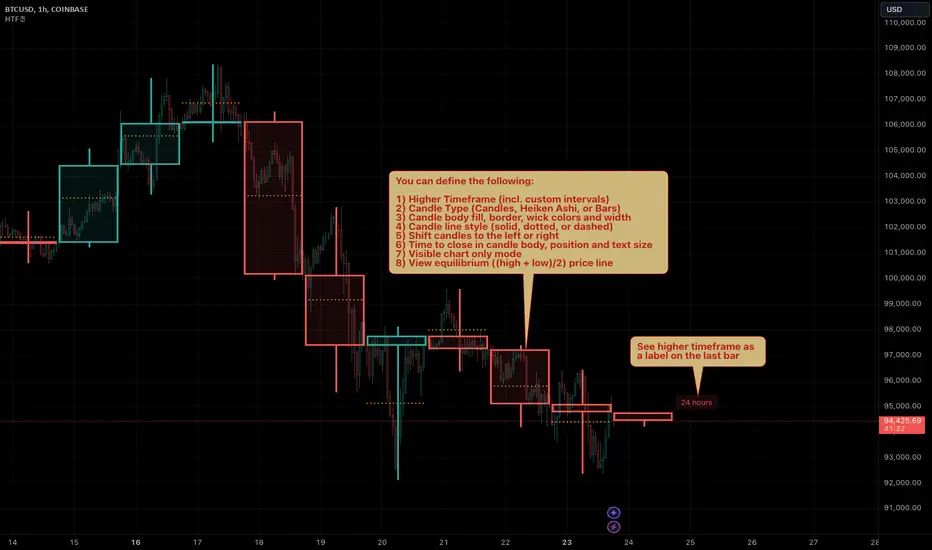
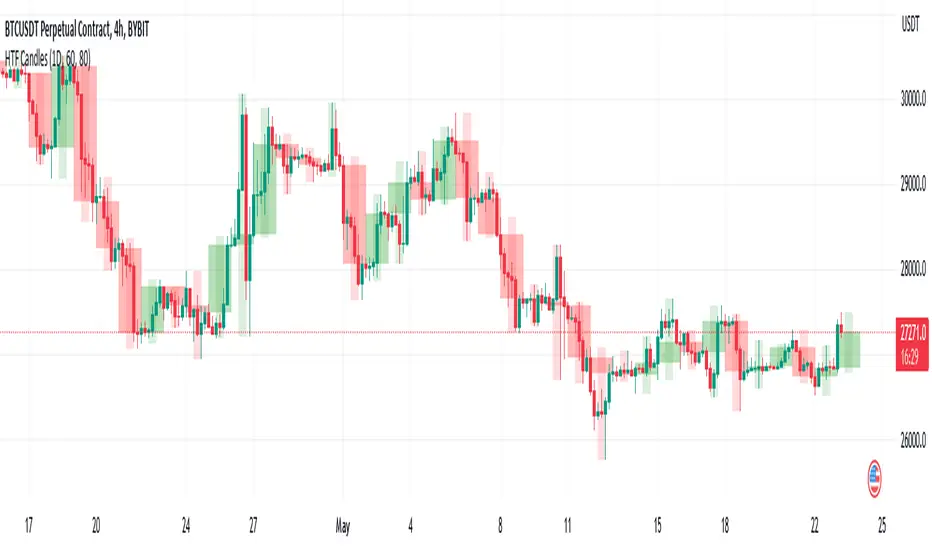
HTF CandlesThis draws candlesticks from higher time frames on the current chart. I tried to keep the script simple using some newly introduced Pine capabilities.
To change the options like the higher time frame and candle colors, check the indicator settings.
Looking forward to your opinions!
Bullflag Candlestick pattern
A bull flag is essentially a small consolidation near the top of an upthrust. If we picture it as a candlestick pattern, it should have a big green candlestick + a small body red/green candle near the top of the top big green candle.
This script essentially help you identify these.

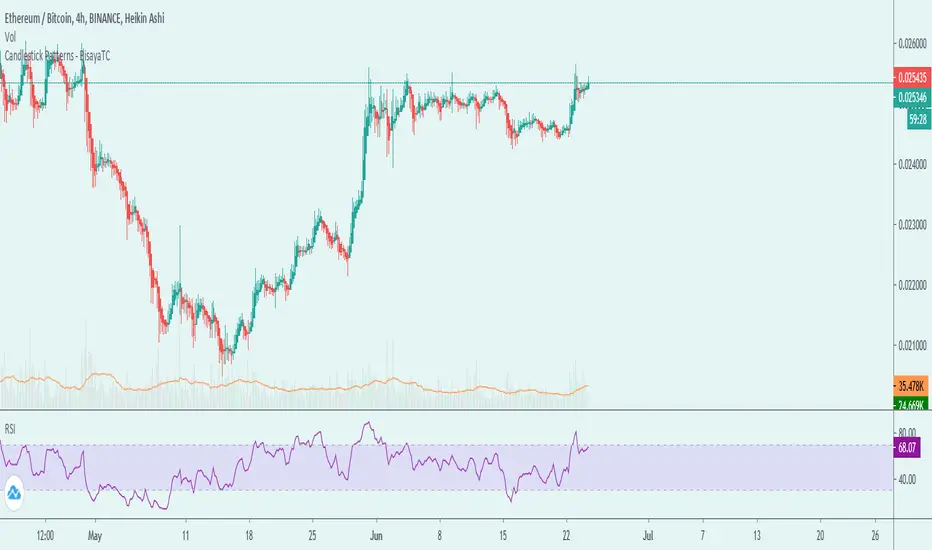
Candlestick Patterns - BisayaTCThe script displays a label when a candle stick pattern is detected based on Trends. This is related to the latest Candlestick patterns released in TradingView. I've created this to have all candlestick patterns in one indicator.
Candlestick Patterns can be one of confirmation of a trend you're following or a reversal.
DISCLAIMER: For educational purposes only. Nothing in this content should be interpreted as financial advice or a recommendation to buy or sell any sort of security or investment including all types of crypto. DYOR
EMA Crossover Candle Color - 9/21A simple visual trend highlighter for intraday/day trading. This overlay indicator plots a fast 9-period EMA (orange) and a slower 21-period EMA (blue). Candles turn green on the exact bar where the 9 EMA crosses above the 21 EMA (bullish momentum shift), and red when the 9 EMA crosses below the 21 EMA (bearish shift). Otherwise, candles remain default. Great for spotting quick trend changes, momentum entries, or filtering chop on 5-min charts (or any timeframe). Pairs well with VWAP, volume, or price action for confluence.

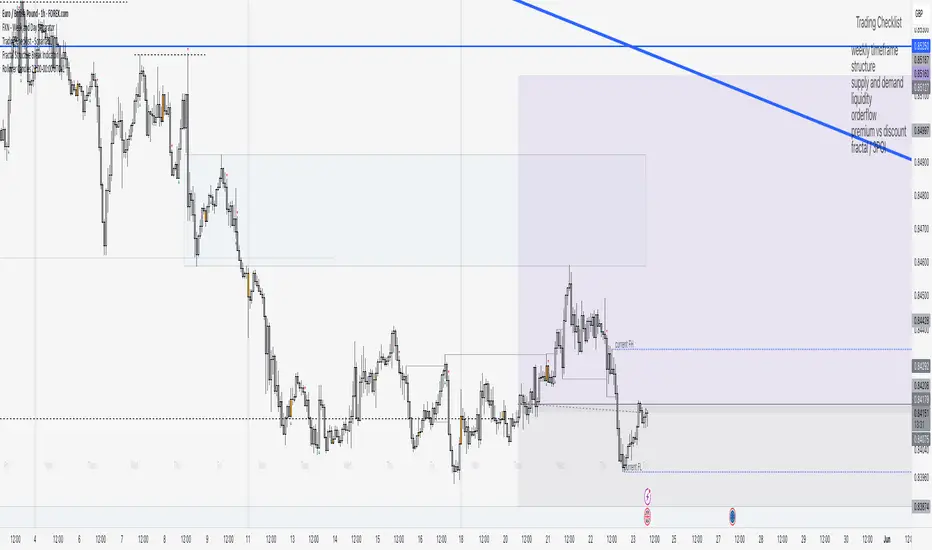
4H & Daily Previous Candle + Fibonacci + OTE# Multi-Timeframe OTE & Fibonacci Indicator (4H & Daily)
This Pine Script v5 indicator is designed for traders who utilize **Optimal Trade Entry (OTE)** zones and **Fibonacci retracements** based on higher timeframe market structures. It automatically identifies and plots key levels from the previous 4-hour and Daily candles to help find high-probability reversal zones.
## Key Features
### 1. Dual Timeframe OTE Zones
- **4H OTE Zone**: Automatically calculates and shades the Optimal Trade Entry area (default 61.8% - 78.6%) based on the previous 4-hour candle's range.
- **Daily OTE Zone**: Plots a secondary OTE zone based on the previous Daily candle, allowing for multi-timeframe confluence analysis.
- **Dynamic Adaptation**: The zones automatically flip based on whether the previous candle was bullish or bearish, ensuring you are always looking at the correct retracement levels.
### 2. Automated Market Structure
- **High/Low Tracking**: Plots clear horizontal lines for the previous 4H and Daily Highs and Lows.
- **Visual Distinction**: Daily levels are highlighted with thicker lines to distinguish them from 4H levels.
- **Price Labels**: Displays real-time price labels for all structural levels for quick reference.
### 3. Customizable Fibonacci Retracements
- **4H Fibonacci Levels**: Plots standard retracement levels (23.6%, 38.2%, 50%, 61.8%, 78.6%) for the 4H timeframe.
- **Fully Adjustable**: Users can input custom Fibonacci levels via the settings menu.
### 4. Real-Time Information Dashboard
- **Range Summary**: A clean table in the top-right corner displays the total pip/point range for both the previous 4H and Daily candles.
- **Clean UI**: All visual elements (colors, line widths, labels) can be toggled or customized to fit any chart theme.
## How to Use
This indicator is ideal for "Smart Money" or "ICT" style trading. Look for **confluence** where the 4H OTE zone overlaps with the Daily OTE zone or other key structural levels to identify high-precision entry points.

Fibonacci 5 Candles Retracement
================================================================================
FIBONACCI 5 CANDLES RETRACEMENT - STRATEGY GUIDE
================================================================================
WHAT DOES THIS STRATEGY DO?
---------------------------
This strategy automatically identifies market trends and uses Fibonacci
retracements to find the best entry points. The idea is simple: when price
makes a strong movement (trend), it often pulls back before continuing in
the same direction. The strategy captures these "pullbacks" to enter at the
right moment.
HOW IT WORKS?
-------------
1. TREND DETECTION
The strategy looks for 5 consecutive candles of the same color:
- 5 red candles = BEARISH trend (price falls)
- 5 green candles = BULLISH trend (price rises)
2. CALCULATION OF START AND END POINTS
For a BEARISH trend (5 red candles):
- START: The highest point between the first red candle and the previous one
- END: The lowest point reached during the 5 candles (and beyond, if the
trend continues)
For a BULLISH trend (5 green candles):
- START: The lowest point between the first green candle and the previous one
- END: The highest point reached during the 5 candles (and beyond, if the
trend continues)
3. DYNAMIC UPDATE
The END point updates automatically if price continues to move in the
direction of the trend, creating new highs (for bullish trends) or new
lows (for bearish trends).
4. TREND END
Normal Mode:
- BEARISH trend ends when a candle closes above the previous candle's open
- BULLISH trend ends when a candle closes below the previous candle's open
"Extended Trend" mode (optional):
- The trend remains active until a candle closes beyond the dynamic 50%
retracement level
- When this happens, the END point "freezes" (stops updating), but the
trend can continue
5. FIBONACCI RETRACEMENT CALCULATION
Once START and END are identified, the strategy automatically calculates
Fibonacci levels. IMPORTANT: for retracements and pending orders, we
consider START as 100% and END as 0%, because we work on the part of the
trend that is recovered (the pullback).
The retracement levels are:
- 70% = level closest to START (smallest retracement)
- 60% = second level
- 50% = central level (often used for entry)
- 25% = level closest to END (largest retracement)
6. PENDING ORDER PLACEMENT
When a trend is identified and completed, the strategy automatically places
a pending order (limit order) at one of the selectable Fibonacci levels.
Available levels:
- 25%: closest to END
- 50%: central level (balanced)
- 60%: closest to START
- 70%: very close to START
The order direction depends on the trend:
- BEARISH trend → SHORT order (bet that price falls)
- BULLISH trend → LONG order (bet that price rises)
Stop Loss and Take Profit (for retracements):
- Stop Loss: always at START level
- Take Profit: always at END level
EXTENDED TAKE PROFIT:
If the order is executed (filled), the strategy can apply an "Extended
Take Profit" if configured. IMPORTANT: for the extended TP calculation,
we consider START as 0% and END as 100% (the original trend movement).
For example, if you set 3%, the Take Profit will be at 103% of the
original trend movement instead of 100%.
AVAILABLE FILTERS
-----------------
1. MINIMUM TREND (pips)
Filters trends that are too small. If a trend is below the set value:
- START and END labels become gray (instead of red/green)
- No pending order is placed
- The trend is still displayed on the chart
Useful for avoiding trading movements that are too small.
2. EMA FILTER
Uses two moving averages (EMA 50 and EMA 200) to filter direction:
- If active: places LONG orders only when EMA50 > EMA200 (uptrend)
- If active: places SHORT orders only when EMA50 < EMA200 (downtrend)
Useful for trading only in the direction of the main trend.
3. EXTENDED TREND
Modifies how the trend is considered "completed":
- If disabled: uses normal logic (opposite candle)
- If active: the trend remains in formation until a candle closes beyond
the dynamic 50%. When this happens, END freezes but the trend can continue.
Useful for capturing longer trends and extended movements.
VISUALIZATION
-------------
The strategy displays on the chart:
1. START AND END LABELS
- Red color for bearish trends
- Green color for bullish trends
- Gray color if the trend is not valid (too small)
- Remain visible even when new trends form
2. START AND END LINES
- Horizontal lines indicating the start (START) and end (END) points of the trend
- White color by default, customizable from the settings panel
- Update dynamically when the END point changes
- Can be shown or hidden via the "Show Start/End Lines" option
3. FIBONACCI LINES
The strategy shows horizontal lines at retracement levels:
- Line at 50% (yellow by default)
- Line at 25% (green by default)
- Line at 60% (azure by default)
- Line at 70% (red by default)
COLOR CUSTOMIZATION:
All line colors can be customized from the settings panel in the
"LINE COLORS" section:
- Start/End Line Color: customize the color of START and END lines
- 50% Line Color: customize the color of the 50% line
- 25% Line Color: customize the color of the 25% line
- 60% Line Color: customize the color of the 60% line
- 70% Line Color: customize the color of the 70% line
Lines update dynamically when the END point changes and can be shown or
hidden individually via options in the "VISUALIZATION" section.
4. PENDING ORDER LABELS
Show pending order information:
- Direction (LONG or SHORT)
- Entry price
- Stop Loss
- Take Profit
Positioned far from the chart to avoid cluttering the visualization.
ALERTS
------
If enabled, alerts send notifications when:
1. PENDING ORDER CREATED
When a new pending order is placed, with all information.
2. PENDING ORDER UPDATED
When the pending order is updated (for example, if the level changes or
if the END point moves).
3. ORDER OPENED
When the pending order is executed (filled) and the position is opened.
Alerts can be configured in TradingView to send notifications via email,
SMS, or other platforms.
RECOMMENDED SETTINGS
--------------------
To get started, you can use these settings:
VISUALIZATION:
- Show all lines and labels to see how it works
- Show Start/End Lines: true (to display lines at START and END points)
- Customize line colors in the "LINE COLORS" section according to your preferences
STRATEGY:
- Pending Order Level: 50% (balanced)
- Extended TP: 0% (use standard TP at 100%)
FILTERS:
- Minimum Trend: 0 pips (disabled initially)
- Use EMA Filter: false (disabled initially)
- Extended Trend: false (use normal logic)
ALERTS:
- Enable Alerts: true (if you want to receive notifications)
PRACTICAL EXAMPLE
-----------------
Scenario: Bearish Trend
1. Price forms 5 consecutive red candles
2. The strategy identifies:
- START = 1.2000 (highest point)
- END = 1.1900 (lowest point)
- Range = 100 pips
3. Calculates Fibonacci levels (for retracements: START = 100%, END = 0%):
- 100% = 1.2000 (START)
- 70% = 1.1930
- 60% = 1.1940
- 50% = 1.1950
- 25% = 1.1975
- 0% = 1.1900 (END)
4. If you set "Pending Order Level" to 50%:
- Places a SHORT pending order at 1.1950 (50% retracement)
- Stop Loss at 1.2000 (START = 100%)
- Take Profit at 1.1900 (END = 0%)
5. If price rises and touches 1.1950:
- The order is executed
- Opens a SHORT position
- If price falls to 1.1900 → Take Profit (profit)
- If price rises to 1.2000 → Stop Loss (loss)
IMPORTANT NOTE
--------------
This strategy is a technical analysis tool. Like all trading strategies,
it does not guarantee profits. Trading involves risks and you can lose money.
Always use appropriate risk management and test the strategy on historical
data before using it with real money.
LICENSE
-------
This code is open source and available for modification. You are free to
use, modify, and distribute this strategy. If you republish or share a
modified version, please kindly mention the original author.
================================================================================

LiquidityPulse RSI Candle Strength MomentumLiquidity-Pulse RSI Candle Strength Momentum is a multifunctional and original candle-analysis tool designed to highlight the potential internal strength of each candle using a combination of body size and volume.
To view the candle-strength scores clearly: right-click on the chart, go to Settings, and in the Symbol tab untick Body, Borders and Wicks.
Candle Strength Scores
The indicator calculates the average body size and average volume over a user-defined lookback period. Each candle is then compared to these averages, and the indicator combines relative body expansion and relative volume expansion with a square-root calculation to create a (normalised) candle-strength score from 1 to 10.
10 – exceptionally strong compared to the lookback average (large body size and volume)
1 – very weak compared to the lookback average (small body size and volume)
Bullish and bearish candles are evaluated independently, producing separate bull-strength and bear-strength scores.
Optional ATR and volume floors can be enabled to restrict strength scoring to candles that exceed a minimum volatility or participation threshold. This helps users who prefer to filter out low-impact candles during quiet market periods. This option can be enabled or adjusted in the settings but is turned off by default.
Candle Colours
This tool also shows candles coloured based on the candle-strength scores (10 colours in each theme), which makes it easier to visualise the scores and see whether the candle score was high or not. There are several options in the 'colour theme' dropdown menu in the settings. Users can also customise all colours manually.
RSI Candle Strength Arrows
The Relative Strength Index is a long-established momentum tool that calculates the ratio of average upward moves to average downward moves over a defined period, allowing traders to identify potential overbought and oversold market conditions where momentum may be stretched. As well as this, strong early momentum and participation are often associated with more sustained moves.
This indicator combines this methodology and provides optional arrows that appear only when candle strength and RSI conditions align:
– A candle meets or exceeds a chosen strength threshold
– RSI has recently reached an overbought or oversold level
– The candle direction matches the expected momentum shift
For example, if price has reached an oversold RSI level and a strong bullish candle forms (high candle-strength number), an upside arrow may plot.
Users can customise the RSI oversold and overbought thresholds, the minimum candle-strength threshold, and how many bars back the RSI condition must have occurred in the settings.
These arrows are not buy or sell signals but instead highlight rare moments where strong candle behaviour aligns with meaningful RSI extremes. This is useful to users because it allows the candle-strength logic to be applied only when momentum is genuinely stretched, filtering out noise and focusing attention on the most statistically significant market moves.
This indicator brings together a quantitative candle-strength model and a momentum-based RSI filter to give users a clearer view of how individual candles behave relative to their recent environment, while also highlighting when those movements occur during meaningful shifts in market momentum. By combining both forms of analysis, the tool helps traders distinguish ordinary price changes from potentially significant structural behaviour.
How traders can use this indicator
– Stronger candle scores in the trend direction can confirm continuation pressure.
– Powerful opposing candles appearing at RSI extremes may signal potential reversals or exhaustion points.
– If breakouts occur with high candle scores, price may be more likely to follow through.
– Weak candles with low scores help traders avoid false signals or low-quality setups.
– Candle-strength scoring helps users quickly interpret both volume and candle-body behaviour without manual analysis.
Open source, if anyone has any ideas on how to make the script better or have any questions please let me know :)
Disclaimer
This indicator is provided for educational and analytical purposes only and should not be interpreted as financial advice or a recommendation to buy or sell any asset. The candle-strength values displayed by this tool are not literal or definitive measures of market strength; they are derived from a custom mathematical model designed to highlight relative differences in candle behaviour. These values should be viewed as a simplified representation of candle dynamics, not as an objective or universal measure of strength.
Users should be aware that this calculation does not replace the importance of analysing real traded volume, order flow, liquidity conditions, or broader market context. As with any technical tool, results should be considered alongside other forms of analysis, and past performance does not guarantee future outcomes. Use at your own discretion and risk.

HTF Candles Pro by MurshidFx# HTF Candles Pro by MurshidFx
## Professional Trading Indicator for Multi-Timeframe Market Structure Analysis
**HTF Candles Pro** is an advanced, open-source trading indicator that synthesizes Higher Timeframe (HTF) candle visualization with CISD (Change in State of Delivery) detection, providing comprehensive market structure analysis across multiple timeframes. Designed for traders at all experience levels—from scalpers to swing traders—this tool enables precise alignment of trades with higher timeframe momentum while identifying critical market structure transitions.
---
## Core Functionality
This indicator integrates three essential analytical frameworks:
- **HTF Candle Visualization** – Inspired by the innovative work of Fadi x MMT's MTF Candles indicator
- **CISD Detection System** – Algorithmic identification of significant market structure reversals
- **Intelligent Session Level Management** – Automated consolidation of overlapping session markers for enhanced chart clarity
The result is a sophisticated yet streamlined analytical tool that delivers actionable market insights with minimal visual complexity.
---
## Feature Set
### Higher Timeframe Candle Analysis
Monitor higher timeframe price action seamlessly without chart switching. The indicator employs automatic HTF selection based on current timeframe, with manual override capability.
**Components:**
- **Primary HTF Display**: Automatically positioned adjacent to current price action
- **Secondary HTF Display**: Optional dual-timeframe analysis capability
- **Adaptive Time Labeling**: Context-aware formatting (intraday times, day names, week numbers)
- **Real-Time Countdown**: Optional timer displaying remaining time until HTF candle close
- **Customizable Color Schemes**: Full color customization for bullish and bearish candles
### CISD Detection (Change in State of Delivery)
The CISD system identifies critical inflection points where market structure undergoes directional change, signaling potential trend reversals or continuations.
**Mechanism:**
- **Market Structure Monitoring**: Continuous tracking of swing highs and lows
- **Liquidity Sweep Detection**: Identification of stop-hunt patterns preceding reversals
- **Reversal Confirmation**: Validation-based CISD level plotting upon structure break confirmation
- **Clear Visual Signals**: Bullish CISD (blue) and bearish CISD (red) demarcation
- **Optimized Display**: Default 5-bar line length (adjustable) minimizes chart clutter
**Technical Definition:**
CISD occurs when price breaches structure in one direction—typically sweeping liquidity and triggering stops—then reverses to break structure in the opposite direction, indicating a fundamental shift in market delivery bias.
### Intelligent Session Level Management
Eliminates visual clutter caused by overlapping session opens at identical price levels through automated consolidation.
**Functionality:**
- **Automatic Consolidation**: Merges multiple concurrent session opens into single reference lines
- **Combined Labeling**: Creates unified labels (e.g., "Week-Day Open," "4H-Day-Week Open")
- **Enhanced Clarity**: Maintains professional chart aesthetics while preserving all relevant information
**Supported Session Intervals:**
- 30-Minute Opens
- 4-Hour Opens
- Daily Opens
- Weekly Opens
- Monthly Opens
### Advanced Market Structure Tools
**Liquidity Sweep Identification:**
Highlights price wicks extending beyond previous HTF extremes that close within range—characteristic liquidity grab patterns.
**HTF Midpoint Reference:**
Displays the 50% retracement level of the most recent completed HTF candle, serving as a key reference for entries and profit targets.
**HTF Opening Price:**
Tracks current HTF candle open price, frequently functioning as dynamic support or resistance.
**Interval Demarcation:**
Visual separators defining HTF period boundaries for enhanced temporal clarity.
### Information Dashboard
Compact, customizable dashboard displaying:
- Current symbol and active timeframe
- HTF candle countdown timer
- Active trading session (Asia/London/New York)
- Current date and time
Flexible positioning: configurable for any chart corner.
---
## Default Configuration
Optimized settings for immediate professional-grade chart presentation:
- **Secondary HTF**: Disabled (enable for multi-timeframe comparative analysis)
- **CISD Bullish Color**: Blue (#0080ff) – optimal visibility with reduced eye strain
- **CISD Line Width**: 1 pixel – subtle yet discernible
- **CISD Line Length**: 5 bars – balanced visibility without excessive clutter
- **Session Opens**: Smart consolidation enabled – eliminates overlapping labels
---
## Application Strategies
### Trend Following
1. Monitor CISD confirmations aligned with HTF trend direction
2. Utilize HTF candle color for directional bias confirmation
3. Execute entries on pullbacks to HTF midpoint or open price levels
### Reversal Trading
1. Identify counter-trend CISD formations
2. Await HTF candle close confirming new directional bias
3. Use session opens as secondary confirmation levels
### Scalping
1. Trade exclusively in HTF candle direction
2. Employ lower timeframe CISD signals for precise entry timing
3. Target HTF midpoint or subsequent session open levels
### Structure-Based Trading
1. Mark liquidity sweep levels as potential reversal zones
2. Monitor CISD formations at key session opens
3. Confirm trend changes via HTF candle closes
---
## Customization Parameters
Comprehensive customization options:
- **Color Schemes**: Independent control of bull/bear candles, borders, CISD signals, session levels
- **Dimensional Settings**: Candle width, line thickness, label sizing
- **Display Quantities**: HTF candle count (1-10 range)
- **Positioning**: Candle offset, dashboard placement, label positioning
- **Line Styles**: Solid, dashed, or dotted rendering
- **Timeframe Selection**: Manual secondary HTF specification
---
## Attribution
**HTF Candle Visualization:**
The HTF candle rendering methodology draws inspiration from Fadi x MMT's "MTF Candles" indicator. Their elegant implementation of multi-timeframe candle visualization provided valuable reference for this development. Recognition and appreciation to their contribution to the TradingView community.
**CISD Detection:**
Proprietary CISD detection algorithm engineered to identify market structure transitions with high signal clarity and reduced false positive rate.
**Session Level Consolidation:**
Custom-developed intelligent grouping system addressing the common challenge of overlapping session labels at coincident price levels.
---
## Open Source License
This indicator is released as open source for the TradingView community. Permitted uses include:
- Implementation in live trading
- Educational study for Pine Script learning
- Personal modification and customization
- Distribution among trading communities
Community contributions, improvements, and derivative works are welcomed and encouraged.
---
## Implementation Guide
1. **Installation**: Click "Add to Chart"
2. **Configuration Access**: Open indicator settings panel
3. **Initial Use**: Default settings provide optimal starting configuration
4. **Optional Features**: Enable secondary HTF for multi-timeframe analysis
5. **Theme Integration**: Adjust color schemes to match chart aesthetics
---
## Best Practices
**Timeframe Optimization:**
- 1-5 minute charts: Optimal with 15m or 1H HTF
- 15-30 minute charts: Effective with 4H HTF
- 1-4 hour charts: Suitable for Daily HTF
- Daily charts: Best utilized with Weekly/Monthly HTF
**CISD Trading Guidelines:**
- Require CISD confirmation before position entry
- Prioritize CISD signals at significant levels (session opens, HTF midpoints)
- Confirm CISD direction aligns with HTF candle bias
- Apply contextual filtering—not all CISD signals warrant trades
**Session Open Strategy:**
- Weekly opens typically provide robust support/resistance
- Daily opens offer reliable intraday reference points
- 4-Hour opens effective for short-term scalping
- Consolidated labels (e.g., "Week-Day Open") indicate confluence zones with elevated significance
---
## Technical Specifications
**Performance Optimization:**
- Intelligent object management prevents TradingView rendering limits
- Efficient array processing for session consolidation
- Proper memory management through systematic object deletion
- Consistent performance across all timeframe ranges
**Compatibility:**
- Universal timeframe support
- Optimized for all market types (forex, stocks, crypto, futures)
- Minimal computational overhead
---
## Support & Development
**Feedback Channels:**
- Comment section for user feedback and suggestions
- Bug reports and feature requests welcomed
- Community-driven enhancement consideration
**Documentation:**
- Well-commented source code for learning purposes
- Clear section organization for easy navigation
- Comprehensive type definitions for structural clarity
- Educational value for market structure concept understanding
---
## Version Information
**Version:** 1.0 (Initial Release)
**License:** Open Source
**Category:** Multi-Timeframe Analysis | Market Structure
**Compatibility:** All Timeframes
**Language:** Pine Script v5
---
**For optimal results:**
- Provide feedback through comments
- Share with trading communities
- Submit enhancement suggestions
- Report technical issues for resolution
**Professional Support:**
Available through comment section for technical inquiries, implementation questions, and feature requests.
---
*Developed for the TradingView trading community | Professional-grade market structure analysis | Open source contribution*

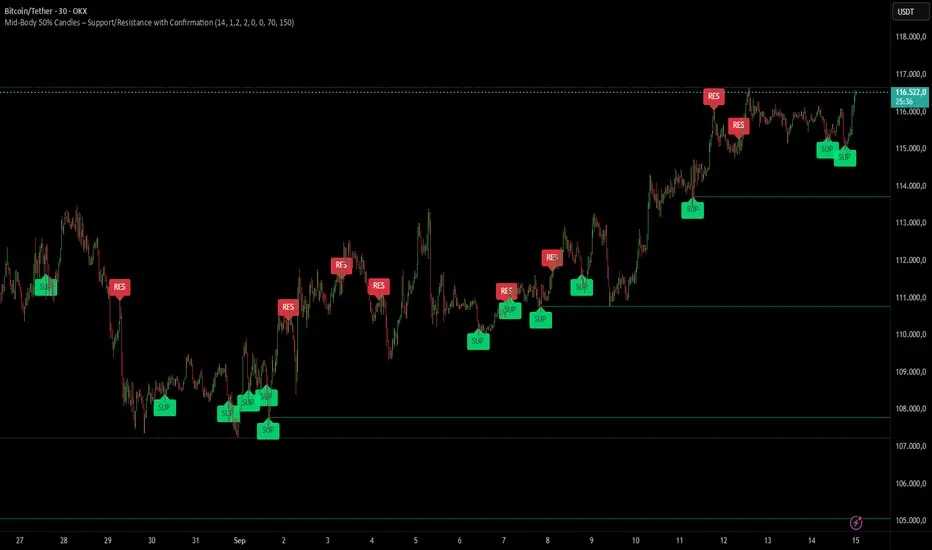
Mid-Body 50% Candles – Support/Resistance with ConfirmationHow it works:
– Calculates the mid-body (open+close)/2 of the previous candle.
– Bullish candle → potential SUP level.
– Bearish candle → potential RES level.
– Optional next-bar confirmation (close above/below the mid-body).
– Filters available: ATR size, swing detection, upper/lower wick %.
– Lines extend until broken or removed.
– Alerts available for: level creation, touch and break.
Use cases:
– Confirm candle rejections (pin bars).
– Filter false breakouts.
– Refine entries/exits for scalping or swing trading.
What makes it unique:
Unlike generic Fibonacci or candle tools, this script focuses exclusively on the 50% body level with confirmations and multiple filters, making it more precise for price action decision points.
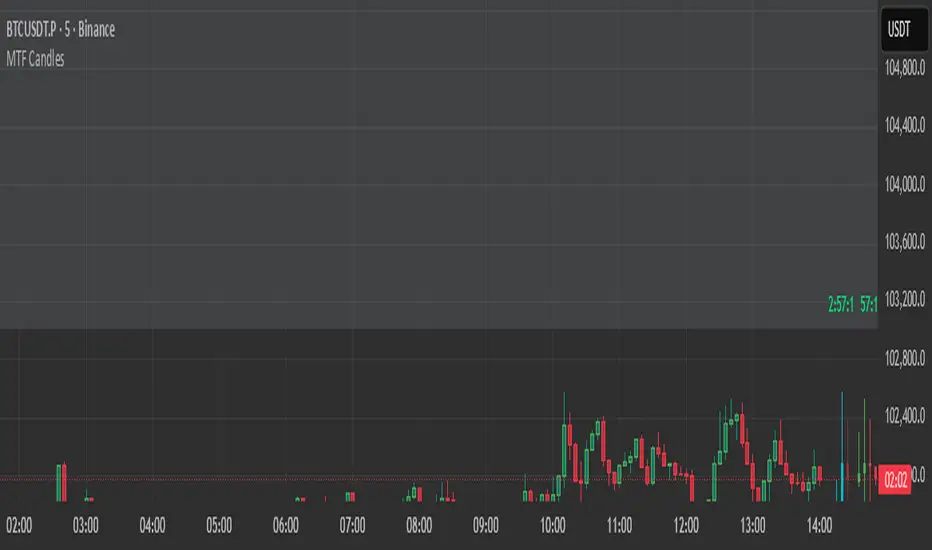
HTF Candles HTF Candles
Features
• 1-minute, 5-minute, 1-hour, 4-hour, and previous-day daily candles
• Visualizes the remaining time and number of candles from the lower timeframe that form the next higher-timeframe candle.”
•
Cumulative Volume Delta Candles Aggregated (Lite)Cumulative Volume Delta Candles Aggregated (Lite)
Multi-Exchange CVD Visualization in Candle Format
This indicator provides an aggregated Cumulative Volume Delta (CVD) view across multiple major perpetual futures exchanges in one chart. It is designed for traders who want a broader perspective on buying and selling pressure without switching between multiple charts or relying on a single exchange feed.
What It Does
Combines volume delta data from Binance, Bybit, OKX, Bitget, and Coinbase into a unified representation.
Displays CVD as candlesticks, where each candle reflects the open, high, low, and close of cumulative delta for the selected period.
Offers a clear visual of how buying and selling pressure evolves across markets in a structured, familiar candle format.
Key Features
✔ Exchange Aggregation: Incorporates data from several top futures markets available on TradingView.
✔ Anchor Reset: Allows you to set an anchor timeframe (e.g., daily) to reset cumulative values for better readability and analysis.
✔ Unit Normalization: Since exchanges report volumes in different units, the indicator normalizes all data and outputs values denominated in the base currency (coins) for consistency.
✔ Hidden OHLC Outputs: Provides open, high, low, and close values as hidden plots for use with other indicators or strategies.
✔ Lightweight Design: Optimized for efficiency while handling multiple real-time data requests.
Why It’s Different
Unlike standard single-exchange CVD tools, this indicator aggregates the majority of perpetual volume data available on TradingView, offering a more representative view of market sentiment. The candle-based representation of CVD introduces an additional layer of structure, helping traders identify shifts in momentum and pressure with more context than a simple cumulative line.
Use Cases
- Spotting aggregated buy/sell pressure trends across multiple exchanges.
- Confirming breakout or reversal signals with broader volume delta context.
- Serving as a custom data source for other indicators or algorithmic strategies.

High Volume CandlesInspired by Key bars from Option Stalker Pro.
This one is meant to be used on charts where the interval is <1D.
Highlights candles in chart with Volume > 1.4 * last 30 candles average volume.
Helps to not accidentally miss that a candle move happened on high volume (or that it did not happen on high volume...), like potential reversals or resistance/support breaks.
Make sure to move this indicator above the ticker in the Object Tree, so that it is drawn on top of the ticker's candles.
More infos: www.reddit.com

Close Above/Below Prev 2 Candle Strategy (Any Timeframe)Title: Close Above/Below Previous 2 Candle Strategy (Any Timeframe)
Description:
This strategy identifies potential breakout and trend continuation signals by analyzing the closing price relative to the highs and lows of the previous two candles. It works on any chart timeframe, making it versatile for intraday, swing, and daily trading.
How it works:
Long Entry (Bullish Signal): Triggered when the current candle closes above the highs of the previous two candles.
Short Entry (Bearish Signal): Triggered when the current candle closes below the lows of the previous two candles.
Visual Indicators:
Green triangles above the bar indicate bullish signals.
Red triangles below the bar indicate bearish signals.
Strategy Features:
Works on any timeframe, from 1-minute charts to daily/weekly charts.
Configurable risk/reward ratio for automatic stop-loss and take-profit levels.
Alerts trigger immediately when the condition is met, helping traders react to potential breakouts.
Provides clean visual signals for easy chart reading and decision-making.
Benefits:
Reduces noise by focusing on candle close confirmations.
Versatile and suitable for intraday, swing, and long-term trading.
Easy to combine with other indicators or strategies.

Leg Out Candle V2.0The Script marks candles that could be considered as a leg out of a supply/demand and are bigger than the previous ones based on the adjustable lookback value. There is also the option to adjust the threshold ob the body to wick ratio of the leg out candle. The lowest value is 50% because anything lower would be a basing candle.

High/Low last 1-3 candlesHere you can display the high and low of the last 1, 2 or 3 candles. The whole thing is updated with every new candle. you can also switch the lines on or off as you wish and adjust the colour of the lines. have fun with it

Consecutive Candle CounterConsecutive Condition Counter is a versatile indicator that tracks and visualizes consecutive candles based on user-defined market conditions. It helps traders quickly identify streaks of bullish or bearish signals by counting how many bars in a row satisfy the selected condition.
🔍 Features:
Three selectable conditions via a dropdown:
Up & Down Days: Counts consecutive up or down candles. Each up candle adds +1, each down candle subtracts -1. The counter resets when direction changes.
RSI Signal: Counts how many consecutive bars RSI remains above 70 (+1 per bar) or below 30 (-1 per bar). Resets when RSI moves back to the neutral zone.
SMA Positioning: Counts consecutive bars where price stays above (+1) or below (-1) a Simple Moving Average (SMA). SMA period is user-defined.
📊 Visualization:
Positive streaks are shown in green, negative streaks in red, and neutral values in gray.
Displayed as a histogram below the chart for quick pattern recognition.
⚙️ Inputs:
Choose condition logic from the dropdown.
Configure the RSI period and SMA period as needed.
This tool can be helpful for identifying momentum streaks, overbought/oversold trends, or trend-following behavior in a visually intuitive way.

Rollover Candles 23:00-00:00 UTC+1This indicator highlights the Forex Market Rollover candles during which the spreads get very high and some 'fake price action' occurs. By marking them orange you always know you are dealing with a rollover candle and these wicks/candles usually get taken out later on because there are no orders in these candles.
Optimal settings: The rollover takes only 1 hour, so put the visibility of the indicator on the 1 hour time frame and below (or just the 1h).
IBD Style Candles [tradeviZion]IBD Style Candles - Visualize Price Bars Like the Pros
Transform your chart with institutional-grade IBD-style bars and customizable moving averages for both daily and weekly timeframes. This indicator helps you visualize price action the way professionals at Investors Business Daily do.
What This Indicator Offers:
IBD-style bar visualization (clean, professional appearance)
Customizable coloring based on price movement or previous close
Automatic timeframe detection for appropriate moving averages
Four customizable moving averages for daily timeframes (10, 21, 50, 200)
Four customizable moving averages for weekly timeframes (10, 20, 30, 40)
Options to use SMAs or EMAs with adjustable colors and line widths
"The IBD-style bars provide a cleaner view of price action, allowing you to focus on market structure without the visual noise of traditional candles."
How to Apply the IBD-Style Bars:
On your TradingView chart, select "Bars" as the chart type from the main chart type selection menu (next to the time interval options).
Right-click on the chart and select "Settings".
Go to the "Symbol" tab.
Uncheck the "Thin Bars" option to display thicker bars.
Set the "Up Color" and "Down Color" opacity to 0 for a clean IBD-style appearance.
Enable "IBD-style Candles" from the script's settings.
To revert to the original chart style, repeat the above steps and restore the default settings.
Moving Average Configuration:
The indicator automatically detects your timeframe and displays the appropriate moving averages:
Daily Timeframe Moving Averages:
10-day moving average (SMA/EMA)
21-day moving average (SMA/EMA)
50-day moving average (SMA/EMA)
200-day moving average (SMA/EMA)
Weekly Timeframe Moving Averages:
10-week moving average (SMA/EMA)
20-week moving average (SMA/EMA)
30-week moving average (SMA/EMA)
40-week moving average (SMA/EMA)
Usage Tips:
Enable "Color bars based on previous close" to identify momentum shifts based on prior candle closes
Customize colors to match your chart theme or preference
Enable only the moving averages relevant to your trading strategy
For cleaner charts, reduce the number of visible moving averages
For stock trading, the 10/21/50/200 daily and 10/40 weekly MAs are most commonly used by institutions
// Example configuration for different timeframes
if timeframe.isweekly
// Weekly configuration
showSMA1_Weekly = true // 10-week MA
showSMA4_Weekly = true // 40-week MA
else
// Daily configuration
showMA2_Daily = true // 21-day MA
showMA3_Daily = true // 50-day MA
showMA4_Daily = true // 200-day MA
While the IBD style provides clarity, remember that no visualization method guarantees trading success. Always combine with proper analysis and risk management.
If you found this indicator helpful, please consider leaving a comment or suggestion for future improvements. Happy trading!

Relative Volume CandlesVisualizes candlesticks with transparency based on volume relative to a moving average. Higher-than-average volume makes candles more opaque, while lower volume increases transparency—helping you spot significant price movements at a glance!
Features:
Customizable up/down candle colors (default: green/red)
Adjustable lookback period for volume averaging (default: 21)
Fine-tune transparency with base transparency (default: 80) and scale (default: 2.0)
Overlay directly on your chart for seamless analysis
