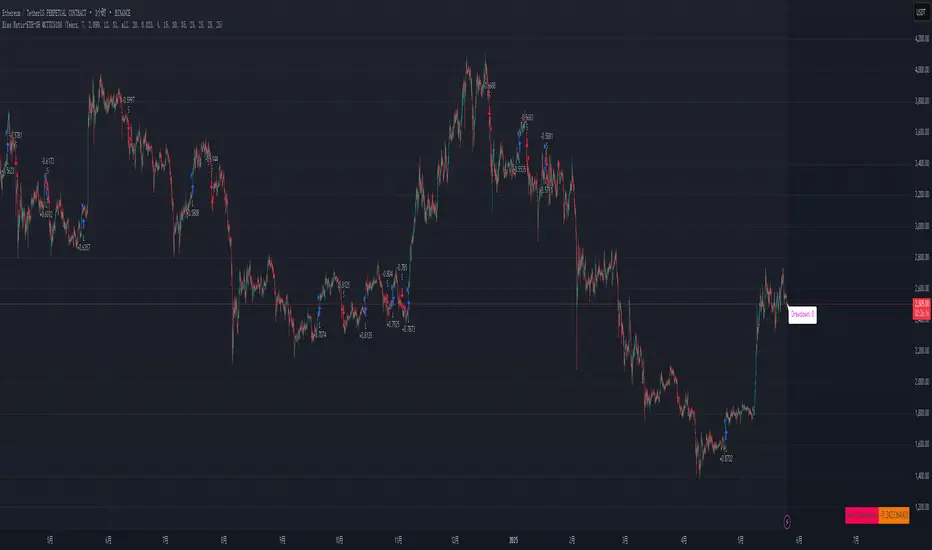
Bias Ratio-ETH-3H @CTTC5108Most of the code of this strategy should be my own original.
This Ethereum 3-hour time cycle strategy can be traced back to February 24, 2023. Although the profit and winning rate are not high, it is still relatively stable.
This strategy uses the deviation rate to enter the market. Invest 10% of the principal each time.
The limit start time adopts a rolling design (should be original).
Real-time retracement and maximum retracement are accurately calculated (should be original).
Adopt segmented stop profit (optional) design.
Open source for learning and other use.
ابحث في النصوص البرمجية عن "candle"
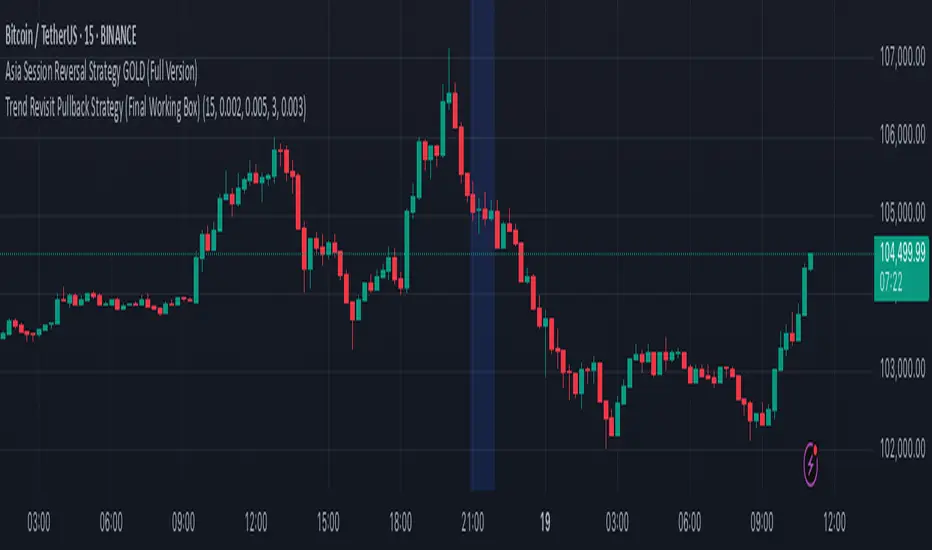
Trend Revisit Pullback Strategy (Final Working Box)📈 Trend Revisit Pullback Strategy
This TradingView Pine Script strategy identifies strong trend breakouts and accounts for natural pullbacks by:
Entering long or short on strong 1-bar breakouts
Allowing for pullback averaging if price retraces after entry
Expecting a revisit to the original entry price within 15 bars
Automatically exiting at break-even or using a custom TP/SL
Drawing a visual trade zone (entry → SL → revisit window) for easy reference
Optional labels and color-coded boxes to track each trade’s lifecycle
Ideal for trend traders who anticipate a pullback and prefer to manage risk with break-even exits or reward-to-risk parameters.
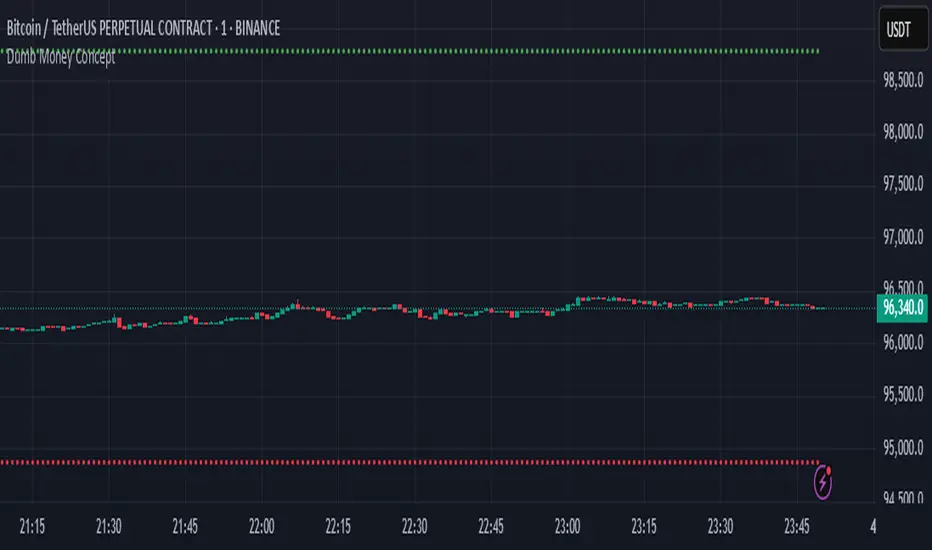
Dumb Money ConceptUse in 1 minute timeframe
1. Strategy setup
Name & sizing: Trades 25% of your account on each signal, assumes 0.04% commission + 2‑tick slippage, starts with a notional 10 million.
Timing: Only makes decisions at each 1‑minute bar close, and processes orders at bar‑close.
2. Optional filters (both default to off)
Volatility filter : when on, requires that yesterday’s ATR (average true range) ≥ your threshold before even placing an entry.
Trend filter : when on, only allows a “long” if yesterday’s close was above its daily MA, or a “short” if below.
You can toggle each filter on/off and adjust ATR period, ATR threshold, and MA length through the inputs at the top.
3. Signal logic (“dumb money” wicks)
At today’s first minute, the script pulls yesterday’s open, high, low, close, ATR and MA—using only completed daily bars so nothing repaints.
It measures the size of yesterday’s upper wick (close→high) vs. lower wick (open→low).
If the upper wick was longer, that sets a long bias (“dumb money” got shaken out at the top). Otherwise it sets a short bias.
4. Calculate where to place orders
On that same first minute of day:
Entry: a limit order at half of yesterday’s range away from today’s open (below the open for longs, above for shorts).
Stop‑loss: one full‑range (×1.0) below today’s open for longs (and above for shorts).
Take‑profit: 1.236× yesterday’s range above today’s open for longs (and below for shorts).
5. Apply filters before sending entry
Before actually placing that limit order, it checks:
Volatility: if enabled, requires yesterday’s ATR ≥ your “Min Daily ATR.”
Trend: if enabled, requires yesterday’s close to lie on the same side of its daily MA as your signal.
If either filter fails, no order is sent.
6. Give the limit order up to 24 hours to fill
The code remembers the bar‑index when the order went live.
If 1440 one‑minute bars pass (≈24 h) without a fill, it automatically cancels the unfilled entry—so stale orders don’t hang around.
7. Once filled, TP/SL manage the trade
As soon as your limit order executes, two opposite orders are placed:
A take‑profit at the 1.236× range level
A stop‑loss at the –1.0× range level
One cancels the other when triggered.
8. No overnight risk
On the very first minute of the next daily bar, any position still open is force‑closed (“Time Exit”)
Price Flip StrategyPrice Flip Strategy with User-Defined Ticker Max/Max
This strategy leverages an inverted price calculation based on user-defined maximum and minimum price levels over customizable lookback periods. It generates buy and sell signals by comparing the previous bar's original price to the inverted price, within a specified date range. The script plots key metrics, including ticker max/min, original and inverted prices, moving averages, and HLCC4 averages, with customizable visibility toggles and labels for easy analysis.
Key Features:
Customizable Inputs: Set lookback periods for ticker max/min, moving average length, and date range for signal generation.
Inverted Price Logic: Calculates an inverted price using ticker max/min to identify trading opportunities.
Flexible Visualization: Toggle visibility for plots (e.g., ticker max/min, prices, moving averages, HLCC4 averages) and last-bar labels with user-defined colors and sizes.
Trading Signals: Generates buy signals when the previous original price exceeds the inverted price, and sell signals when it falls below, with alerts for real-time notifications.
Labeling: Displays values on the last bar for all plotted metrics, aiding in quick reference.
How to Use:
Add to Chart: Apply the script to a TradingView chart via the Pine Editor.
Configure Settings:
Date Range: Set the start and end dates to define the active trading period.
Ticker Levels: Adjust the lookback periods for calculating ticker max and min (e.g., 100 bars for max, 100 for min).
Moving Averages: Set the length for exponential moving averages (default: 20 bars).
Plots and Labels: Enable/disable specific plots (e.g., Inverted Price, Original HLCC4) and customize label colors/sizes for clarity.
Interpret Signals:
Buy Signal: Triggered when the previous close price is above the inverted price; marked with an upward label.
Sell Signal: Triggered when the previous close price is below the inverted price; marked with a downward label.
Set Alerts: Use the built-in alert conditions to receive notifications for buy/sell signals.
Analyze Plots: Review plotted lines (e.g., ticker max/min, HLCC4 averages) and last-bar labels to assess price behavior.
Tips:
Use in trending markets by enabling ticker max for uptrends or ticker min for downtrends, as indicated in tooltips.
Adjust the label offset to prevent overlapping text on the last bar.
Test the strategy on a demo account to optimize lookback periods and moving average settings for your asset.
Disclaimer: This script is for educational purposes and should be tested thoroughly before use in live trading. Past performance is not indicative of future results.

RSI Divergence Strategy - AliferCryptoStrategy Overview
The RSI Divergence Strategy is designed to identify potential reversals by detecting regular bullish and bearish divergences between price action and the Relative Strength Index (RSI). It automatically enters positions when a divergence is confirmed and manages risk with configurable stop-loss and take-profit levels.
Key Features
Automatic Divergence Detection: Scans for RSI pivot lows/highs vs. price pivots using user-defined lookback windows and bar ranges.
Dual SL/TP Methods:
- Swing-based: Stops placed a configurable percentage beyond the most recent swing high/low.
- ATR-based: Stops placed at a multiple of Average True Range, with a separate risk/reward multiplier.
Long and Short Entries: Buys on bullish divergences; sells short on bearish divergences.
Fully Customizable: Input groups for RSI, divergence, swing, ATR, and general SL/TP settings.
Visual Plotting: Marks divergences on chart and plots stop-loss (red) and take-profit (green) lines for active trades.
Alerts: Built-in alert conditions for both bullish and bearish RSI divergences.
Detailed Logic
RSI Calculation: Computes RSI of chosen source over a specified period.
Pivot Detection:
- Identifies RSI pivot lows/highs by scanning a lookback window to the left and right.
- Uses ta.barssince to ensure pivots are separated by a minimum/maximum number of bars.
Divergence Confirmation:
- Bullish: Price makes a lower low while RSI makes a higher low.
- Bearish: Price makes a higher high while RSI makes a lower high.
Entry:
- Opens a Long position when bullish divergence is true.
- Opens a Short position when bearish divergence is true.
Stop-Loss & Take-Profit:
- Swing Method: Computes the recent swing high/low then adjusts by a percentage margin.
- ATR Method: Uses the current ATR × multiplier applied to the entry price.
- Take-Profit: Calculated as entry price ± (risk × R/R ratio).
Exit Orders: Uses strategy.exit to place bracket orders (stop + limit) for both long and short positions.
Inputs and Configuration
RSI Settings: Length & price source for the RSI.
Divergence Settings: Pivot lookback parameters and valid bar ranges.
SL/TP Settings: Choice between Swing or ATR method.
Swing Settings: Swing lookback length, margin (%), and risk/reward ratio.
ATR Settings: ATR length, stop multiplier, and risk/reward ratio.
Usage Notes
Adjust the Pivot Lookback and Range values to suit the volatility and timeframe of your market.
Use higher ATR multipliers for wider stops in choppy conditions, or tighten swing margins in trending markets.
Backtest different R/R ratios to find the balance between win rate and reward.
Disclaimer
This script is for educational purposes only and does not constitute financial advice. Trading carries significant risk and you may lose more than your initial investment. Always conduct your own research and consider consulting a professional before making any trading decisions.

Trend Strategy + Impulse FilterThis is a Trend Strategy + Impulse Filter designed for trading in a dynamic market using both Simple Moving Average (SMA) and MACD indicators for trend and momentum analysis. The strategy includes risk management features like Stop Loss, Take Profit, and Trailing Stop to secure gains and limit losses. Additionally, it uses a Breakout Filter for confirmation, ensuring trades are taken only when the price breaks out from a specified range.
Key Features:
Trend Filter: Enter long when the price is above the SMA and MACD line crosses above the signal line. Enter short when the price is below the SMA and MACD line crosses below the signal line.
Breakout Filter: Only takes trades if the price breaks the previous high (for long) or low (for short) within a defined lookback period.
Risk Management: Set stop-loss and take-profit levels based on ATR for dynamic risk management.
Trailing Stop: Locks profits as the price moves in favor of the trade.
Position Sizing: Trade size is based on a percentage of the current equity.
Customizable Parameters: All indicators and risk management settings are adjustable to fit individual preferences.
This strategy is suitable for traders looking for a comprehensive approach that combines trend-following, momentum, and breakout filtering with solid risk management.
Ukrainian Description:
Це стратегія Trend + Impulse Filter, розроблена для торгівлі на динамічному ринку, використовуючи індикатори Простого ковзаючого середнього (SMA) та MACD для аналізу тренду та імпульсу. Стратегія включає в себе функції управління ризиками, такі як Stop Loss, Take Profit та Trailing Stop, щоб забезпечити прибутки та обмежити збитки. Крім того, вона використовує Breakout Filter для підтвердження, забезпечуючи виконання угод лише тоді, коли ціна пробиває визначений діапазон.
Основні характеристики:
Фільтр тренду: Вхід у лонг, коли ціна вище SMA, і MACD лінія перетинає сигнальну лінію знизу вгору. Вхід у шорт, коли ціна нижча за SMA, і MACD лінія перетинає сигнальну лінію зверху вниз.
Фільтр пробою: Торгові угоди відкриваються лише в разі пробою попереднього максимуму (для лонга) або мінімуму (для шорта) протягом заданого періоду.
Управління ризиками: Стоп-лосс та тейк-профіт визначаються на основі ATR для динамічного управління ризиками.
Trailing Stop: Фіксує прибутки, коли ціна рухається в бік угоди.
Розмір позиції: Розмір угоди залежить від відсотка від поточного балансу.
Налаштовувані параметри: Усі індикатори та налаштування управління ризиками можна відкоригувати відповідно до індивідуальних уподобань.
Ця стратегія підходить для трейдерів, які шукають комплексний підхід, що поєднує слідкування за трендом, імпульсом та фільтрацією пробоїв із надійним управлінням ризиками.

TrendSync Pro (SMC)📊 TrendSync Pro (SMC) – Advanced Trend-Following Strategy with HTF Alignment
Created by Shubham Singh
🔍 Strategy Overview
TrendSync Pro (SMC) is a precision-based smart trend-following strategy inspired by Smart Money Concepts (SMC). It combines: Real-time pivot-based trendline detection
Higher Time Frame (HTF) filtering to align trades with dominant trend
Risk management via adjustable Stop Loss (SL) and Take Profit (TP)
Directional control — trade only bullish, bearish, or both setups
Realistic backtesting using commissions and slippage
Pre-optimized profiles for scalpers, intraday, swing, and long-term traders
🧠 How It Works:
🔧 Strategy Settings Image:
beeimg.com
The strategy dynamically identifies trend direction by using swing high/low pivots. When a new pivot forms: It draws a trendline from the last significant pivot
Detects whether the trend is up (based on pivot lows) or down (based on pivot highs)
Waits for price to break above/below the trendline
Confirms with HTF price direction (HTF close > previous HTF close = bullish)
Only then it triggers a long or short trade
It exits either at TP, SL, or a manual trendline break
🛠️ Adjustable Parameters:
Trend Period: Length for pivot detection (affects sensitivity of trendlines)
HTF Timeframe: Aligns lower timeframe entries with higher timeframe direction
SL% and TP%: Customize your risk-reward profile
Commission & Slippage: Make backtests more realistic
Trade Direction: Choose to trade: Long only, Short only, or Both
🎛️ Trade Direction Control:
In settings, you can choose: Bullish Only: Executes only long entries
Bearish Only: Executes only short entries
Both: Executes both long and short entries when conditions are met
This allows you to align trades with your own market bias or external analysis.
📈 Entry Logic: Long Entry:
• Price crosses above trendline
• HTF is bullish (HTF close > previous close)
• Latest pivot is a low (trend is considered up)
Short Entry:
• Price crosses below trendline
• HTF is bearish (HTF close < previous close)
• Latest pivot is a high (trend is considered down)
📉 Exit Logic: Hit Take Profit or Stop Loss
Manual trendline invalidation: If price crosses opposite of the trend direction
⏰ Best Timeframes & Recommended Settings:
Scalping (1m to 5m):
HTF = 15m | Trend Period = 7
SL = 0.5% | TP = 1% to 2%
Intraday (15m to 30m):
HTF = 1H | Trend Period = 10–14
SL = 0.75% | TP = 2% to 3%
6 Hour Trading (30m to 1H):
HTF = 4H | Trend Period = 20
SL = 1% | TP = 4% to 6%
Swing Trading (4H to 1D):
HTF = 1D | Trend Period = 35
SL = 2% | TP = 8% to 12%
Long-Term Investing (1D+):
HTF = 1W | Trend Period = 50
SL = 3% | TP = 15%+
Note: These are recommended base settings. Adjust based on volatility, asset class, or personal trading style.
📸 Testing Note:
beeimg.com
TradingView limits test length to 20k bars (~40 trades on smaller timeframes). To show long-term results: Test on higher timeframes (e.g., 1H, 4H, 1D)
Share images of backtest result in description
Host longer test result screenshots on Imgur or any public drive
📍 Asset Behavior Insight:
This strategy works on multiple assets, including BTC, ETH, etc.
Performance varies by trend strength:
Sometimes BTC performs better than ETH
Other times ETH gives better results
That’s normal as both assets follow different volatility and trend behavior
It’s a trend-following setup. Longer and clearer the trend → better the results.
✅ Best Practices: Avoid ranging markets
Use proper SL/TP for each timeframe
Use directional filter if you already have a directional bias
Always forward test before going live
⚠️ Trading Disclaimer:
This script is for educational and backtesting purposes only. Trading involves risk. Always use risk management and never invest more than you can afford to lose.

GQT GPT - Volume-based Support & Resistance Zones V2搞钱兔,搞钱是为了更好的生活。
Title: GQT GPT - Volume-based Support & Resistance Zones V2
Overview:
This strategy is implemented in PineScript v5 and is designed to identify key support and resistance zones based on volume-driven fractal analysis on a 1-hour timeframe. It computes fractal high points (for resistance) and fractal low points (for support) using volume moving averages and specific price action criteria. These zones are visually represented on the chart with customizable lines and zone fills.
Trading Logic:
• Entry: The strategy initiates a long position when the price crosses into the support zone (i.e., when the price drops into a predetermined support area).
• Exit: The long position is closed when the price enters the resistance zone (i.e., when the price rises into a predetermined resistance area).
• Time Frame: Trading signals are generated solely from the 1-hour chart. The strategy is only active within a specified start and end date.
• Note: Only long trades are executed; short selling is not part of the strategy.
Visualization and Parameters:
• Support/Resistance Zones: The zones are drawn based on calculated fractal values, with options to extend the lines to the right for easier tracking.
• Customization: Users can configure the appearance, such as line style (solid, dotted, dashed), line width, colors, and label positions.
• Volume Filtering: A volume moving average threshold is used to confirm the fractal signals, enhancing the reliability of the support and resistance levels.
• Alerts: The strategy includes alert conditions for when the price enters the support or resistance zones, allowing for timely notifications.
⸻
搞钱兔,搞钱是为了更好的生活。
标题: GQT GPT - 基于成交量的支撑与阻力区间 V2
概述:
本策略使用 PineScript v5 实现,旨在基于成交量驱动的分形分析,在1小时级别的图表上识别关键支撑与阻力区间。策略通过成交量移动平均线和特定的价格行为标准计算分形高点(阻力)和分形低点(支撑),并以自定义的线条和区间填充形式直观地显示在图表上。
交易逻辑:
• 进场条件: 当价格进入支撑区间(即价格跌入预设支撑区域)时,策略在没有持仓的情况下发出做多信号。
• 离场条件: 当价格进入阻力区间(即价格上升至预设阻力区域)时,持有多头头寸则会被平仓。
• 时间范围: 策略的信号仅基于1小时级别的图表,并且仅在指定的开始日期与结束日期之间生效。
• 备注: 本策略仅执行多头交易,不进行空头操作。
可视化与参数设置:
• 支撑/阻力区间: 根据计算得出的分形值绘制支撑与阻力线,可选择将线条延伸至右侧,便于后续观察。
• 自定义选项: 用户可以调整线条样式(实线、点线、虚线)、线宽、颜色及标签位置,以满足个性化需求。
• 成交量过滤: 策略使用成交量移动平均阈值来确认分形信号,提高支撑和阻力区间的有效性。
• 警报功能: 当价格进入支撑或阻力区间时,策略会触发警报条件,方便用户及时关注市场变化。
⸻

Reversal & Breakout Strategy with ORB### Reversal & Breakout Strategy with ORB
This strategy combines three distinct trading approaches—reversals, trend breakouts, and opening range breakouts (ORB)—into a single, cohesive system. The goal is to capture high-probability setups across different market conditions, leveraging a mashup of technical indicators for confirmation and risk management. Below, I’ll explain why this combination works, how the components interact, and how to use it effectively.
#### Why the Mashup?
- **Reversals**: Identifies overextended moves using RSI (overbought/oversold) and SMA50 crosses, filtered by VWAP and SMA200 trend direction. This targets mean-reversion opportunities in trending markets.
- **Breakouts**: Uses EMA9/EMA20 crossovers with VWAP and SMA200 confirmation to catch momentum-driven trend continuations.
- **Opening Range Breakout (ORB)**: Detects early momentum by breaking the high/low of a user-defined opening range (default: 15 bars) with volume confirmation. This adds a time-based edge, ideal for intraday trading.
The synergy comes from blending these methods: reversals catch pullbacks, breakouts ride trends, and ORB exploits early volatility—all filtered by trend (SMA200) and anchored by VWAP for context.
#### How It Works
1. **Indicators**:
- **EMA9/EMA20**: Fast-moving averages for breakout signals.
- **SMA50**: Medium-term trend filter for reversals.
- **SMA200**: Long-term trend direction to align trades.
- **RSI (14)**: Measures overbought (>70) or oversold (<30) conditions.
- **VWAP**: Acts as a dynamic support/resistance level.
- **ATR (14)**: Sets stop-loss distance (default: 1.5x ATR).
- **Volume**: Confirms ORB breakouts (1.5x average volume of opening range).
2. **Entry Conditions**:
- **Long**: Triggers on reversal (SMA50 cross + RSI < 30 + below VWAP + uptrend), breakout (EMA9 > EMA20 + above VWAP + uptrend), or ORB (break above opening range high + volume).
- **Short**: Triggers on reversal (SMA50 cross + RSI > 70 + above VWAP + downtrend), breakout (EMA9 < EMA20 + below VWAP + downtrend), or ORB (break below opening range low + volume).
3. **Risk Management**:
- Risks 5% of equity per trade (based on the initial capital set in the strategy tester).
- Stop-loss: Based on lowest low/highest high over 7 bars ± 1.5x ATR.
- Targets: Two exits at 1:1 and 1:2 risk:reward (50% of position at each).
- Break-even: Stop moves to entry price after the first target is hit.
4. **Backtesting Settings**:
- Commission: Hardcoded at 0.1% per trade (realistic for most brokers).
- Slippage: Hardcoded at 2 ticks (realistic for most markets).
- Tested on datasets yielding 100+ trades (e.g., 2-min or 5-min charts over months).
#### How to Use It
- **Timeframe**: Works best on intraday (2-min, 5-min) or daily charts. Adjust `Opening Range Bars` (e.g., 15 bars = 30 min on 2-min chart) for your timeframe.
- **Settings**:
- Set your initial equity in the TradingView strategy tester’s "Properties" tab under "Initial Capital" (e.g., $10,000). The script automatically risks 5% of this equity per trade.
- Adjust `Stop Loss ATR Multiplier` or `Risk:Reward Targets` based on your risk tolerance.
- Note that commission (0.1%) and slippage (2 ticks) are fixed in the script for backtesting consistency.
- **Execution**: Enter on signal, monitor plotted stop (red) and targets (green/blue). The strategy supports pyramiding (up to 2 positions) for scaling into trends.
#### Backtesting Notes
Results are realistic with commission (0.1%) and slippage (2 ticks) included. For a sufficient sample, test on volatile instruments (e.g., stocks, forex) over 3-6 months on lower timeframes. The default 1.5x ATR stop may seem wide, but it’s justified to avoid premature exits in volatile markets—feel free to tweak it with justification. The script assumes an initial capital of $10,000 in the strategy tester for the 5% risk calculation (e.g., $500 risk per trade); adjust this in the "Properties" tab as needed.
This mashup isn’t just a random mix; it’s a deliberate fusion of complementary strategies, offering traders flexibility across market phases. Questions? Let me know!

ETH/USDT EMA Crossover Strategy - OptimizedStrategy Name: EMA Crossover Strategy for ETH/USDT
Description:
This trading strategy is designed for the ETH/USDT pair and is based on exponential moving average (EMA) crossovers combined with momentum and volatility indicators. The strategy uses multiple filters to identify high-probability signals in both bullish and bearish trends, making it suitable for traders looking to trade in trending markets.
Strategy Components
EMAs (Exponential Moving Averages):
EMA 200: Used to identify the primary trend. If the price is above the EMA 200, it is considered a bullish trend; if below, a bearish trend.
EMA 50: Acts as an additional filter to confirm the trend.
EMA 20 and EMA 50 Short: These short-term EMAs generate entry signals through crossovers. A bullish crossover (EMA 20 crosses above EMA 50 Short) is a buy signal, while a bearish crossover (EMA 20 crosses below EMA 50 Short) is a sell signal.
RSI (Relative Strength Index):
The RSI is used to avoid overbought or oversold conditions. Long trades are only taken when the RSI is above 30, and short trades when the RSI is below 70.
ATR (Average True Range):
The ATR is used as a volatility filter. Trades are only taken when there is sufficient volatility, helping to avoid false signals in quiet markets.
Volume:
A volume filter is used to confirm sufficient market participation in the price movement. Trades are only taken when volume is above average.
Strategy Logic
Long Trades:
The price must be above the EMA 200 (bullish trend).
The EMA 20 must cross above the EMA 50 Short.
The RSI must be above 30.
The ATR must indicate sufficient volatility.
Volume must be above average.
Short Trades:
The price must be below the EMA 200 (bearish trend).
The EMA 20 must cross below the EMA 50 Short.
The RSI must be below 70.
The ATR must indicate sufficient volatility.
Volume must be above average.
How to Use the Strategy
Setup:
Add the script to your ETH/USDT chart on TradingView.
Adjust the parameters according to your preferences (e.g., EMA periods, RSI, ATR, etc.).
Signals:
Buy and sell signals will be displayed directly on the chart.
Long trades are indicated with an upward arrow, and short trades with a downward arrow.
Risk Management:
Use stop-loss and take-profit orders in all trades.
Consider a risk-reward ratio of at least 1:2.
Backtesting:
Test the strategy on historical data to evaluate its performance before using it live.
Advantages of the Strategy
Trend-focused: The strategy is designed to trade in trending markets, increasing the probability of success.
Multiple filters: The use of RSI, ATR, and volume reduces false signals.
Adaptability: It can be adjusted for different timeframes, although it is recommended to test it on 5-minute and 15-minute charts for ETH/USDT.
Warnings
Sideways markets: The strategy may generate false signals in markets without a clear trend. It is recommended to avoid trading in such conditions.
Optimization: Make sure to optimize the parameters according to the market and timeframe you are using.
Risk management: Never trade without stop-loss and take-profit orders.
Author
Jose J. Sanchez Cuevas
Version
v1.0

Grease Trap V1.0The Grease Trap V1.0 indicator is a dynamic, Fibonacci-based strategy that calculates unique moving averages to generate trading signals. Below is an overview of its main components and functionality:
How It Works
Fibonacci Grouped Averages:
Dynamic Fibonacci Sequence:
The indicator uses a custom function that dynamically builds a Fibonacci sequence. The user can set the number of Fibonacci elements for two separate calculations:
One for the Indicator Average (default: 9 elements).
One for the Base Average (default: 14 elements).
Grouped Averaging:
Using these Fibonacci numbers, the script groups historical closing prices into segments. For each group (with a length determined by a Fibonacci number), it computes an average. These individual group averages are then averaged together to produce a single dynamic average.
Plotting and Visual Cues:
Two Lines:
The indicator plots two lines on the chart:
Primary Dynamic Fibonacci Grouped Average
Base Dynamic Fibonacci Grouped Average
Color Coding:
The colors of these lines change based on their relationship to the current high price and to each other. For example, if the primary average is above the high or crosses above the base average, it might be shown in green or yellow, whereas certain conditions trigger red, signaling caution.
Crossover Dots:
When the primary average crosses above the base (a bullish signal), a green dot is plotted. Conversely, when it crosses below (a bearish signal), a red dot is displayed. These dots help visually pinpoint the moments of potential trade entry or exit.
Trading Signals and Orders:
Buy Signal:
Triggered when the primary average crosses above the base average. On a buy signal:
If in a short position, it closes that position.
Then, it enters a long position.
Sell Signal:
Triggered when the primary average crosses below the base average. On a sell signal:
If in a long position, it closes that position.
Then, it enters a short position.
Profit Target Management:
The indicator includes automated profit management:
For long positions, it sets an exit order when the price rises by a user-defined percentage (default: 2%).
For short positions, it sets an exit order when the price falls by a similar percentage.
Alerts:
The script is equipped with alert conditions. Traders receive notifications whenever a buy or sell signal is generated, helping them stay on top of potential trading opportunities.
Customization
User Inputs:
Traders can adjust:
The number of Fibonacci elements for each average calculation.
Profit target percentages for both long and short positions.
Data Length Requirement:
The script ensures it uses at least 200 data points (or the total number of available bars, whichever is greater) for a robust calculation of the averages.
In Summary
The Grease Trap V1.0 indicator combines the mathematical elegance of Fibonacci sequences with dynamic grouped averaging. It offers:
Innovative Moving Averages: Based on Fibonacci groupings of historical price data.
Clear Visual Cues: Through color-coded lines and crossover dots.
Automated Trading Actions: With built-in order management and profit targets.
Alert Notifications: So traders are instantly aware of key market signals.
This makes the Grease Trap V1.0 a comprehensive tool for both signal generation and automated strategy execution, suitable for traders looking to integrate Fibonacci principles into their trading systems.

Hierarchical + K-Means Clustering Strategy===== USER GUIDE =====
Hierarchical + K-Means Clustering Strategy
OVERVIEW:
This strategy combines hierarchical clustering and K-means algorithms to analyze market volatility patterns
and generate trading signals. It uses a modified SuperTrend indicator with ATR-based volatility clustering
to identify potential trend changes and market conditions.
KEY FEATURES:
- Advanced volatility analysis using hierarchical clustering and K-means algorithms
- Modified SuperTrend indicator for trend identification
- Multiple filter options including moving average and ADX trend strength
- Volume-based exit mechanism to protect profits
- Customizable appearance settings
SETTINGS EXPLANATION:
1. SuperTrend Settings:
- ATR Length: Period for ATR calculation (default: 11)
- SuperTrend Factor: Multiplier for ATR to determine trend bands (default: 3)
2. Hierarchical Clustering Settings:
- Training Data Length: Number of bars used for clustering analysis (default: 200)
3. Appearance Settings:
- Transparency 1 & 2: Control the opacity of trend lines and fills
- Bullish/Bearish Color: Colors for uptrend and downtrend visualization
4. Time Settings:
- Start Year/Month: Define when the strategy should start executing trades
5. Filter Settings:
- Moving Average Filter: Uses SMA to filter trades (only enter when price is on correct side of MA)
- Trend Strength Filter: Uses ADX to ensure trades are taken in strong trend conditions
6. Volume Stop Loss Settings:
- Volume Ratio Threshold: Controls sensitivity of volume-based exits
- Monitoring Delay Bars: Number of bars to wait before monitoring volume for exit signals
HOW TO USE:
1. Apply the indicator to your chart
2. Adjust settings according to your trading preferences and timeframe
3. Long signals appear when price crosses above the SuperTrend line (▲k marker)
4. Short signals appear when price crosses below the SuperTrend line (▼k marker)
5. The strategy automatically manages exits based on volume balance conditions
INTERPRETATION:
- Green line/area: Bullish trend - consider long positions
- Red line/area: Bearish trend - consider short positions
- Yellow line: Moving average for additional trend confirmation
- Volume balance exits occur when buying/selling pressure equalizes
RECOMMENDED TIMEFRAMES:
This strategy works best on 1H, 4H, and daily charts for most markets.
For highly volatile assets, shorter timeframes may also be effective.
RISK MANAGEMENT:
Always use proper position sizing and consider setting additional stop losses
beyond the strategy's built-in exit mechanisms.
===== END OF USER GUIDE =====

MH Strategy – Hull Moving Average-Based Trading StrategyThe MH Strategy is a TradingView strategy that leverages the Hull Moving Average (HullMA) to generate precise buy and sell signals. This strategy is designed to identify trend reversals and momentum shifts using a combination of weighted moving averages and HullMA-based calculations.
Key Features:
✅ Hull Moving Average-Based Signals – Uses a modified HullMA calculation to detect trend changes.
✅ Dynamic Support & Resistance – The strategy plots adaptive levels that act as dynamic entry and exit points.
✅ Trend-Based Entries & Exits – Generates long (buy) signals when the price moves above the calculated Hull retraction level and short (sell) signals when the price moves below it.
✅ Automated Trade Execution – Integrates with TradingView’s strategy function to open and close trades automatically based on signal conditions.
✅ Customizable Parameters – Allows users to adjust the HullMA period and price data source to optimize performance across different markets and timeframes.
How It Works:
HullMA Calculation: The strategy calculates a smoothed Hull Moving Average (HullMA) using a two-step weighted moving average method.
Trend Confirmation: The difference between the HullMA values helps determine trend direction and retraction levels.
Entry Conditions:
A buy signal is generated when the price is above the retraction level, and the previous price confirms the trend.
A sell signal is triggered when the price is below the retraction level with trend confirmation.
Exit Conditions:
The strategy closes long trades when the price drops below a threshold.
It closes short trades when the price rises above a set level.
Ideal Use Cases:
🔹 Swing & trend traders looking for momentum-based entries and exits.
🔹 Traders aiming for reduced lag compared to traditional moving averages.
🔹 Markets with strong price trends, such as forex, stocks, and crypto.
Try the MH Strategy and enhance your trading decisions with a refined HullMA-based trend detection system! 🚀

Pure Price Action Breakout with 1:5 RR
Description of the Price Action Trading Script (Pine Script v6)
Overview
This script is a pure price action-based breakout strategy designed for TradingView. It identifies key breakout levels and executes long and short trades based on market structure. The strategy ensures a minimum risk-to-reward ratio (RR) of 1:5, aiming for high profitability with well-defined stop-loss and take-profit levels.
How the Script Works
1️⃣ Breakout Identification
The script uses a lookback period to find the highest high and lowest low over the last n bars.
A bullish breakout occurs when the price closes above the previous highest high.
A bearish breakout happens when the price closes below the previous lowest low.
2️⃣ Entry & Exit Strategy
Long Entry: If a bullish breakout is detected, the script enters a long position.
Short Entry: If a bearish breakout is detected, the script enters a short position.
The stop-loss is placed at the recent swing low (for long trades) or recent swing high (for short trades).
The target price is calculated based on a risk-to-reward ratio of 1:5, ensuring profitable trades.
3️⃣ Risk Management
The stop-loss prevents excessive losses by exiting trades when the market moves unfavorably.
The strategy ensures that each trade has a reward potential at least 5 times the risk.
Positions are executed based on price action only, without indicators like moving averages or RSI.
4️⃣ Visual Representation
The script plots breakout levels to help traders visualize potential trade setups.
Entry points, stop-loss, and take-profit levels are labeled on the chart for easy tracking.
Key Features & Benefits
✔ Pure Price Action – No lagging indicators, only real-time price movements.
✔ High Risk-to-Reward Ratio (1:5) – Ensures high-profit potential trades.
✔ Real-time Entry & Exit Signals – Provides accurate trade setups.
✔ Dynamic Stop-loss Calculation – Adjusts based on recent market structure.
✔ Customizable Parameters – Lookback periods and risk ratios can be modified.

ICT NY Kill Zone Auto Trading### **ICT NY Kill Zone Auto Trading Strategy (5-Min Chart)**
#### **Overview:**
This strategy is based on Inner Circle Trader (ICT) concepts, focusing on the **New York Kill Zone**. It is designed for trading GBP/USD exclusively on the **5-minute chart**, automatically entering and exiting trades during the US session.
#### **Key Components:**
1. **Time Filter**
- The strategy only operates during the **New York Kill Zone (9:30 AM - 11:00 AM NY Time)**.
- It ensures execution only on the **5-minute timeframe**.
2. **Fair Value Gaps (FVGs) Detection**
- The script identifies areas where price action left an imbalance, known as Fair Value Gaps (FVGs).
- These gaps indicate potential liquidity zones where price may return before continuing in the original direction.
3. **Order Blocks (OBs) Identification**
- **Bullish Order Block:** Occurs when price forms a strong bullish pattern, suggesting further upside movement.
- **Bearish Order Block:** Identified when a strong bearish formation signals potential downside continuation.
4. **Trade Execution**
- **Long Trade:** Entered when a bullish order block forms within the NY Kill Zone and aligns with an FVG.
- **Short Trade:** Entered when a bearish order block forms within the Kill Zone and aligns with an FVG.
5. **Risk Management**
- **Stop Loss:** Fixed at **30 pips** to limit downside risk.
- **Take Profit:** Set at **60 pips**, providing a **2:1 risk-reward ratio**.
6. **Visual Aids**
- The **Kill Zone is highlighted in blue** to help traders visually confirm the active session.
**Objective:**
This script aims to **capitalize on institutional price movements** within the New York session by leveraging ICT concepts such as FVGs and Order Blocks. By automating trade entries and exits, it eliminates emotions and ensures a disciplined trading approach.

Ultimate T3 Fibonacci for BTC Scalping. Look at backtest report!Hey Everyone!
I created another script to add to my growing library of strategies and indicators that I use for automated crypto trading! This strategy is for BITCOIN on the 30 minute chart since I designed it to be a scalping strategy. I calculated for trading fees, and use a small amount of capital in the backtest report. But feel free to modify the capital and how much per order to see how it changes the results:)
It is called the "Ultimate T3 Fibonacci Indicator by NHBprod" that computes and displays two T3-based moving averages derived from price data. The t3_function calculates the Tilson T3 indicator by applying a series of exponential moving averages to a combined price metric and then blending these results with specific coefficients derived from an input factor.
The script accepts several user inputs that toggle the use of the T3 filter, select the buy signal method, and set parameters like lengths and volume factors for two variations of the T3 calculation. Two T3 lines, T3 and T32, are computed with different parameters, and their colors change dynamically (green/red for T3 and blue/purple for T32) based on whether the lines are trending upward or downward. Depending on the selected signal method, the script generates buy signals either when T32 crosses over T3 or when the closing price is above T3, and similarly, sell signals are generated on the respective conditions for crossing under or closing below. Finally, the indicator plots the T3 lines on the chart, adds visual buy/sell markers, and sets alert conditions to notify users when the respective trading signals occur.
The user has the ability to tune the parameters using TP/SL, date timerames for analyses, and the actual parameters of the T3 function including the buy/sell signal! Lastly, the user has the option of trading this long, short, or both!
Let me know your thoughts and check out the backtest report!

Advanced Multi-Timeframe Trading System (Risk Managed)Description:
This strategy is an original approach that combines two main analytical components to identify potential trade opportunities while simulating realistic trading conditions:
1. Market Trend Analysis via an Approximate Hurst Exponent
• What It Does:
The strategy computes a rough measure of market trending using an approximate Hurst exponent. A value above 0.5 suggests persistent, trending behavior, while a value below 0.5 indicates a tendency toward mean-reversion.
• How It’s Used:
The Hurst exponent is calculated on both the chart’s current timeframe and a higher timeframe (default: Daily) to capture both local and broader market dynamics.
2. Fibonacci Retracement Levels
• What It Does:
Using daily high and low data from a selected timeframe (default: Daily), the script computes key Fibonacci retracement levels.
• How It’s Used:
• The 61.8% level (Golden Ratio) serves as a key threshold:
• A long entry is signaled when the price crosses above this level if the daily Hurst exponent confirms a trending market.
• The 38.2% level is used to identify short-entry opportunities when the price crosses below it and the daily Hurst indicates non-trending conditions.
Signal Logic:
• Long Entry:
When the price crosses above the 61.8% Fibonacci level (Golden Ratio) and the daily Hurst exponent is greater than 0.5, suggesting a trending market.
• Short Entry:
When the price crosses below the 38.2% Fibonacci level and the daily Hurst exponent is less than 0.5, indicating a less trending or potentially reversing market.
Risk Management & Trade Execution:
• Stop-Loss:
Each trade is risk-managed with a stop-loss set at 2% below (for longs) or above (for shorts) the entry price. This ensures that no single trade risks more than a small, sustainable portion of the account.
• Take Profit:
A take profit order targets a risk-reward ratio of 1:2 (i.e., the target profit is twice the amount risked).
• Position Sizing:
Trades are executed with a fixed position size equal to 10% of account equity.
• Trade Frequency Limits:
• Daily Limit: A maximum of 5 trades per day
• Overall Limit: No more than 510 trades during the backtesting period (e.g., since 2019)
These limits are imposed to simulate realistic trading frequency and to avoid overtrading in backtest results.
Backtesting Parameters:
• Initial Capital: $10,000
• Commission: 0.1% per trade
• Slippage: 1 tick per bar
These settings aim to reflect the conditions faced by the average trader and help ensure that the backtesting results are realistic and not misleading.
Chart Overlays & Visual Aids:
• Fibonacci Levels:
The key Fibonacci retracement levels are plotted on the chart, and the zone between the 61.8% and 38.2% levels is highlighted to show a key retracement area.
• Market Trend Background:
The chart background is tinted green when the daily Hurst exponent indicates a trending market (value > 0.5) and red otherwise.
• Information Table:
An on-chart table displays key parameters such as the current Hurst exponent, daily Hurst value, the number of trades executed today, and the global trade count.
Disclaimer:
Past performance is not indicative of future results. This strategy is experimental and provided solely for educational purposes. It is essential that you backtest and paper trade using your own settings before considering any live deployment. The Hurst exponent calculation is an approximation and should be interpreted as a rough gauge of market behavior. Adjust the parameters and risk management settings according to your personal risk tolerance and market conditions.
Additional Notes:
• Originality & Usefulness:
This script is an original mashup that combines trend analysis with Fibonacci retracement methods. The description above explains how these components work together to provide trading signals.
• Realistic Results:
The strategy uses realistic account sizes, commission rates, slippage, and risk management rules to generate backtesting results that are representative of real-world trading.
• Educational Purpose:
This script is intended to support the TradingView community by offering insights into combining multiple analysis techniques in one strategy. It is not a “get-rich-quick” system but rather an educational tool to help traders understand risk management and trade signal logic.
By using this script, you acknowledge that trading involves risk and that you are responsible for testing and adjusting the strategy to fit your own trading environment. This publication is fully open source, and any modifications should include proper attribution if significant portions of the code are reused.

Stronger V4.0 - Optimized Trading Strategy
Name: Stronger V4.0 - Optimized Trading Strategy
Introduction:
Stronger V4.0 is a structured trading strategy designed to identify and act on market breakout and reversal opportunities. By employing advanced filtering tools such as RSI (Relative Strength Index), MACD (Moving Average Convergence Divergence), and Bollinger Bands, this strategy aims to reduce market noise and provide reliable trading signals.
The strategy dynamically adapts to changing market conditions, focusing on delivering high-quality signals rather than frequent ones. This allows traders to approach markets with more confidence and clarity.
How the Strategy Works and Key Features:
How Stronger V4.0 Works:
Stronger V4.0 combines advanced technical indicators and custom logic to identify optimal entry and exit points in the market. By dynamically integrating filters like RSI, MACD, and Bollinger Bands, the strategy adjusts to market conditions and minimizes noise to deliver high-quality signals.
Key Features:
Dynamic Price Analysis:
Tracks price movements within specific periods to detect breakout and reversal opportunities.
Advanced Filtering Mechanisms:
RSI Filter: Avoids trades in overbought/oversold market conditions.
MACD Filter: Confirms market momentum and trend direction.
Bollinger Bands: Adapts thresholds based on market volatility.
Risk Management:
Limits trade risk to sustainable levels to preserve equity.
Encourages consistent growth by maintaining a maximum risk per trade.
Customizable Parameters:
Users can toggle long or short trades and adjust filter settings to match their trading preferences.
Minimalist Display:
Focuses on essential signals only, ensuring a clean and easy-to-read chart layout.
Market Breakout Identification:
One of Stronger V4.0's core functionalities is identifying significant breakout points. These breakout points are calculated based on dynamic price movements and market momentum.
Key moments are highlighted when the price exits a consolidation phase and transitions into a new trend. These points represent strong market opportunities, offering actionable insights for traders.
Using adjustable period settings, the strategy enables traders to tailor the analysis to their preferred timeframe and trading style. By eliminating market noise, Stronger V4.0 helps traders focus on high-probability setups and make informed decisions during volatile conditions.
Why Stronger V4.0 Stands Out:
Adaptive Filters:
Dynamically integrates RSI, MACD, and Bollinger Bands to reduce noise and highlight high-probability setups.
Precision Execution:
Focuses on executing trades at optimal moments, ensuring a balance between sustainability and profitability.
Rigorous Testing:
Extensively backtested under realistic market conditions for consistent performance.
Tailored and Exclusive:
Designed for traders seeking a balance between quality and adaptability.
Risk Disclaimer:
Stronger V4.0 has been backtested under various market conditions; however, past performance does not guarantee future results. The strategy is provided as-is, and traders are encouraged to test it thoroughly and apply appropriate risk management measures. Always trade responsibly.

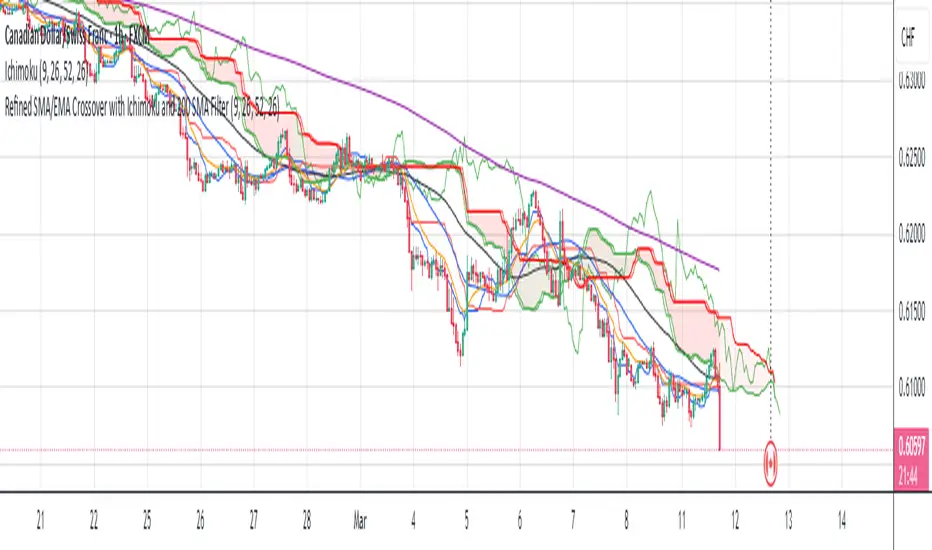
Refined SMA/EMA Crossover with Ichimoku and 200 SMA FilterYour **Refined SMA/EMA Crossover with Ichimoku and 200 SMA Filter** strategy is a multi-faceted technical trading strategy that combines several key technical indicators to refine entry and exit points for trades. Here's a breakdown of the components and how they work together:
### 1. **SMA/EMA Crossover**
- **Simple Moving Average (SMA) & Exponential Moving Average (EMA) Crossover**:
- The core idea behind the crossover strategy is to use the relationship between two moving averages to generate buy or sell signals.
- **SMA** (Simple Moving Average) gives an average of past prices over a set period.
- **EMA** (Exponential Moving Average) places more weight on recent prices, making it more responsive to price movements.
- A **bullish crossover** occurs when a shorter period moving average (such as a 50-period EMA) crosses above a longer period moving average (such as a 200-period SMA), signaling a potential buy.
- A **bearish crossover** occurs when a shorter period moving average crosses below the longer period moving average, signaling a potential sell.
### 2. **Ichimoku Cloud**
- The **Ichimoku Cloud** is a versatile indicator that provides insight into trend direction, support and resistance levels, and momentum.
- **Cloud (Kumo)**: The space between the Senkou Span A and Senkou Span B lines. It helps identify whether the market is in an uptrend, downtrend, or consolidation.
- **Tenkan-sen** (Conversion Line) and **Kijun-sen** (Base Line): These lines are used for additional confirmation of trend direction.
- **Chikou Span**: A lagging line that is used to confirm the trend.
- The general trading rules based on the Ichimoku Cloud are:
- **Bullish Signal**: When the price is above the cloud and the Tenkan-sen crosses above the Kijun-sen.
- **Bearish Signal**: When the price is below the cloud and the Tenkan-sen crosses below the Kijun-sen.
### 3. **200 SMA Filter**
- The **200 SMA Filter** serves as a long-term trend filter.
- When the price is **above the 200 SMA**, it signals a long-term bullish trend, and you only look for buying opportunities.
- When the price is **below the 200 SMA**, it signals a long-term bearish trend, and you only look for selling opportunities.
- This filter helps to avoid counter-trend trades, aligning your positions with the broader market trend.
### **How the Strategy Works Together**
- **Trade Setup (Long Position)**
1. The **200 SMA Filter** must confirm an **uptrend** by ensuring that the price is above the 200 SMA.
2. A **bullish crossover** (e.g., the 50 EMA crossing above the 200 SMA) occurs.
3. **Ichimoku Cloud** confirms a bullish trend, with the price above the cloud and the Tenkan-sen crossing above the Kijun-sen.
4. You enter a **long trade** with this confluence of signals.
- **Trade Setup (Short Position)**
1. The **200 SMA Filter** must confirm a **downtrend** by ensuring the price is below the 200 SMA.
2. A **bearish crossover** (e.g., the 50 EMA crossing below the 200 SMA) occurs.
3. **Ichimoku Cloud** confirms a bearish trend, with the price below the cloud and the Tenkan-sen crossing below the Kijun-sen.
4. You enter a **short trade** with this confluence of signals.
### **Exit Strategy**
- Exits can be determined based on any of the following:
- **SMA/EMA crossover reversal**: Exit when the shorter-term moving average crosses back below the longer-term moving average for a long position or crosses above for a short position.
- **Ichimoku Cloud reversal**: If the price breaks through the cloud or the Tenkan-sen and Kijun-sen lines cross in the opposite direction.
- **Profit target or stop loss**: Setting predefined profit targets or using a trailing stop to lock in profits as the trade moves in your favor.
Summary of the Strategy
This strategy is designed to identify strong trends and avoid false signals by combining:
SMA/EMA crossovers for immediate market direction signals.
Ichimoku Cloud for confirming the strength and trend direction.
A 200
SMA filter to ensure trades align with the long-term trend.
By using these multiple indicators together, the strategy aims to refine entry and exit points, minimize risk, and increase the likelihood of successful trades.
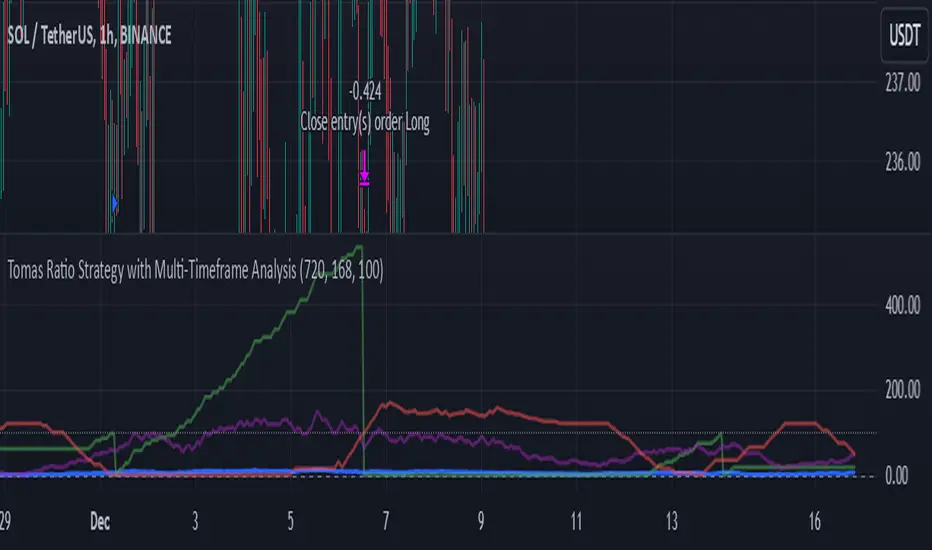
Tomas Ratio Strategy with Multi-Timeframe AnalysisHello,
I would like to present my new indicator I have compiled together inspired by Calmar Ratio which is a ratio that measures gains vs losers but with a little twist.
Basically the idea is that if HLC3 is above HLC3 (or previous one) it will count as a gain and it will calculate the percentage of winners in last 720 hourly bars and then apply 168 hour standard deviation to the weekly average daily gains.
The idea is that you're supposed to buy if the thick blue line goes up and not buy if it goes down (signalized by the signal line). I liked that idea a lot, but I wanted to add an option to fire open and close signals. I have also added a logic that it not open more trades in relation the purple line which shows confidence in buying.
As input I recommend only adjusting the amount of points required to fire a signal. Note that the lower amount you put, the more open trades it will allow (and vice versa)
Feel free to remove that limiter if you want to. It works without it as well, this script is meant for inexperienced eye.
I will also publish a indicator script with this limiter removed and alerts added for you to test this strategy if you so choose to.
Also, I have added that the trades will enter only if price is above 720 period EMA
Disclaimer
This strategy is for educational purposes only and should not be considered financial advice. Always backtest thoroughly and adjust parameters based on your trading style and market conditions.
Made in collaboration with ChatGPT.
SMB MagicSMB Magic
Overview: SMB Magic is a powerful technical strategy designed to capture breakout opportunities based on price movements, volume spikes, and trend-following logic. This strategy works exclusively on the XAU/USD symbol and is optimized for the 15-minute time frame. By incorporating multiple factors, this strategy identifies high-probability trades with a focus on risk management.
Key Features:
Breakout Confirmation:
This strategy looks for price breakouts above the previous high or below the previous low, with a significant volume increase. A breakout is considered valid when it is supported by strong volume, confirming the strength of the price move.
Price Movement Filter:
The strategy ensures that only significant price movements are considered for trades, helping to avoid low-volatility noise. This filter targets larger price swings to maximize potential profits.
Exponential Moving Average (EMA):
A long-term trend filter is applied to ensure that buy trades occur only when the price is above the moving average, and sell trades only when the price is below it.
Fibonacci Levels:
Custom Fibonacci retracement levels are drawn based on recent price action. These levels act as dynamic support and resistance zones and help determine the exit points for trades.
Take Profit/Stop Loss:
The strategy incorporates predefined take profit and stop loss levels, designed to manage risk effectively. These levels are automatically applied to trades and are adjusted based on the market's volatility.
Volume Confirmation:
A volume multiplier confirms the strength of the breakout. A trade is only considered when the volume exceeds a certain threshold, ensuring that the breakout is supported by sufficient market participation.
How It Works:
Entry Signals:
Buy Signal: A breakout above the previous high, accompanied by significant volume and price movement, occurs when the price is above the trend-following filter (e.g., EMA).
Sell Signal: A breakout below the previous low, accompanied by significant volume and price movement, occurs when the price is below the trend-following filter.
Exit Strategy:
Each position (long or short) has predefined take-profit and stop-loss levels, which are designed to protect capital and lock in profits at key points in the market.
Fibonacci Levels:
Fibonacci levels are drawn to identify potential areas of support or resistance, which can be used to guide exits and stop-loss placements.
Important Notes:
Timeframe Restriction: This strategy is designed specifically for the 15-minute time frame.
Symbol Restriction: The strategy works exclusively on the XAU/USD (Gold) symbol and is not recommended for use with other instruments.
Best Performance in Trending Markets: It works best in trending conditions where breakouts occur frequently.
Disclaimer:
Risk Warning: Trading involves risk, and past performance is not indicative of future results. Always conduct your own research and make informed decisions before trading.

SMC StrategyThis Pine Script strategy is based on Smart Money Concepts (SMC), designed for TradingView. Here's a brief summary of what the script does:
1. Swing High and Low Calculation: It identifies recent swing highs and lows, which are used to define key zones.
2. Equilibrium, Premium, and Discount Zones:
- Equilibrium is the midpoint between the swing high and low.
- Premium Zone is above the equilibrium, indicating a potential resistance area (sell zone).
- Discount Zone is below the equilibrium, indicating a potential support area (buy zone).
3. Simple Moving Average (SMA): It uses a 50-period SMA to determine the trend direction. If the price is above the SMA, the trend is bullish; if it's below, the trend is bearish.
4. Buy and Sell Signals:
- Buy Signal: Generated when the price is in the discount zone and above the equilibrium, with the price also above the SMA.
- Sell Signal: Triggered when the price is in the premium zone and below the equilibrium, with the price also below the SMA.
5. Order Blocks: It detects basic order blocks by identifying the highest high and lowest low within the last 20 bars. These levels help confirm the buy and sell signals.
6. Liquidity Zones: It marks the swing high and low as potential liquidity zones, indicating where price may reverse due to institutional players' activity.
The strategy then executes trades based on these signals, plotting buy and sell markers on the chart and showing the key levels (zones) and trend direction.

NNFX RSI EMA FVMA MACD ALGOThis Pine Script introduces a cutting-edge trading strategy that seamlessly integrates multiple technical indicators—namely, the Flexible Variable Moving Average ( FVMA ), Relative Strength Index ( RSI ), Moving Average Convergence Divergence ( MACD ), and Exponential Moving Average ( EMA )—to deliver a sophisticated trading experience. This script stands out due to its comprehensive approach, robust risk management, and the inclusion of crucial data tables for various timeframes, making it an invaluable tool for traders seeking to enhance their market performance.
Originality of the Strategy:
The originality of this script lies in its unique combination of multiple powerful indicators, enabling traders to benefit from diverse perspectives on market dynamics. This mashup enhances decision-making processes, providing multiple layers of confirmation for trade entries and exits. The strategy is designed to offer an innovative solution for traders looking to improve their performance through well-defined rules and a solid framework.
Flexible Variable Moving Average (FVMA):
The FVMA adapts dynamically to market conditions, offering a more responsive trend line than traditional moving averages. This flexibility allows for quick identification of trends and reversals, crucial for fast-paced trading environments.
Exponential Moving Average (EMA):
By giving greater weight to recent price data, the EMA enhances sensitivity to price changes, allowing for more accurate entries and exits when used alongside the FVMA. This combination maximizes the effectiveness of the strategy in identifying optimal trading opportunities.
Relative Strength Index (RSI):
The RSI helps identify overbought or oversold conditions, integrating seamlessly with other indicators to enhance the strategy's ability to pinpoint potential reversal points. This aspect of the strategy ensures that traders can make informed decisions based on market momentum.
Moving Average Convergence Divergence (MACD):
The MACD serves as an essential confirmation tool, providing insights into trend strength and momentum. This enhances the accuracy of entry and exit signals, allowing traders to make more informed decisions based on robust technical analysis.
Multi-Take Profit (TP) and Stop Loss (SL) Levels:
The strategy supports multiple TPs, allowing traders to lock in profits at various levels while effectively managing risk through a robust SL system. This flexibility caters to diverse trading styles and risk profiles, ensuring that the strategy can adapt to individual trader needs.
Default Properties:
Take Profit Levels: TP1 is set to 2.0, and TP2 is set to 2.9, which is designed to enhance profit potential while maintaining a solid risk-reward ratio.
Stop Loss: A SL is set at 2% of the 5% account balance, which helps to preserve capital and manage risk effectively, adhering to the guideline of not risking more than 5-10% of the account balance per trade.
Labeling System for Exits: Automatic labeling of TP and SL exits on the chart provides clear visualization of trading outcomes. This feature supports informed decision-making and performance tracking, aligning with the guideline of providing transparent results.
Custom Alerts System:
The inclusion of customizable alerts for trade entries, exits, and SL/TP hits keeps traders informed in real-time, enabling prompt actions without constant market monitoring. This is crucial for effective trade management and helps traders respond quickly to market changes.
API Boxes for Automated Trading:
The strategy features API boxes, allowing traders to set up automated trading based on indicator signals. This functionality enables seamless integration with trading platforms, enhancing efficiency and streamlining the trading process, which is particularly valuable for traders looking to optimize their execution.
Data Tables for Enhanced Analysis:
The script includes data tables displaying critical insights across various timeframes: 2-hour, daily, weekly, and monthly. These tables provide a comprehensive overview of market conditions, allowing traders to analyze trends and make informed decisions based on a broad spectrum of data. By leveraging this information, traders can identify high-probability setups and align their strategies with prevailing market trends, significantly increasing their chances of success.
Default Properties:
Initial Capital: £1,000, ensuring a realistic starting point for traders.
Risk per Trade: 5% of the account balance, promoting sustainable trading practices.
Commission: 0.1%, reflecting realistic transaction costs that traders may encounter.
Slippage: 1%, accounting for potential market volatility during trade execution.
Take Profit Levels:
TP1: 2.0
TP2: 2.9
Stop Loss (SL): 2% of the 5% account balance, which is well within acceptable risk parameters.
Compliance with TradingView Guidelines:
This script fully complies with TradingView's guidelines, specifically:
Strategy Results:
The strategy is designed to publish backtesting results that do not mislead traders. The realistic parameters outlined in the default properties ensure that traders have a clear understanding of potential outcomes.
The dataset used for backtesting has sufficient trades to produce a reliable sample size, aligning with the guideline of ideally having more than 100 trades.
Any deviations from recommended practices are justified in the script description, ensuring transparency and adherence to best practices.
The script explains the default properties in detail, providing a thorough understanding of how these settings influence performance.
Why This Script is Worth Paying For:
This Pine Script offers an unparalleled trading experience through its unique combination of technical indicators, comprehensive trade management features, and detailed data tables for multiple timeframes. Here are compelling reasons to invest in this strategy:
Holistic Approach: The integration of multiple indicators ensures a well-rounded perspective on market conditions, increasing the likelihood of successful trades.
Advanced Risk Management: The flexibility of multiple TPs and SLs empowers traders to tailor their risk profiles according to individual strategies, enhancing overall profitability.
Automated Trading Capability: The inclusion of API boxes for automated trading streamlines execution, allowing traders to capitalize on opportunities without the need for manual intervention.
Comprehensive Data Analysis: The detailed data tables provide invaluable insights across different timeframes, enabling traders to make informed decisions based on robust market analysis.
In summary, this innovative Pine Script represents a powerful tool designed to empower traders at all levels. Its originality, synergistic functionality, and comprehensive features create a dynamic and effective trading environment, justifying its value and positioning it as a must-have for anyone serious about achieving consistent trading success.
