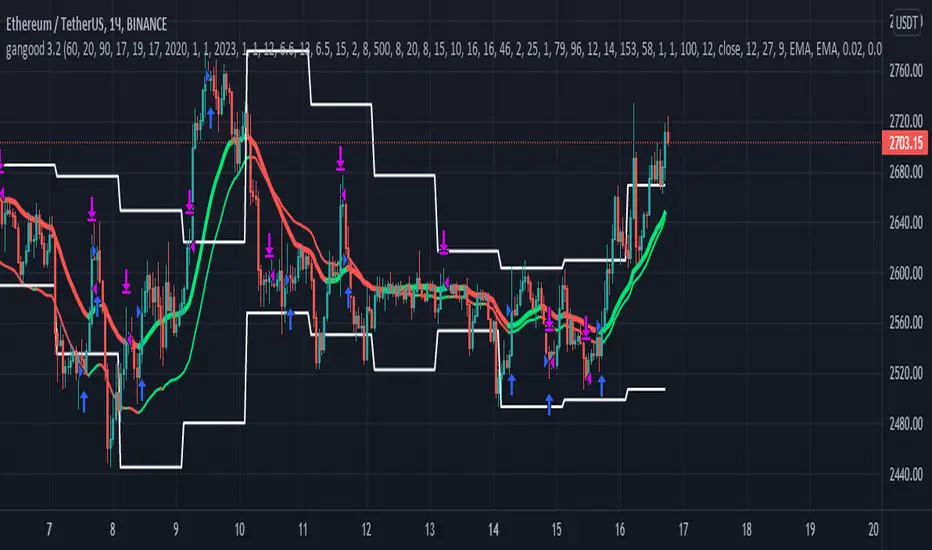
gangood bot for FinandyGangood is a mean reversion algorithm currently optimized for trading the ETH/USDT pair on the 1 hour chart time frame. All indicator inputs use the closing price of the period, and all trades are executed at the open of the period following the period in which the trading signal was generated.
To take into account slippage, the commission costs 0.15%.
Backtest result from 2020.
Result since 2019 2,500,000%, maximum drawdown 18%
This bot uses 11 indicators:
1) ADX
2) RANGE FILTER
3) SAR
4) RSI
5) TWAP
6) JMA
7) MACD
8) VOLUME DELTA
9) VOLUME WEIGHT
10) MA
11) TSI
Pattern 1:
There are 3 main components that make up Gangood: I. Trend Filter. The algorithm uses a version of the ADX indicator as a trend filter to only trade during certain time periods when price is most likely to be range-bound (i.e., average retracement). This indicator consists of a fast ADX and a slow ADX both using the same lookback period.
The ADX is smoothed with a 6-period EMA and the slow ADX is smoothed with a 12-period EMA. When the fast ADX is above the slow ADX , the algorithm does not trade because it indicates that the price is most likely trending, which is bad for a mean reversion system. Conversely, when the fast ADX is below the slow ADX, the price is likely to be in a range, so this is the only time the algorithm is allowed to trade. II. Bollinger Bands When the trend filter allows trading, the algorithm uses Bollinger Bands.
Indicator for opening long and short positions. The Bolliger Bands indicator has a 20 lookback period and a 1.5 standard deviation for both the upper and lower bands. When the price crosses the lower band, a buy signal is generated and a long position is opened. When the price crosses the upper band, a sell signal is generated and a short position is opened.
Pattern 2:
Based on RSI which is commonly used as a trend reversal indicator. However, here it is used as a trend-setting indicator, often with great success. This pattern only takes long trades, which is quite successful in a bull market.
Pattern 3:
Long or short trades are determined by the intersection of the fast EMA with the slow EMA for long positions and vice versa for short positions. Trades should only occur close to intersections. We then use the MACD for the long position. an indicator with a 10-minute time frame where we look for high peaks in negative values for longs and vice versa for shorts. They should be significantly higher than the other peaks.
Capital Management:
The maximum leverage in this strategy, I would recommend 2x, in order to trade without unnecessary risks and keep your nerves in order.
Bot setup:
I use the Finandy terminal, in which you can easily trade with this strategy.
1. We go to binance and turn on the hedging mode, this is necessary so that if tradingview sends a webhook for buying later than for selling.
2. Adding a new signal to Finandy
2.1. Open tab
2.1.1. "Order side" Strategy
2.1.2. "Amount" Balance% x Leverage
2.1.3. We set the percentage of the order two times less than the one you want
2.1.4. "Shoulder" is twice as large as the one you want
2.2.Close tab
2.2.1. "Enebaled" tick
2.2.2. "Reverse / Close" Disable
3. Set a notification for this strategy.
4. Copy "Signal URL" and paste it into webhook on tradingview
5. Copy "Signal Message" and paste it into the message on tradingview
ابحث في النصوص البرمجية عن "candle"
Gap Absorption StrategyLike the nature, markets don't like the void, and this is something we can take advantage of by trading gaps on some markets.
This technique is well known, so I wanted to write a tiny script based on this strategy to get a bit more comfortable with it.
IMPORTANT: Default parameters wont give you good trades on every markets, you need to modify these parameters to see which proportions correspond to the stock you're trading.
This script triggers signals on predefined variation of a stock price after a gap, and allows its user to configure TP and SL prices corresponding to a specific percentage of this gap movement.
Note: We can observe that opening gaps are often the most interesting.
Options
Trigger: the price variation you want to trigger on (in % of the price)
Stop Loss : in % of the gap
Take profit : in % of the gap
A small table is displayed in the top right corner of the chart to give you TP/SL/Signal prices for each opportunity
SL (red line) and TP (green line) are also displayed on the chart when a signal is triggered
Information concerning the current opportunity is given at the bottom of the chart
Note: This script is based on the Gap-Size-Indicator that I published a few weeks ago.

Consecutive Up/Down Strat + alerts via TradingConnector to ForexSoftware part of algotrading is simpler than you think. TradingView is a great place to do this actually. To present it, I'm publishing each of the default strategies you can find in Pinescript editor's "built-in" list with slight modification - I'm only adding 2 lines of code, which will trigger alerts, ready to be forwarded to your broker via TradingConnector and instantly executed there. Alerts added in this script: 12 and 15.
How it works:
1. TradingView alert fires.
2. TradingConnector catches it and forwards to MetaTrader4/5 you got from your broker.
3. Trade gets executed inside MetaTrader within 1 second of fired alert.
When configuring alert, make sure to select "alert() function calls only" in CreateAlert popup. One alert per ticker is required.
Adding stop-loss, take-profit, trailing-stop, break-even or executing pending orders is also possible. These topics have been covered in other example posts.
This routing works for Forex, indices, stocks, crypto - anything your broker offers via their MetaTrader4 or 5.
Disclaimer: This concept is presented for educational purposes only. Profitable results of trading this strategy are not guaranteed even if the backtest suggests so. By no means this post can be considered a trading advice. You trade at your own risk.
If you are thinking to execute this particular strategy, make sure to find the instrument, settings and timeframe which you like most. You can do this by your own research only.

Three (3)-Bar and Four (4)-Bar Plays StrategyThis strategy analyzes the three and four-bar play which is when price action has a wide igniting bar that has a full body, then one or two narrow bars which have a relatively equal high for long plays and relatively equal low for short plays, then a continuation bar. You should not take plays that will encounter resistance. The stop loss is placed for long plays below the 2nd bar (or 3rd bar for 4-bar play).
This is commonly used on 1m, 2m, 5m, and 10m charts.
Jared Wesley is one of the more notable traders that use this setup. You can edit as an input the start date, end date, igniting bar size, the body percentage of the igniting bar, the relative equality of the 2nd bar (and 3rd bar for 4-bar play) compared to the igniting bar, and profit multiplier.

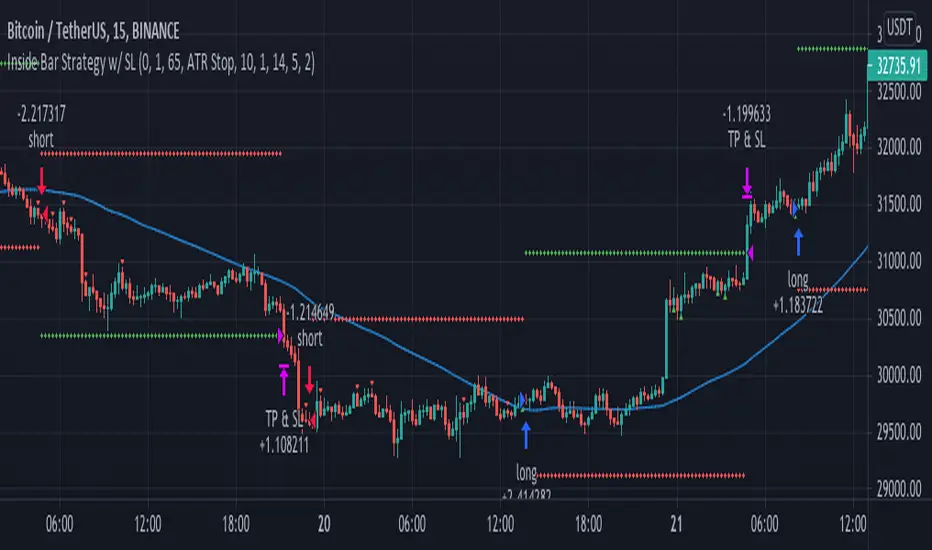
Inside Bar Strategy w/ SL"Inside bars are a two -bar pattern. They can indicate either a continuation of the
existing move or a reversal. A continuation occurs when there is no significant
support or resistance level in sight, while a reversal occurs close to a strong sup-
port or resistance level...
...A lot of traders are aware of inside bars but few manage to make money with
them. Why is this so? It goes back to interpreting price action. A lot of traders look
to trade in geometric ways. What I mean is that they search for fancy shapes on a
chart and think that this is what represents true price action.
This is not the case. A shape is just a shape. The formation by itself means
nothing unless underlying order flow backs it up. This is why it’s extremely
important that you look for inside bars when a trend is already in place.
The best place to look for them is in the beginning of trends."
NYCOB Kill Zone StrategyI have now turned the NYCOB Kill zone into a stand alone strategy!
Fully customizable in regards to time of entry and levels of entry but the standard settings are the best all around.
Original NYCOB Kill Zone text below
This script plots the H and L of the first 2 hours of the NYC session and shades the space between in which i deem the NYC Order Block
It also maps out the First two hours on the chart as well so you can understand when the OB has formed
Over the past 3 years of trading cryptocurrency i have noticed a phenomena that has occurred nearly every day
The H or L will 90% of the time will be posted in the first two hours of this session
knowing this means you understand if you just wait til this time you can better your odds at not getting stop hunted due to poor entry
A few things to take from this study are these.
1. after the OB is formed
2. whichever side gets taken out first (H/L) will 90% define the bias for the day. I have found that using the m13-m15 TF will add some more confirmation with 1-2 closes outside of range H/L/
3. After general bias has formed 2 things can happen
A) PA just takes off and there is really nothing you can do about it unless you had other studies that told you that will happen
B) PA will dip back INTO the OB and create the OTE which is any retracement below the .5 Fibonacci of the shaded OB
4. Typically OTE happens after the session has ended
5. If you used OTE off of the past days NYCOB then you can use the new (forming or just formed) NYCOB to CONFIRM your initial bias presented from the previous days OTE and bias.
6. When PA cannot close outside the NYCOB it presents a range to range play where PA will visit the opposite side of the range to chase liquidity,
7. When the NYCOB is TIGHT then deviation is more likely to result in price expansion, when the NYCOB is WIDE then deviation tends to present more range to range plays.
8. After bias is formed and OTE has been made your stops should always be outside the NYCOB. I use the m30 or H1 ATR to get a slight cushion from the OB to ensure i dont get stop hunted.
Standard TP are all set at the same level but you can adjust them accordingly
Shout out to Elevate-Trading family member Boederzeng for helping me with the code!

Pinescript v4 - The Holy Grail (Trailing Stop)After studying several other scripts, I believe I have found the Holy Grail! (Or perhaps I've just found a bug with Tradingview's Pinescript v4 language) Anyhow, I'm publishing this script in the hope that someone smarter than myself could shed some light on the fact that adding a trailing stop to any strategy seems to make it miraculously...no that's an understatement...incredulously, stupendously, mind-bendingly profitable. I'm talking about INSANE profit factors, higher than 200x, with drawdowns of <10%. Sounds too good to be true? Maybe it is...or you could hook it up to your LIVE broker, and pray it doesn't explode. This is an upgraded version of my original Pin Bar Strategy.
Recommended Chart Settings:
Asset Class: Forex
Time Frame: H1
Long Entry Conditions:
a) Exponential Moving Average Fan up trend
b) Presence of a Bullish Pin Bar
c) Pin Bar pierces the Exponential Moving Average Fan
Short Entry Conditions:
a) Exponential Moving Average down trend
b) Presence of a Bearish Pin Bar
c) Pin Bar pierces the Exponential Moving Average Fan
Exit Conditions:
a) Trailing stop is hit
b) Moving Averages cross-back (optional)
c) It's the weekend
Default Robot Settings:
Equity Risk (%): 3 //how much account balance to risk per trade
Stop Loss (x*ATR, Float): 0.5 //stoploss = x * ATR, you can change x
Stop Loss Trail Points (Pips): 1 //the magic sauce, not sure how this works
Stop Loss Trail Offset (Pips): 1 //the magic sauce, not sure how this works
Slow SMA (Period): 50 //slow moving average period
Medium EMA (Period): 18 //medium exponential moving average period
Fast EMA (Period): 6 //fast exponential moving average period
ATR (Period): 14 // average true range period
Cancel Entry After X Bars (Period): 3 //cancel the order after x bars not triggered, you can change x
Backtest Results (2019 to 2020, H1, Default Settings):
AUDUSD - 1604% profit, 239.6 profit factor, 4.9% drawdown (INSANE)
NZDUSD - 1688.7% profit, 100.3 profit factor, 2.5% drawdown
GBPUSD - 1168.8% profit, 98.7 profit factor, 0% drawdown
USDJPY - 900.7% profit, 93.7 profit factor, 4.9% drawdown
USDCAD - 819% profit, 31.7 profit factor, 8.1% drawdown
EURUSD - 685.6% profit, 26.8 profit factor, 5.9% drawdown
USDCHF - 1008% profit, 18.7 profit factor, 8.6% drawdown
GBPJPY - 1173.4% profit, 16.1 profit factor, 7.9% drawdown
EURAUD - 613.3% profit, 14.4 profit factor, 9.8% drawdown
AUDJPY - 1619% profit, 11.26 profit factor, 9.1% drawdown
EURJPY - 897.2% profit, 6 profit factor, 13.8% drawdown
EURGBP - 608.9% profit, 5.3 profit factor, 9.8% drawdown (NOT TOO SHABBY)
As you can clearly see above, this forex robot is projected by the Tradingview backtester to be INSANELY profitable for all common forex pairs. So what was the difference between this strategy and my previous strategies? Check my code and look for "trail_points" and "trail_offset"; you can even look them up in the PineScript v4 documentation. They specify a trailing stop as the exit condition, which automatically closes the trade if price reverses against you.
I however suspect that the backtester is not properly calculating intra-bar price movement, and is using a simplified model. With this simplfied approach, the trailing stop code becomes some sort of "holy grail" generator, making every trade entered profitable.
Risk Warning:
This is a forex trading strategy that involves high risk of equity loss, and backtest performance will not equal future results. You agree to use this script at your own risk.
Hint:
To get more realistic results, and *maybe* overcome the intrabar simulation error, change the settings to: "Stop Loss Trail Points (pips)": 100
I am not sure if this eradicates the bug, but the entries and exits look more proper, and the profit factors are more believable.

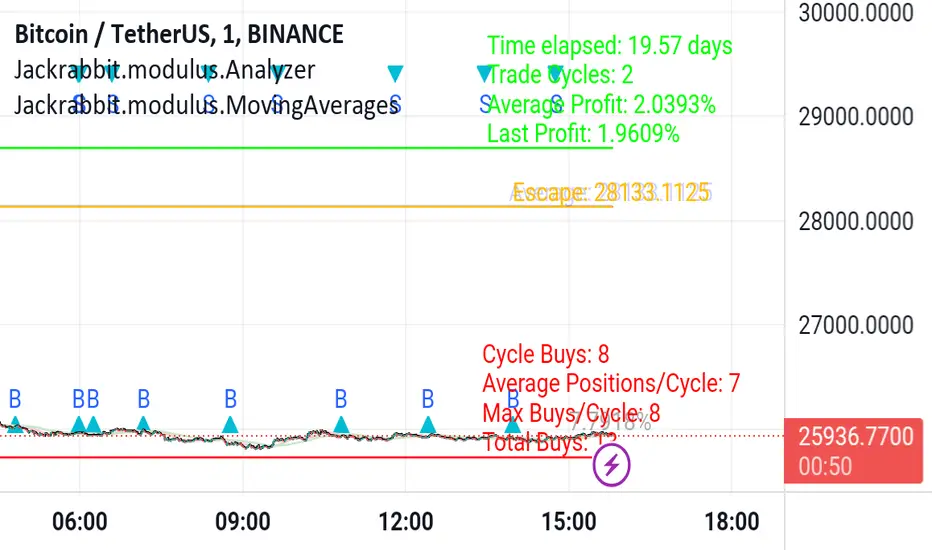
Jackrabbit.modulus.AnalyzerThis is the module Analyzer for the Jackrabbit suite and modulus framework.
As the modulus framework has grown both in size and complexity, it has become ever increasingly difficult to evaluate the profitability a very complex multi-layered modules combined.
The Jackrabbit Analyzer module allows you to do just that. Connect this module to the end of your IoI chain and it will tell you the profitability of your current combination, using TradingView's strategy backtesting capabilities.
With this module connected to your IoI chain, you can literally watch in real time as the analyzer evaluates your current settings and updates each time you make a change in those settings, giving you a better and more realistic approach to what is possible with your current strategy.
While this module is not a substitute for paper trading, it significantly increases the construction and analysis of a multi-layered trading paradigm that can then be taken to a paper trader with a high level of confidence of success.
Only the signal line is displayed.
The Jackrabbit modulus framework is a plug in play paradigm built to operate through TradingView's indicator on indicatior (IoI) functionality. As such, this script receives a signal line from the previous script in the IoI chain, and evaluates the buy/sell signals appropriate to the current analysis.
This script is by invitation only. To learn more about accessing this script, please see my signature or send me a PM. Thank you.
MARUSIA TRADING STRATEGIES [VCRYPTO]Description of MARUSIA TRADING STRATEGIES
«MARUSIA» is a compilation of several strategies.
You may choose the one which best suits your trading habit from options menu.
The strategies are based on indicator’s and bar’s closing level analysis on different timeframes.
At the time being there are 3 types of strategies for BTC on 1H and 3H tf.
+++ BTC 1H 90% Success +++ (Beginner)
Instrument - BTC, timeframe – 1H, exchange – Bitmex.
The advantage of the strategy is a high quantity of profitable trades (90% at the time of publishing).
The Trading View backtest results from 2019:
+ 303% net profit
+ 90% profitable trades
+ 6% drawback
+++ BTC 1H Mega Scalper +++ (Intermediate)
Instrument - BTC, timeframe – 1H, exchange – Bitmex.
The advantage of the strategy is more frequent trades with a good probability of success.
The Trading View backtest results from 2019:
+ 792% net profit
+ 64% profitable trades
+ 5% drawback
+++ BTC 3H Mega Scalper +++ (Expert)
Instrument - BTC, timeframe – 3H, exchange – Bitmex.
The advantage of the strategy is more frequent trades with a good probability of success.
The Trading View backtest results from 2018:
+ 1637% net profit
+ 79% profitable trades
+ 4,4% drawback
HOW TO USE
1. Choose the strategy from the strategy’s option menu on the chart. Pay attention to the instrument and timeframe you are using the selected strategy for.
2. Wait until you see green (above bar) or orange (below bar) label. To receive an alert when these labels (or signals) appear on the chart use ALERT INDICATOR for this strategy.
3. On the opening of the next bar enter the position if the label on the previous bar hasn’t disappeared. Green – for Buy, orange – for Sell. In this case you will see Buy/Sell signal on the chart.
4. Putting TRAILING STOPS
4.1. You should put a trailing stop when the price moves to profit up or down for 1% from your entry. For example, if you are long at 7255 USD and price moves up to 7328 USD (7255*1.01), put trailing stop with a trailing value 0,4% of your entry price, which is 29 USD (7255*0.004).
4.2. Every time when there is a long or short position, you may see a green info label with entry price, trail stop activation level and trail value. You may use this information instead of making a calculation by yourself. Only if your entry is the same as in the label.
5. Position closing maybe by reaching your trailing stop (in this case you may reenter the position on the next bar, if there is a signal label as per step 2 on the bar where your trailing stop is triggered) or when there is a signal for opposite direction.
6. If the signals appear differently than described as above, just refresh the website of Trading View. This happens because mostly take profits are shown only after the current bar is closed.
• The Buy/Sell signal label may move up or down on the bar with price’s movement. Don’t worry it doesn’t mean that your entry is changing.
• The lines on the chart are weekly price levels – the price levels of the previous week –
Green – open, Red – close, Blue – high, Brown – low, Black – hl2 (average of high and low). You may use them as support and resistance levels.
***
+ Trading View backtest results
+No repaint
+ Several strategies to choose which suits your trading habit
+Free testing
+Support with a call
Pm to get access to the strategy.
____________________________________________________________________________
Описание к стратегии "MARUSIA TRADING STRATEGIES "
Сборник нескольких стратегий серии "Marusia"
Выбор конкретной стратегии осуществляется из удобного меню
Основа наших стратегий - совмещение индикаторного анализа и анализа уровня закрытия свечей на разных временных интервалах (анализ уровней).
+++ BTC 1H 90% Success +++ (Beginner)
Стратегия работает на инструменте Bitcoin (BTC) по котировкам биржи BITMEX на 1 часовом таймфрейме (1H).
Основное преимущество данной стратегии - супервысокая успешность сделок (более 90% на момент публикации).
Данная стратегия представляет собой гибрид среднесрочных стратегий по частоте сделок (с 2019 по 12.04.2020 - 204 сделки, в среднем одна сделка раз в 2 дня) и элемент высокочастотных (скальп) стратегий - необходимо выставление использование скользящего стоп-приказа (trailing stop-loss), расчетные данные по которому появляются прямо на экране при открытии сделки.
Статистика по данной стратегии, подтвержденная бэктестом в Trading View
С 2019 года до момента публикации стратегии бектест показывает следующие данные:
+ 303% чистой прибыли
+ 90% успешных сделок
+ 6% макс. единовременная просадка
+++ BTC 1H Mega Scalper +++ (Intermediate)
Стратегия работает на инструменте Bitcoin (BTC) по котировкам биржи BITMEX на 1 часовом таймфрейме (1H)
Основное преимущество данной стратегии - высокочастотные сделки с хорошей вероятностью успеха.
С 2019 года до момента публикации стратегии бектест Trading View показывает следующие данные:
+ 792% чистой прибыли
+ 64% успешных сделок
+ 5% макс. единовременная просадка
+++ BTC 3H Mega Scalper +++ (Expert)
Стратегия работает на инструменте Bitcoin (BTC) по котировкам биржи BITMEX на 3 часовом таймфрейме (3H)
Основное преимущество данной стратегии - высокочастотные сделки с хорошей вероятностью успеха
С 2019 года до момента публикации стратегии бектест Trading View показывает следующие данные:
+ 1637% чистой прибыли
+ 79% успешных сделок
+ 4,4% макс. единовременная просадка
***
Инструкиция по использованию:
1. Вы открываете график с включенной стратегией. Обратите внимание на инструмент и таймфрейм стратегии.
2. Ожидаете появления на графике зеленого (снизу) или оранжевого (сверху) флажка.
Для получения уведомления появления значков (сигналов) используйте АЛЕРТНЫЙ ИНДИКАТОР для данной стратегии.
3. На открытии следующей свечи входите в сделку, если флажек из п.2 остался и не пропал (зеленый флажек - покупка, оранжевый - продажа)
4. Выставление trailing stop-loss
4.1 Trailing stop-loss выставляется, когда цена прошла 1% в профит от цены выхода в сделку (например: покупка 7255 и когда цена будет 7328 (7255*1,01) выставляется плавающий стоп-лосс (trailing stop-loss) в размере 0,4% от цены входа "29" (7255*0,004).
4.2. Как только будет закрыта свеча, на которой Вы вошли в сделку - вы увидете значения из п.4.1 на экране рядом с графиком (вы можете их использовать без самостоятельного расчета, но тогда есть риск, что если цена на свече входа достигнет значения из п. 4.1 - то сделка закроется, а вы это увидите только на следующей свече, когда значение цены может быть менее выгодное)
5. Выход из сделки осуществляется либо по trailing stop-loss (тогда вы можете перезайти в сделку на открытии следующей свечи, если на свече, на которой произошло закрытие по trailing stop-loss появились флажки из п.2), либо по появлению противоположного флажка, тогда вход в сделку, в соответствии с п. 2 и 3
7. Если Вы увидели, что сигналы отличаются от написанного в данной инструкции - просто обновите страницу с Trading View в браузере и все встанет на свои места.
* На свече захода в сделку сигнал "buy/sell" может "плавать" по свече, но если Вы выполнили п.1-3 Вам неочем беспокоиться. Не обращайте на него внимание.
***
Основные отличия от стратегий наших коллег:
+ Результаты бэктеста в платформе Trading View – прозрачная статистика по сделкам, которую вы можете посмотреть самостоятельно
+ Построен на принципах non-repaint basis – сигналы не исчезают (при правильном соблюдении инструкции по использованию)
+ Каждая стратегия серии построена на своем уникальном принципе - вы можете выбрать для себя оптимальный набор стратегий
+ Бесплатный тестовый период
+ Поддержка с возможностью организации телефонного звонка
Для предоставления доступа к данной стратегии - пожалуйста пишите в личные сообщения. Мы быстро с Вами свяжемся.
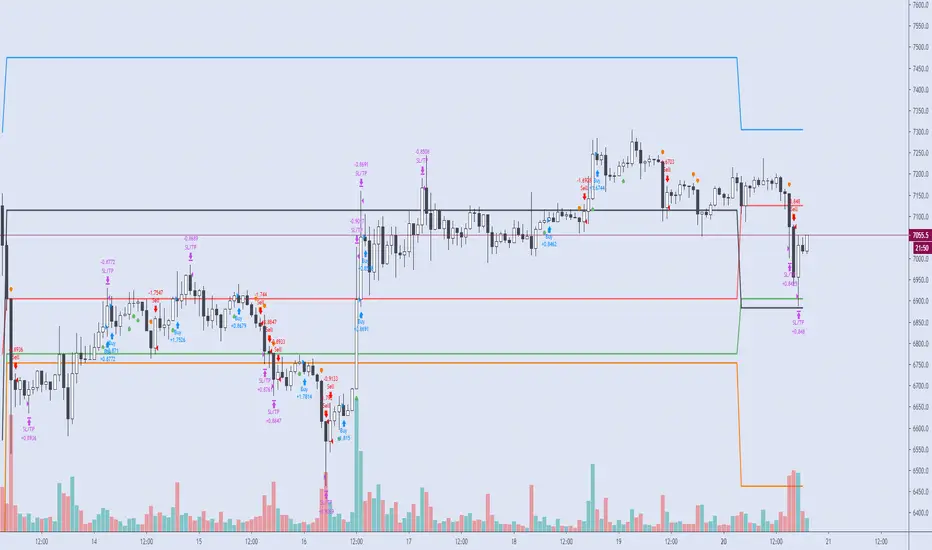
Vava Strategy - Ichimoku Kinko Hyo AdaptedCandlestick
Setup BOVESPA index or mini index, timeframe 2min, Senssion Star: 10:00, Session End:11:45, BB Lenght = 56, pyramiding: 3
Strategy use Ichimoku Cloud, Mfi, trend SMA short and Bollinger Bandas.
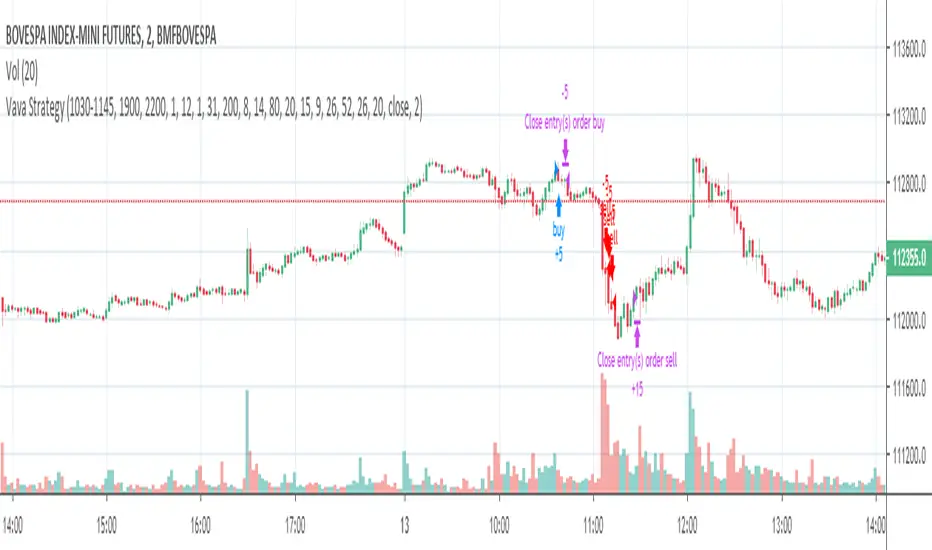
Candle Patterns Strategy - 2New risk management system: order entry, moving stop loss to breakeven + moving average filter (SMA)

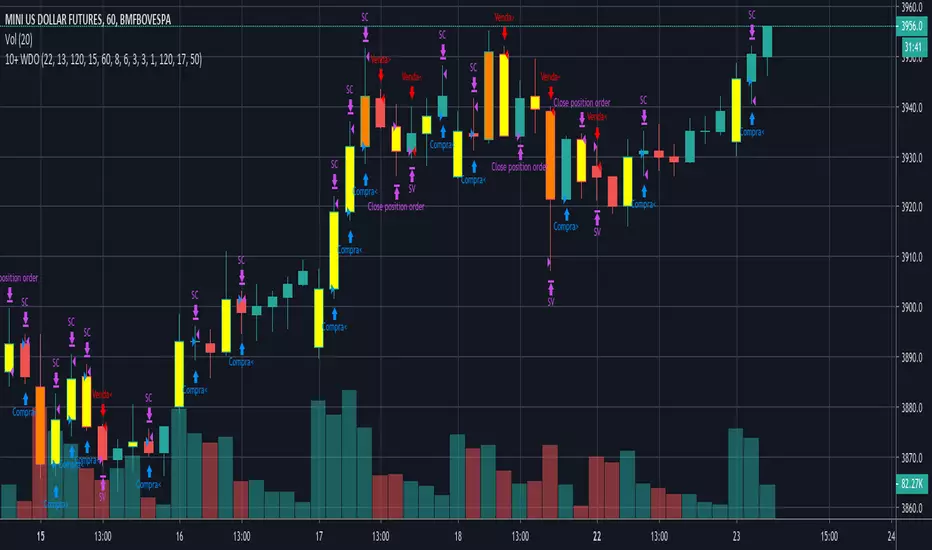
Carlos_Setup 10+ WDOEsta estratégia atua tanto a favor da tendência, quanto contra. O modelo foi criado para ser operado no Dólar e Mini Dólar, mas pode ter as suas configurações ajustadas também para o índice.
O setup padrão é para ser usado no tempo gráfico de 1H, para outros tempos é necessário fazer ajustes nos parâmetros.
Entre as opções que podem ser configuradas estão o Stop Gain e Loss (tanto para as tendências de baixa quanto de alta), Stop Móvel, Ativação para o Stop Móvel e Prejuízo máximo em um dia.
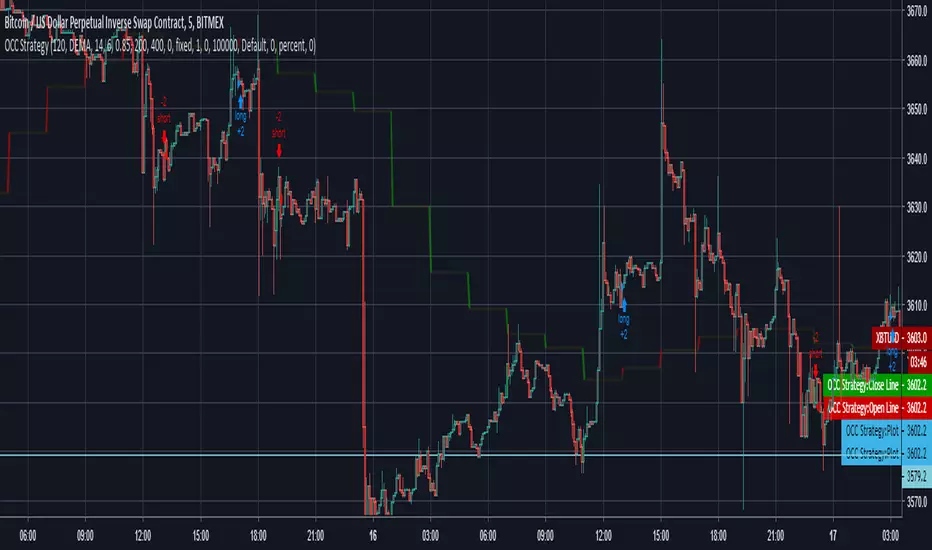
Open Close Cross Strategy // Real Back Test // Not goodI changed close series because, close series doing repaint.
I changed the near series with the previous open series .
but can use for sup and resistance
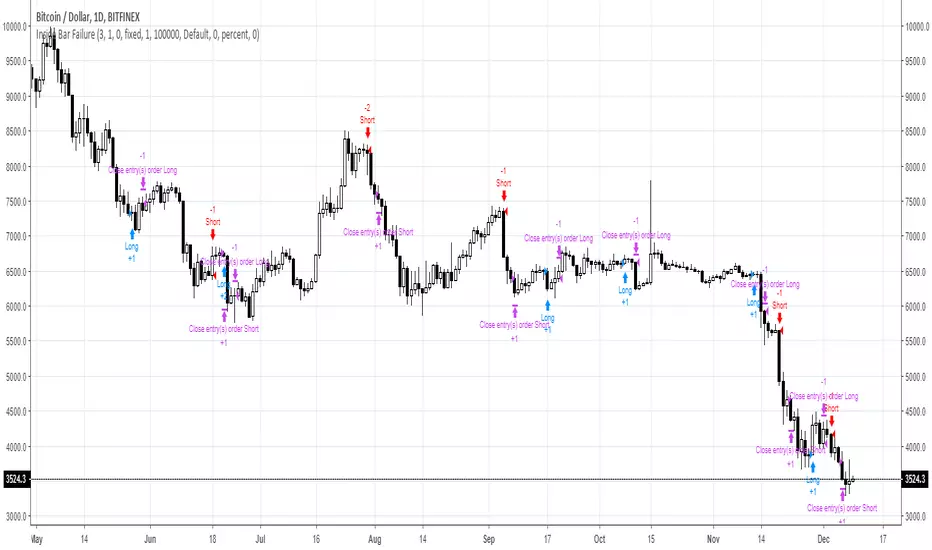
Inside Bar FailureYou can check edge profitability by adjusting the forward looking input, eg. how profitable is this signal after X bars.

Trend Reversal Alerts Strategy [4H/3M]This is advanced version of T-R.A.S with better logic adapted for 4hour / 3month timeframes
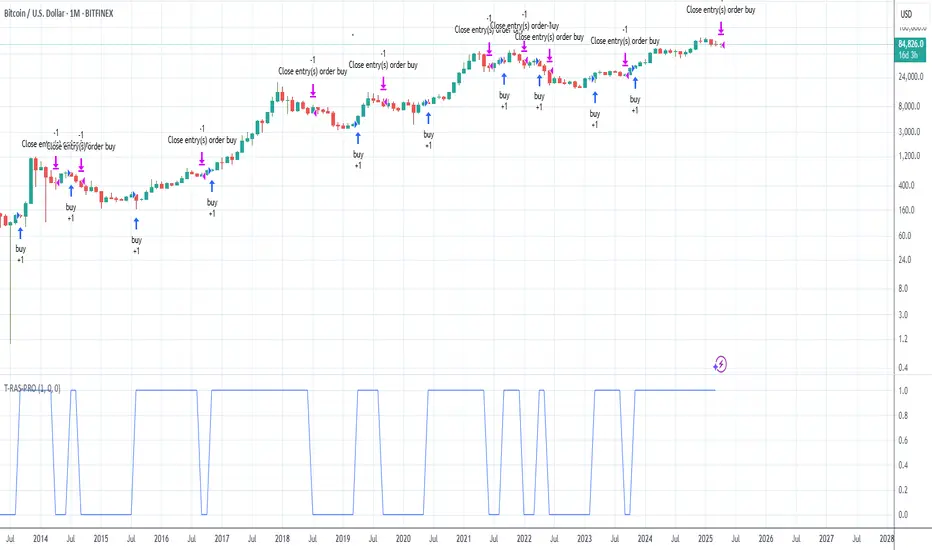
Trend Reversal Alerts Strategy [Advanced]This is a hourly version of T-R.A.S
It's better for houry timeframes : 2h, 3h, 4h, 6h, 12h, 1d, 4d ; otherwise use version for weekly

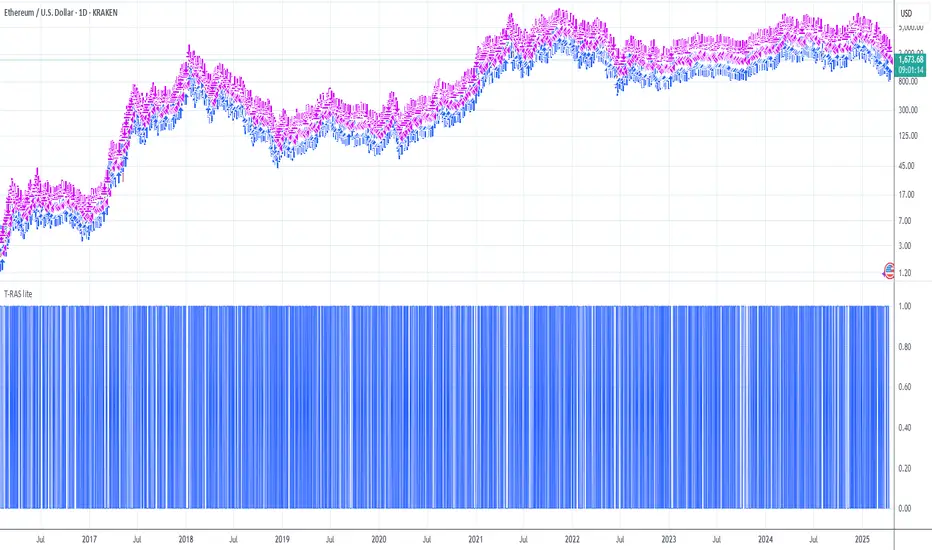
Trend Reversal Alerts Strategy [lite]This strategy was created as experimental and after playing around with it, I was able to realize what is a good way to base your strategy on and what is not.
This one is most primitive way and you should not expect gains from it(it's best on the weekly btw).
Anyway, all my attempts to advance this strategy in the end gave me around 1%2% +Net Profit on the hourly timeframe and drastically reduced the Net Profit by 50% on the weekly, so I think it is a waste of my time, but if you feel like you have ideas to share with me, please feel free to comments below!


MFVB - Macro-Filtered Volatility Breakout策略核心與原創性: 山寨幣 (Altcoins) 的走勢與比特幣高度相關,單純的技術突破往往會因為大盤下跌而變成假動作。 MFVB (宏觀濾網波動突破策略) 並非一般的技術指標,而是一套由**「跨資產同步演算引擎」**驅動的趨勢系統。本策略內建了硬編碼的邏輯,會自動抓取並分析比特幣 (BINANCE:BTCUSDT) 的即時趨勢數據。透過這種獨特的跨市場分析,系統能確保僅在宏觀環境有利時才執行小幣的突破交易。
主要功能與邏輯:
宏觀守門機制 (Macro Gating): 程式會在背景處理外部的 BTC 趨勢數據 (EMA 200)。這是一個強制性的市場狀態濾網:如果比特幣處於空頭趨勢,即使小幣出現技術面突破,系統也會強制過濾訊號,避免逆勢操作。
波動率突破: 使用經過參數調教的肯特納通道 (Keltner Channels) 來偵測動能爆發。只有在價格突破上軌且通過宏觀濾網檢測時,才會觸發進場。
動態風控: 內建 ATR 動態追蹤止損演算法(圖表上的紅線),會隨著價格波動自動調整以鎖定獲利;若價格跌回通道中線則視為趨勢破壞,立即離場。
用法:
適用標的: 各類具備趨勢性的山寨幣 (如 SOL, ETH, MNT, DOGE 等)。
圖表說明: 藍線為通道範圍,紅線為追蹤止損點。
Concept & Originality: Trading Altcoins is risky because the crypto market is highly correlated with Bitcoin. Standard technical breakouts often fail ("fakeouts") when the broader market is bearish. MFVB is not a standard indicator but a specialized trend system driven by a proprietary Cross-Asset Synchronization Engine. It automatically fetches and analyzes Bitcoin's real-time trend data (BINANCE:BTCUSDT) to filter signals on Altcoins. This hard-coded inter-market logic ensures that trades are only taken when the macro environment is favorable.
Key Features & Logic:
Macro Gating Mechanism (The Gatekeeper): The script processes external BTC trend data (EMA 200) in the background. It applies a Market Regime Filter that forbids long positions on Altcoins if Bitcoin is in a downtrend. This logic is hard-coded to prevent trading against the tide.
Volatility Breakout: Utilizes tuned Keltner Channels to identify genuine volatility expansions. A signal is triggered only when the price breaches the Upper Band AND the Macro Filter is confirmed bullish.
Dynamic Risk Management: Features a built-in ATR-based trailing stop (visualized as the Red Line) which automatically adjusts to volatility to lock in profits, alongside a trend-invalidation exit at the channel median.
Usage:
Target Assets: Any trending Altcoins (e.g., SOL, ETH, MNT, DOGE, etc.).
Visuals:
Blue Lines: Volatility Channel.
Red Line: Dynamic Trailing Stop.

Easy Trade Pro [Buy and Sell Strategy + Backtesting System]Hello Traders,
Easy Trade Pro is a comprehensive tool that combines multiple technical indicators into a single customizable one. This tool is the culmination of an extensive trading career, it is designed to help traders navigate the markets in any timeframe and financial asset, like Equities, Futures, Crypto, Forex and Commodities.
Before we deep dive into the comprehensive guide on what Easy Trade Pro is, let's kick off by showcasing the strategy used in this example. Please note, we have adopted an extremely conservative approach strictly following the Tradingview House Rules, which you can review here: www.tradingview.com
The backtest strategy parameters:
Currency pair: EUR USD
Timeframe: 15-min chart
Market: Spot, no leverage
Broker: FXCM
Trading range: 2022-09-01 07:30 — 2023-06-26 20:00
Backtesting range: 2022-08-31 23:00 — 2023-06-26 20:00
Initial Capital: $10,000
Buy Order Size: 20% of the capital, $2,000
Stop Loss: 0.50%
Sell orders: Four different take profits where we unload the position by 25% each time
Broker Fees: Commission set at 0.08$
Slippage: 10 ticks
Understanding FXCM Commissions and Setting Realistic Slippage for EUR/USD Spot Trading:
◉I would like to provide some clarity on the commission structure and slippage setting used in the study for trading the EUR/USD pair on the FXCM spot market. Based on the information available, FXCM charges a commission of $4.00 per standard lot (100,000) on both sides of the trade (meaning at open and close) for the EUR/USD pair. Since the study involve an order size of $2,000 USD, which is equivalent to 0.02 lots, the commission fee for one side of the trade (either buying or selling) would be calculated as $4.00 multiplied by 0.02, which is $0.08. This means that for each individual trade, whether it be a buy or sell, the commission fee would be $0.08.
◉As for slippage, it is crucial to account for the inherent uncertainty in the execution price due to market fluctuations. In the forex market, the EUR/USD pair is quoted with a precision of five decimal places, with the smallest price change being a "pipette" (0.00001). Given that slippage can vary based on market conditions, it is considered fair practice to use a slippage of around 10 ticks under normal market conditions for the EUR/USD pair. This allows for a more realistic representation of the execution price, especially in a liquid and fast-moving market such as forex.
More detailed information about FXCM fees structure in the link below:
docs.fxcorporate.com
Enter a Trade conditions:
For our buy order, we utilize a custom buy signal called 'Bullish Reversal'. A detailed explanation of this and other buy orders can be found later in the guide, specifically in section 1).
To enhance realism in our trading strategy, we have implemented a confirmation mechanism. When utilizing the strategy tester, you have the option to input a value to determine the number of confirmation candles to consider.
For example, if you set the input to 1, the system will check if the next candle following the signal meets the criteria for confirmation. If set to 2, the system will evaluate the second candle, and so on for higher values. The confirmation is determined by comparing the closing or opening price of the selected buy signal candle with the corresponding closing price of the confirmation candle.
In this case we choose as buy signal: 'Bullish Reversal' + 2 candle of confirmation
Exit a trade conditions:
On the sell side, we exit a trade in four different types of sell orders where we take profits. Inside '', you will encounter unique labels attributed to our custom sell signals. A detailed explanation of these sell orders can be found later in the guide, specifically in section 1). We used custom order called:
1TP 'Good Sell'
2TP 'Good Sell'
3TP 'Good Sell'
4TP 'Bearish Reversal' + 4 confirmation candles
Our confirmation logic, for sell signals, is applied only to 'Bearish Reversal' signal. The confirmation is determined by comparing the closing or opening price of the selected 'Bearish Reversal' candle with the corresponding closing price of the confirmation candle. In this case, we wait for the fourth candle from the 'Bearish Reversal' signal to confirm the sell trade.
Protect your capital:
This super-conservative study involves a clear low risk, with the use of $2,000, 20% of our capital. If the stop loss of 0.5% were triggered, we lose 10$, equating to 0.10% of $10,000 - thus affecting only 0.10% of our capital.
Super Conservative Approach & Results:
With 353 closed trades, we achieved a net profit of 2.03%, or $203.34$ relative to our initial $10,000 capital, and a win rate of 73.37%.
Less Conservative Approach & Results:
We could also consider increasing our risk to 0.5% of our capital per trade. We would maintain our stop loss at 0.50%, but we would need to use all our capital to enter the market. If the stop loss of 0.5% will be triggered, we would lose 50$, equating to 0.5% of $10,000.
In this scenario, our net profit would have increased to 10.15%, equivalent to $1015.
Please be aware:
While fully automated strategies can bring considerable advantages, they are not without their cons. For one, relying solely on an automated system may not take into account the potential confluence of other strategies or indicators, such as the significance of support and resistance zones. These elements often require a more nuanced, human understanding of the markets and cannot always be perfectly replicated by an algorithm.
Additionally, it's essential to remember that a significant percentage of traders are not consistently profitable. As such, prudent risk management, a conservative approach, and acceptance of a reasonable profit are crucial aspects of successful trading. While the allure of high returns can be tempting, the sustainability of your trading strategy should always take precedence. Achieving steady, reliable profits over time often outweighs the appeal of a risky, high-return strategy that could potentially lead to substantial losses.
So, while automation can be a powerful tool in your trading arsenal, it's also important to consider other strategies and factors. Always ensure you're managing your risk effectively and approaching trading with a realistic and informed perspective.
------------------------------------------------------------------------ Why Easy Trade Pro is Original? ----------------------------------------------------------------------------------
We developed Easy Trade Pro as a unique and comprehensive solution, and we decided to protect our code to preserve its originality. We invested significant time and effort into making it a realistic trading strategy simulator. The standout features that set Easy Trade Pro apart include:
☀ Versatile Stop Loss Mechanisms: Stop loss execution can be complex and often requires careful coding to work as intended. In most freely available open-source codes, stop losses are implemented using the Average True Range (ATR). ATR can be beneficial but has limitations:
☁ Lagging Indicator - Like most technical indicators, the ATR is a lagging indicator. This means it is based on past data, and so it may not accurately reflect future market volatility. If market conditions change rapidly, the ATR may not adjust quickly enough, potentially leading to suboptimal stop loss levels.
☁ No Directional Information - The ATR measures volatility, but it does not provide any indication of the direction of the trend. Therefore, it should not be used as a standalone tool for making trading decisions, but should be used in conjunction with other technical analysis tools that can provide directional cues.
☁ Inefficiency in Trending Markets - In strongly trending markets, ATR-based stops can sometimes be too far from the current price level. This could lead to larger losses if the price moves against your trade before hitting the stop loss. On the flip side, in less volatile, sideways markets, an ATR-based stop might be set too close to the entry point, leading to premature stop outs.
☁ Overoptimization Risk - If you're backtesting a trading strategy, there's a risk of overoptimizing your stop loss settings by fine-tuning them to past data. The best ATR multiplier that worked in the past might not necessarily work in the future, leading to potential performance issues.
☀ We countered these by implementing four different types of 'protect the trade' mechanisms:
✔ Fixed Percentage Stop Loss
✔ Trailing Stop Loss
✔ Stop Loss Moved to Entry Upon Reaching Certain Gain
✔ Stop Loss Moved to Entry Upon Reaching First Take Profit Order ("Custom Order").
☀ Dual Exit Strategy: We incorporated two distinct methods of exiting a trade. The first uses our custom signals, while the second triggers exit at a certain percentage of gain.
☀ Multiple Take Profit Orders: You have the flexibility to establish up to four different sell orders. This feature enables you to fractionate your exit strategy according to your needs. You can choose to trigger these fractions based on our custom signals or determine your own exit points by setting targeted gains at a fixed percentage.
☀ Confirmation Candle System: This feature enhances trade precision by requiring confirmation candles after a buy or sell signal. This confirmation, dependent on the next candle's closing price, helps reduce false signals and improves entry and exit points. While our confirmation system is applicable to all custom buy signals, it's solely dedicated for the bearish reversal when it comes to sell signals.
☀ Universal Compatibility: Easy Trade Pro's Strategy Tester works perfectly with any asset class. The code can handle different contract types, including the SPX contracts and fractional assets like Bitcoin. It's optimized to ensure proper execution of trades without rounding issues.
☀ Bullish and Bearish Reversal candles: Our method of detecting these pivotal candles combines conditions from buy and sell signals with pertinent divergences in Price, RSI, and Volume (OBV). The distinguishing factor, however, lies in recognizing significant shifts in market structure and liquidity grabs. To further enhance the credibility of our indicator, we've incorporated Bollinger Bands, serving as an additional layer in spotting potential trend reversals, particularly when aligned with long-wick candlesticks, engulfing patterns, and morning or evening star formations.
☀ Non-Repainting Indicator: Our indicator signals are designed not to repaint. Once a signal appears, it stays fixed, offering a reliable tool for your trading decisions.
================================================== EXTENSIVE TECHNICAL DESCRIPTION ====================================================
Easy Trade Pro is versatile, allowing you to analyze market trends across any financial asset. With its rigorous testing, our tool can be used confidently on any timeframe, from 1D to 1min, whether you prefer longer-term or shorter-term trades.
Although we recommend trading on timeframes between 1D and 1min, higher timeframes like 1W chart, can also provide broader insights.
Our study combines a variety of popular technical indicators, such as RSI, Stochastic RSI, MACD, DMI, Bollinger Bands as well as relevant EMAs. On the volume side OBV and MFI. Using a data-driven approach, “Easy Trade Pro” analyzes historical market trends to identify optimal ways to combine these indicators with significant divergences between price and oscillators. On top of that the code considers relevant changes in market structure and liquidity grabs, to generate reliable and accurate signals for potential buy and sell opportunities.
* ☎ --> Please not that MACD, BBs, and EMAs account for a minimal part of our script <--- ☎, If you're looking for a simpler tool, consider checking out our open-source indicator, 'RSI, SRSI, MACD, and DMI cross - Open source code'. You can find it here:
With our customizable system, traders will be able to identify:
1) Three types of buy signals🐂,💰,💎 and sell signals 🐻,🔨,💀
2) Bullish and bearish reversal candles with support and resistance lines
3) Bull and bear momentum signals
4) A function that utilizes Color bars to identify the strength of the trend
5) Three customizable moving averages
6) Alerts direct to your email or phone
7) Advanced and customizable settings menu
8) Our software also includes a backtesting system that that allows users to test their trading strategies on historical data, to check how they would have performed in real-world market conditions. This can help refine a trading strategy and make more informed decisions.
------------------------------------------------------------------------------ 1) BUY AND SELL SIGNALS ---------------------------------------------------------------------------------
Our buy and sell signals are generated using a custom combination of RSI, MFI, and Stochastic RSI levels, as well as relevant MACD and Stochastic RSI crosses. These indicators are carefully analyzed to identify potential trading opportunities and determine optimal entry and exit points for trades.
RSI (Relative strength index) measures the strength of a security's price action, while the SRSI (Stochastic Relative Strength Index) is a momentum oscillator that measures the current price relative to its high and low range over a set period. The Money Flow Index (MFI) is another momentum indicator that uses both price and volume data to measure buying and selling pressure. MACD (Moving Average Convergence Divergence) is a popular technical indicator used in financial markets to analyze price trends and momentum.
▶ With our system, you'll be able to identify three different levels of buy signals:
◉ The first level of buy signal is represented by a 🐂 emoji and is a "Good Buy". This signal indicates a possible buying opportunity. It indicates that could be a good opportunity to enter in a long trade. It's important to note that, the "Good Buy" signal can sometimes be supplemented with a green "Bull" text and a flag plotshape positioned beneath the signal. In these scenarios, we categorize this as a "Good Buy Bull" signal.
◉ The second level of buy signal is represented by a 💰 emoji and is a "Great Buy". This signal indicates a stronger buying opportunity than the "Good Buy" signal.
◉ The third and strongest buy signal is represented by a 💎 emoji and is an "Incredible Buy". This signal indicates a stronger buying opportunity than the "Good Buy" and "Great Buy" signals
▶ With our system, you'll be able to identify three different levels of sell signals:
◉ On the sell side, the first level is represented by a 🐻 emoji and is a "Good Sell". This signal indicates a possible selling opportunity. It indicates that could be a good opportunity to exit a trade or open a short position. It's important to note that, the "Good Sell" signal can occasionally be accompanied by a red "Bear" text and a flag plotshape positioned beneath the signal. In such instances, we refer to this as a "Good Sell Bear" signal.
◉ The second sell signal is represented by a 🔨 emoji and is a "Great Sell". This signal indicates a stronger selling opportunity than the "Good Sell" signal.
◉ The third and strongest sell signal is represented by a 💀 emoji and is an "Incredible Sell". This signal indicates a stronger selling opportunity than the "Good Sell" and "Great Sell" signals.
------------------------------------------2) "BULLISH AND BEARISH REVERSAL CANDLES PLUS SUPPORT AND RESISTANCE LINES" ------------------------------------------------
Bullish and bearish reversal candles are specific candles that have more probability to reverse the trend.
Our trading indicator is designed to identify bullish and bearish reversal candles. Our method of detecting these pivotal candles combines conditions from buy and sell signals with pertinent divergences in Price, RSI, and Volume (OBV). The distinguishing factor, however, lies in recognizing significant shifts in market structure and liquidity grabs. To further enhance the credibility of our indicator, we've incorporated Bollinger Bands, serving as an additional layer in spotting potential trend reversals, particularly when aligned with long-wick candlesticks, engulfing patterns, and morning or evening star formations.
These candles are represented by blue and orange colors respectively by default. Additionally, the indicator also uses lines that are drawn at either the opening or closing of candles to help identify pivot points of support or resistance. These candles, lines color or shape are customizable in the settings menu.
How can I benefit the most from bullish reversal candles? To make the most of bullish reversal candles, a powerful strategy is:
E.g, 1D chart - Wait for the next 1 or 2 candles to close above the support line linked to the bullish reversal candle. For lower timeframes, it is recommended to wait for 2 or 3 candles before making a trading decision. A good tip is also to look for other signals (confluence), like a buy signal. Traders should decide based on their risk tolerance.
Here below we can see an example of a bullish reversal candle in the BTC/USDT, 1D, chart. The system identify a bullish reversal candle (blue color), the next 2 candles are green and closed above the support blue line, in addition we have other bullish signals (confluence).
How can I benefit the most from bullish reversal lines? Bullish reversal lines can help traders to identify key level of support and maintain control of their position until a clear break below occurs.
In the example below we se how the price retrace to the support line:
After touching the price bounce up.
How can I benefit the most from bearish reversal candles? To make the most of bearish reversal candles, a powerful strategy is:
E.g, 1D chart - Wait for the next 1 or 2 candles to close below the resistance line linked to the bearish reversal candle. For lower timeframes, it is recommended to wait for 2 or 3 candles before making a trading decision. Traders should decide based on their risk tolerance.
Here below we can see an example of a bearish reversal candle in the ETH/USDT, 1D, chart. The system identify a bearish reversal candle (orange color), the next candle is red and closes below the resistance orange line. A good tip is also to look for other signals (confluence), like a sell signal.
How can I benefit the most from bearish reversal lines? Bearish reversal lines can help traders to identify key level of resistance and maintain control of their position until a clear break above occurs.
In the example below we se how the price bounce back to the resistance line and get rejected.
------------------------------------------------------------------------- 3) BULL AND BEAR MOMENTUM SIGNALS -----------------------------------------------------------------------
We analyzed factors such as buy or sell signals, long or short confirmation signals, DMI crossup or crossdown and breaks of market structure (BOS) or change of character (CHoCh) to determine the strength and direction of the trend. These study give us bull trend or bear trend signals that can help traders identify potential trading opportunities and make informed decisions.
These conditions are represented by a green word "BULL" and a flag shape below (bull momentum) and by a red word "BEAR" and a flag shape above (bear momentum) respectively by default. These plots shapes are customizable in the settings menu.
How can I benefit the most from bull momentum signals? To make the most of bull momentum signals, a powerful strategy is:
E.g, 1D chart - Look for confluence. If bull signal comes with a "Good Buy 🐂" in the same candle the signal is more strong. Another good combo is to look for a bullish reversal candle prior or after this signal, usually within a range of 1/2 candles. For lower timeframes, it is recommended to wait 2/3 candles before making a trading decision.
In the picture below we can see an example of a bull momentum signal in the US500, 1D, chart.
How can I benefit the most from bear momentum signals? To make the most of bear momentum signals, a powerful strategy is:
E.g, 1D chart - Look for confluence. If bear signal comes with a "Good Sell 🐻" in the same candle the signal is more strong. Another good combo is to look for a bearish reversal candle prior or after this signal, usually within a range of 1/2 candles. For lower timeframes, it is recommended to wait 2/3 candles before making a trading decision.
In the picture below we can see an example of a bear momentum signal in combo with a sell signal, NETFLIX, 1D, chart.
-------------------------------------------------------------- 4) "COLOR BARS THAT INDICATE THE STRENGTH OF THE TREND -----------------------------------------------------
This code is responsible for changing the color of the bars on a chart based on certain conditions. The gradient colors are defined for green and red, and the algorithm checks if the current bar is within a certain range of either a bearish reversal or bullish reversal candle and whether the price is above or below certain exponential moving averages or if important break of market structure occurs.
Ultimately, this feature helps traders visually identify potential trends and market shifts and avoid getting distracted by price fluctuations. Please note that every gradient of color can be customize by the user. We set 3 different bullish colors and 3 different bearish colors.
Below the picture of the settings menu related to the bar color.
----------------------------------------------------------------------5)THREE CUSTOMIZABLE MOVING AVERAGES ----------------------------------------------------------------------
You can choose up to three moving averages, any length and any type like SMA, EMA, WMA, HMA, RMA, SWMA and VWMA. Furthermore, you have the freedom to adjust the color and width of the lines to your preference.
Below the picture of the settings menu related to the moving averages.
----------------------------------------------------------------------6) ALERTS DIRECT TO YOUR EMAIL OR PHONE --------------------------------------------------------------------
Our alert feature sends real-time notifications directly to your email or phone when a signal is generated, allowing you to take immediate action and stay ahead of the market.
With our system, you first establish your own rules for trading in the strategy tester - this includes your criteria for entering and exiting trades.
Once you've defined these conditions, our system will start sending you alerts. These alerts will be triggered whenever your specified conditions are met. So, if the market matches your 'enter trade' conditions, you'll receive an alert prompting. Similarly, when your 'exit trade' conditions are met, you'll receive another alert.
Remember, these alerts are purely based on the conditions you set.
Once the condition is met, you will receive alerts directly to your email or phone when enter and exit a trade based on your custom conditions. To make sure you receive these notifications click on notifications tab.
---------------------------------------------------------------7) ADVANCED AND CUSTOMIZABLE SETTINGS MENU----------------------------------------------------------------------
We designed Easy Trade indicators with traders in mind, so it's user-friendly, easy to navigate and users can customize inputs, style, and colors of every feature in the indicator's settings menu.
-----------------------------------------------------------------------8) EASY TRADE PRO - BACKTESTING SYSTEM----------------------------------------------------------------------
Easy Trade Pro features a highly effective and realistic backtesting system, designed to mirror as closely as possible the real-world scenarios of entering and exiting trades.
Step 1:
Open the settings menu of the Indicator.
Once opened the settings menu click on properties.
Decide on the capital you wish to invest. Choose whether to use contracts or USD and determine the size of your orders. For the sake of realism, we recommend not exceeding 25% of your capital per order. However, if you decide to utilize your entire capital, make sure to adjust your stop loss accordingly. For instance, if you have a capital of 10K and use 10K with a stop loss at 2%, your potential loss would be $200. Conversely, if you use only 2K of your 10K capital with a stop loss at 10%, you would still lose the same 2% of your capital. To make your simulation even more authentic, consider incorporating broker fees or commissions into your calculations. For example, spot market fees are typically around 0.10%. If you're backtesting markets with low liquidity, consider factoring in slippage as well.
Step 2:
Navigate to the 'Inputs' section and scroll down until you come across 'Backtesting System - Strategy Test'. Once you locate this, click on the box and activate the 'USE STRATEGY SYSTEM' option by checking the tick box.
Also You will then need to set a 'Start Date' and 'End Date', establishing a specific time period during which you wish to test your strategy.
Otherwise you can consider to use the deep backtesting feature.
Step 3:
It's now time to establish the conditions for entering a trade. You can choose from five different types of custom buy signals: Good Buy, Good Buy Bull, Great Buy, Incredible Buy, and Bullish Reversal. Note that 'Great Buy' and 'Incredible Buy' are rare signals, so we advise against using them frequently in mechanical strategy tests; instead, consider them more for manual live tests. For more consistent results, we recommend using the other buy signals.
After determining your preferred buy signal, you can choose how many confirmation candles you wish to wait for before entering a trade. A 'confirmation' means that if the next candle closes above the opening or closing price of the chosen buy signal, it's considered a confirmation. This could be the opening or closing price, depending on whether the candle is green (close > open) or red.
You can set the number of confirmation candles in different time frames: below 2h, between 2h and 10h, and above 10h.
Step 4:
It's now time to safeguard your trade by managing risk. You can choose to implement a stop loss, expressed in percentage terms, or opt for a trailing stop. A trailing stop is a type of stop loss order that moves with the market price. It is designed to protect gains by enabling a trade to remain open and continue to profit as long as the market price is moving in a favorable direction. However, the trade closes if the market price changes direction by a specified amount (the 'trailing stop distance').
Additionally, you can minimize losses and move the stop loss to your entry point once the price reaches a certain percentage of profit. This strategy can help secure potential gains while limiting the potential for losses.
Step 5:
Now it's time to set the conditions for exiting the trade. You have the option to divide your exit into a maximum of four parts, with each part representing 25% of the position size. For each take profit point, you can choose from three different custom sell signals: Good Sell, Good Sell Bear, and Bearish Reversal.
Similarly, the concept of confirmation candles also applies here, but in this case, the candles are not closing above. A 'confirmation' for a sell signal means that if the next candle closes below the opening or closing price of the selected sell signal, it's considered a confirmation. This could be the opening or closing price, depending on whether the candle is green (open > close) or red (close < open).
So, when you're looking to sell, a confirmation would occur if the next candlestick's closing price is lower than the opening or closing price of the candlestick that triggered the sell signal. This indicates a potential bearish trend, providing the confirmation to execute the sell order.
Additionally, we've introduced a feature that allows you to move your stop loss to the entry point whenever the first take profit (1TP) is reached, which equates to hitting one custom sell signal.
Step 6:
We've also designed an alternative method for taking profits. With this approach, you can choose to exit your position once a fixed percentage gain from the entry point is reached. For instance, you might decide to exit when a 10% profit is achieved. Similarly to the previous method, this approach allows you to choose up to four exit points and determine the proportion of your position you want to close at each stage.
Conclusion:
Easy Trade Pro provides users with various options for entering and exiting trades. To effectively utilize the indicator, we strongly recommend conducting thorough backtesting and considering the results across your preferred trading pairs. It is advisable to analyze a substantial number of trades, ideally exceeding 100 trades, to obtain reliable insights into the indicator's performance. This approach will help you gain a better understanding of how Easy Trade Pro aligns with your trading strategy and objectives.
❗Keep attention❗
It is important to note that no trading indicator or strategy is foolproof, and there is always a risk of losses in trading. While this indicator may provide useful information for making conclusions, it should not be used as the sole basis for making trading decisions. Traders should always use proper risk management techniques and consider multiple factors when making trading decisions.
It is also important to be aware of the limitations of simulated performance results. Hypothetical or simulated results do not represent actual trading, and since trades have not been executed, results may be over- or under-compensated for market factors such as lack of liquidity. Simulated trading programs are also designed with the benefit of hindsight, and no representation is being made that any account will achieve profits or losses similar to those shown. Therefore, our indicators are for informative purposes only and not intended to be used as financial advice.
We encourage traders to use our indicators as part of a well-rounded trading strategy and to always be aware of the risks involved in trading. Remember that past performance is not indicative of future results and always trade responsibly.

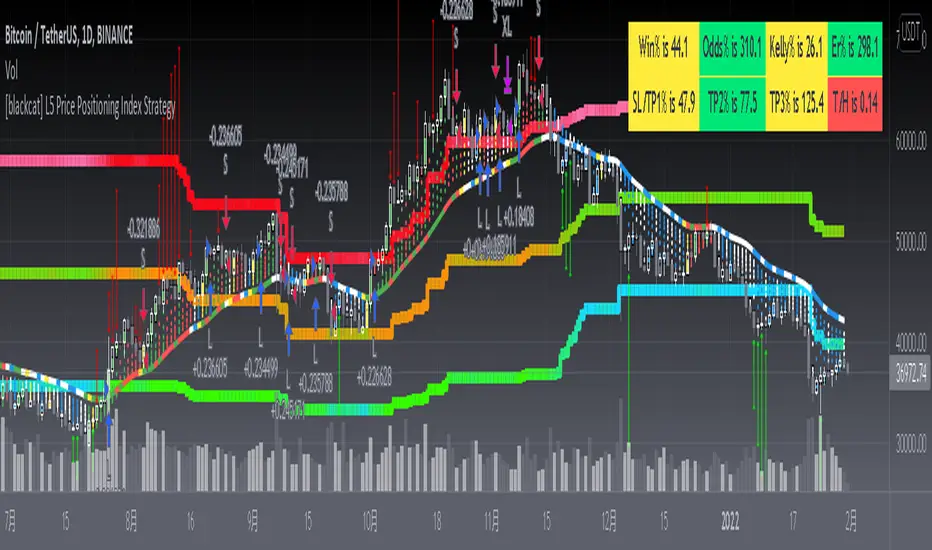
[blackcat] L5 Price Positioning Index StrategyLevel: 5
Background
Are you tired of traditional Japanese candlesticks? Do you want to try a new type of candle master chart? This is my private L5 version, which introduces "Market Season Bands" for oversold and overbought status, historical resistance and support arrows in dynamic forms, inherent pyramiding for buy and sell.
Function
L3 Price Positioning Index is totally brand-new candle chart invented by myself. This main chart can provide effective resistance and support levels, and you can see where the price is running at any time. There are 3 key color bands. Blue-Green gredient band is used to indicate oversold support or breakthrough support levels; the color is blue means extreme oversold, green means oversold you can ignore. This band indicates the season of market entering "Winter". The Green-Orange band indicates the midline position where prices may pause; the green color here means bear middle while orange color here means bull middle. Accordingly, middle band color indicates market season entering "Spring or Autumn" . Finally, Pink-Red band indicates overbought resistance or breakthrough resistance levels; the pink color means market season is NOT bullish while the red color indicates it is a good market season to long. top band color indicates the market season entering "Summer". Enjoy your "Summer" with profit!
There are two types of candlestick charts.
The first type candles are mid-to-long-term trend candles, navy represents an uptrend and the length of the candle represents a change in intensity; maroon represents a downward trend and the length of the candle represents a change in intensity. You can find principle in L5 Price Positioning Index code. In L5 version, to simplif the visual effect, the display is hidden. This trend candle is the effective support and resistance level of the second type short-term swing candle.
The second type candles are short-term candles fluctuate around the first medium- and long-term trend candles. The second short-term candle is divided into five colors: green means pump; red means retracement in the ascending process; blue and yellow means bearish rebounce and trend reversal signal; white means dump; blue means price rebound in the descending process. I describe these in raindrop or snow-drop form, which can be quite familar for you to imagine the temperature of the market :).
Key Signal
THREE KEY LINES:
htop --> Pink-Red band, "Market in Summer", overbought resistance or pump breakout threshold
hmid --> Green-Orange band, "Market in Spring or Autumn", price pause zone, sideways may happen here
hbot --> Blue-Green gredient band, "Market in Winter", oversold support or dump breakout threshold
MID-LONG TERM CANDLES:
colorful trend line , it is an important support or resistance for short term price movements and the bull-bear boundary for market seasons.
SHORT TERM CANDLES:
1. bear rebounance --> rebounce in down trend candle with blue color
2. pump --> up trend pump candle with green color
3. trend reversal --> trend reversal candle with yellow color
4. dump --> bearish dump candle with white color
5. bull retracement --> retracement in up trend candle with red
Pros and Cons
Pros:
1. Long term trend identification by three lines for overbought, oversold and breakouts
2. Mid term trend support and resistance with a colorful boundary
3. Short term price behaviors are classified into 5 types of candles in blue, green, yellow, red and white
Cons:
I invent this to solve traditional JP candlestick shortcomings. If you find anything on Cons, just feedback to me for improvements.
Remarks
1. This is the strategy version of L5 Price Positioning Index
2. Closed-source, Invite-only, NOT free. (Free version is available by search "L3 Price Positioning Index")
3. Highl recommended to use this indicator for >= 4H timeframe, which means this is powerful for swing trading.
4. IMPORTANT!!! To have superior visual effect, you need to enter "Chart Setting" --> "Symbol" --> TURN OFF "Body", "Borders" and "Wick" of traditional JP candles.
Subscription
Permission will be automatically granted for who subscribed " L5 Price Positioning Index for Market Seasons"