Donchian Quest Research// =================================
Trend following strategy.
// =================================
Strategy uses two channels. One channel - for opening trades. Second channel - for closing.
Channel is similar to Donchian channel, but uses Close prices (not High/Low). That helps don't react to wicks of volatile candles (“stop hunting”). In most cases openings occur earlier than in Donchian channel. Closings occur only for real breakout.
// =================================
Strategy waits for beginning of trend - when price breakout of channel. Default length of both channels = 50 candles.
Conditions of trading:
- Open Long: If last Close = max Close for 50 closes.
- Close Long: If last Close = min Close for 50 closes.
- Open Short: If last Close = min Close for 50 closes.
- Close Short: If last Close = max Close for 50 closes.
// =================================
Color of lines:
- black - channel for opening trade.
- red - channel for closing trade.
- yellow - entry price.
- fuchsia - stoploss and breakeven.
- vertical green - go Long.
- vertical red - go Short.
- vertical gray - close in end, don't trade anymore.
// =================================
Order size calculated with ATR and volatility.
You can't trade 1 contract in BTC and 1 contract in XRP - for example. They have different price and volatility, so 1 contract BTC not equal 1 contract XRP.
Script uses universal calculation for every market. It is based on:
- Risk - USD sum you ready to loss in one trade. It calculated as percent of Equity.
- ATR indicator - measurement of volatility.
With default setting your stoploss = 0.5 percent of equity:
- If initial capital is 1000 USD and used parameter "Permit stop" - loss will be 5 USD (0.5 % of equity).
- If your Equity rises to 2000 USD and used parameter "Permit stop"- loss will be 10 USD (0.5 % of Equity).
// =================================
This Risk works only if you enable “Permit stop” parameter in Settings.
If this parameter disabled - strategy works as reversal strategy:
⁃ If close Long - channel border works as stoploss and momentarily go Short.
⁃ If close Short - channel border works as stoploss and momentarily go Long.
Channel borders changed dynamically. So sometime your loss will be greater than ‘Risk %’. Sometime - less than ‘Risk %’.
If this parameter enabled - maximum loss always equal to 'Risk %'. This parameter also include breakeven: if profit % = Risk %, then move stoploss to entry price.
// =================================
Like all trend following strategies - it works only in trend conditions. If no trend - slowly bleeding. There is no special additional indicator to filter trend/notrend. You need to trade every signal of strategy.
Strategy gives many losses:
⁃ 30 % of trades will close with profit.
⁃ 70 % of trades will close with loss.
⁃ But profit from 30% will be much greater than loss from 70 %.
Your task - patiently wait for it and don't use risky setting for position sizing.
// =================================
Recommended timeframe - Daily.
// =================================
Trend can vary in lengths. Selecting length of channels determine which trend you will be hunting:
⁃ 20/10 - from several days to several weeks.
⁃ 20/20 or 50/20 - from several weeks to several months.
⁃ 50/50 or 100/50 or 100/100 - from several months to several years.
// =================================
Inputs (Settings):
- Length: length of channel for trade opening/closing. You can choose 20/10, 20/20, 50/20, 50/50, 100/50, 100/100. Default value: 50/50.
- Permit Long / Permit short: Longs are most profitable for this strategy. You can disable Shorts and enable Longs only. Default value: permit all directions.
- Risk % of Equity: for position sizing used Equity percent. Don't use values greater than 5 % - it's risky. Default value: 0.5%.
⁃ ATR multiplier: this multiplier moves stoploss up or down. Big multiplier = small size of order, small profit, stoploss far from entry, low chance of stoploss. Small multiplier = big size of order, big profit, stop near entry, high chance of stoploss. Default value: 2.
- ATR length: number of candles to calculate ATR indicator. It used for order size and stoploss. Default value: 20.
- Close in end - to close active trade in the end (and don't trade anymore) or leave it open. You can see difference in Strategy Tester. Default value: don’t close.
- Permit stop: use stop or go reversal. Default value: without stop, reversal strategy.
// =================================
Properties (Settings):
- Initial capital - 1000 USD.
- Script don't uses 'Order size' - you need to change 'Risk %' in Inputs instead.
- Script don't uses 'Pyramiding'.
- 'Commission' 0.055 % and 'Slippage' 0 - this parameters are for crypto exchanges with perpetual contracts (for example Bybit). If use on other markets - set it accordingly to your exchange parameters.
// =================================
Big dataset used for chart - 'BITCOIN ALL TIME HISTORY INDEX'. It gives enough trades to understand logic of script. It have several good trends.
// =================================
ابحث في النصوص البرمجية عن "candle"

Anand's Strategy
First, we identify the trend, the trend will be determined by the daily candles, whenever the daily candle closes above the high of a previous candle the trend becomes positive and the trend remains positive till the time a candle closes below the lowest price of this candle, however, if the cost of any future candle closes above the high of this candle then the bottom of this candle becomes the SL/ trend change point. And vice versa for the opposing side.
Once we have identified the trend we will trade only on the side of the trend in the 15mins candles
If the trend is positive then only positive trades will be initiated when the conditions are fulfilled I.e
Whenever a 15min candle closes above the high of a previous 15min candle then we enter the trade and if any 15min candle closes below the lowest price of this candle then we SL our trade, once any candle closes above the highest price of this candle then the lowest price of that candle becomes our trailing SL

GKD-BT Baseline Backtest [Loxx]The Giga Kaleidoscope GKD-BT Baseline Backtest is a backtesting module included in Loxx's "Giga Kaleidoscope Modularized Trading System."
█ GKD-BT Baseline Backtest
The GKD-BT Baseline Backtest allows traders to backtest the Regular and Stepped baselines used in the GKD trading system. This module includes 65+ moving averages and 15+ types of volatility to choose from.
Additionally, this backtest module provides the option to test the GKD-B indicator with 1 to 3 take profits and 1 stop loss. The Trading backtest allows for the use of 1 to 3 take profits, while the Full backtest is limited to 1 take profit. The Trading backtest also offers the capability to apply a trailing take profit.
In terms of the percentage of trade removed at each take profit, this backtest module has the following hardcoded values:
Take profit 1: 50% of the trade is removed
Take profit 2: 25% of the trade is removed
Take profit 3: 25% of the trade is removed
Stop loss: 100% of the trade is removed
After each take profit is achieved, the stop loss level is adjusted. When take profit 1 is reached, the stop loss is moved to the entry point. Similarly, when take profit 2 is reached, the stop loss is shifted to take profit 1. The trailing take profit feature comes into play after take profit 2 or take profit 3, depending on the number of take profits selected in the settings. The trailing take profit is always activated on the final take profit when 2 or more take profits are chosen.
The backtest also offers the capability to restrict by a specific date range, allowing for simulated forward testing based on past data. Additionally, users have the option to display or hide a trading panel that provides relevant information about the backtest, statistics, and the current trade. It is also possible to activate alerts and toggle sections of the trading panel on or off. On the chart, historical take profit and stop loss levels are represented by horizontal lines overlaid for reference.
This backtest also includes an optional GKD-E Exit indicator that can be used to test early exits.
The GKD system utilizes volatility-based take profits and stop losses. Each take profit and stop loss is calculated as a multiple of volatility. You can change the values of the multipliers in the settings as well.
To utilize this strategy, follow these steps:
1. (Required) Import the value "Input into NEW GKD-BT Backtest" from the GKD-B Baseline indicator into the GKD-BT Baseline Backtest field "Import GKD-B Baseline"
2. (Optional) Import the value "Input into NEW GKD-BT Backtest" from the GKD-E Exit indicator into the GKD-BT Baseline Backtest field "Import GKD-E Exit". You can toggle the Exit on or off using the "Activate GKD-E Exit" option.
Baselines that are compatible with this backtest module:
GKD-B Baseline
GKD-B Stepped Baseline
Volatility Types Included
17 types of volatility are included in this indicator
Close-to-Close
Parkinson
Garman-Klass
Rogers-Satchell
Yang-Zhang
Garman-Klass-Yang-Zhang
Exponential Weighted Moving Average
Standard Deviation of Log Returns
Pseudo GARCH(2,2)
Average True Range
True Range Double
Standard Deviation
Adaptive Deviation
Median Absolute Deviation
Efficiency-Ratio Adaptive ATR
Mean Absolute Deviation
Static Percent
█ Giga Kaleidoscope Modularized Trading System
Core components of an NNFX algorithmic trading strategy
The NNFX algorithm is built on the principles of trend, momentum, and volatility. There are six core components in the NNFX trading algorithm:
1. Volatility - price volatility; e.g., Average True Range, True Range Double, Close-to-Close, etc.
2. Baseline - a moving average to identify price trend
3. Confirmation 1 - a technical indicator used to identify trends
4. Confirmation 2 - a technical indicator used to identify trends
5. Continuation - a technical indicator used to identify trends
6. Volatility/Volume - a technical indicator used to identify volatility/volume breakouts/breakdown
7. Exit - a technical indicator used to determine when a trend is exhausted
8. Metamorphosis - a technical indicator that produces a compound signal from the combination of other GKD indicators*
*(not part of the NNFX algorithm)
What is Volatility in the NNFX trading system?
In the NNFX (No Nonsense Forex) trading system, ATR (Average True Range) is typically used to measure the volatility of an asset. It is used as a part of the system to help determine the appropriate stop loss and take profit levels for a trade. ATR is calculated by taking the average of the true range values over a specified period.
True range is calculated as the maximum of the following values:
-Current high minus the current low
-Absolute value of the current high minus the previous close
-Absolute value of the current low minus the previous close
ATR is a dynamic indicator that changes with changes in volatility. As volatility increases, the value of ATR increases, and as volatility decreases, the value of ATR decreases. By using ATR in NNFX system, traders can adjust their stop loss and take profit levels according to the volatility of the asset being traded. This helps to ensure that the trade is given enough room to move, while also minimizing potential losses.
Other types of volatility include True Range Double (TRD), Close-to-Close, and Garman-Klass
What is a Baseline indicator?
The baseline is essentially a moving average, and is used to determine the overall direction of the market.
The baseline in the NNFX system is used to filter out trades that are not in line with the long-term trend of the market. The baseline is plotted on the chart along with other indicators, such as the Moving Average (MA), the Relative Strength Index (RSI), and the Average True Range (ATR).
Trades are only taken when the price is in the same direction as the baseline. For example, if the baseline is sloping upwards, only long trades are taken, and if the baseline is sloping downwards, only short trades are taken. This approach helps to ensure that trades are in line with the overall trend of the market, and reduces the risk of entering trades that are likely to fail.
By using a baseline in the NNFX system, traders can have a clear reference point for determining the overall trend of the market, and can make more informed trading decisions. The baseline helps to filter out noise and false signals, and ensures that trades are taken in the direction of the long-term trend.
What is a Confirmation indicator?
Confirmation indicators are technical indicators that are used to confirm the signals generated by primary indicators. Primary indicators are the core indicators used in the NNFX system, such as the Average True Range (ATR), the Moving Average (MA), and the Relative Strength Index (RSI).
The purpose of the confirmation indicators is to reduce false signals and improve the accuracy of the trading system. They are designed to confirm the signals generated by the primary indicators by providing additional information about the strength and direction of the trend.
Some examples of confirmation indicators that may be used in the NNFX system include the Bollinger Bands, the MACD (Moving Average Convergence Divergence), and the MACD Oscillator. These indicators can provide information about the volatility, momentum, and trend strength of the market, and can be used to confirm the signals generated by the primary indicators.
In the NNFX system, confirmation indicators are used in combination with primary indicators and other filters to create a trading system that is robust and reliable. By using multiple indicators to confirm trading signals, the system aims to reduce the risk of false signals and improve the overall profitability of the trades.
What is a Continuation indicator?
In the NNFX (No Nonsense Forex) trading system, a continuation indicator is a technical indicator that is used to confirm a current trend and predict that the trend is likely to continue in the same direction. A continuation indicator is typically used in conjunction with other indicators in the system, such as a baseline indicator, to provide a comprehensive trading strategy.
What is a Volatility/Volume indicator?
Volume indicators, such as the On Balance Volume (OBV), the Chaikin Money Flow (CMF), or the Volume Price Trend (VPT), are used to measure the amount of buying and selling activity in a market. They are based on the trading volume of the market, and can provide information about the strength of the trend. In the NNFX system, volume indicators are used to confirm trading signals generated by the Moving Average and the Relative Strength Index. Volatility indicators include Average Direction Index, Waddah Attar, and Volatility Ratio. In the NNFX trading system, volatility is a proxy for volume and vice versa.
By using volume indicators as confirmation tools, the NNFX trading system aims to reduce the risk of false signals and improve the overall profitability of trades. These indicators can provide additional information about the market that is not captured by the primary indicators, and can help traders to make more informed trading decisions. In addition, volume indicators can be used to identify potential changes in market trends and to confirm the strength of price movements.
What is an Exit indicator?
The exit indicator is used in conjunction with other indicators in the system, such as the Moving Average (MA), the Relative Strength Index (RSI), and the Average True Range (ATR), to provide a comprehensive trading strategy.
The exit indicator in the NNFX system can be any technical indicator that is deemed effective at identifying optimal exit points. Examples of exit indicators that are commonly used include the Parabolic SAR, the Average Directional Index (ADX), and the Chandelier Exit.
The purpose of the exit indicator is to identify when a trend is likely to reverse or when the market conditions have changed, signaling the need to exit a trade. By using an exit indicator, traders can manage their risk and prevent significant losses.
In the NNFX system, the exit indicator is used in conjunction with a stop loss and a take profit order to maximize profits and minimize losses. The stop loss order is used to limit the amount of loss that can be incurred if the trade goes against the trader, while the take profit order is used to lock in profits when the trade is moving in the trader's favor.
Overall, the use of an exit indicator in the NNFX trading system is an important component of a comprehensive trading strategy. It allows traders to manage their risk effectively and improve the profitability of their trades by exiting at the right time.
What is an Metamorphosis indicator?
The concept of a metamorphosis indicator involves the integration of two or more GKD indicators to generate a compound signal. This is achieved by evaluating the accuracy of each indicator and selecting the signal from the indicator with the highest accuracy. As an illustration, let's consider a scenario where we calculate the accuracy of 10 indicators and choose the signal from the indicator that demonstrates the highest accuracy.
The resulting output from the metamorphosis indicator can then be utilized in a GKD-BT backtest by occupying a slot that aligns with the purpose of the metamorphosis indicator. The slot can be a GKD-B, GKD-C, or GKD-E slot, depending on the specific requirements and objectives of the indicator. This allows for seamless integration and utilization of the compound signal within the GKD-BT framework.
How does Loxx's GKD (Giga Kaleidoscope Modularized Trading System) implement the NNFX algorithm outlined above?
Loxx's GKD v2.0 system has five types of modules (indicators/strategies). These modules are:
1. GKD-BT - Backtesting module (Volatility, Number 1 in the NNFX algorithm)
2. GKD-B - Baseline module (Baseline and Volatility/Volume, Numbers 1 and 2 in the NNFX algorithm)
3. GKD-C - Confirmation 1/2 and Continuation module (Confirmation 1/2 and Continuation, Numbers 3, 4, and 5 in the NNFX algorithm)
4. GKD-V - Volatility/Volume module (Confirmation 1/2, Number 6 in the NNFX algorithm)
5. GKD-E - Exit module (Exit, Number 7 in the NNFX algorithm)
6. GKD-M - Metamorphosis module (Metamorphosis, Number 8 in the NNFX algorithm, but not part of the NNFX algorithm)
(additional module types will added in future releases)
Each module interacts with every module by passing data to A backtest module wherein the various components of the GKD system are combined to create a trading signal.
That is, the Baseline indicator passes its data to Volatility/Volume. The Volatility/Volume indicator passes its values to the Confirmation 1 indicator. The Confirmation 1 indicator passes its values to the Confirmation 2 indicator. The Confirmation 2 indicator passes its values to the Continuation indicator. The Continuation indicator passes its values to the Exit indicator, and finally, the Exit indicator passes its values to the Backtest strategy.
This chaining of indicators requires that each module conform to Loxx's GKD protocol, therefore allowing for the testing of every possible combination of technical indicators that make up the six components of the NNFX algorithm.
What does the application of the GKD trading system look like?
Example trading system:
Backtest: GKD-BT Baseline Backtest as shown on the chart above
Baseline: Hull Moving Average as shown on the chart above
Volatility/Volume: Hurst Exponent
Confirmation 1: Sherif's HiLo
Confirmation 2: uf2018
Continuation: Coppock Curve
Exit: Fisher Transform as shown on the chart above
Metamorphosis: Baseline Optimizer
Each GKD indicator is denoted with a module identifier of either: GKD-BT, GKD-B, GKD-C, GKD-V, GKD-M, or GKD-E. This allows traders to understand to which module each indicator belongs and where each indicator fits into the GKD system.
█ Giga Kaleidoscope Modularized Trading System Signals
Standard Entry
1. GKD-C Confirmation gives signal
2. Baseline agrees
3. Price inside Goldie Locks Zone Minimum
4. Price inside Goldie Locks Zone Maximum
5. Confirmation 2 agrees
6. Volatility/Volume agrees
1-Candle Standard Entry
1a. GKD-C Confirmation gives signal
2a. Baseline agrees
3a. Price inside Goldie Locks Zone Minimum
4a. Price inside Goldie Locks Zone Maximum
Next Candle
1b. Price retraced
2b. Baseline agrees
3b. Confirmation 1 agrees
4b. Confirmation 2 agrees
5b. Volatility/Volume agrees
Baseline Entry
1. GKD-B Baseline gives signal
2. Confirmation 1 agrees
3. Price inside Goldie Locks Zone Minimum
4. Price inside Goldie Locks Zone Maximum
5. Confirmation 2 agrees
6. Volatility/Volume agrees
7. Confirmation 1 signal was less than 'Maximum Allowable PSBC Bars Back' prior
1-Candle Baseline Entry
1a. GKD-B Baseline gives signal
2a. Confirmation 1 agrees
3a. Price inside Goldie Locks Zone Minimum
4a. Price inside Goldie Locks Zone Maximum
5a. Confirmation 1 signal was less than 'Maximum Allowable PSBC Bars Back' prior
Next Candle
1b. Price retraced
2b. Baseline agrees
3b. Confirmation 1 agrees
4b. Confirmation 2 agrees
5b. Volatility/Volume agrees
Volatility/Volume Entry
1. GKD-V Volatility/Volume gives signal
2. Confirmation 1 agrees
3. Price inside Goldie Locks Zone Minimum
4. Price inside Goldie Locks Zone Maximum
5. Confirmation 2 agrees
6. Baseline agrees
7. Confirmation 1 signal was less than 7 candles prior
1-Candle Volatility/Volume Entry
1a. GKD-V Volatility/Volume gives signal
2a. Confirmation 1 agrees
3a. Price inside Goldie Locks Zone Minimum
4a. Price inside Goldie Locks Zone Maximum
5a. Confirmation 1 signal was less than 'Maximum Allowable PSVVC Bars Back' prior
Next Candle
1b. Price retraced
2b. Volatility/Volume agrees
3b. Confirmation 1 agrees
4b. Confirmation 2 agrees
5b. Baseline agrees
Confirmation 2 Entry
1. GKD-C Confirmation 2 gives signal
2. Confirmation 1 agrees
3. Price inside Goldie Locks Zone Minimum
4. Price inside Goldie Locks Zone Maximum
5. Volatility/Volume agrees
6. Baseline agrees
7. Confirmation 1 signal was less than 7 candles prior
1-Candle Confirmation 2 Entry
1a. GKD-C Confirmation 2 gives signal
2a. Confirmation 1 agrees
3a. Price inside Goldie Locks Zone Minimum
4a. Price inside Goldie Locks Zone Maximum
5a. Confirmation 1 signal was less than 'Maximum Allowable PSC2C Bars Back' prior
Next Candle
1b. Price retraced
2b. Confirmation 2 agrees
3b. Confirmation 1 agrees
4b. Volatility/Volume agrees
5b. Baseline agrees
PullBack Entry
1a. GKD-B Baseline gives signal
2a. Confirmation 1 agrees
3a. Price is beyond 1.0x Volatility of Baseline
Next Candle
1b. Price inside Goldie Locks Zone Minimum
2b. Price inside Goldie Locks Zone Maximum
3b. Confirmation 1 agrees
4b. Confirmation 2 agrees
5b. Volatility/Volume agrees
Continuation Entry
1. Standard Entry, 1-Candle Standard Entry, Baseline Entry, 1-Candle Baseline Entry, Volatility/Volume Entry, 1-Candle Volatility/Volume Entry, Confirmation 2 Entry, 1-Candle Confirmation 2 Entry, or Pullback entry triggered previously
2. Baseline hasn't crossed since entry signal trigger
4. Confirmation 1 agrees
5. Baseline agrees
6. Confirmation 2 agrees

GKD-BT Full Giga Kaleidoscope Backtest [Loxx]Giga Kaleidoscope GKD-BT Full Giga Kaleidoscope Backtest is a Backtesting module included in Loxx's "Giga Kaleidoscope Modularized Trading System".
█ GKD-BT Full Giga Kaleidoscope Backtest
The Full Giga Kaleidoscope Backtest module enables users to backtest Full GKD Long and Short signals, allowing the creation of a comprehensive NNFX trading system consisting of two confirmation indicators, a baseline, a measure of volatility/volume, and continuations.
This module offers two types of backtests: Trading and Full. The Trading backtest allows users to evaluate individual Long and Short trades one by one. On the other hand, the Full backtest enables the analysis of Longs or Shorts separately by toggling between them in the settings, providing insights into the results for each signal type. The Trading backtest simulates actual trading conditions, while the Full backtest evaluates all signals regardless of their Long or Short nature.
Additionally, the backtest module allows testing with 1 to 3 take profits and 1 stop loss. The Trading backtest supports 1 to 3 take profits, while the Full backtest is limited to 1 take profit. The Trading backtest also includes a trailing take profit feature.
Regarding the percentage of trade removed at each take profit, the backtest module incorporates the following predefined values:
Take profit 1: 50% of the trade is removed.
Take profit 2: 25% of the trade is removed.
Take profit 3: 25% of the trade is removed.
Stop loss: 100% of the trade is removed.
After achieving each take profit, the stop loss level is adjusted accordingly. When take profit 1 is reached, the stop loss is moved to the entry point. Similarly, when take profit 2 is reached, the stop loss is shifted to take profit 1. The trailing take profit feature comes into effect after take profit 2 or take profit 3, depending on the number of take profits selected in the settings. The trailing take profit is always activated on the final take profit when 2 or more take profits are chosen.
The backtest module also provides the option to restrict testing to a specific date range, allowing for simulated forward testing using past data. Additionally, users can choose to display or hide a trading panel that provides relevant information about the backtest, statistics, and the current trade. It is also possible to activate alerts and toggle sections of the trading panel on or off. Historical take profit and stop loss levels are displayed as overlaid horizontal lines on the chart for reference.
To utilize this strategy, follow these steps:
1. GKD-B Baseline Import: Import the value "Input into NEW GKD-BT Backtest" from the GKD-B Baseline module into the GKD-BT Full Giga Kaleidoscope Backtest module setting named "Import GKD-B Baseline."
2. GKD-V Volatility/Volume Import: Import the value "Input into NEW GKD-BT Backtest" from the GKD-V Volatility/Volume module into the GKD-BT Full Giga Kaleidoscope Backtest module setting named "Import GKD-V Volatility/Volume."
3. Adjust the "Confirmation 1 Type" in the GKD-C Confirmation Indicator to "GKD New."
4. GKD-C Confirmation 1 Import: Import the value "Input into NEW GKD-BT Backtest" from the GKD-C Confirmation 1 module into the GKD-BT Full Giga Kaleidoscope Backtest module setting named "Import GKD-C Confirmation 1."
5. Adjust the "Confirmation 2 Type" in the GKD-C Confirmation 2 Indicator to "GKD New."
6. GKD-C Confirmation 2 Import: Import the value "Input into NEW GKD-BT Backtest" from the GKD-C Confirmation 2 module into the GKD-BT Full Giga Kaleidoscope Backtest module setting named "Import GKD-C Confirmation 2."
7. Adjust the "Confirmation Type" in the GKD-C Continuation Indicator to "GKD New."
8. GKD-C Continuation Import: Import the value "Input into NEW GKD-BT Backtest" from the GKD-C Continuation module into the GKD-BT Full Giga Kaleidoscope Backtest module setting named "Import GKD-C Confirmation."
The GKD system utilizes volatility-based take profits and stop losses, where each take profit and stop loss is calculated as a multiple of volatility. Users have the flexibility to adjust the multiplier values in the settings to suit their preferences.
In a future update, the Full Giga Kaleidoscope Backtest module will include the option to incorporate a GKD-E Exit indicator, completing the full trading strategy.
█ Full Giga Kaleidoscope Backtest Entries
Within this module, there are ten distinct types of entries available, which are outlined below:
Standard Entry
1-Candle Standard Entry
Baseline Entry
1-Candle Baseline Entry
Volatility/Volume Entry
1-Candle Volatility/Volume Entry
Confirmation 2 Entry
1-Candle Confirmation 2 Entry
PullBack Entry
Continuation Entry
Each of these entry types can generate either long or short signals, resulting in a total of 20 signal variations. The user has the flexibility to enable or disable specific entry types and choose which qualifying rules within each entry type are applied to price to determine the final long or short signal.
The following section provides an overview of the various entry types and their corresponding qualifying rules:
Standard Entry
1. GKD-C Confirmation gives signal
2. Baseline agrees
3. Price inside Goldie Locks Zone Minimum
4. Price inside Goldie Locks Zone Maximum
5. Confirmation 2 agrees
6. Volatility/Volume agrees
1-Candle Standard Entry
1a. GKD-C Confirmation gives signal
2a. Baseline agrees
3a. Price inside Goldie Locks Zone Minimum
4a. Price inside Goldie Locks Zone Maximum
Next Candle
1b. Price retraced
2b. Baseline agrees
3b. Confirmation 1 agrees
4b. Confirmation 2 agrees
5b. Volatility/Volume agrees
Baseline Entry
1. GKD-B Basline gives signal
2. Confirmation 1 agrees
3. Price inside Goldie Locks Zone Minimum
4. Price inside Goldie Locks Zone Maximum
5. Confirmation 2 agrees
6. Volatility/Volume agrees
7. Confirmation 1 signal was less than 'Maximum Allowable PSBC Bars Back' prior
1-Candle Baseline Entry
1a. GKD-B Baseline gives signal
2a. Confirmation 1 agrees
3a. Price inside Goldie Locks Zone Minimum
4a. Price inside Goldie Locks Zone Maximum
5a. Confirmation 1 signal was less than 'Maximum Allowable PSBC Bars Back' prior
Next Candle
1b. Price retraced
2b. Baseline agrees
3b. Confirmation 1 agrees
4b. Confirmation 2 agrees
5b. Volatility/Volume agrees
Volatility/Volume Entry
1. GKD-V Volatility/Volume gives signal
2. Confirmation 1 agrees
3. Price inside Goldie Locks Zone Minimum
4. Price inside Goldie Locks Zone Maximum
5. Confirmation 2 agrees
6. Baseline agrees
7. Confirmation 1 signal was less than 7 candles prior
1-Candle Volatility/Volume Entry
1a. GKD-V Volatility/Volume gives signal
2a. Confirmation 1 agrees
3a. Price inside Goldie Locks Zone Minimum
4a. Price inside Goldie Locks Zone Maximum
5a. Confirmation 1 signal was less than 'Maximum Allowable PSVVC Bars Back' prior
Next Candle
1b. Price retraced
2b. Volatility/Volume agrees
3b. Confirmation 1 agrees
4b. Confirmation 2 agrees
5b. Baseline agrees
Confirmation 2 Entry
1. GKD-C Confirmation 2 gives signal
2. Confirmation 1 agrees
3. Price inside Goldie Locks Zone Minimum
4. Price inside Goldie Locks Zone Maximum
5. Volatility/Volume agrees
6. Baseline agrees
7. Confirmation 1 signal was less than 7 candles prior
1-Candle Confirmation 2 Entry
1a. GKD-C Confirmation 2 gives signal
2a. Confirmation 1 agrees
3a. Price inside Goldie Locks Zone Minimum
4a. Price inside Goldie Locks Zone Maximum
5a. Confirmation 1 signal was less than 'Maximum Allowable PSC2C Bars Back' prior
Next Candle
1b. Price retraced
2b. Confirmation 2 agrees
3b. Confirmation 1 agrees
4b. Volatility/Volume agrees
5b. Baseline agrees
PullBack Entry
1a. GKD-B Baseline gives signal
2a. Confirmation 1 agrees
3a. Price is beyond 1.0x Volatility of Baseline
Next Candle
1b. Price inside Goldie Locks Zone Minimum
2b. Price inside Goldie Locks Zone Maximum
3b. Confirmation 1 agrees
4b. Confirmation 2 agrees
5b. Volatility/Volume agrees
Continuation Entry
1. Standard Entry, 1-Candle Standard Entry, Baseline Entry, 1-Candle Baseline Entry, Volatility/Volume Entry, 1-Candle Volatility/Volume Entry, Confirmation 2 Entry, 1-Candle Confirmation 2 Entry, or Pullback entry triggered previously
2. Baseline hasn't crossed since entry signal trigger
4. Confirmation 1 agrees
5. Baseline agrees
6. Confirmation 2 agrees
█ Volatility Types Included
This module includes 17 types of volatility:
Close-to-Close
Parkinson
Garman-Klass
Rogers-Satchell
Yang-Zhang
Garman-Klass-Yang-Zhang
Exponential Weighted Moving Average
Standard Deviation of Log Returns
Pseudo GARCH(2,2)
Average True Range
True Range Double
Standard Deviation
Adaptive Deviation
Median Absolute Deviation
Efficiency-Ratio Adaptive ATR
Mean Absolute Deviation
Static Percent
Close-to-Close
Close-to-Close volatility is a classic and widely used volatility measure, sometimes referred to as historical volatility.
Volatility is an indicator of the speed of a stock price change. A stock with high volatility is one where the price changes rapidly and with a larger amplitude. The more volatile a stock is, the riskier it is.
Close-to-close historical volatility is calculated using only a stock's closing prices. It is the simplest volatility estimator. However, in many cases, it is not precise enough. Stock prices could jump significantly during a trading session and return to the opening value at the end. That means that a considerable amount of price information is not taken into account by close-to-close volatility.
Despite its drawbacks, Close-to-Close volatility is still useful in cases where the instrument doesn't have intraday prices. For example, mutual funds calculate their net asset values daily or weekly, and thus their prices are not suitable for more sophisticated volatility estimators.
Parkinson
Parkinson volatility is a volatility measure that uses the stock’s high and low price of the day.
The main difference between regular volatility and Parkinson volatility is that the latter uses high and low prices for a day, rather than only the closing price. This is useful as close-to-close prices could show little difference while large price movements could have occurred during the day. Thus, Parkinson's volatility is considered more precise and requires less data for calculation than close-to-close volatility.
One drawback of this estimator is that it doesn't take into account price movements after the market closes. Hence, it systematically undervalues volatility. This drawback is addressed in the Garman-Klass volatility estimator.
Garman-Klass
Garman-Klass is a volatility estimator that incorporates open, low, high, and close prices of a security.
Garman-Klass volatility extends Parkinson's volatility by taking into account the opening and closing prices. As markets are most active during the opening and closing of a trading session, it makes volatility estimation more accurate.
Garman and Klass also assumed that the process of price change follows a continuous diffusion process (Geometric Brownian motion). However, this assumption has several drawbacks. The method is not robust for opening jumps in price and trend movements.
Despite its drawbacks, the Garman-Klass estimator is still more effective than the basic formula since it takes into account not only the price at the beginning and end of the time interval but also intraday price extremes.
Researchers Rogers and Satchell have proposed a more efficient method for assessing historical volatility that takes into account price trends. See Rogers-Satchell Volatility for more detail.
Rogers-Satchell
Rogers-Satchell is an estimator for measuring the volatility of securities with an average return not equal to zero.
Unlike Parkinson and Garman-Klass estimators, Rogers-Satchell incorporates a drift term (mean return not equal to zero). As a result, it provides better volatility estimation when the underlying is trending.
The main disadvantage of this method is that it does not take into account price movements between trading sessions. This leads to an underestimation of volatility since price jumps periodically occur in the market precisely at the moments between sessions.
A more comprehensive estimator that also considers the gaps between sessions was developed based on the Rogers-Satchel formula in the 2000s by Yang-Zhang. See Yang Zhang Volatility for more detail.
Yang-Zhang
Yang Zhang is a historical volatility estimator that handles both opening jumps and the drift and has a minimum estimation error.
Yang-Zhang volatility can be thought of as a combination of the overnight (close-to-open volatility) and a weighted average of the Rogers-Satchell volatility and the day’s open-to-close volatility. It is considered to be 14 times more efficient than the close-to-close estimator.
Garman-Klass-Yang-Zhang
Garman-Klass-Yang-Zhang (GKYZ) volatility estimator incorporates the returns of open, high, low, and closing prices in its calculation.
GKYZ volatility estimator takes into account overnight jumps but not the trend, i.e., it assumes that the underlying asset follows a Geometric Brownian Motion (GBM) process with zero drift. Therefore, the GKYZ volatility estimator tends to overestimate the volatility when the drift is different from zero. However, for a GBM process, this estimator is eight times more efficient than the close-to-close volatility estimator.
Exponential Weighted Moving Average
The Exponentially Weighted Moving Average (EWMA) is a quantitative or statistical measure used to model or describe a time series. The EWMA is widely used in finance, with the main applications being technical analysis and volatility modeling.
The moving average is designed such that older observations are given lower weights. The weights decrease exponentially as the data point gets older – hence the name exponentially weighted.
The only decision a user of the EWMA must make is the parameter lambda. The parameter decides how important the current observation is in the calculation of the EWMA. The higher the value of lambda, the more closely the EWMA tracks the original time series.
Standard Deviation of Log Returns
This is the simplest calculation of volatility. It's the standard deviation of ln(close/close(1)).
Pseudo GARCH(2,2)
This is calculated using a short- and long-run mean of variance multiplied by ?.
?avg(var;M) + (1 ? ?) avg(var;N) = 2?var/(M+1-(M-1)L) + 2(1-?)var/(M+1-(M-1)L)
Solving for ? can be done by minimizing the mean squared error of estimation; that is, regressing L^-1var - avg(var; N) against avg(var; M) - avg(var; N) and using the resulting beta estimate as ?.
Average True Range
The average true range (ATR) is a technical analysis indicator, introduced by market technician J. Welles Wilder Jr. in his book New Concepts in Technical Trading Systems, that measures market volatility by decomposing the entire range of an asset price for that period.
The true range indicator is taken as the greatest of the following: current high less the current low; the absolute value of the current high less the previous close; and the absolute value of the current low less the previous close. The ATR is then a moving average, generally using 14 days, of the true ranges.
True Range Double
A special case of ATR that attempts to correct for volatility skew.
Standard Deviation
Standard deviation is a statistic that measures the dispersion of a dataset relative to its mean and is calculated as the square root of the variance. The standard deviation is calculated as the square root of variance by determining each data point's deviation relative to the mean. If the data points are further from the mean, there is a higher deviation within the data set; thus, the more spread out the data, the higher the standard deviation.
Adaptive Deviation
By definition, the Standard Deviation (STD, also represented by the Greek letter sigma ? or the Latin letter s) is a measure that is used to quantify the amount of variation or dispersion of a set of data values. In technical analysis, we usually use it to measure the level of current volatility.
Standard Deviation is based on Simple Moving Average calculation for mean value. This version of standard deviation uses the properties of EMA to calculate what can be called a new type of deviation, and since it is based on EMA, we can call it EMA deviation. Additionally, Perry Kaufman's efficiency ratio is used to make it adaptive (since all EMA type calculations are nearly perfect for adapting).
The difference when compared to the standard is significant--not just because of EMA usage, but the efficiency ratio makes it a "bit more logical" in very volatile market conditions.
Median Absolute Deviation
The median absolute deviation is a measure of statistical dispersion. Moreover, the MAD is a robust statistic, being more resilient to outliers in a data set than the standard deviation. In the standard deviation, the distances from the mean are squared, so large deviations are weighted more heavily, and thus outliers can heavily influence it. In the MAD, the deviations of a small number of outliers are irrelevant.
Because the MAD is a more robust estimator of scale than the sample variance or standard deviation, it works better with distributions without a mean or variance, such as the Cauchy distribution.
Efficiency-Ratio Adaptive ATR
Average True Range (ATR) is a widely used indicator for many occasions in technical analysis. It is calculated as the RMA of the true range. This version adds a "twist": it uses Perry Kaufman's Efficiency Ratio to calculate adaptive true range.
Mean Absolute Deviation
The mean absolute deviation (MAD) is a measure of variability that indicates the average distance between observations and their mean. MAD uses the original units of the data, which simplifies interpretation. Larger values signify that the data points spread out further from the average. Conversely, lower values correspond to data points bunching closer to it. The mean absolute deviation is also known as the mean deviation and average absolute deviation.
This definition of the mean absolute deviation sounds similar to the standard deviation (SD). While both measure variability, they have different calculations. In recent years, some proponents of MAD have suggested that it replace the SD as the primary measure because it is a simpler concept that better fits real life.
Static Percent
Static Percent allows the user to insert their own constant percent that will then be used to create take profits and stoploss
█ Giga Kaleidoscope Modularized Trading System
Core components of an NNFX algorithmic trading strategy
The NNFX algorithm is built on the principles of trend, momentum, and volatility. There are six core components in the NNFX trading algorithm:
1. Volatility - price volatility; e.g., Average True Range, True Range Double, Close-to-Close, etc.
2. Baseline - a moving average to identify price trend
3. Confirmation 1 - a technical indicator used to identify trends
4. Confirmation 2 - a technical indicator used to identify trends
5. Continuation - a technical indicator used to identify trends
6. Volatility/Volume - a technical indicator used to identify volatility/volume breakouts/breakdown
7. Exit - a technical indicator used to determine when a trend is exhausted
What is Volatility in the NNFX trading system?
In the NNFX (No Nonsense Forex) trading system, ATR (Average True Range) is typically used to measure the volatility of an asset. It is used as a part of the system to help determine the appropriate stop loss and take profit levels for a trade. ATR is calculated by taking the average of the true range values over a specified period.
True range is calculated as the maximum of the following values:
-Current high minus the current low
-Absolute value of the current high minus the previous close
-Absolute value of the current low minus the previous close
ATR is a dynamic indicator that changes with changes in volatility. As volatility increases, the value of ATR increases, and as volatility decreases, the value of ATR decreases. By using ATR in NNFX system, traders can adjust their stop loss and take profit levels according to the volatility of the asset being traded. This helps to ensure that the trade is given enough room to move, while also minimizing potential losses.
Other types of volatility include True Range Double (TRD), Close-to-Close, and Garman-Klass
What is a Baseline indicator?
The baseline is essentially a moving average, and is used to determine the overall direction of the market.
The baseline in the NNFX system is used to filter out trades that are not in line with the long-term trend of the market. The baseline is plotted on the chart along with other indicators, such as the Moving Average (MA), the Relative Strength Index (RSI), and the Average True Range (ATR).
Trades are only taken when the price is in the same direction as the baseline. For example, if the baseline is sloping upwards, only long trades are taken, and if the baseline is sloping downwards, only short trades are taken. This approach helps to ensure that trades are in line with the overall trend of the market, and reduces the risk of entering trades that are likely to fail.
By using a baseline in the NNFX system, traders can have a clear reference point for determining the overall trend of the market, and can make more informed trading decisions. The baseline helps to filter out noise and false signals, and ensures that trades are taken in the direction of the long-term trend.
What is a Confirmation indicator?
Confirmation indicators are technical indicators that are used to confirm the signals generated by primary indicators. Primary indicators are the core indicators used in the NNFX system, such as the Average True Range (ATR), the Moving Average (MA), and the Relative Strength Index (RSI).
The purpose of the confirmation indicators is to reduce false signals and improve the accuracy of the trading system. They are designed to confirm the signals generated by the primary indicators by providing additional information about the strength and direction of the trend.
Some examples of confirmation indicators that may be used in the NNFX system include the Bollinger Bands, the MACD (Moving Average Convergence Divergence), and the MACD Oscillator. These indicators can provide information about the volatility, momentum, and trend strength of the market, and can be used to confirm the signals generated by the primary indicators.
In the NNFX system, confirmation indicators are used in combination with primary indicators and other filters to create a trading system that is robust and reliable. By using multiple indicators to confirm trading signals, the system aims to reduce the risk of false signals and improve the overall profitability of the trades.
What is a Continuation indicator?
In the NNFX (No Nonsense Forex) trading system, a continuation indicator is a technical indicator that is used to confirm a current trend and predict that the trend is likely to continue in the same direction. A continuation indicator is typically used in conjunction with other indicators in the system, such as a baseline indicator, to provide a comprehensive trading strategy.
What is a Volatility/Volume indicator?
Volume indicators, such as the On Balance Volume (OBV), the Chaikin Money Flow (CMF), or the Volume Price Trend (VPT), are used to measure the amount of buying and selling activity in a market. They are based on the trading volume of the market, and can provide information about the strength of the trend. In the NNFX system, volume indicators are used to confirm trading signals generated by the Moving Average and the Relative Strength Index. Volatility indicators include Average Direction Index, Waddah Attar, and Volatility Ratio. In the NNFX trading system, volatility is a proxy for volume and vice versa.
By using volume indicators as confirmation tools, the NNFX trading system aims to reduce the risk of false signals and improve the overall profitability of trades. These indicators can provide additional information about the market that is not captured by the primary indicators, and can help traders to make more informed trading decisions. In addition, volume indicators can be used to identify potential changes in market trends and to confirm the strength of price movements.
What is an Exit indicator?
The exit indicator is used in conjunction with other indicators in the system, such as the Moving Average (MA), the Relative Strength Index (RSI), and the Average True Range (ATR), to provide a comprehensive trading strategy.
The exit indicator in the NNFX system can be any technical indicator that is deemed effective at identifying optimal exit points. Examples of exit indicators that are commonly used include the Parabolic SAR, the Average Directional Index (ADX), and the Chandelier Exit.
The purpose of the exit indicator is to identify when a trend is likely to reverse or when the market conditions have changed, signaling the need to exit a trade. By using an exit indicator, traders can manage their risk and prevent significant losses.
In the NNFX system, the exit indicator is used in conjunction with a stop loss and a take profit order to maximize profits and minimize losses. The stop loss order is used to limit the amount of loss that can be incurred if the trade goes against the trader, while the take profit order is used to lock in profits when the trade is moving in the trader's favor.
Overall, the use of an exit indicator in the NNFX trading system is an important component of a comprehensive trading strategy. It allows traders to manage their risk effectively and improve the profitability of their trades by exiting at the right time.
How does Loxx's GKD (Giga Kaleidoscope Modularized Trading System) implement the NNFX algorithm outlined above?
Loxx's GKD v2.0 system has five types of modules (indicators/strategies). These modules are:
1. GKD-BT - Backtesting module (Volatility, Number 1 in the NNFX algorithm)
2. GKD-B - Baseline module (Baseline and Volatility/Volume, Numbers 1 and 2 in the NNFX algorithm)
3. GKD-C - Confirmation 1/2 and Continuation module (Confirmation 1/2 and Continuation, Numbers 3, 4, and 5 in the NNFX algorithm)
4. GKD-V - Volatility/Volume module (Confirmation 1/2, Number 6 in the NNFX algorithm)
5. GKD-E - Exit module (Exit, Number 7 in the NNFX algorithm)
(additional module types will added in future releases)
Each module interacts with every module by passing data to A backtest module wherein the various components of the GKD system are combined to create a trading signal.
That is, the Baseline indicator passes its data to Volatility/Volume. The Volatility/Volume indicator passes its values to the Confirmation 1 indicator. The Confirmation 1 indicator passes its values to the Confirmation 2 indicator. The Confirmation 2 indicator passes its values to the Continuation indicator. The Continuation indicator passes its values to the Exit indicator, and finally, the Exit indicator passes its values to the Backtest strategy.
This chaining of indicators requires that each module conform to Loxx's GKD protocol, therefore allowing for the testing of every possible combination of technical indicators that make up the six components of the NNFX algorithm.
What does the application of the GKD trading system look like?
Example trading system:
Backtest: Full Giga Kaleidoscope Backtest as shown on the chart above
Baseline: Hull Moving Average as shown on the chart above
Volatility/Volume: Hurst Exponent as shown on the chart above
Confirmation 1: Vorext as shown on the chart above
Confirmation 2: Coppock Curve as shown on the chart above
Continuation: Fisher Transform as shown on the chart above
Exit: Rex Oscillator
Each GKD indicator is denoted with a module identifier of either: GKD-BT, GKD-B, GKD-C, GKD-V, or GKD-E. This allows traders to understand to which module each indicator belongs and where each indicator fits into the GKD system.

X48 - Strategy | ADAPTIVE CONSECUTIVE + TP/SL | V.1Thanks For Tradingview Built-in Script :: << Original From Consecutive Strategy Built-in Script >>
================== Read This First Before Use This Strategy ==============
Please be aware that this strategy is not a guarantee of success and may lead to losses.
Trading involves risk and you should always do your own research before making any decisions.
This Strategy Just an Idea For Help Your Decision For Open Position.
You Must Be Search and Make Your Self Understand What You Doing In This Strategy.
Example :: This Strategy and Indicator Find The Consecutive Bars And You, You Are Reading Must Be Decision Up to You !!
For Backtest Show It's That For a Newbie 100$ Portfolio and 16.333$ Per Order Size
>>>> Read Me First !! <<<<<
========== Detailed and meaningful description =========
How It's Work : This Strategy are Following Green or Red Candle :: example 3 Green Candle To OpenLong Position
Can Set TP/SL if you want :: Just Fine The Best Value of Asset as you want
Fast Trend = MA FAST LINE
SLOW Trend = MA SLOW LINE
MID-TERM TREND = MA MID-TERM
LONG-TERM TREND = MA LONG-TERM
=========== Condition And Statement ===========
Long Condition Statement :: Candles Consecutive Bars Up and close > golden_line and fast_line > golden_line
Short Condition Statement :: Candles Consecutive Bars Down and close < golden_line and fast_line < golden_line
AutoCloseLong Condition :: Candles ConsecutiveBarsDownStop and close > golden_line and close < death_line and close < death_line and close < death_line or fastUpdeath
AutoCloseShort Condition :: Candles ConsecutiveBarsUpStop and close < golden_line and close > death_line and close > death_line and close > death_line or fastUpdeath
====== For ADAPTIVE you can customize your ALL MA For Your Statement
/////////For Example Hook Alert Command ////////////
Just Easy Command >> :: {{strategy.order.alert_message}}
Or Other Json You Should Edit Command Like This Example
{"ex":"'bnfuture'","side": "AutoLong", "$16.333", "symbol": "{{ticker}}", "passphrase": "1234","leverage":"10", "tp" : "5", "sl" : "2", "tl" : "2", "callback" : "1"}
{"ex":"'bnfuture'","side": "AutoShort", "$16.333", "symbol": "{{ticker}}", "passphrase": "1234","leverage":"10", "tp" : "5", "sl" : "2", "tl" : "2", "callback" : "1"}

Strategy Myth-Busting #11 - TrendMagic+SqzMom+CDV - [MYN]This is part of a new series we are calling "Strategy Myth-Busting" where we take open public manual trading strategies and automate them. The goal is to not only validate the authenticity of the claims but to provide an automated version for traders who wish to trade autonomously.
Our 11th one is an automated version of the "Magic Trading Strategy : Most Profitable Indicator : 1 Minute Scalping Strategy Crypto" strategy from "Fx MENTOR US" who doesn't make any official claims but given the indicators he was using, it looked like on the surface that this might actually work. The strategy author uses this on the 1 minute and 3 minute timeframes on mostly FOREX and Heiken Ashi candles but as the title of his strategy indicates is designed for Crypto. So who knows..
To backtest this accurately and get a better picture we resolved the Heiken Ashi bars to standard candlesticks . Even so, I was unable to sustain any consistency in my results on either the 1 or 3 min time frames and both FOREX and Crypto. 10000% Busted.
This strategy uses a combination of 3 open-source public indicators:
Trend Magic by KivancOzbilgic
Squeeze Momentum by LazyBear
Cumulative Delta Volume by LonesomeTheBlue
Trend Magic consists of two main indicators to validate momentum and volatility. It uses an ATR like a trailing Stop to determine the overarching momentum and CCI as a means to validate volatility. Together these are used as the primary indicator in this strategy. When the CCI is above 0 this is confirmation of a volatility event is occurring with affirmation based upon current momentum (ATR).
The CCI volatility indicator gets confirmation by the the Cumulative Delta Volume indicator which calculates the difference between buying and selling pressure. Volume Delta is calculated by taking the difference of the volume that traded at the offer price and the volume that traded at the bid price. The more volume that is traded at the bid price, the more likely there is momentum in the market.
And lastly the Squeeze Momentum indicator which uses a combination of Bollinger Bands, Keltner Channels and Momentum are used to again confirm momentum and volatility. During periods of low volatility, Bollinger bands narrow and trade inside Keltner channels. They can only contract so much before it can’t contain the energy it’s been building. When the Bollinger bands come back out, it explodes higher. When we see the histogram bar exploding into green above 0 that is a clear confirmation of increased momentum and volatile. The opposite (red) below 0 is true when there are low periods. This indicator is used as a means to really determine when there is premium selling plays going on leading to big directional movements again confirming the positive or negative momentum and volatility direction.
If you know of or have a strategy you want to see myth-busted or just have an idea for one, please feel free to message me.
Trading Rules
1 - 3 min candles
FOREX or Crypto
Stop loss at swing high/low | 1.5 risk/ratio
Long Condition
Trend Magic line is Blue ( CCI is above 0) and above the current close on the bar
Squeeze Momentum's histogram bar is green/lime
Cumulative Delta Volume line is green
Short Condition
Trend Magic line is Red ( CCI is below 0) and below the current close on the bar
Squeeze Momentum's histogram bar is red/maroon
Cumulative Delta Volume line is peach

MACD + RSI + ADX Strategy (ChatGPT-powered) by TradeSmartThis is a trading strategy made by TradeSmart, using the recommendations given by ChatGPT . As an experiment, we asked ChatGPT on which indicators are the most popular for trading. We used all of the recommendations given, and added more. We ended up with a strategy that performs surprisingly well on many crypto and forex assets. See below for exact details on what logic was implemented and how you can change the parameters of the strategy.
The strategy is a Christmas special , this is how we would like to thank the support of our followers.
The strategy has performed well on Forex, tested on 43 1-hour pairs and turned a profit in 21 cases. Also it has been tested on 51 crypto pairs using the 1-hour timeframe, and turned a profit in 45 cases with a Profit Factor over 1.4 in the top-5 cases. Tests were conducted without commission or slippage, unlike the presented result which uses 0.01% commission and 5 tick slippage.
Some of the top performers were:
SNXUSDT
SOLUSDT
CAKEUSDT
LINKUSDT
EGLDUSDT
GBPJPY
TRYJPY
USDJPY
The strategy was implemented using the following logic:
Entry strategy:
Long entry:
Price should be above the Simple Moving Average (SMA)
There should be a cross up on the MACD (indicated by the color switch on the histogram, red to green)
RSI should be above the 50 level
Volume is above the selected volume-based Exponential Moving Average (EMA)
ADX should also agree to this position: below 50 and over 20, and above the Regularized Moving Average (REMA)
Short entry:
Price should be under the Simple Moving Average (SMA)
There should be a cross down on the MACD (indicated by the color switch on the histogram, red to green)
RSI should be below the 50 level
Volume is above the selected volume-based Exponential Moving Average (EMA)
ADX should also agree to this position: below 50 and over 20, and above the Regularized Moving Average (REMA)
Exit strategy:
Stop Loss will be placed based on ATR value (with 1.5 Risk)
Take profit level will be placed with a 2.5 Risk/Reward Ratio
Open positions will be closed early based on the Squeeze Momentum (Long: change to red, Short: change to green)
NOTE! : The position sizes used in the example is with 'Risk Percentage (current)', according which the position size will be determined such
that the potential loss is equal to % of the current available capital. This means that in most of the cases, the positions are calculated using leverage.
Parameters of every indicator used in the strategy can be tuned in the strategy settings as follows:
Plot settings:
Plot Signals: true by default, Show all Long and Short signals on the signal candle
Allow early TP/SL plots: false by default, Checking this option will result in the TP and SL lines to be plotted also on the signal candle rather than just the entry candle. Consider this only when manual trading, since backtest entries does not happen on the signal candle.
Entry Signal:
Fast Length: 12 by default
Slow Length: 26 by default
Source: hlcc4 by default
Signal Smoothing: 9 by default
Oscillator MA Type: EMA by default
Signal Line MA Type: EMA by default
Exit Strategy:
ATR Based Stop Loss: true by default
ATR Length (of the SL): 14 by default
ATR Smoothing (of the SL): EMA by default
Candle Low/High Based Stop Loss: false by default, recent lowest or highest point (depending on long/short position) will be used to calculate stop loss value. Set 'Base Risk Multiplier' to 1 if you would like to use the calculated value as is. Setting it to a different value will count as an additional multiplier. Please select only one active stop loss. Default value (if nothing or multiple stop losses are selected) is the 'ATR Based Stop Loss'.
Candle Lookback (of the SL): 10 by default
Base Risk Multiplier: 1.5 by default, the stop loss will be placed at this risk level (meaning in case of ATR SL that the ATR value will be multiplied by this factor and the SL will be placed that value away from the entry level)
Risk to Reward Ratio: 2.5 by default, the take profit level will be placed such as this Risk/Reward ratio is met
Force Exit based on Squeeze Momentum: true by default, a Long position will be closed when Squeeze Momentum turns red inside an open position and a Short position will be closed when Squeeze Momentum turns green inside an open position
BB Length: 20 by default
BB Mult Factor: 1.0 by default
KC Length: 20 by default
KC Mult Factor: 1.5 by default
Use True Range (KC): Yes by default
Base Setups:
Allow Long Entries: true by default
Allow Short Entries: true by default
Order Size: 1.5 by default
Order Type: Risk Percentage (current) by default, allows adjustment on how the position size is calculated: Cash: only the set cash ammount will be used for each trade Contract(s): the adjusted number of contracts will be used for each trade Capital Percentage: a % of the current available capital will be used for each trade Risk Percentage (current): position size will be determined such that the potential loss is equal to % of the current available capital Risk Percentage (initial): position size will be determined such that the potential loss is equal to % of the initial capital
Trend Filter:
Use long trend filter: true by default, only enter long if price is above Long MA
Show long trend filter: true by default, plot the selected MA on the chart
MA Type (Long): SMA by default
MA Length (Long): 100 by default
MA Source (Long): close by default
Use short trend filter: true by default, only enter long if price is under Short MA
Show short trend filter: false by default, plot the selected MA on the chart
MA Type (Short): SMA by default
MA Length (Short): 100 by default
MA Source (Short): close by default
Simple RSI Limiter:
Limit using Simple RSI: true by default, if set to 'Normal', only enter long when Simple RSI is lower then Long Boundary, and only enter short when Simple RSI is higher then Short Boundary. If set to 'Reverse', only enter long when Simple RSI is higher then Long Boundary, and only enter short when Simple RSI is lower then Short Boundary.
Simple RSI Limiter Type:
RSI Length: 14 by default
RSI Source: hl2 by default
Simple RSI Long Boundary: 50 by default
Simple RSI Short Boundary: 50 by default
ADX Limiter:
Use ADX Limiter: true by default, only enter into any position (long/short) if ADX value is higher than the Low Boundary and lower than the High Boundary.
ADX Length: 5 by default
DI Length: 5 by default
High Boundary: 50 by default
Low Boundary: 20 by default
Use MA based calculation: Yes by default, if 'Yes', only enter into position (long/short) if ADX value is higher than MA (ADX as source).
MA Type: REMA by default
MA Length: 5 by default
Volume Filter:
Only enter trades where volume is higher then the volume-based MA: true by default, a set type of MA will be calculated with the volume as source, and set length
MA Type: EMA by default
MA Length: 10 by default
Session Limiter:
Show session plots: false by default, show crypto market sessions on chart: Sidney (red), Tokyo (orange), London (yellow), New York (green)
Use session limiter: false by default, if enabled, trades will only happen in the ticked sessions below.
Sidney session: false by default, session between: 15:00 - 00:00 (EST)
Tokyo session: false by default, session between: 19:00 - 04:00 (EST)
London session: false by default, session between: 03:00 - 11:00 (EST)
New York session: false by default, session between: 08:00 - 17:00 (EST)
Date Range:
Limit Between Dates: false by default
Start Date: Jul 01 2021 00:00:00 by default
End Date: Dec 31 2022 00:00:00 by default
Trading Time:
Limit Trading Time: false by default, tick this together with the options below to enable limiting based on day and time
Valid Trading Days Global: 1234567 by default, if the Limit Trading Time is on, trades will only happen on days that are present in this field. If any of the not global Valid Trading Days is used, this field will be neglected. Values represent days: Sunday (1), Monday (2), ..., Friday (6), Saturday(7) To trade on all days use: 123457
(1) Valid Trading Days: false, 1234567 by default, values represent days: Sunday (1), Monday (2), ..., Friday (6), Saturday(7) The script will trade on days that are present in this field. Please make sure that this field and also (1) Valid Trading Hours Between is checked
(1) Valid Trading Hours Between: false, 0930-1600 by default, hours between which the trades can happen. The time is always in the exchange's timezone
Fine-tuning is highly recommended when using other asset/timeframe combinations.

Heikin Ashi SupertrendAbout this Strategy
This supertrend strategy uses the Heikin Ashi candles to generate the supertrend but enters and exits trades using normal candle close prices. If you use the standard built in Supertrend indicator on Heikin Ashi candles, it will produce very unrealistic backtesting results because it uses the Heikin Ashi prices instead of the real prices. However, by signaling the supertrend reversals using Heikin Ashi while using standard candle close prices for the entries and exits, it corrects the backtesting errors and gives you a more realistic equity curve. You should set the chart to use standard candles and then hide them (the strategy creates the candles).
This strategy includes:
Plotting of Heikin Ashi candles
Heikin Ashi Supertrend
Long and Short Entry Signals
Move stop loss after trade is X% in profit
Profit Target
Stop Loss
Built in Alertatron automation
Alertatron Trade Automation Integration
For Alertatron integration, be sure to configure the strategy settings and "Enable Webhook Messages" before creating an alert with {{strategy.order.alert_message}} in the body of your alert message. Be sure to enable webhooks and point it to your Incoming Alertatron webhook URL.
Notes
While this strategy does pretty well during trending markets, It's worth noting that the Buy and Hold ROI is much better during peak times of the bull market
Not financial advice. Do not risk more than you can afford to lose.

Volatility Stop with Vwap StrategyFirst the credits goes to @TradingView for their release of the volatility stop mtf indicator.
I have took it, and inside I have added a weekly vwap for a better trend direction and at the same time I have added a dynamic risk managment which is calculated from the distance between the volatility line to the close of the candle.
The rules for entry are simple:
For long:We enter when our close of the candle is above the volatility stop line and at the same time the close of the candle is above weekly vwap
For short we enter when our close of the candle is below the volatility stop line and at the same time the close of the candle is below weekly vwap.
We exit when we either have a reverse signal than the one we enterred, or based on the TP/SL which is calculated with the distance from vwap to the close of the candle.
If you have any questions please let me know !

Directional Movement IndexADX is an oscillating indicator, displayed as a single line, ranging from 0 to 100, it only indicates the strength of the trend and does not indicate its direction. In other words, the ADX is non-directional, meaning that it measures the strength of a trend, but doesn’t distinguish between uptrend and downtrends. So, during a strong uptrend, the ADX rises and during a strong downtrend, the ADX also rises.
Here is how you correctly read what ADX is saying about the market. Here are 5 aspects regarding the interpretation of the ADX:
1- When ADX is above 25, trend strength is strong. Usually, once the ADX gets above 25 this signals the beginning of a trend. Big moves (upwards or downwards) tend to happen when ADX is right around this number. You can experiment with this number, some traders that want faster signals, tend to use a 20 threshold when trading with the ADX.
2- When ADX is below 25, traders must avoid trend trading strategies as the market is in accumulation or distribution phase. So, when we see the ADX line below 20 or 25 level, we forget about trend following strategies and we apply strategies suitable for a ranging market.
3- When ADX is above 25 and Positive Directional Movement Indicator (+DMI) is above the Negative Directional Movement Indicator (-DMI). ADX measures the strength of an uptrend. The crossover between the 2 Directional Movement Indicator, as the ADX line is well above 25 can result in an excellent bullish move.
4- The Positive Directional Movement Indicator (+DMI) should be above the Negative Directional Movement and the ADX should be above 25 signals for a strong upward trend for long opportunities. When ADX is above 25 and Positive Directional Movement Indicator is below the Negative Directional Movement Indicator, ADX measures the strength of a downtrend and short opportunities.
5- Values over 50 of the ADX indicate a very strong trend
There are pros and cons of ADX.
So, why is the ADX useful for traders: First, is excellent at quantifying trend strength. Also, it allows traders to see the strength of bulls and bears at the same time. It is good at filtering out trades, during accumulation periods and is good at identifying trending conditions.
But the ADX also has its limitations. The most important disadvantage is the fact that ADX is a lagging indicator that follows the price, so we must be very careful when we apply this indicator, because we might miss the inception of the trend and join it when it’s nearly over.
Also, it offers many false signals when used on shorter time frames, so it’s advisable to trade it on higher time frames Also, the ADX does not contain all of the data necessary a for proper analysis of price action, so it must be used in combination with other tools or indicators.
Now that we fully covered the good and the bad regarding ADX, let’s see how it is used in a trading strategy.
The trading strategy involves a DMI crossover, confirmed by ADX above consolidation threshold. If +DMI crossover, we take long position and if -DMI crosses over, we take a short position.
Candles are re-colored for easy demonstration of uptrend, downtrend and consolidation periods.
Green candles – ADX > Consolidation Threshold and +DMI > -DMI
Red candles – ADX > Consolidation Threshold and +DMI < -DMI
Black candles – ADX < Consolidation Threshold
Repaint – This is a non-repainting strategy - All the signals are generated at candle closing. All the calculations are made on previous candle’s open, high, low, close. No request security function is used. No data is being used from higher time frame. Trade exit uses close function instead of exit to avoid limit orders. Only one long trade at a time (no pyramiding) is allowed.
Strategy Time frame – D (To filter out false signals, higher time frame is recommended)
Strategy For – Swing Traders
Assets – Cryptocurrencies + Stocks

robotrading body-limitThis is a very simple and universal strategy. Good for crypto. For BTC/USD, shitcoin/BTC .
Strategy
Long positions only. If the candle is falling and the candle body is 3 or more times the average candle body, then open a long position by limit order.
If the candle is rising, we should close a long position.
Short positions are not used.
This is a counter-trend strategy.
The average body of a candlestick is the arithmetic average of the bodies of the previous 100 bodies.
Parameters
The multiplier is the number of times the candlestick body should be bigger than the average candlestick body to get a signal to open a long position.
Recommended
- A timeframe of 4 hours to 1 day
- Cryptocurrencies with large market capitalization
- you can use coin/USD, coin/USDT, coin/BTC , coin/ETH, etc

Daily HIGH/LOW strategyThis is a DAILY High/LOW strategy combined with a moving average and volume for more accuracy.
The rules are simple :
For long if we had a cross of the high with the previous high and close of the candle is above moving average and chaikin money flow volume is positive we have a long entry.
We exit when we cross down the moving average with the close of the candle.
For short if we had a crossdown of the low with the previous low and close of the candle is below moving average and chaikin money flow volume is negative we have a short entry.
We exit when we cross above the moving average with the close of the candle.
This strategy has no risk management inside so use it with caution.
If you have any questions, let me know

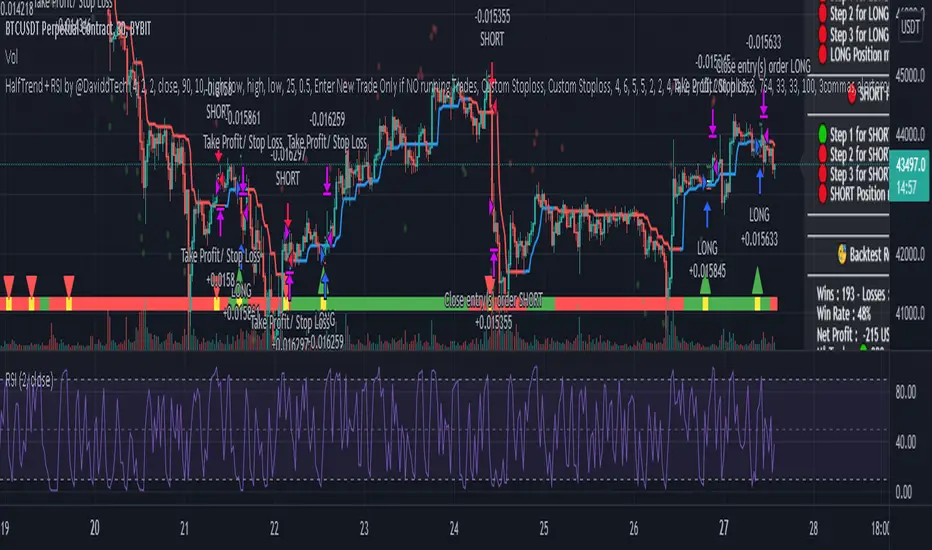
HT + RSI Pullback by @DaviddTechThis strategy uses the HT algo and the RSI.
The HT is used to find the global trend and RSI on a length of 2 to find pullbacks.
Long Positions :
* HT is in the blue.
* RSI on length 2 goes in to oversold < 10
* Trigger candle closes higher that the high of the previous candle.
Short Positions :
* HT is in the red.
* RSI on length 2 goes in to overbrough > 90
* Trigger candle closes lower that the low of the previous candle.
Stop loss is the swing low or high.
TP Short :
* The RSI moves back down below the 10
TP Long
* The RSI moves back up above the 90
WARNING:
- For purpose educate only - My mission is to debunk fake strategies with code to find THE ONE.
- Plots EMAs and other values on chart.
- This script to change bars colors.
If you have any questions or feedback, please let me know in the comments.
robotrading bodyThis is a very simple and universal strategy. Good for crypto. For BTC/USD, shitcoin/BTC.
Strategy
Long positions only. If the candle is falling and the candle body is 3 or more times the average candle body, then open a long position.
If the candle is rising, we should close a long position.
Short positions are not used.
This is a counter-trend strategy.
The average body of a candlestick is the arithmetic average of the bodies of the previous 100 bodies.
Parameters
The multiplier is the number of times the candlestick body should be bigger than the average candlestick body to get a signal to open a long position.
Recommended
- A timeframe of 4 hours to 1 day
- Cryptocurrencies with large market capitalization
- you can use coin/USD, coin/USDT, coin/BTC, coin/ETH, etc

Advanced OutSide with HMA and Klinger Forex Swing strategyThis is a swing forex strategy, adapted for big timeframes, such as 4h+.
For this example I adapted the strategy to EUR USD main forex pair.
Its components are:
Outside condition
Klinger Oscillator
Hull moving average
Rules for entry
For long: if current high is bigger than previous high and current is smaller than previous low and klinger is positive, close of the candle is above lsma and we have a bull candle.
For short: if current high is smaller than previous high and current is bigger than previous low and klinger is negative, close of the candle is below lsma and we have a bear candle.
Rules for exit
We exit when we have a reverse condition
We exit in case we hit the tp/sl based on % movement of the price.
If you have any questions, let me know !

Só Trade Top - Média de 8 - Augusto BackesThis strategy is an ADAPTATION of the EMA8 Setup from Augusto Backes (brazilian crypto youtuber).
The strategy was designed to work on the daily timeframe with the weekly EMA8.
Buy signals when there is a bullish candle above the weekly EMA8 - bullish candles in the script: engulfing candles, closing price reversal and bullish hammer.
Exit signals when there is a bearish candle below the weekly EMA8 - bearish candles in script: engulfing candles, closing price reversal and bearish hammer.
Entries and Exits on signals close.
Risk Management: all in on every trade.
The results here shown are from the standard parameters of the strategy.
------------------------------------------------------------------------------------------------------
PORTUGUESE TRANSLATION
------------------------------------------------------------------------------------------------------
Essa estratégia é uma adaptação do setup EMA8 do youtuber crypto Augusto Backes.
A estratégia foi desenvolvida para trabalhar em gráficos diários, usando a EMA8 do gráfico semanal.
Sinais de compra: quando uma figura de alta acontece acima da EMA8 semanal. Figuras de alta consideradas: Engolfo de Alta, Preço de fechamento de reversão de alta e Martelo de Alta
Sinais de saída do trade: quando uma figura de baixa acontece abaixo da EMA8 semanal. Figuras de baixa consideradas: Engolfo de Baixa, Preço de fechamento de reversão de baixa e Martelo de Baixa.
Todas as ordens são executadas dos fechamentos dos candles de sinal.
Gestão de risco: 100% do capital em cada trade.
Os resultados mostrados são com a aplicação dos parâmetros padrão da estratégia.

Swing Trader-Pro V2The strategy- what is it?
This indicator is designed from a theory created by myself in order to distinguish a correction from an impulse. This comes down to the ability to compare "x" range of candles to "y" range of candles and highlight key differences to then correctly portray that the most recent move in price will be (or is) a correction.
Following this theory, we all understand that corrections don't go with the trend right? So this means at some point, there is a high probability of a rejection somewhere in this most recent move, that will ultimately push price higher or lower as it continues back with the trend. Therefore, through extensive quantitative research and back-testing, we are able to highlight areas of high-probability rejections within these supposed corrections.
How does it work?
Firstly, we need to establish a high and low point (using pivots ) that help us decide what the state is of the recent move between the high and low (we call this "point A" and "point B"). So we can only consider whether the recent move in price was an impulse or a correction until the move from "point B" to "point C" is made. But before that, once we have identified "Point A" and "point B", we use 2 (supposedly) strong levels which help integrate a box onscreen and thus, indicate this area of high liquidity. This box will continue to adjust according to the change of pivots (if price keeps creating HH's & HL's or LH's & LL's depending on market trend). But if we establish a strong high and low and price stays within this range, then the box will remain in place.
The default color of the box is red; the only time the color of the box will change is when:
- Price retraces from the high/low back to the box (price has to touch the box)
AND
-If any of our confirmations indicate a successful correction based on our theory.
So the box color varies:
- Red = very weak (or) no entry = no confirmations were made
- Yellow = weak entry = some but not all confirmations were made
- Green = strong entry = all confirmations have indicated that the move from "point B" to "point C" (remember that "point C" is where the box is) is a correction when compared with the move from "point A" to "point B"
These confirmations are all validated on the same candle during live candle activity (not when the candle has closed on the box). As this happens, the confirmations will determine the state of entry quality as soon as price touches the box.
In this time, we will see a new orange label highlighting what indicators have confirmed a successful correction and what haven't.
The label shows the different confirmation indicators in which we have provided different names (as this is the secret we intend to keep). So we have:
- "CC"
- "B1/B2"
- "B3"
Usually, we will see either an "OK" or "NOT OK" next to each confirmation indicator. This just tells us whether they have confirmed or not. Please note that this "point C" label does not stay permanently, regardless of the state of entry quality. The label will in fact stay on the screen until the next box has been generated, which is usually a few candles after the entry has been triggered.
Entries, SL's and TP's
This indicator shows the user an area of high-probability rejection. So in terms of specifying a precise entry, you're completely free to enter on the following:
- the moment price touches the box (depending on what color it is of course)
- the other end of the box (if you would like to catch a "sniper entry")
- or if price pierces the entire box and is still green, you can wait to see if price comes back through the box (which indicates a false breakout).
As for Stop-losses, i would recommend:
- Long entries: set your SL at the recent low (this should be "point A")
- Short entries: set your SL to the recent high (this should be "point A" as well, because if you're switching from the "long entry" setting to the "short entry" setting, the indicator labels flip around and are the opposite of what they are for long entries).
For Take profits, this is entirely up to the user. Because some entries will allow you to have great RR ratios depending on how you manage the active trades. Some recommendations below:
- Set TP to "point B" pivot
- Use trailing stop function or something similar if available
- Add other indicators such as the RSI and close when price reaches key levels
- When price shows signs of exhaustion or early stages of reversal then just close
Additional information and recommendations
- This works on any time frame and on any financial market, whether you prefer Forex, stocks, crypto, commodities , etc.
- In regards to trade direction, you can change in the settings to look for either long or short positions in the market. I would recommend using it in favor of the overall trend of the markets because you will find a lot better entries. Although, this does work against the trend at times as well. Additionally, this tool also works in consolidating markets which is beneficial.
- After becoming used to the script, i would say to apply it twice to your screen and have one looking for Long entries and the other looking for Short entries.
- As the user, you have the ability to remove the labels in the parameter settings (because it does look quite messy onscreen, especially if you have both long and short entries on at the same time). I would only personally show the labels when price hits the current box to see what confirmations have been identified.
- I will also provide the best parameters to use. You will only need one set of parameters for each long and short setting, as these parameters are universal for any time frame and any financial market.
FIRST UPDATE
After extensive back testing using our first version, we found that in fact, there are some great opportunities being wasted as the entry box stays red. This is due to some series of market structure that don't always fit our theory of continuations within the market. We found that although our theory is accurate, the amount of times the market fits this is more rare than times when price follows sequences. When we look for sequences in the market instead of specifying differences between impulses and corrections, we actually see areas of serious repetitiveness, thanks to how our indicator initially generates. Not how it confirms. So, understanding this new theory through one component of our previous indicator, we are still able to keep boxes at the same area yet accurately confirm more profitable entries external to our full previous strategy.
Moving towards the practical side of things:
-Make sure "add extra confirmation" parameter is selected, as this will allow the indicator to search for more valid entries rather than just our normal confirmations. (this is a tick box).
- Default parameters are already set for both C1 and C2
In a simple sense, this update is added to find more confirmations to turn more red boxes into green boxes based on other theories outside of our original one. How we do this exactly is part of the mystery.
SECOND UPDATE
- Fibonacci based moving average: using elements of the Fibonacci sequence and its relevance to being a hot-spot in price activity, we have integrated this into a moving average which is stronger than your usual MA. Here, you will notice it showing stronger signs of rejecting price, especially when trending. Hence, this is extremely useful to implement into your strategy as part of the trend identification. When price is consolidating, depending on how volatile or close-in the waves are during these periods, the FMA is similar to your typical MA, so therefore not so good. But the overall intention of this is to enhance your conclusion to whether price is trending and whether price is bullish or bearish.
- This is now a strategy, not just an indicator: So now we can choose from a huge variety of parameters in accordance to what ones work best with what pair, or time frame. The typical parameters to change would be the entry points, stop losses and take profits. We have also added in a "SL to entry" option. ALL PARAMETERS ARE FIBONACCI LEVELS AS THIS MAKES IT UNIVERSAL TO ANY PAIR/ TIME FRAME.
- Move the entry boxes : So this is very useful for certain pairs and mainly to help the user understand key sequences on a quantitative level. Sometimes we can notice that pairs spike higher than the typical entry (0.618) so we have allowed flexibility to the point where you can alter the box appearance to either the 0.618 level (default), 0.786 and the 0.9 level.
- Back-testing: Now the user can back-test the strategy and see the performance within any financial market you add this to! Please note that according to the strategy, once a trade is placed, it wont enter any more trades when the current one is still active. I have requested to change this, but it is out of our development team's reach. However, this doesn't discredit what the system can help you achieve, as you will still be able to find profitable parameters within the financial markets.
Strategy default properties
Backtest start: this date is when you would like to start the backtest, however, the indicator will go as far as the data can be read
Backtest end: choose your date to end the back test.
Trade session: choose the trading session you want this strategy to work on.
Filter by session: you can filter the backtested results depending on whether you want the strategy to take trades within the chosen trading session.
Filter by Fibonacci moving average: select this if you would like for the back tested results to consider whether the valid trade setups are in accordance to what the FMA displays (Bullish or Bearish). This is deselected.
Fibonacci Moving Average Timeframe: here you can select what timeframe you would like the FMA to work on, default is the “same as chart” button/ option.
TraderDirection: choose whether you would like LONG or SHORT entries for the indicator to find.
Max risk per trade: choose the risk setting per trade, i would suggest lowering this to 1% ((MODERATOR) This is the default setting!)
EntryFib: choose between the options as to where you would like the strategy to enter positions, the default is the 0.618 zone which is the closest side of the box to price. You will also see that when you choose to change this, the boxes on your screen will move accordingly. A very helpful function!
StopFib: choose your Stop Loss based on the same Fibonacci level as what you choose for your entry, remember that the higher the fib level, the higher (or safer) your Stop Loss is from price spiking. It all comes down to preference.
TakeProfitFib: choose your Take Profit based on the same Fibonacci level as what you choose for your entry, remember that the lower the fib level, the higher your Take Profit is again, It all comes down to preference.
BreakevenFib: the default setting is on “disabled” however when you select a certain Fibonacci level, once price reaches there during the active trade, your Stop Loss will be set to entry, this function is designed to stop volatile price fluctuations rendering your in-profit trade result to hitting your Stop Loss and losing when it closes out.
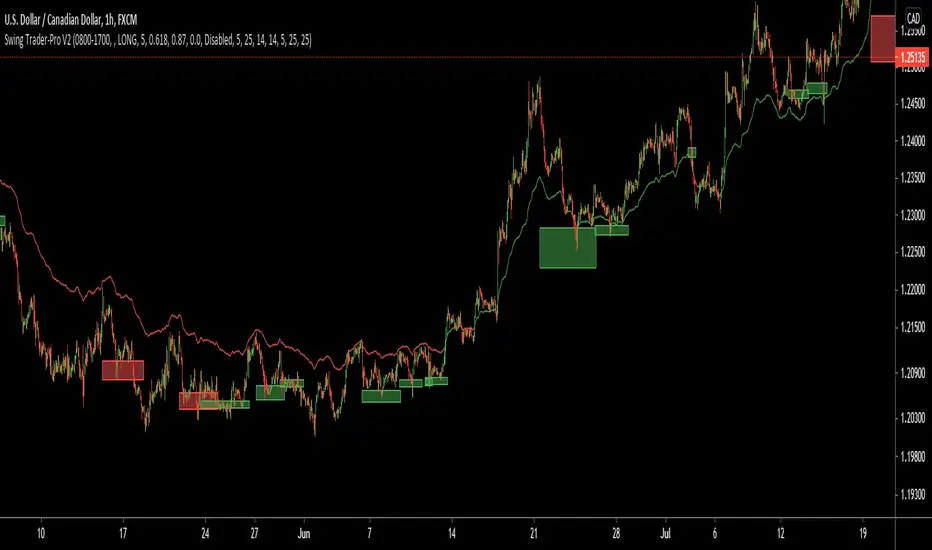
Extremely high win rate FOREX swing strategyTHis is a very simple yet extremely efficient FOREX strategy .
In general it tends to work the best against NZD and AUD pairs, however other major pairs and crosses can work as well.
It's made of a time management, together with MACD , moving average , a price action rule and a risk management.
THe logic behind is the next one :
For LONG:
We have 3 ascending candles.
Histogram of MACD is positive.
Last close of a candle is was above moving average.
If all those previous condition happened before 17/18 UTC time depending if its summer time or not, we enter the trade.
For Short:
We have 3 descending candles.
Histogram of MACD is negative.
Last close of a candle is was below moving average.
If all those previous condition happened before 17/18 UTC time depending if its summer time or not, we enter the trade.
RIsk management
For risk management, since we aim to have a 95%+ win rate, we aim to have a 5:1 or 10:1 risk to reward ratio. Meaning that for each $ we can win, we can lose 5-10$.
THats why I recommend to be extremely careful when playing with leverage with this strategy.

PIVOT EDGE - TREND GLIDEROne of the Biggest challenge in trading is to find the right trend and once we are in the right trend, holding on to winning trades is the next challenge. So this indicator addresses both these issues and helps you with
finding the right trend and also guide you and glide the trades till there is a change in trend by means of proper trend based candle color.
You can just look at the basic candle color as per the prevailing trend and be in the trend as long as the candle colors doesn't change. You need not worry or panic about the small pullbacks or retracements which is a normal
course of any trend continuation. Without this Indicator, in normal situation we would have ended our trades thinking the trend has changed and only to find that trend is again continuing and giving us more than 3-4 times reward after exit.
This Indicator is coded in such a way that no matter what may be the standard color of the candle, This Indicator will paint the candles to Green color in an Uptrend and it will paint the candles RED color in downtrend.
You can take entries as soon as you see the trend formation and wait till the trend is changed or the candle color is changed.
This indicator is intended for the use of newbies or Novice traders to give them confidence and also to guide them towards the proper trend so that they are not taking any counter trend trades.
This Indicator is also beneficial for experienced and master traders to keep them in trade and glide until there is a clear change in trend thereby riding their profits for longer time.
This is a Moving average crossover based strategy but slightly different in the computation where in I have used the customized PEMA values to suit most favorable win ratio.
The results are best when used for timeframe of 10 mins and above. Also you must know the basics of candle stick patterns and price action to take suitable entries and exit at favorable risk reward ratio.
Always do not wait for exit signal from the indicator. You can exit whenever you have gained decent profit and you can keep a trailing stop loss and lock in your profit.
This Indicator works on all Markets and all types of timeframes. Kindly do backtesting for atleast 2-3 months data before using it for live market. Also you must find out which stocks you wish to trade and check if this indicator works favorably for your scripts. The results might slightly vary on stocks
with high volatility.
Always look for the curve in trending up direction of trending down direction. Do not trade whenever the curve is flat and not inclined upside or downside.
Always trade with a suitable STOPLOSS in place and trade with less quantity till you find comfort and confidence with this Indicator.
Further updates to follow periodically. Incase you like this script, like it and share it to others too. Also take a look at the other scripts that I have published.
Happy Trading
Mohan
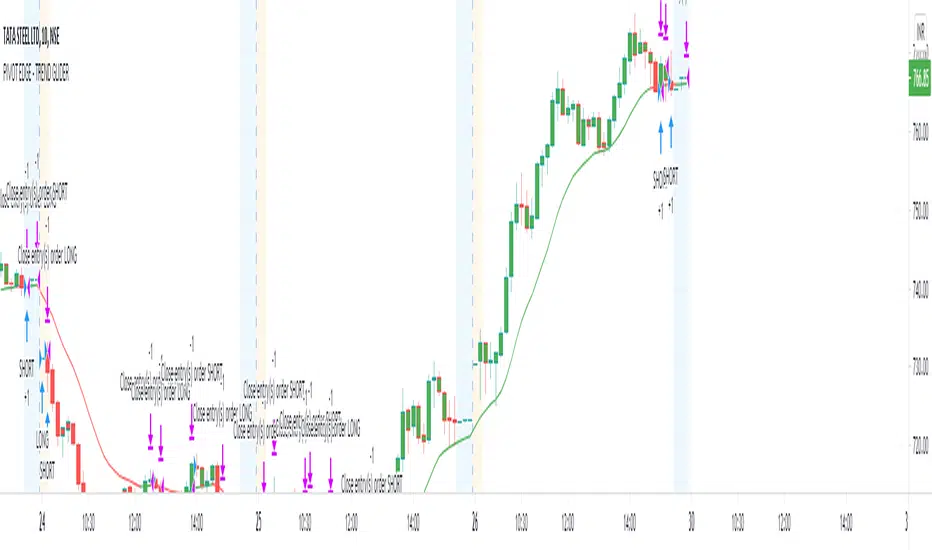
HatiKO Envelopes v3Published source code is subject to the terms of the GNU Affero General Public License v3.0
Old flaws have been resolved.
This script describes and provides backtesting functionality to internal strategy of algorithmic crypto trading software "HatiKO bot".
Suitable for backtesting any Cryptocurrency Pair on any Exchange/Platform, any Timeframe.
Core Mechanics of this strategy are based on theory of price always returning to Moving Average + Envelopes indicator (Moving_average_envelope from Wiki)
Developement of this script and trading software is inspired by:
"Essential Technical Analysis: Tools and Techniques to Spot Market Trends" by Leigh Stevens (published on 12th of April 2002)
"Moving Average Envelopes" by ChartSchool, StockCharts platform (published on 13th of April 2015 or earlier)
"Коля Колеснік" from Crypto Times channel ("Метод сетка", published on 19th of August 2018)
"3 ways to use Moving Average Envelopes" by Rich Fitton, published on Trader's Nest (published on 28st of November 2018 or earlier)
noro's "Robot WhiteBox ShiftMA" strategy v1 script, published on TradingView platform (published on 29th of August 2018)
"Moving Average Envelopes: A Popular Trading Tool" Investopedia article (published 25th of June 2019)
and KROOL1980's blogpost on Argolabs ("Гридерство или Сетка как источник прибыли на форекс", published on 27th of February 2015)
Core Features:
1) Up to 9 Envelopes in each direction (Long/Short)
2) Use any of 6 different basis MAs, optionally use different MAs for Opening and Closure
3) Use different Timeframes for MA calculation, without any repainting and lookahead bias.
4) Fixed order size, not Martingale strategy
5) Close open position earlier by using Deviation parameter
6) PineScript v4 code
7) Anti-Spire (protection against situations like LTCUSD (Bitmex) 12/26/2020)
9) Lottery for each level
10) Total profit for the day. When activated, a histogram is drawn.
Options description:
Lot - % from your initial balance to use for order size calculation
Timeframe Short - Timeframe to use for Short Opening MA calculation, can be chosen from dropdown list, default is Current Graph Timeframe
MA Type Short - Type of MA to use for Short Opening MA calculation, can be chosen from dropdown list, default is SMA
Data Short - Source of Price for Short Opening MA calculation, can be chosen from dropdown list, default is OHLC4
MA Length Short - Period used for Short Opening MA calculation, should be >=1, default is 3
MA offset Short - Offset for MA value used for Short Envelopes calculation, should be >= 0, default is 0
Timeframe Long - Timeframe to use for Long Opening MA calculation, can be chosen from dropdown list, default is Current Graph Timeframe
MA Type Long - Type of MA to use for Long Opening MA calculation, can be chosen from dropdown list, default is SMA
Data Long - Source of Price for Long Opening MA calculation, can be chosen from dropdown list, default is OHLC4
MA Length Long - Period used for Long Opening MA calculation, should be >=1, default is 3
MA offset Long - Offset for MA value used for Long Envelopes calculation, should be >= 0, default is 0
Mode close MA Short - Enable different MA for Short position Closure, default is "false". If false, Closure MA = Opening MA
Timeframe Short Close - Timeframe to use for Short Position Closure MA calculation, can be chosen from dropdown list, default is Current Graph Timeframe
MA Type Close Short - Type of MA to use for Short Position Closure MA calculation, can be chosen from dropdown list, default is SMA
Data Short Close - Source of Price for Short Closure MA calculation, can be chosen from dropdown list, default is OHLC4
MA Length Short Close - Period used for Short Opening MA calculation, should be >=1, default is 3
Short Deviation - % to move from MA value, used to close position above or beyond MA, can be negative, default is 0
MA offset Short Close - Offset for MA value used for Short Position Closure calculation, should be >= 0, default is 0
Mode close MA Long - Enable different MA for Long position Closure, default is "false". If false, Closure MA = Opening MA
Timeframe Long Close - Timeframe to use for Long Position Closure MA calculation, can be chosen from dropdown list, default is Current Graph Timeframe
MA Type Close Long - Type of MA to use for Long Position Closure MA calculation, can be chosen from dropdown list, default is SMA
Data Long Close - Source of Price for Long Closure MA calculation, can be chosen from dropdown list, default is OHLC4
MA Length Long Close - Period used for Long Opening MA calculation, should be >=1, default is 3
Long Deviation - % to move from MA value, used to close position above or beyond MA, can be negative, default is 0
MA offset Long Close - Offset for MA value used for Long Position Closure calculation, should be >= 0, default is 0
Short 1..9 - % from MA value to put Envelopes at, for Shorts numbers should be positive, the higher is number, the higher should be Short n position, example: "Short 1 = 1, Short 2 = 2, etc."
Long 1..9 - % from MA value to put Envelopes at, for Longs numbers should be negative, the lower is number, the lower should be Long n position, example: "Long 1 = -1, Long 2 = -2, etc."
Graph notes:
Green lines - Long Envelopes .
Red lines - Short Envelopes .
Orange line - MA for closing of Short positions.
Lime line - MA for closing of Long positions.
Histogram - Profit for the last day. Black = 0, Green> 0, Red <0.
Old flaws have been resolved.
At the moment, there is one bug - if the closing and opening occurs on the same candle, then there is no close on the same candle. The situation is possible with small values of Envelope.
**************************************************************************************************************************************************************************************************************
Опубликованный исходный код регулируется Условиями Стандартной Общественной Лицензии GNU Affero v3.0
Старые недоработки были решены.
Этот скрипт описывает и предоставляет функции бектеста для внутренней стратегии алгоритмического программного обеспечения "HatiKO bot".
Подходит для тестирования любой криптовалютной пары на любой бирже/платформе, на любом таймфрейме.
Кор-механика этой стратегии основана на теории всегда возвращающейся к значению МА цены с использованием индикатора Envelopes (Moving_average_envelope from Wiki)
Разработка этого скрипта и программного обеспечения для торговли вдохновлена следующими источниками:
Книга "Essential Technical Analysis: Tools and Techniques to Spot Market Trends" Ли Стивенса (опубликовано 12 апреля 2002 года)
«Moving Average Envelopes» от ChartSchool, платформа StockCharts (опубликовано 13 апреля 2015 года или раньше)
«Коля Колеснік» с канала Crypto Times («Метод сетка», опубликовано 19 августа 2018 года)
«Moving Average Envelopes: A Popular Trading Tool», статья Investopedia (опубликовано 25 июня 2019 года)
Блог KROOL1980 из Argolabs («Гридерство или Сетка как источник прибыли на форекс», опубликовано 27 февраля 2015 года)
Основные особенности:
1) До 9-х Ордеров в каждом из направлении (Лонг / Шорт)
2) Выбор из 6-ти разных базовых МА, опционально используйте разные МА для открытия и закрытия.
3) Используйте разные таймфреймы для расчета MA, без перерисовки и "эффекта стеклянного шара".
4) Фиксированный размер ордера, а не стратегия Мартингейла
5) Возможность закрытия открытой позиции заблаговременно, используя параметр Deviation
6) Код реализован на PineScript v4
7) Антишпиль ( защита от ситуаций типа LTCUSD ( Bitmex ) 26.12.2020 )
9) Лотность для каждого уровня
10) Суммарный профит за день. При активации рисуется гистограмма.
Описание параметров:
Lot - % от вашего первоначального баланса, используется при расчете размера Ордера
Timeframe Short - таймфрейм, используемый для расчета МА Открытия Шорт позиций, может быть выбран из списка, по умолчанию - таймфрейм текущего графика
MA Type Short - тип MA, используемый для расчета МА Открытия Шорт позиций, может быть выбран из списка, по умолчанию SMA
Data Short - источник цены для расчета МА Открытия Шорт позиций, может быть выбран из списка, по умолчанию OHLC4
MA Length Short - период, используемый для расчета МА Открытия Шорт позиций, должен быть >= 1, по умолчанию 3
MA Offset Short - смещение значения MA, используемого для расчета Шорт Ордеров, должно быть >= 0, по умолчанию 0
Timeframe Long - таймфрейм, используемый для расчета МА Открытия Лонг позиций, может быть выбран из списка, по умолчанию - таймфрейм текущего графика
MA Type Long - тип MA, используемый для расчета МА Открытия Лонг позиций, может быть выбран из списка, по умолчанию SMA
Data Long - источник цены для расчета МА Открытия Лонг позиций, может быть выбран из списка, по умолчанию OHLC4
MA Length Long - период, используемый для расчета МА Открытия Лонг позиций, должен быть >= 1, по умолчанию 3
MA Offset Long - смещение значения MA, используемого для расчета Лонг Ордеров, должно быть >= 0, по умолчанию 0
Mode close MA Short - Включает отдельное MA для закрытия Шорт позиции, по умолчанию «false». Если false, MA Закрытия = MA Открытия
Timeframe Short Close - таймфрейм, используемый для расчета МА Закрытия Шорт позиций, может быть выбран из списка, по умолчанию - таймфрейм текущего графика
MA Type Close Short - тип MA, используемый при расчете МА Закрытия Шорт позиции. Mожно выбрать из списка, по умолчанию SMA
Data Short Close - источник цены для расчета МА Закрытия Шорт позиций, может быть выбран из списка, по умолчанию OHLC4
MA Length Short Close - период, используемый для расчета МА Закрытия Шорт позиции, должен быть >= 1, по умолчанию 3
Short Deviation - % отклонения от значения MA, используется для закрытия позиции выше или ниже рассчитанного значения MA, может быть отрицательным, по умолчанию 0
MA Offset Short Close - смещение значения MA, используемого для расчета закрытия Шорт позиции, должно быть >= 0, по умолчанию 0
Mode close MA Long - Включает разные MA для закрытия Лонг позиции, по умолчанию «false». Если false, MA Закрытия = MA Открытия
Timeframe Long Close - таймфрейм, используемый для расчета МА Закрытия Лонг позиций, может быть выбран из списка, по умолчанию - таймфрейм текущего графика
MA Type Close Long - тип MA, используемый при расчете МА Закрытия Лонг позиции. Mожно выбрать из списка, по умолчанию SMA
Data Long Close - источник цены для расчета МА Закрытия Лонг позиций, может быть выбран из списка, по умолчанию OHLC4
MA Length Long Close - период, используемый для расчета МА Закрытия Лонг позиции, должен быть >= 1, по умолчанию 3
Long Deviation -% для перехода от значения MA, используется для закрытия позиции выше или ниже рассчитанного значения MA, может быть отрицательным, по умолчанию 0
MA Offset Long Close - смещение значения MA, используемого для расчета закрытия Лонг позиции, должно быть >= 0, по умолчанию 0
Short 1..9 - % от значения MA для размещения Ордеров, для Шорт Ордеров должен быть положительным, чем выше номер, тем выше должна располагаться позиция Short n, например: « Short 1 = 1, Short 2 = 2 и т.д. "
Long 1..9 - % от значения MA для размещения Ордеров, для Лонг Ордеров должно быть отрицательным, чем ниже число, тем ниже должна располагаться позиция Long n, например: « Long 1 = -1, Long 2 = -2, и т.д."
Пояснения к графику:
Зеленые линии - Лонг Ордера.
Красные линии - Шорт Ордера.
Оранжевая линия - MA Закрытия Шорт позиций.
Лаймовая линия - MA Закрытия Лонг позиций.
Гистограмма - Профит за последние сутки.Черная = 0, Зеленая > 0, красная < 0.
Старые недоработки были решены.
На данный момент есть один баг - если закрытие и открытие происходит на одной свече, то на этой же свече нет закрытия. Ситуация возможна при небольших значениях Envelope.
Published source code is subject to the terms of the GNU Affero General Public License v3.0
Old flaws have been resolved.
This script describes and provides backtesting functionality to internal strategy of algorithmic crypto trading software "HatiKO bot".
Suitable for backtesting any Cryptocurrency Pair on any Exchange/Platform, any Timeframe.
Core Mechanics of this strategy are based on theory of price always returning to Moving Average + Envelopes indicator (Moving_average_envelope from Wiki)
Developement of this script and trading software is inspired by:
"Essential Technical Analysis: Tools and Techniques to Spot Market Trends" by Leigh Stevens (published on 12th of April 2002)
"Moving Average Envelopes" by ChartSchool, StockCharts platform (published on 13th of April 2015 or earlier)
"Коля Колеснік" from Crypto Times channel ("Метод сетка", published on 19th of August 2018)
"3 ways to use Moving Average Envelopes" by Rich Fitton, published on Trader's Nest (published on 28st of November 2018 or earlier)
noro's "Robot WhiteBox ShiftMA" strategy v1 script, published on TradingView platform (published on 29th of August 2018)
"Moving Average Envelopes: A Popular Trading Tool" Investopedia article (published 25th of June 2019)
and KROOL1980's blogpost on Argolabs ("Гридерство или Сетка как источник прибыли на форекс", published on 27th of February 2015)
Core Features:
1) Up to 9 Envelopes in each direction (Long/Short)
2) Use any of 6 different basis MAs, optionally use different MAs for Opening and Closure
3) Use different Timeframes for MA calculation, without any repainting and lookahead bias.
4) Fixed order size, not Martingale strategy
5) Close open position earlier by using Deviation parameter
6) PineScript v4 code
7) Anti-Spire (protection against situations like LTCUSD (Bitmex) 12/26/2020)
9) Lottery for each level
10) Total profit for the day. When activated, a histogram is drawn.
Options description:
Lot - % from your initial balance to use for order size calculation
Timeframe Short - Timeframe to use for Short Opening MA calculation, can be chosen from dropdown list, default is Current Graph Timeframe
MA Type Short - Type of MA to use for Short Opening MA calculation, can be chosen from dropdown list, default is SMA
Data Short - Source of Price for Short Opening MA calculation, can be chosen from dropdown list, default is OHLC4
MA Length Short - Period used for Short Opening MA calculation, should be >=1, default is 3
MA offset Short - Offset for MA value used for Short Envelopes calculation, should be >= 0, default is 0
Timeframe Long - Timeframe to use for Long Opening MA calculation, can be chosen from dropdown list, default is Current Graph Timeframe
MA Type Long - Type of MA to use for Long Opening MA calculation, can be chosen from dropdown list, default is SMA
Data Long - Source of Price for Long Opening MA calculation, can be chosen from dropdown list, default is OHLC4
MA Length Long - Period used for Long Opening MA calculation, should be >=1, default is 3
MA offset Long - Offset for MA value used for Long Envelopes calculation, should be >= 0, default is 0
Mode close MA Short - Enable different MA for Short position Closure, default is "false". If false, Closure MA = Opening MA
Timeframe Short Close - Timeframe to use for Short Position Closure MA calculation, can be chosen from dropdown list, default is Current Graph Timeframe
MA Type Close Short - Type of MA to use for Short Position Closure MA calculation, can be chosen from dropdown list, default is SMA
Data Short Close - Source of Price for Short Closure MA calculation, can be chosen from dropdown list, default is OHLC4
MA Length Short Close - Period used for Short Opening MA calculation, should be >=1, default is 3
Short Deviation - % to move from MA value, used to close position above or beyond MA, can be negative, default is 0
MA offset Short Close - Offset for MA value used for Short Position Closure calculation, should be >= 0, default is 0
Mode close MA Long - Enable different MA for Long position Closure, default is "false". If false, Closure MA = Opening MA
Timeframe Long Close - Timeframe to use for Long Position Closure MA calculation, can be chosen from dropdown list, default is Current Graph Timeframe
MA Type Close Long - Type of MA to use for Long Position Closure MA calculation, can be chosen from dropdown list, default is SMA
Data Long Close - Source of Price for Long Closure MA calculation, can be chosen from dropdown list, default is OHLC4
MA Length Long Close - Period used for Long Opening MA calculation, should be >=1, default is 3
Long Deviation - % to move from MA value, used to close position above or beyond MA, can be negative, default is 0
MA offset Long Close - Offset for MA value used for Long Position Closure calculation, should be >= 0, default is 0
Short 1..9 - % from MA value to put Envelopes at, for Shorts numbers should be positive, the higher is number, the higher should be Short n position, example: "Short 1 = 1, Short 2 = 2, etc."
Long 1..9 - % from MA value to put Envelopes at, for Longs numbers should be negative, the lower is number, the lower should be Long n position, example: "Long 1 = -1, Long 2 = -2, etc."
Graph notes:
Green lines - Long Envelopes .
Red lines - Short Envelopes .
Orange line - MA for closing of Short positions.
Lime line - MA for closing of Long positions.
Histogram - Profit for the last day. Black = 0, Green> 0, Red <0.
Old flaws have been resolved.
At the moment, there is one bug - if the closing and opening occurs on the same candle, then there is no close on the same candle. The situation is possible with small values of Envelope.
**************************************************************************************************************************************************************************************************************
Опубликованный исходный код регулируется Условиями Стандартной Общественной Лицензии GNU Affero v3.0
Старые недоработки были решены.
Этот скрипт описывает и предоставляет функции бектеста для внутренней стратегии алгоритмического программного обеспечения "HatiKO bot".
Подходит для тестирования любой криптовалютной пары на любой бирже/платформе, на любом таймфрейме.
Кор-механика этой стратегии основана на теории всегда возвращающейся к значению МА цены с использованием индикатора Envelopes (Moving_average_envelope from Wiki)
Разработка этого скрипта и программного обеспечения для торговли вдохновлена следующими источниками:
Книга "Essential Technical Analysis: Tools and Techniques to Spot Market Trends" Ли Стивенса (опубликовано 12 апреля 2002 года)
«Moving Average Envelopes» от ChartSchool, платформа StockCharts (опубликовано 13 апреля 2015 года или раньше)
«Коля Колеснік» с канала Crypto Times («Метод сетка», опубликовано 19 августа 2018 года)
«Moving Average Envelopes: A Popular Trading Tool», статья Investopedia (опубликовано 25 июня 2019 года)
Блог KROOL1980 из Argolabs («Гридерство или Сетка как источник прибыли на форекс», опубликовано 27 февраля 2015 года)
Основные особенности:
1) До 9-х Ордеров в каждом из направлении (Лонг / Шорт)
2) Выбор из 6-ти разных базовых МА, опционально используйте разные МА для открытия и закрытия.
3) Используйте разные таймфреймы для расчета MA, без перерисовки и "эффекта стеклянного шара".
4) Фиксированный размер ордера, а не стратегия Мартингейла
5) Возможность закрытия открытой позиции заблаговременно, используя параметр Deviation
6) Код реализован на PineScript v4
7) Антишпиль ( защита от ситуаций типа LTCUSD ( Bitmex ) 26.12.2020 )
9) Лотность для каждого уровня
10) Суммарный профит за день. При активации рисуется гистограмма.
Описание параметров:
Lot - % от вашего первоначального баланса, используется при расчете размера Ордера
Timeframe Short - таймфрейм, используемый для расчета МА Открытия Шорт позиций, может быть выбран из списка, по умолчанию - таймфрейм текущего графика
MA Type Short - тип MA, используемый для расчета МА Открытия Шорт позиций, может быть выбран из списка, по умолчанию SMA
Data Short - источник цены для расчета МА Открытия Шорт позиций, может быть выбран из списка, по умолчанию OHLC4
MA Length Short - период, используемый для расчета МА Открытия Шорт позиций, должен быть >= 1, по умолчанию 3
MA Offset Short - смещение значения MA, используемого для расчета Шорт Ордеров, должно быть >= 0, по умолчанию 0
Timeframe Long - таймфрейм, используемый для расчета МА Открытия Лонг позиций, может быть выбран из списка, по умолчанию - таймфрейм текущего графика
MA Type Long - тип MA, используемый для расчета МА Открытия Лонг позиций, может быть выбран из списка, по умолчанию SMA
Data Long - источник цены для расчета МА Открытия Лонг позиций, может быть выбран из списка, по умолчанию OHLC4
MA Length Long - период, используемый для расчета МА Открытия Лонг позиций, должен быть >= 1, по умолчанию 3
MA Offset Long - смещение значения MA, используемого для расчета Лонг Ордеров, должно быть >= 0, по умолчанию 0
Mode close MA Short - Включает отдельное MA для закрытия Шорт позиции, по умолчанию «false». Если false, MA Закрытия = MA Открытия
Timeframe Short Close - таймфрейм, используемый для расчета МА Закрытия Шорт позиций, может быть выбран из списка, по умолчанию - таймфрейм текущего графика
MA Type Close Short - тип MA, используемый при расчете МА Закрытия Шорт позиции. Mожно выбрать из списка, по умолчанию SMA
Data Short Close - источник цены для расчета МА Закрытия Шорт позиций, может быть выбран из списка, по умолчанию OHLC4
MA Length Short Close - период, используемый для расчета МА Закрытия Шорт позиции, должен быть >= 1, по умолчанию 3
Short Deviation - % отклонения от значения MA, используется для закрытия позиции выше или ниже рассчитанного значения MA, может быть отрицательным, по умолчанию 0
MA Offset Short Close - смещение значения MA, используемого для расчета закрытия Шорт позиции, должно быть >= 0, по умолчанию 0
Mode close MA Long - Включает разные MA для закрытия Лонг позиции, по умолчанию «false». Если false, MA Закрытия = MA Открытия
Timeframe Long Close - таймфрейм, используемый для расчета МА Закрытия Лонг позиций, может быть выбран из списка, по умолчанию - таймфрейм текущего графика
MA Type Close Long - тип MA, используемый при расчете МА Закрытия Лонг позиции. Mожно выбрать из списка, по умолчанию SMA
Data Long Close - источник цены для расчета МА Закрытия Лонг позиций, может быть выбран из списка, по умолчанию OHLC4
MA Length Long Close - период, используемый для расчета МА Закрытия Лонг позиции, должен быть >= 1, по умолчанию 3
Long Deviation -% для перехода от значения MA, используется для закрытия позиции выше или ниже рассчитанного значения MA, может быть отрицательным, по умолчанию 0
MA Offset Long Close - смещение значения MA, используемого для расчета закрытия Лонг позиции, должно быть >= 0, по умолчанию 0
Short 1..9 - % от значения MA для размещения Ордеров, для Шорт Ордеров должен быть положительным, чем выше номер, тем выше должна располагаться позиция Short n, например: « Short 1 = 1, Short 2 = 2 и т.д. "
Long 1..9 - % от значения MA для размещения Ордеров, для Лонг Ордеров должно быть отрицательным, чем ниже число, тем ниже должна располагаться позиция Long n, например: « Long 1 = -1, Long 2 = -2, и т.д."
Пояснения к графику:
Зеленые линии - Лонг Ордера.
Красные линии - Шорт Ордера.
Оранжевая линия - MA Закрытия Шорт позиций.
Лаймовая линия - MA Закрытия Лонг позиций.
Гистограмма - Профит за последние сутки.Черная = 0, Зеленая > 0, красная < 0.
Старые недоработки были решены.
На данный момент есть один баг - если закрытие и открытие происходит на одной свече, то на этой же свече нет закрытия. Ситуация возможна при небольших значениях Envelope.

Bollinger bubble | Forex editionBollinger bubble is an edition for forex market. Work better en JPY pairs.
We buy when a candle open & close outside the lower bollingers band and we target the last highest point on the last 10 candles.
And we sell when a candle open & close outside the higher bollingers band we the target the last lowest point on the last 10 candles.

BTC and ETH Long strategy - version 2I wrote my first article in May 2020. See below
BTC and ETH Long strategy - version1
After 6 months, it is now time to check the result of my script for the last 6 months.
XBTUSD (4H): 14/05/2020 --> 22/11/2020 = +78% in 4 trades
ETHXBT (4H): 14/05/2020 --> 22/11/2020 = +21% in 9 trades
ETHUSD (4H): 14/05/2020 --> 22/11/2020 = +90% in 6 trades
Using the signals from this strategy to trade manually has shown that this was a bit frustrating because of the low rate of winning trades.
If you have to enter 100 trades and see 75% of them failing and 25% winning, this is frustrating. For sure the strategy makes good money but it is difficult to hold this mentality.
So, I have reviewed and modified it to get a higher winning rate.
After few days of work, tests and validation, I managed to get a wining rate close to 60%.
The key element was also to decrease the number of trades by using a higher time frame. (4H candles instead of 2H candles).
- Entry in position is based on
MACD, EMA (20), SMA (100), SMA (200) moving up
AND EMA (20) > SMA (100)
AND SMA (100) > SMA (200)
- Exit the position if: Stoploss is reached OR EMA (20) crossUnder SMA (100)
The goal of this new script is to be able to follow the signals manually and only make few trades per years.
I have also validated it against some other altcoins where some are giving very good results.
Here are some results for 2020 (from 01/01/2020 until now (22/11/2020). Those results are the one I get when using 4H candles.
ETH/USD: +144% in 8 trades.
BTC/USD: +120% in 7 trades.
ETH/BTC: +33% in 9 trades.
ICX/USD: +123% in 10 trades.
LINK/USD: +155% in 11 trades.
MLN/USD: +388% in 8 trades.
ADA/USD: +180% in 7 trades.
LINK/BTC: +97% in 10 trades.
The best is that above results are without considering compound effect. If you re-invest all gains done in each new trade, this will give you the below results :)
ETH/USD: +189% in 8 trades.
BTC/USD: +260% in 7 trades.
ETH/BTC: +29% in 9 trades.
ICX/USD: +112% in 10 trades.
LINK/USD: +222% in 11 trades.
MLN/USD: +793% in 8 trades.
ADA/USD: +319% in 7 trades.
LINK/BTC: +103% in 10 trades.
As you can see, the results are good and the number of trades for 11 months is not big, which allows the trader to place orders manually.
But still, I'm lazy :), so, I have also coded this strategy in HaasScript language which allows you to automate this strategy using the HaasOnline software specialized in automated crypto trading.
I hope that this strategy will give you ideas or will be the starting point for your own strategy.
Let me know if you need more details.

Bitcoin (BTC) Scalp / Short-term Short IndicatorThe purpose of this scalping Indicator is to help identifying Sell signals for short term trades on Bitcoin (Spot, Features, etc.) .
This script is working with more indicators and everything is balanced by hard work on (back)testing.
Result for users is a simple signal to SELL.
You can use it as easy indicator in your graph or create alerts.
I have the best results on 1min graph, with leverage and stop-loss feature.
This is my own version of scalping Sell Script / Indicator, which is a combination of few indicators, for example RSI , BB and price levels (actual and average) and works on standard candles.
SELL signal paints above the candle and you can set your target / trailing / stop-loss in the settings and check how it works in Strategy Tester.
Settings of this Indicator:
Take Profit
Stop Loss
Trailing Stop Loss
Trailing Stop Loss Offset
Initial Capital
Base Currency
Order size
Pyramiding
Commissions
Slippage
Average price lines (colors and visibility)
Plot background
These signals can be often observed at the beginning of a strong move, but there is a significant probability that these price levels will be revisited at a later point in time again.
Therefore these are interesting levels to place limit orders.
A Sell signal is defined as the last up candle before a sequence of down candles.
In my trading settings I have more but small positions, one safety limit order (for price averaging = better entry - easier close in profit) and stop-loss.
Sometimes trailing-profit feature have very nice profits.
Settings depends on your own money-management and free capital.
Don't ignore UP / DOWN trend. For UP trend I have an Indicator too (check my profile).
In addition to the upper/lower limits of each line, also average value is marked as this is an interesting area for price interaction and better view.
PM me to obtain access, more informations or support.
NOTICE: By requesting access to this script you acknowledge that you have read and understood that this is for research purposes only and I am not responsible for any financial losses you may incur by using this script.
