Higher High / Lower Low StrategyThis is a very simple trend following strategy for Day Trading. The premise is to follow the Moving Average for the trend direction and buy/sell the dips and blips in the trend.
1. In an uptrend, when the candle action offers a "dip", or a lower high, the strategy will then buy on the close of the candle that breaks the high of the previous candle.
2. In a downtrend, when the candle action offers a"blip", or a higher low, the strategy will then sell on the close of the candle that breaks the low of the previous candle.
3. The strategy will go Long only or Short only, not both. It must be manually reversed in the settings when a new trend is established.
4. The start month and year allow you to backtest from then until now. It's not one month at a time.
5. The strategy uses a reversal of the Stochastic %K variable as the exist. The setting for Period K controls the exit for backtesting purposes.
6. The strategy uses a moving average to determine the trend. The setting for the Period MA controls the SMA.
7. The strategy has the option of filtering the number of trades based on the direction of the MACD and/or the Signal line. This can either reduce or increase the probability, and is highly dependent on the price action of the instrument.
WARNING: I am not a licensed financial advisor. This script is intended for entertainment purposes only. I highly recommend you manually enter and exit positions per your own Trading Rules, and do not blindly follow any software or recommendation. Use of this script is elective and at your own discretion, and risk.
If you like this script, please give it a Thumb's Up, and leave a comment. If you would like any custom scripts developed, contact me to discuss it. All of my work here is open and available, free of charge. It can be copied and edited to suit your needs.
ابحث في النصوص البرمجية عن "candle"

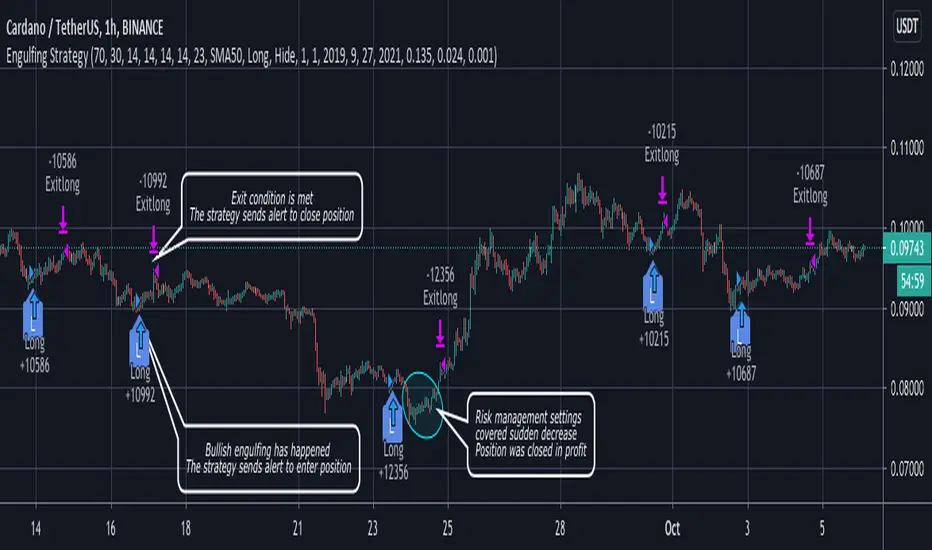
Engulfing strategy with DMI confirmationThe strategy contains Bearish and Bullish Engulfing trend reverse alerts with entry and closure notifications. Entries are enforced by Directional Movement Index (DMI) indicator levels combination. The strategy can be applied to spot, futures and marginal trading exchanges. It is suitable for both long and short positions and works accurately with BTC, USDT, ETH and BNB quote currencies. Best to use with 1H timeframe charts
Strategy elements can be configured at your own desire with user interface settings, no programming skills required:
1. Choose signals type: Long, Short or Both
2. Choose trend detection pattern rule:
SMA50 - provides a higher number of positions
SMA50 + SMA200 provides a higher accuracy
3. Change risk management settings to make the most accurate and efficient configuration. You can set up unique stop loss, take profit and trailing offset for different assets
4. Configure strategy periods
DMI and ADX lengths
ADX Smoothing
Key level
EMA and SMA lengths
5. Configure backtest dates
6. Show or hide RSI support and resistance bands
Engulfing strategy provides information for traders to enter the market in anticipation of a possible reversal in trend. Engulfing candles tend to signal a reversal of the current trend in the market. This specific pattern involves two candles with the latter candle "engulfing" the entire body of the candle before it. The engulfing candle can be bullish or bearish depending on where it forms in relation to the existing trend. The script calculates and compares values of the price action candles to define is there an engulfing and what type it is: bullish or bearish
If there is a bullish engulfing the indicator fills price action candle with yellow color
If there is a bearish engulfing the indicator fills price action candle with purple color
Advantages of the script:
1. The script detects presence of both types of engulfing: Bullish and Bearish
2. Weak engulfment signals and market noises are filtered by RSI bands and DMI confirmations. This allows to receive only strong and confirmed engulfment signals
3. This script has configurable risk management settings (order size, commission, take profit, stop loss and trailing). This provides you opportunity of direct broker connection and allows to conduct backtests before applying the strategy to real account. You also can set up strategy actions alerts
At the chart you can see the historical price action of ADAUSDT at Binance exchange from the January 1st 2019 till current date. The strategy is set up to receive only long signals because it is a spot market. Moments when the strategy triggered to enter a position are shown as L label while position entries are shown as "Long" messages. Moments when a certain position should be closed are shown as "Exitlong" messages
The strategy demonstrate high backtest results:
Mathematical expectation of risk management settings is positive = 1.34%
Percent profitable = 93.33%
Profit factor = 3.253
Quantity of entries = 75
Net profit = 15.22%
How to use?
Long signals:
1. Apply indicator to a trading pair your are interested in.
2. Click Settings button and select Alert Positions Type Long
3. Once bullish engulfing and confirmation conditions are met price action candle will be colored yellow and script strategy will enter a position.
4. Check Strategy Tester to set up optimal Risk management settings: stop loss, trailing profit activation point, trailing offset
5. Set up the strategy alert to be notified when a position should be opened or closed
Short signals:
1. Apply indicator to a trading pair your are interested in.
2. Click Settings button and select Alert Positions Type Short
3. Once bearish engulfing and confirmation conditions are met price action candle will be colored purple and script strategy will enter a position.
4. Check Strategy Tester to set up optimal Risk management settings: stop loss, trailing profit activation point, trailing offset
5. Set up the strategy alert to be notified when a position should be opened or closed
Best regards,
SkyRock Signals team
If you want to receive access to the strategy please contact us in personal message!
Lagged Donchian Channel + EMAThis strategy is based on a lagged 24 periods Donchian Channel and a 200 periods EMA .
The enter positions are calculated this way :
Bull entry
1. we wait for the close of a candle below the channel and it must be below the 200 EMA
2. the following candle must be a green one and close in the lagged channel
3. we put a long order at the close of the second candle, a stop loss at the low of last 3 candles and a x3 take profit
Bear entry
1. we wait for the close of a candle above the channel and it must be above the 200 EMA
2. the following candle must be a red one and close in the lagged channel
3. we put a short order at the close of the second candle, a stop loss at the high of last 3 candles and a x3 take profit
For both long or short positions :
If the order is not filled, it's cancelled if the price reach 50% of the TP or if the price reach the stop loss level
The position is closed if a new bear/bull condition appears in the other side of the position (if a bear appears when you're long and inversement)
Features :
Position calculator's included with leverage option
Labels of position can be plotted or not
Bull/Bear channels can be plotted with red and green filled
All parameters can be changed for backtesting
Better results have been got with defaults parameters on LTCUSDTPERP in H1 timeframe => profit factor of 2.84 with almost 100 positions.
Hope this strategy will be useful and it would be cool if I could get feedback, comments or better combinations of parameters !!
Don't hesitate to like and leave a comment ;)
@Mysteriown

Renko Level Strategy 2Renko Level Strategy
Main change of my previous strategy, that it look to one level of RENKO and use ATR value from each previous candle.
I think it is more correct than use levels that appears in first candle of new RENKO level, cause it base on current volatility, but not on volatility that was many candles ago.

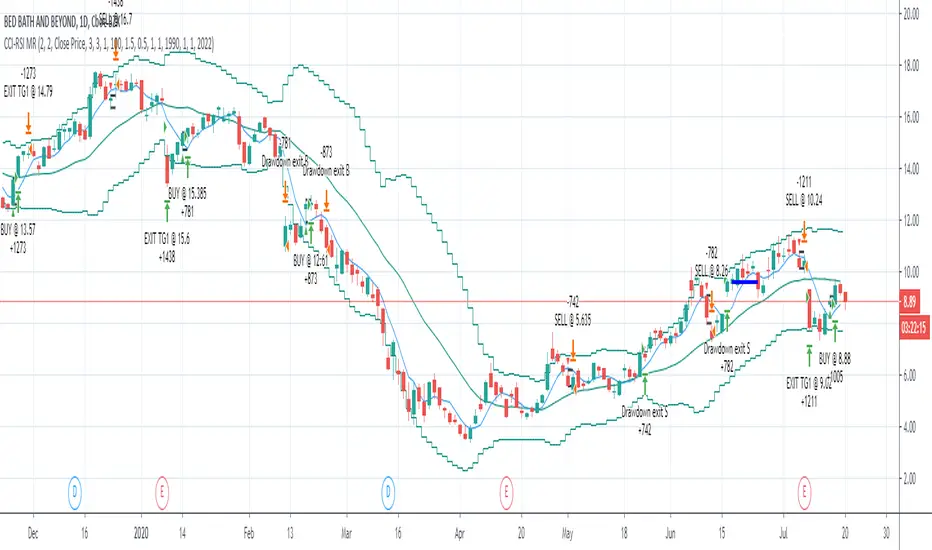
CCI-RSI MR Indicators:
Bollinger Bands (20 period, 2σ)
RSI (14 period) and Simple moving average of RSI (5 period)
CCI (20 period)
SMA (5 period)
Entry Conditions:
Buy when:
Swing low (5) should be lower than the highest of lower BB (3 periods)
Both RSI crossover RSI_5 and CCI crossover -100 should have happened within last 3 candles (including the current candle)
Once all the above conditions are met, the close should be higher than SMA (5) within the next 3 candles
After condition 3 is satisfied, we enter the trade at next candle’s open
Stop loss will be at 1 tick lower than previous swing low
Sell when:
Swing high (5) should be higher than the lowest of upper BB (3 periods)
Both RSI crossunder RSI_5 and CCI crossunder 100 should have happened within last 3 candles (including the current candle)
Once all the above conditions are met, the close should be lower than SMA (5) within the next 3 candles
After condition 3 is satisfied, we enter the trade at next candle’s open
Stop loss will be at 1 tick higher than previous swing high
Exit Conditions:
Since it’s mean reversion strategy we’ll be having only 2 target exits with a trailing stop loss after target price 1 is achieved.
Target exit price 1 & 2 are decided based on the risk ‘R’ for each trade
Depending on the instrument and time frame a trailing stop loss of 0.5R or 1R has opted.
A stop limit is placed @Entry_price +- 2*ATR(20) to offset the risk of losing significantly more than 1xR in a trade
Reversion Scalp Bot v4Name: Reversion Scalp Bot
Symbol: XBTUSD
Suggested Equity: 15%
Leverage: 10X or 25X
Candles: 1-minute
Type: Scalp
Description:
This scalp bot uses medium leverage to scalp small but high certainty movements on the 1-minute timeframe. In a proprietary feature, the algo is built for in and out trades essentially based on mean reversion and volume indicators.
The Algo is also leveraging pattern recognition and backtested volume analysis. You are trading with the exchange's built-in systems that drive liquidations and insurance funds. Each trade will be longer no than one hour.

Cracking Cryptocurrency - Bottom Feeder Strategy TesterBottom Feeder - Strategy Tester
The Bottom Feeder is designed to algorithmically detect significantly oversold conditions in price that represent profitable buying opportunities. Combining this with it’s unique Stop and Target System, the Bottom Feeder is designed to return consistent return with minimal draw down. Whether used as a Market Bottom Detector or as a system for executing safe, profitable mean reversion trades, the Bottom Feeder is a powerful tool in any trader’s arsenal.
Bottom Feeder was designed to be used on BTCUSD, however it is also effective on other USD/USDT pairs. One will have to check the individual pair they wish to trade with the Strategy Tester to simulate performance.
Strategy displayed is from 2018-2021 on **Conservative Mode** with Percent of Equity (30%) enabled.
Options
Let’s go through the input options one by one, so that you are able to comfortably navigate all that this indicator has to offer. The link below will display a picture of the layout of the settings for your convenience.
For the sake of simplicity, let’s note now that all settings marked **Conservative Mode** will not work in Aggressive Mode.
Mode : Determines how aggressively Bottom Feeder generates a buy signal. In Conservative Mode, trades can only be opened once per candle and the stop and target will update as new signals appear. In Aggressive Mode, a separate trade is opened each time Bottom Feeder signals, which may be multiple times within one Daily candle.
Position Sizing Strategy : Determines what Risk Management system you will deploy when trading Bottom Feeder. Your options are “Percent of Equity” and “Distance to Stop Loss”. If Percent of Equity is selected, a trade size will be equal to a percentage of your equity, pursuant to the value in the ‘Percent of Equity’ box. If Distance to Stop Loss is selected, then your Position Size will be determined based off the distance to your stop loss and the value in the ‘Risk Percentage’ box.
Percent Of Equity : Determines what percentage of your equity will be allocated to each trade when ‘Position Sizing Strategy’ is enabled.
Risk Percentage : Determines the size of each trade if ‘Distance to Stop Loss’ strategy is enabled. This value reflects what percent of your account you will lose per trade if the trade hits your stop loss.
Plot Target and Stop Loss : Toggles on/off the visualized take profit and stop losses on the chart.
**Conservative Mode** TP Multiplier : This is an input box, it requires a float value. That is, it can accept either a whole number integer or a number with a decimal. This number will determine your Take Profit target. It will take whatever number is entered into this box and multiply the Average True Range against it to determine your Take Profit.
**Conservative Mode** SL Multiplier : See above - this will modify your Stop Loss Value.
**Conservative Mode** Average or Median True Range : This is a drop-down option, the two options are Average True Range or Median True Range. If Average True Range is selected, then this indicator will use the Average True Range calculation, that is, the average of a historical set of True Range values to determine the Average True Range value for Target and Stop Loss calculation. If Median True Range is selected, it will not take an average and will instead take the Median value of your historical look back period.
**Conservative Mode** True Range Length : This is an input that requires an integer. This will represent your historical lookback period for Average/Median True Range calculation.
**Conservative Mode** True Range Smoothing : This is a drop-down with the following options: Exponential Moving Average ( EMA ), Simple Moving Average ( SMA ), Weighted Moving Average ( WMA ), Relative Moving Average (RMA). This will determine the smoothing type for calculating the Average True Range if it is selected. Note: if Median True Range is selected above, this option will not have any effect as there is no smoothing for a Median value.
**Conservative Mode** Custom True Range Value? : This is a true/false option that is false by default. If enabled, it will override the Average/Median True Range calculation in favor of a users custom True Range value to be input below.
**Conservative Mode** Custom True Range Value : This is an input box that requires a float value. If Custom True Range is enabled this is where a user will input their desired custom True Range value for Target and Stop Loss calculation.
From Month/Day/Year to Month/Day/Year : This sets the Time Frame of your backtest for the Bottom Feeder Strategy. It will run FROM the date selected TO the date selected.
Stop and Target Description
Because Bottom Feeder is designed only to scalp the various market bottoms that can appear over time in the market and not to identify trends or to trade ranges, it’s imperative that the indicator notify us not just to when to enter our trades, but when to exit! In the service of that, CC Bottom Feeder has a built in Stop and Target system that tracks and displays the stop loss and take profit levels of each individual open trade, whether in Aggressive or Conservative Mode.
Conservative Mode Targeting: In Conservative Mode, Bottom Feeder signals are aggregated into a compound trade. The signal will appear as a green label pointing up below a candle, and will appear upon a candle close. If Bottom Feeder then generates another signal the stop loss and target price will be updated. The process will continue until the aggregated trade completes in either direction. On a trade with multiple signals, a larger position is slowly entered into upon each buy signal.
Aggressive Mode Targeting: In Aggressive Mode, Bottom Feeder signals are individually displayed as they are generated, regardless of how many signals are generated on any single candle. If Bottom Feeder continues to signal, each individual open trade will have their own stop loss and target that will be displayed on the chart until the individual trade completes in either direction. As opposed to a large compound position, aggressive mode represents a higher number of independent signals with their own stop and target levels.
Stop losses and targets are designed to be hard, not soft. That is, they are intended to be stop market orders, not mental stop losses. If price wicks through the target or stop, it will activate.

UT Bot Strategy with Backtesting Range [QuantNomad]UT Bot indicator was inially developer by @Yo_adriiiiaan
Idea of original code belongs @HPotter
I can't update my original UT Bot Strategy so I publishing new strategy with backtesting range included.
I just took code of Yo_adriiiiaan, cleaned it, deleted all useless pieces of code, transformet to v4 and created a strategy from it.
Also I added an input that allows you to swich to signals from Heiking Ashi. I saw that author uses HA for the indicator and on HA it look much nices then on real candles.
Do not add this strategy to HA candles, use usual candles and this checkbox.
Original script:
UT Bot

UT Bot StrategyUT Bot indicator was inially developer by @Yo_adriiiiaan
Idea of original code belongs @HPotter
I just took code of Yo_adriiiiaan, cleaned it, deleted all useless pieces of code, transformet to v4 and created a strategy from it.
Also I added an input that allows you to swich to signals from Heiking Ashi. I saw that author uses HA for the indicator and on HA it look much nices then on real candles.
Do not add this strategy to HA candles, use usual candles and this checkbox.
Original script:

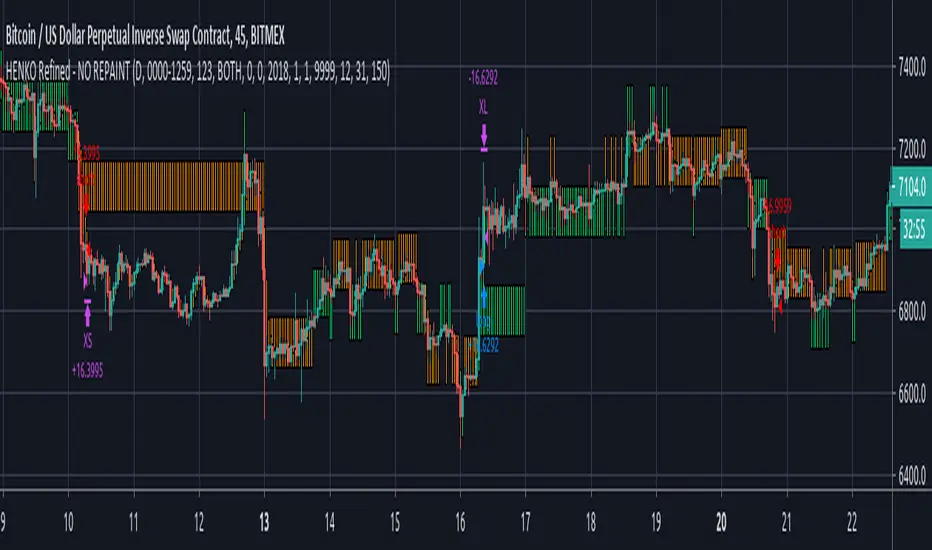
HENKO (Renko + HeikinAshi) -- No RepaintThis particular work is completely mine.
I have not used anyone else's code (not even a fragment).
Parts of the code are used from Open Source library linking to www.investopedia.com and TradingView's example section at www.tradingview.com
The above sources have been used to get Custom Heikin Ashi Candles.
Calculations on Renko bars is completely on me as I have used Daily close and open values to build my own Renko Candles.
Custom Bricksize for Float values has been made available in this public version.
I take no responsibility for the performance of this indicator as I have completely turned off the Repainting in this version of my script.
I am publishing the script for Public use.
I'll be releasing updates for this script in future as the performance is somewhat acceptable.
Profit Factor will decrease with bigger backtest data.
NO REPAINTING issues shall be reported at all costs as the tradingview's default Time based renko has been completely discarded, thus making it rely on its own.
Be advised that as the Renko Bars are calculated at 00:00 UTC, you're not supposed to mess with the timing in the script, unless you're working with Stock markets where it is important that you set your day start and end precisely.
You can play with the Brick Size to see what's more beneficial for you.
No Repaint RENKO
NOTE:= PERFORMANCE OF THIS INDICATOR DEPENDS UPON THE BRICKSIZE OF RENKO BARS.
00-ST-PerfectD1CAUTION: This is a fake strategy.
This strategy shows maximum profitability when you trade with no mistake.
This strategy buy on bullish candles and sell on bearish candles by looking ahead D1 candles.

Zulu Kilo 4HR Strategy - LIVE BETA TESTING***MANDATORY READING SO YOU DONT LOSE MONEY ON A POSITION***
I will be posting a video soon on my TV channel to explain exactly what you're about to read below so you can visually understand the process.
PLEASE NOTE THE FOLLOWING IMPORTANT CONDITIONS:
-The script DOES repaint since it looks for specific EMA conditions to meet position thresholds so there are some implications that MUST be observed BEFORE entering into a position.
-This script MUST be used in conjunction with at minimum 3 other indicators before entering the position it calls for you to enter, OR exiting a currently held position. Details on the bottom.
-The 3 recommended indicators that MUST be used in conjunction to verify position entry are: MACD, RSI and STOCH indicators.
-Do NOT change any of the settings in the script as it will not indicate the correct divergence/convergence for when to look for opening a position.
The three indicators I recommend in conjunction are all FREE indicators available openly on Tradingview Indicators:
(PLEASE NOTE THAT THE BELOW INDICATORS ARE NOT MINE, I GIVE ALL CREDIT TO THEIR ORIGINAL PUBLISHERS. THEY ARE *NOT* PART OF THIS SCRIPT.)
1) "Smooth Chande Trend Score w/ Signal line by CryptoRythms" (This is a volume weighed MACD indicator that shows convergence and divergence)
2) "STOCH_VX3" (This is a really smart and useful Stochastic indicator)
3) "CM_RSI Plus EMA" (This is an RSI trend indicator with an EMA reference line for added clarity of trend direction)
How to correctly use the Zulu Kilo indicator:
1) The time frame it is encoded for is the 4 hour time frame and that is what MUST be used to correctly identify a potential position entry/exit.
2) Getting into an initial position (when NOT currently in any position):
TWO OPTIONS:
A) ENTER INTO AN EXISTING SIGNAL
-IF indicator is showing an existing SHORT entry, the 3 other indicators must ALL be aligned crossing DOWN or trending downwards.
-IF indicator is showing a LONG entry, the 3 other indicators must ALL be aligned crossing UP or trending upwards.
B) ENTER INTO NEXT SIGNAL GENERATED
-Wait for indicator to generate a Short/Long position on a candle, DO NOT enter into that position until ALL 3 bottom indicators converge to pointing up (for a Long entry), or pointing down (for a Short entry).
-VERY IMPORTANT: It is NOT enough for the 3 bottom indicators to cross into a buy/sell until that 4 hr candle has closed with all 3 indicators trending up (for long) or trending down (for Short).
-I REPEAT **DO NOT** get into the indicated long/short position until the 4 hr candle has closed on the bottom three indicators as crossing up or down. There will be numerous times where on current 4hr candle, the 3 bottom indicators will cross into a buy/sell signal. That 4hr candle's price action CAN change until the current 4hr candle closes. IT IS NOT ENOUGH to get into any position indicated by my indicator unless the current 4hr candle where the bottom 3 indicators converge/cross up or down CLOSES the candle.
3) Exiting a position (Taking profit and entering new position):
-If you are in an existing position, please note that fake Long/Sell signals will be generated by the script. So when do you take profit from current position and enter the next position?
Scenario:
You are currently in a LONG position. Price goes up, there is price consolidation happening and a SHORT signal is generated. DO NOT immediately take profit and close your existing Long position yet. Unless, ALL 3 bottom indicators converge and cross downwards AFTER the current 4hr candle is confirmed, you will stay in your long position. You will ONLY exit and take profit / Stop Loss from your LONG position and go into a SHORT is when all 3 bottom indicators cross downwards on a 4hr candle close and confirm pointing/crossing down.
The exact inverse if you're in a SHORT position... If a LONG pops up while in a SHORT position, do NOT exit the SHORT immediately. Only exit the short, take profit, and then enter a long if all three indicators close on a 4hr candle where the 3 indicators are crossing up. If that does not happen, the long signal will disappear eventually, and you continue in the short position until another LONG signal pops up, repeat the same process.
***VERY IMPORTANT***
I cannot stress this enough!
I need all of the strategy followers to understand that the ONLY way you would ever enter into a signaled position is when a 4hr candle closes where the bottom 3 indicators are ALL crossing/pointing up (for a LONG) or ALL crossing/pointing down (for a SHORT).

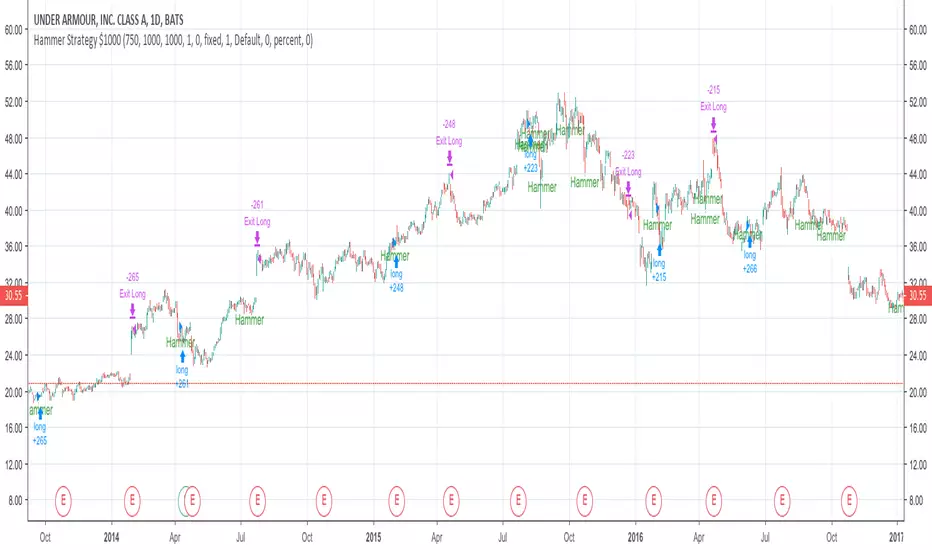
Basic Hammer StrategyThis is a basic strategy that will buy after a hammer is printed, and sell when a predetermined risk or reward price is hit. You can change the risk and reward values in the settings. Risk and reward values are in increments of $0.01. Default values are 75 ($0.75) and 200 ($2.00). If the strategy is producing losses, try adding a zero to the end of the risk value and the reward value. Example: Higher valued stocks may do better with a Risk of 750 ($7.50) and a Reward of 2000 ($20.00). Maybe even a Risk of 750 ($7.50) and reward of 1000 ($10.00). Play around with these values to get the best result for different charts. Initial investment is set to $1000
Doji strategyThis is a simple strategy based on Doji star candlestick.
It places two orders: buy stop at doji star high or previous candle high and sell stop at doji star low or previous candle low.
Exit rules are with take profit and fixed stop loss or take profit and stop loss at doji min or max.
This strategy works very well with high time frames like Daily and Weekly because those are without noise in doji formation.
Each currency pair has its own optimal setting for TP and SL: it's up to user find the best ones.
I could implement SL based on ATR, maybe in next revision.
Please use comment section for any feedback.
Next improvement (only to whom is interested to this script and follows me): study with alerts on multiple tickers all at one. Leave a comment if you want to have access to study.

cryptomars 1.0 signal Concussion trend
Description:
1. In the indicator, there is an orange signal that fluctuates linearly. It is a buy signal when it goes from bottom to top. When the signal line remains in the upper position, it indicates a multi-party trend.
2. When it goes from top to bottom, it indicates a sell signal. When the signal line remains below, it indicates a sales trend.
3. Depending on the time level, when the position of the signal line changes, determine whether the current candle is completed or not according to the time level of the chart you selected to determine the signal. For example, if you select a chart level of 5 meters, then when the signal line changes, for example, it will send a sell signal from top to bottom. At this time, please do not rush to sell. You should wait for this 5 meter candlestick to complete. When the candle is over and the next candle is started, if the signal line remains in the top-down form, the sell signal is normal and you can sell it.
Because the position of the signal appears, it is the location of the sale. During the completion of the candlestick , the signal may disappear after disappearing. We only have to wait for a while to get a more stable deal.
4. The alarm setting is very simple. There are two lines in the indicator. One is the orange signal line that fluctuates up and down, and the other is the fixed zero line of “zero”.
We set it in the alarm. When the signal line passes "zero" from the top, the short signal is sent only when the candle map is completed. When the signal line passes "zero" from "up" below, the signal is sent for a long time when the candlestick is completed.
One trick, the appearance of the signal, is that the price runs in one direction for a while, so it appears at or near the bottom. Because, when we have already made a profit in the transaction, we can make a profit in advance, and we do not need to wait for the opposite signal to stop the profit and reduce the risk of profit retracement.
Because in this market, the fluctuations are very large, and the people who compete are also very fierce. What we need to do is to make every transaction as possible, and we are all profitable. If we sell and find that the price is still rising, please don't feel sorry, don't consider eating all the profits.
6. When the signal appears, in most cases, even in the impact trend, it will still run a distance in the direction of the signal, that is, you will profit, so please close the position and make a profit in time. Otherwise, when the price volatility is too small, you miss the profit point, the price starts to run in the opposite direction, and you may change from profit to loss.
BITMEX's trailing stop loss is a great feature, please use it flexibly.
7, if it is a shock trend, please try not to trade.
8. We recommend that you turn on the “cryptomars 3.0” and “cryptomars 2.0” indicators. No matter who signs the trade first, you can trade, which can help you get more profit.
9. Remember, I hope this indicator will be your powerful assistant, but please don't rely on it completely. Learning more trading knowledge and skills is even more important. Therefore, when we consider the profitable position, you can use your trading skills, MACD , KDJ, etc. to assist and profit in a more suitable position.

cryptomars signal short 2.0Description:
1. In the indicator, there is an orange signal that fluctuates linearly. It is a buy signal when it goes from bottom to top. When the signal line remains in the upper position, it indicates a multi-party trend.
2. When it goes from top to bottom, it indicates a sell signal. When the signal line remains below, it indicates a sales trend.
3. Depending on the time level, when the position of the signal line changes, determine whether the current candle is completed or not according to the time level of the chart you selected to determine the signal. For example, if you select a chart level of 5 meters, then when the signal line changes, for example, it will send a sell signal from top to bottom. At this time, please do not rush to sell. You should wait for this 5 meter candlestick to complete. When the candle is over and the next candle is started, if the signal line remains in the top-down form, the sell signal is normal and you can sell it.
Because the position of the signal appears, it is the location of the sale. During the completion of the candlestick , the signal may disappear after disappearing. We only have to wait for a while to get a more stable deal.
4. The alarm setting is very simple. There are two lines in the indicator. One is the orange signal line that fluctuates up and down, and the other is the fixed zero line of “zero”.
We set it in the alarm. When the signal line passes "zero" from the top, the short signal is sent only when the candle map is completed. When the signal line passes "zero" from "up" below, the signal is sent for a long time when the candlestick is completed.
One trick, the appearance of the signal, is that the price runs in one direction for a while, so it appears at or near the bottom. Because, when we have already made a profit in the transaction, we can make a profit in advance, and we do not need to wait for the opposite signal to stop the profit and reduce the risk of profit retracement.
Because in this market, the fluctuations are very large, and the people who compete are also very fierce. What we need to do is to make every transaction as possible, and we are all profitable. If we sell and find that the price is still rising, please don't feel sorry, don't consider eating all the profits.
6. When the signal appears, in most cases, even in the impact trend, it will still run a distance in the direction of the signal, that is, you will profit, so please close the position and make a profit in time. Otherwise, when the price volatility is too small, you miss the profit point, the price starts to run in the opposite direction, and you may change from profit to loss.
BITMEX's trailing stop loss is a great feature, please use it flexibly.
7, if it is a shock trend, please try not to trade.
8. We recommend that you turn on the “cryptomars 3.0” and “cryptomars 1.0” indicators. No matter who signs the trade first, you can trade, which can help you get more profit.
9. Remember, I hope this indicator will be your powerful assistant, but please don't rely on it completely. Learning more trading knowledge and skills is even more important. Therefore, when we consider the profitable position, you can use your trading skills, MACD , KDJ, etc. to assist and profit in a more suitable position.

cryptomars signal 3.0Description:
1. In the indicator, there is an orange signal that fluctuates linearly. It is a buy signal when it goes from bottom to top. When the signal line remains in the upper position, it indicates a multi-party trend.
2. When it goes from top to bottom, it indicates a sell signal. When the signal line remains below, it indicates a sales trend.
3. Depending on the time level, when the position of the signal line changes, determine whether the current candle is completed or not according to the time level of the chart you selected to determine the signal. For example, if you select a chart level of 5 meters, then when the signal line changes, for example, it will send a sell signal from top to bottom. At this time, please do not rush to sell. You should wait for this 5 meter candlestick to complete. When the candle is over and the next candle is started, if the signal line remains in the top-down form, the sell signal is normal and you can sell it.
Because the position of the signal appears, it is the location of the sale. During the completion of the candlestick , the signal may disappear after disappearing. We only have to wait for a while to get a more stable deal.
4. The alarm setting is very simple. There are two lines in the indicator. One is the orange signal line that fluctuates up and down, and the other is the fixed zero line of “zero”.
We set it in the alarm. When the signal line passes "zero" from the top, the short signal is sent only when the candle map is completed. When the signal line passes "zero" from "up" below, the signal is sent for a long time when the candlestick is completed.
One trick, the appearance of the signal, is that the price runs in one direction for a while, so it appears at or near the bottom. Because, when we have already made a profit in the transaction, we can make a profit in advance, and we do not need to wait for the opposite signal to stop the profit and reduce the risk of profit retracement.
Because in this market, the fluctuations are very large, and the people who compete are also very fierce. What we need to do is to make every transaction as possible, and we are all profitable. If we sell and find that the price is still rising, please don't feel sorry, don't consider eating all the profits.
6. When the signal appears, in most cases, even in the impact trend, it will still run a distance in the direction of the signal, that is, you will profit, so please close the position and make a profit in time. Otherwise, when the price volatility is too small, you miss the profit point, the price starts to run in the opposite direction, and you may change from profit to loss.
BITMEX's trailing stop loss is a great feature, please use it flexibly.
7, if it is a shock trend, please try not to trade.
8. We recommend that you turn on the “cryptomars 2.0” and “cryptomars 1.0” indicators. No matter who signs the trade first, you can trade, which can help you get more profit.
9. Remember, I hope this indicator will be your powerful assistant, but please don't rely on it completely. Learning more trading knowledge and skills is even more important. Therefore, when we consider the profitable position, you can use your trading skills, MACD , KDJ, etc. to assist and profit in a more suitable position.

3 HULLs & ICHIMOKU divided by PRICEBasically just another form of moving average, for quick swings, built for testing/use with API cryptobots, simple switch from buy to sell.
Hull MA(2 candles back) times 3 plus Ichimoku divided by price(1 candle back) = value1
Hull MA(3 candles back) times 3 plus Ichimoku divided by price(1 candle back) = value2
if value1>value2 then buy else sell
calculates price from 1 candle back, and calculates signal from 2nd and 3rd candle prices, so no repainting? so best on low timeframes.
for when use in bot, would not need 1 candle lag. Lag is for TV chartists to not have to suffer repainting.
Bots do not repaint. they are not "painting" anything, they simply open or close orders, which cannot be "repainted"
but here on TV chart, when you refresh the browser page, the script recalculates, and signals may be repainted.
hopefully this will not repaint. please test. thankyou

Crypto TS - Ultimate BTCUSDThis is an "advanced" trend follower Trading system, specifically developed for Bitcoin.
In this project the strategy combines two time frames, daily and 4h bars.
Bitcoin's trend is analyzed in background with Normal candlestick and Heikin-Ashi candlestick.
The operations start from the first trading day (01/01/2017) but you can change this by the following input variables:
From Month
From Day
From Year
First trading day: 01/01/2017
Initial Capital: 1000 $
net profit: 1254 %
To use this Trading system open the BTCUSD 4h Bitfinex chart and apply this strategy.
This Trading system can be fully automated to buy and sell automatically on major exchanges.

Heikin Ashi Trend StrategyStrategy Overview
Uses two timeframes to combine and identify trends for buying + selling securities. Works well on Bitcoin, currencies and indices.
Usage
This strategy should be used on 1-hour or 4-hour candles. Try it on 4-hour bitcoin for example.
Normal candles are fine but lead to more fakeouts. Heiken ashi candles lead to fewer trades and longer hodling of the trend but harder to enter/exit because Heiken Ashi candles are not true prices.
Strategy results
In my testing I ran the backtest from mid December onwards to capture the very tricky bear market that bitcoin has suffered. In this market it made huge profits from a $100k initial virtual account. Profit ratio is very high and trade success rate very high. However, a warning. In live trading it will flip BUY/SELL as the trend changes . This is a bug / flaw in the TradingView scripting engine in my opinion. It should not change past buy or sell signals. So to confirm the trend signal you want to see at least one block of the orange indicator complete or maybe use this indicator in combination with other.
Watch it for confirmation of keeping in existing trades and don't do everything it says as it says or bet the farm or you may rekt. Would recommend paper trading to understand the indicator + the signals.
My advice would be not to short an uptrend and not to long a downtrend. Some of the most profitable trades are with the trend and not the whips + saws.
Inputs
Trade Short? Default false. When true generates short trades not just close long
Backtest Start Year/Month/Day. Limits the backtest window to a certain timeframe to test tricky markets
Higher Timeframe: The length of the higher timeframe to monitor
Lower timeframe: The length of the lower timeframe to monitor
Show trades? When true shows the buy sell trades and performs the backtest. When false its just an indicator
Tips!
Any tips would be gratefully received. My addresses are as follows:
BTC: 35m8CyMQeWCezRUzQdaH3qEBpEyzSPAazS
ETH: 0xD09605A5D9ef9768e5AE17A74A5f0D42c97eC3a9
LTC: MV9yLEFoM5R8sgCHdeaehH3owjLni8FFz1

Noro's PriceChannel Strategy v1.2In v1.2 added
+ Capital, % parameter
+ Counter-trend entry
+ Lines of PriceChannel
The blue line is the middle of the price channel.
If to use trend entry
If there are 2 red candles in a row and a body of the last candle more than a half of an average body of a candle and a candle was closed over the line - to open long-position
If there are 2 green candles in a row and a body of the last candle more than a half of an average body of a candle and a candle was closed under lines - to open short-position
If to use counter-trend entry
If the price of closing is lower than the lower line of the price channel and the candle red - to open long-position
If the price of closing is higher than the top line of the price channel and the candle green - to open short-position
If use RSI strategy
If RSI-2 < 25% and a body of the last candle more than a half of an average body of a candle and a candle was closed over the line - to open long-position
If RSI-2 > 75% and a body of the last candle more than a half of an average body of a candle and a candle was closed under lines - to open short-position
Exit
If the candle green and a body of the last candle more than a half of an average body of a candle - to close long-position
If the candle red and a body of the last candle more than a half of an average body of a candle - to close short-position

Noro's Price Channel Strategy v1.1The blue line is the middle of the price channel .
If to use color strategy
If there are 2 red candles in a row and a body of the last candle more than a half of an average body of a candle and a candle was closed over the line - to open long-position
If there are 2 green candles in a row and a body of the last candle more than a half of an average body of a candle and a candle was closed under lines - to open short-position
If use RSI strategy
If RSI-2 < 25% and a body of the last candle more than a half of an average body of a candle and a candle was closed over the line - to open long-position
If RSI-2 > 75% and a body of the last candle more than a half of an average body of a candle and a candle was closed under lines - to open short-position
Exit
If the candle green and a body of the last candle more than a half of an average body of a candle - to close long-position
If the candle red and a body of the last candle more than a half of an average body of a candle - to close short-position

Noro's Price Channel Strategy v1.0The blue line is the middle of the price channel.
If there are 2 red candles in a row and a body of the last candle more than a half of an average body of a candle and a candle was closed over the line - to open long-position
If there are 2 green candles in a row and a body of the last candle more than a half of an average body of a candle and a candle was closed under lines - to open short-position
If the candle green - to close long-position
If the candle red - to close short-position
