Swing Trades Validator - The One TraderThis swing trading strategy validator is built on the original strategy taught in my bootcamp for swing traders.
The strategy is simple and follows a trend trading pattern on prices reacting to Exponential Moving Averages over a multiple time-frame analysis.
The details of the strategy are as follows:
- Holding Period : Upto a couple of months
- Time-frames to be analysed : Month - Week - Day
- Trade Execution : Daily Time-frame
Analysis Details:
Step 1 : On the Monthly time-frame, the candle needs to be bullish with the latest close being higher than the opening price of the month.
Step 2 : The price needs to be above the 8ema on the Monthly time-frame.
Step 3 : The 8ema must be above the 20ema on the Monthly time-frame.
The above steps indicate a bullish strength in the instrument on the Monthly time-frame.
Step 4 : On the Weekly time-frame, the candle needs to be bullish with the latest close being higher than the opening price of the week.
Step 5 : The price needs to be above the 8ema on the Weekly time-frame.
Step 6 : The 8ema must be above the 20ema on the Weekly time-frame.
The above steps indicate a bullish strength in the instrument on the Weekly time-frame.
Step 7 : On the Daily time-frame, the candle needs to be bullish with the latest close being higher than the opening price of the day.
Step 8 : The price needs to be above the 8ema on the Daily time-frame.
Step 9 : The 8ema must be above the 20ema on the Daily time-frame.
The above steps indicate a bullish strength in the instrument on the Daily time-frame.
Step 10 : While the 8ema is above the 20ema on the Daily time-frame, the price must be allowed to rise before a pullback is seen towards the moving averages, indicating a bearish move trying to change the trend.
Step 11 : These pullback candles need to form a pattern called the Ring Low with the second pullback candle having a lower high and lower low and the low of the last pullback candle being lesser than or equal to the fat ema on the Daily time-frame.
Step 12 : If the stock is still bullish and the trend is displaying a strength in the underlying bullish direction, then there will be a resumption candle that will have a closing price higher than the previous day's high price.
This trend continuation signal is a confirmation that the instrument will continue in the underlying trend direction and we will be able to enter if this condition is satisfied.
The profit and loss percentages are set at a default 10% as this can be a minimum risk : reward for swing trades on average, but the inputs have been made available to the users in order to adjust the risk : reward to find the most optimum breathing room for each individual stock or instrument. This will give the user a highly custom overview of the strategy on individual instruments based on their volatility and price movements.
The strategy tester will auto back-test this strategy historically and find all the trades that were taken based on this strategy and populate a performance summary.
The most important data in V1.0 of this script are as follows:
1. No. of Trades Taken : We want to see many trades being taken on this strategy in that particular instrument. This shows us a healthy report on the number of winning vs. losing trades.
2. Percentage Profitable : We want to see that this strategy has worked out in the past and is giving us a high probability of return. This in no way an indication that the strategy will definitely work out in the future as well, but gives us an idea of whether or not we should enter this trade.
3. No. of Winning Trades vs. Losing Trades : We would like to see a significantly higher number of winning trades.
4. Avg. # of bars in a trade : This gives us an idea of how long on average we might have to wait to see the results of this strategy either in favor of our reward or against our desired direction. Some trades can be completed in around 15-20 bars on average and some trades have shown to take upto 45 days to reach desired reward. This is in line with our planned holding period, but gives the trader a sense of time and increased level of patience.
The future updates will have more utility of the various elements of the strategy tester and the entire exit strategy will be integrated into the script.
This script is not to be used as a standalone method and must be studied well in order to execute trades. I have not hidden visibility on other time-frames, but since order execution is done on the Daily time-frame, the script must run on the Daily time-frame only.
There are many other factors to be taken into consideration before entering a trade and proper risk management and position sizing rules must be followed.
Our bootcamp participants will use this strategy tester in conjunction with the invite-only Trading Toolkit assigned to them.
The development of this script will be ongoing and all comments and feedback are welcome.
ابحث في النصوص البرمجية عن "candle"

Zendog V3 backtest DCA bot 3commasMAJOR UPDATE:
- Update to Pinescript v5
- MAJOR refactor for the logic of how orders are placed. BO order is placed when the condition is first encountered and we are not in a deal.
The extra SO orders (if based on price movement) are all placed on the next candle after BO order, instead of each being placed one after another.
Take profit (if percentage) and Stop loss are placed on the first candle after BO order because if BO and TP are on the same candle TV does not execute properly.
These changes should improve strategy accuracy when multiple prices are hit by the same candle.
- NEW FEATURE: Support to Stop deal using an external indicator (i.e. stop long deal when RSI > 80)
- NEW FEATURE: Support to trigger Safety orders using an external indicator (i.e. trigger each additional SO when RSI < 10, regardless of price movement)
The price movement logic may be implemented in the indicator that plots start / end signals. The SO size is calculated using the configuration of steps.
- NEW FEATURE: Safety order command for 3commas bot. This is implemented using Add funds in the quote currency (for pair BTCUSDT the quote currency is USDT)
The SO size is calculated using the configuration of steps, for exact order size (and price) use the built-in Steps table.
- NEW FEATURE: Addition of extra columns to the steps table: Required price for TP, Required % change for TP, Required % change for BEP (Breakeven point)
- Update to steps table to remove prices when Safety orders are not based on % price change
- The code is opensource. I will not be able to sustain merges for the script, but feel free to use and develop your own version and ping me on discord to review them
and maybe include in the original script

Hull MA TimeFrame CrossOverHello traders,
Although this strategy is configured on BTCUSDT , with a changing of settings, it can be used on any trading instrument.
Here it is seen, on the 2 hour chart. With Trading Fees included in result (adjust to suit your exchange fees).
The candle crossover is set to Daily timeframe.
That means that the Candle crossover is going to see if todays price is higher than yesterdays price.
If user sets this to 4 hour timeframe, the candle crossover would be when price is higher than the the price 4 hours ago...
The rest is simple, a moving average to detect direction, and an ATR StopLoss (if activated).
There is StopLoss and Take Profit settings which work by percentage.
The periods of the moving average and the ATR can be adjusted, as can the TP % and SL %.
The price is taken from the CLOSE or the OPEN or OHLC4 etc... which can be changed in the settings. OPEN is recommended to avoid repainting.
The moving average also has selectable types (ALMA,SMA,EMA,WMA,HMA)
So if the Price is above the Moving average, and the moving average is above the alternate timeframe value, then a buy is activated
if the Price is below the Moving average, and the moving average is below the alternate timeframe value, then a sell is activated
if OPEN is selected as Price source, then the alternate timeframe value would be the OPEN of the alternate timeframes candle.
the values are all plotted on chart so user can see what is happening when what crosses over what, and then what changes when settings are adjusted.
Have FuN!
if this strategy brings you the epik win......
.... dont forget about me
seaside420 ❤️

Profit Maxima: a crypto strategyThis strategy is designed for those who are looking for long-term positions with low risk and high profitability.
How does it work?
In short, the basis of this strategy is the frequent modeling of the price using regression equations and the estimation of the range of price movements.
The price modeling process starts from the first bars and will be repeated on each bar. This process is performed in each candle based on the data available up to that candle, and data for subsequent bars is not used.
There is also no fixed price model, but it will change from one candle to the next; Therefore, the more candles there are, the larger the statistical population and therefore the quality of the price model increases.
I have also used the concept of scarcity. Bitcoin is the first scarce digital object in the world. Once something becomes scarce enough, it can be used as money. This scarcity gradually increases and affects the price. The entire crypto market also follows Bitcoin.
However, always remember that past results in no way guarantee future performance.
Why this strategy generates a small number of trades?
Preston Pysh believed Bitcoin cycles happen in three phases: the Bull Run, the Correction, and the Reversion to the Mean. He estimates there are about 200,000 blocks per cycle and there are about 144 blocks per day.
Therefore, each cycle of Bitcoin lasts about four years. The entire crypto market follows bitcoin. On the other hand, cryptocurrency is a new phenomenon. They have a limited price history.
This strategy is designed to open a long position at the lowest possible price. In addition, due to the concept of scarcity and its continued impact on prices, trading in the “short” direction is avoided.
The combination of these factors leads to generate a small number of trades. However, you can test it on several different charts to make sure it works properly.
Default settings
{ default_qty_type } = strategy.percent_of_equity
{ default_qty_value } = 3.3
{ commission_value } = 0.1
{ pyramiding } = 3
{ close_entries_rule } = "ANY"
In a simple word, buy (Entry) and sell (take-profit) orders are each done at three different levels. At each level, 3.3% of equity is used (9.9% in total)
0.1% commission is considered for each transaction.
“close_entries_rule” determines the order in which orders are closed. The default is FIFO (first in, first out), but in this strategy, orders are executed in “first in, last out” order. In this way, the lowest buy (Entry) order corresponds to the lowest sell (take profit) order.
Choose the best chart
Charts have a significant impact on the performance of the strategy. As mentioned, the more historical bars there are, the larger the statistical population and therefore the quality of the price model increases.
You can use the Chart Quality panel to choose the appropriate chart:
The ‘Historical Bars’ field shows the number of candles in the chart. Choose the chart of an exchange that has the most historical bars.
The ‘Recommended Chart’ field shows the suggested chart for some symbols.
The “Predictability” field indicates to what extent price movements can be predicted using the model; the higher the “predictability”, the more credible the results of the strategy. "Predictability" indicates that the results of the strategy are reliable or not.
The image below shows the recommended chart for 20 different symbols:
How to use
You don't need automated trading platforms to use it. It can be used by placing simple buy and sell (take-profit) orders manually.
The green and red lines indicate the 'Entry' and 'Profit' levels respectively. If there is no order (buy / sell) active on one of these levels, it will be displayed in gray. The corresponding values are displayed in the Entry & Profit Limits table.
After choosing the appropriate chart, you can use this table to place your orders manually.
Note that trading in the "short" direction is not recommended at all.
Samples

Scalper Helper System===========================================================================
===========================================================================
Description
===========================================================================
===========================================================================
Scalper Helper System combines a series of trade strategies which have been learned and honed in the Jim of All Trades channel.
Paixy has contributed candlestick combination rules, Jonas has shared his deep understanding of Stochastic.
Jim himself has taught clearly on the merits of RSI.
This system attempts to formulate all the notes and rules I have made over the past months.
The system searches for 10 - 15 rules which are divided into bullets and bombs. Bombs relate to momentum, so these signals may not be pinpoint accurate, but they are more often leading to bigger moves.
This initial version is released mainly only to the JOAT community to help continue the development of the idea and to help find
continued improvements.
Special thanks to FiendishFeather for his strategy work, (check out his work to learn how to apply any trading strategy to his back testing harness), and the date filtering snippet and the tip to show this option at the top.
===========================================================================
===========================================================================
The strategy decisions are based on the following general rules:
===========================================================================
===========================================================================
BULLETs are hint to the idea of firing a small sized position into the market, BOMBs are hints to go all in - however this does not mean proper risk management should be forgotten.
Without risk management this and any strategy will lead to failure.
Without risk management this and any strategy will lead to failure.
Without risk management this and any strategy will lead to failure.
Without risk management this and any strategy will lead to failure.
===========================================================================
Bullet1 uses the value of the stochastic and checks for buy/sell cross over on 5m, 8m and 13m chart.
These values should be calculated on a ratio basis ideally.
Bullet2 measures divergence between the printed Stochastic signals.
Bullet3 has been decommissioned.
Bullet4 is an RSI divergence and value indicator.
Bullet5 has been decommissioned.
Bullet6 uses the history of the stochastic buy and sell signals
Bullet7 uses the Scalper Helper Trends for entries by attempting to see how the overall trend is changing. More refinement is needed here.
Bullet8 uses the Scalper Helper Trends on multiple timeframes for entries.
Bullet9 strict buy/sell signals from Stochastic RSI
Bomb1 relies on the Fast, Medium and Slow MA's being correctly lined up as well as the Stochastic, this hints at a more imminent move and so the strategy suggests a quicker entry.
Bomb2 relies on the Fast, Medium and Slow MA's NOT being correctly lined up as well as the Stochastic, and therefore has the luxury of suggesting Limit orders near the local high/low.
Bomb3 looks for two or more Stochastics signals in the same direction and then performs a divergence calculation.
Bomb4 looks a change in the Stochastics signals direction and then performs a divergence calculation.
===========================================================================
===========================================================================
Configuration settings:
===========================================================================
===========================================================================
Users can chose to show mainly buy and/or sell signals and can select a level of strictness. Enabling strict rules will force a multi timeframe comparison of Stochastic analysis.
Users can try different levels for long and short targets for profit and stop loss. This is important because the market does not behave the same going up as it does going down.
The RSI conditional check makes the strategy more selective. This discernment can be applied to bullets or bombs in order to validate entry and exits.
During the bull run and perhaps even in ranging markets, the RSI overbought levels is usually 70-80, but in the bear market we are seeing in Crypto now, a value of 60 is more useful. Try for yourself to see what works for you and feedback in the comments.
An additional indicator, Scalper Helper Trends is recommended to get a quick view on the trend condition (rally, base, down) by viewing the MACD from multiple time frames. Further research is required to know which larger timeframes work best here.
For the 15min chart, 15m, 30m, 45m, 60m, 120m, 240m, 360m, 960m would work well. Note it is not possible to go higher than 1000 at this time.
Whether you use the Scalper Helper trends or not for your own visual confirmation, it is possible to allow this indicator to attempt to read it for you. More research is required to best model the reading of this. For now, it will simply measure the gradient of the number of up versus down colors.
The system can also find entries off the Scalper Helper Trends - but really this, by design is not the best use of Scalper Helper Trends. Although you may prove me wrong so the option is given for you to find buy/sells with your own testing.
Users can chose to use some engulfing candle arrangements to trigger exits and define the length of the 200MA and decide if this should play a part in the filtering of the signals. Similarly, a check can be made to ensure that the first two candles after a signal are behaving as we would expect with the "Wait for 2 closing in the direction of the signal" option. This has a lot of value on the 1min chart.
When Revenge trade is set to true you may re-enter a trade in the same direction as the last one when the last one was stopped out, otherwise you would only be looking for trades in the other direction. We all should not revenge trade, and indeed I have only seen a few cases when it has increased the profitability, however this option remains for now.
The flip opens a new trade in the reverse direction when a signal is given to close a trade, but does not apply to scenarios where stop losses or take profit closed the trade.

Hi-Lo Channel StrategyHaven't seen a strategy quite like it. Buy when Heikin Ashi candle closes above a moving average that is sourced on highs - Sell when Heikin Ashi candle closes above a moving average that is sourced on lows. Moving average length should be between 5 and 20 ideally.
NOTE: the Heikin Ashi close values are calculated when the box is checkmarked. You do not need to view the chart with Heikin Ashi candles enabled on the chart. The buy and sell points of the strategy do not change whether or not you are viewing Heikin Ashi candles on the chart as long as the Heikin Ashi setting is enabled.

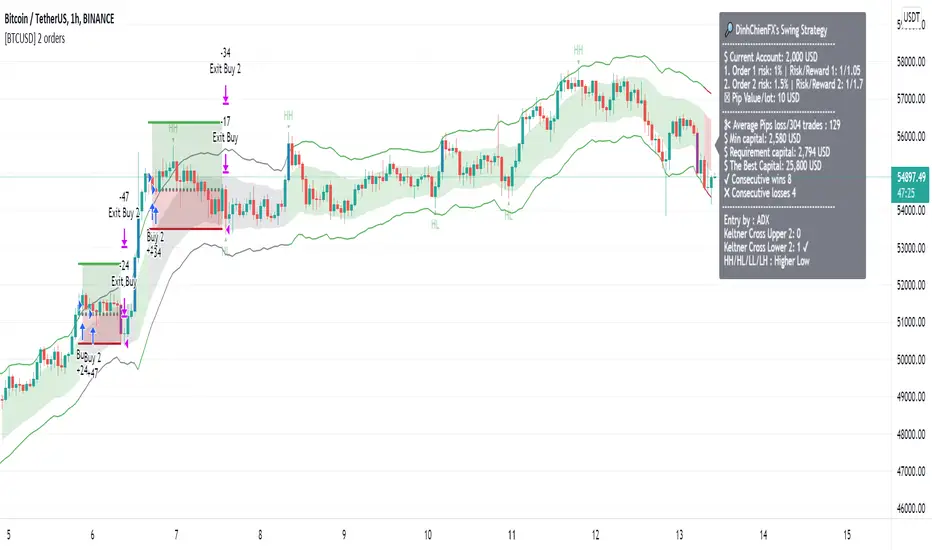
[BTCUSD] DinhChienFX [2 orders]* Historical statistics from 2018:
* Strategy will enter 2 orders, Order 2 will appear only when there is Order 1:
- Percent profitable of 1st order: 64.76%.
- Percent profitable of 2nd order: 49.86%.
- Average percent profitable: 57.31%.
- 14 consecutive wins.
- 4 consecutive losses.
Order 1: risk / reward ratio 1/1 used to determine if this rule is effective or not?
Order 2: Appears when there is order 1, Use take-profit and take-loss level of order 1 at Fibonacci 75%.
. * 1st Order conditions:
- Buy: When the ADX index cuts up to 45, check earlier if the closing price has cut up and is above the Upper 2 line, enter the Buy order.
- Sell: when the ADX indicator cuts up to 45, check before that if the closing price has cut down and is above Lower 2 then enter a Sell order.
* How to enter Order 2: When order 1 appears, there are always Stoploss and Takeprofit levels. Draw Fibonacci from take-profit and take-loss prices, Fibonacci retracement level = 75%
----------------
1. Trend identification:
- Channel Keltner:
... Uptrend: when the closing candlestick cuts up and is above the Keltner channel, the Upper Line 2
... Down trend: when the candle closes and falls above the Keltner Line Lower 2
2. Rules of entry:
- Channel Keltner:
... Buy: Candlestick closing price cuts up and above the Keltner Upper 2.
... Sell: The closing price of the candle cuts down and is lower than the Keltner Below 2.
ADX indicator:
... Buy: The ADX value crossed to 45 and the close of the candle was higher than Keltner Upper 2.
... Sell: ADX value cuts to 45 and the close of the candle is lower than Keltner Below 2.
3. Stoploss and Profit = atr (20) * 2.
NIKI MSS BANKNIFTYThis is the strategy version of my old indicator NIKI BANKIFTY. It is more suitable for day trading with a 5 min chart. It is more profitable in BANKNIFTY future. It is based on multiple Supertrend, moving average, Donchain channel, and linear regression. The background color indicates the main trend and the color of the candle represents a short-term trend. The label with TA and SL represents more profitable entry positions. The label RE: LE and RE: SE stands for re-entry positions or signals with less accuracy. Consider the direction of the linear regression line to take trades on re-entry positions. The yellow candle indicates the entry and the blue candle represents the target or stop-loss.
The backtest results are based on BANKNIFTY last year's data. It has an initial capital of 100000 and the size of the lot is 1. The target is 0.3% and stop-loss is 1.5%. It exactly not following the stop loss, the trade will exit based on the Donchain channel breakout. It appears on the chart as a blue candle. The commission paid is 20 cash per trade and the slippage is 5 ticks per trade. Some of the Indian broker's commission is only 10 cash per trade. Adjust the commission as per your broker. Trades are conducted based on the intraday time in India set from 9.20 am to 2.25 pm. All positions will get square off at 3.00 pm. It will execute a maximum of 4 trades per day. All other parameters are suitable for Robo trading with Indian stock brokers.
Contact us using the link given below to obtain access to this indicator.

London Breakout/Session GBP/USD Forex DaytradeThis is a forex strategy suited for day traders, specialized in the london breakout session
The key elements for this strategy are the specific london time session, together with an exit time(before asian trade/at the end of new york session).
At the same time, as logic elements we only use price action inside like :
For long we have 3 ascending candles, and for short we have 3 descending candles.
For exit we have both TP/SL based on price percentage movement, or we exit if we reach the end of the day.
If you have any questions message me in private !

CRYPTO HA Strategy money maker long termToday I bring you another amazing strategy.
Its made of 2 EMA in this case 50 and 100.
At the same time, internaly for candles we calculate the candles using the HA system ( while still using in live the normal candles). This way we can assure that even if we use HA candles, we avoid repainting, and its legit.
We first calculate the HA candles based on the EMA 50 values, and after that , we use that candle properties to apply to EMA 100.
Once we have that, for entries we have the next conditions :
sell = o2 > c2 and o2 < c2 and time_cond
buy = o2 < c2 and o2 > c2 and time_cond
For sell : Our open from HA 100 is bigger than Close from ha 100, and the previous open is smaller than previous close
For long : Our open from ha 100 is smaller than close from ha 100 and the previous open is bigger than previous close.
Then we have 2 options :
If we wnat to go only long , which is my prefered version ,or the original one where we go both long and short.
I found that the best results are in general around bigger timeframes, 1h+ , 3h works the best so far on my tests.
For exit we have 2 versions :
1 lets say we had a long signal, as soon as we have a short signal we close the trade. Viceversa for short.
2. Is based on price % movement. In this case I use 7.5% price movement of asset.
We have no TP in use for this system.
For the purpose of this test I use 10.000 $ account. For test I use 100% of it, without any leverage.
I use the SL based on price movement , which is a very risky tool, since it can fluctuate even at 20-30% of our capital.
For comission I used 0.1% for each deal, and a slippage of 5 points.
Be cautious with this system !
If you have any questions , message me.

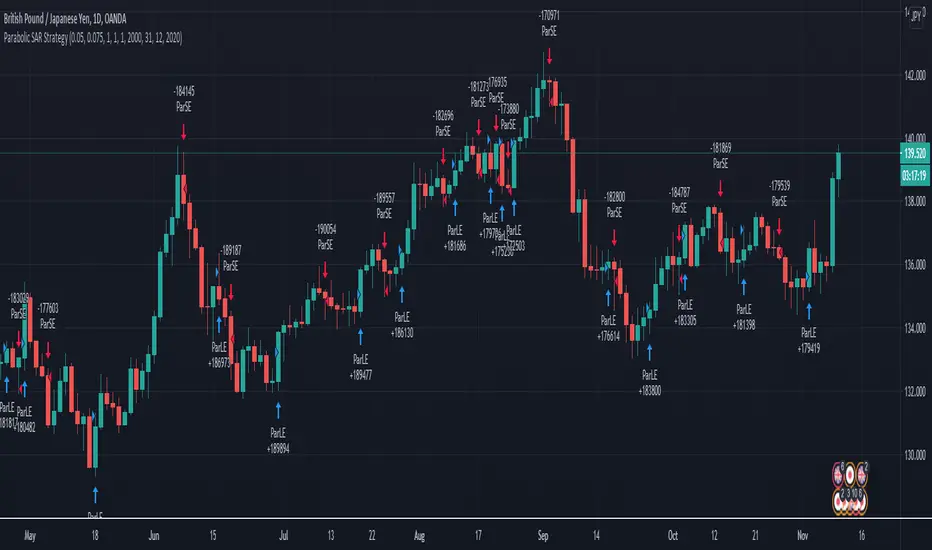
Parabolic SAR Swing strategy GBP JPY Daily timeframeToday I bring you a new strategy thats made of parabolic sar. It has optmized values for GBPJPY Daily timeframe chart.
It also has a time period selection, in order to see how it behave between selected years.
The strategy behind it is simple :
We have an uptrend , (the psar is below our candles) we go long. We exit when our candle crosses the psar value.
The same applies for downtrend(the psar is above our candles), where we go short. We exit when our candle cross the psar value.
Among the basic indicators, it looks like PSAR is one of the best canditates for swing trading.
If you have any questions, please let me know.
2HLA very simple, almost naive strategy, in which you buy on the lowest of the two previous candles and sell at the highest of the two previous candles. You can configure these highest and lowest lenght, in some assets two is too small of a number to make profit. You can also configure to exit the position after X, and I found that 7 (which is a week of working days) is a good number for that.
This is strategy is intended to be used as a swing trade. Your capital needs to be high enough so that it can pay the operaitonal costs, and reach it's target with a reasonable profit.
Since this is a volatility based strategy, assets that are more liquid won't work properly.

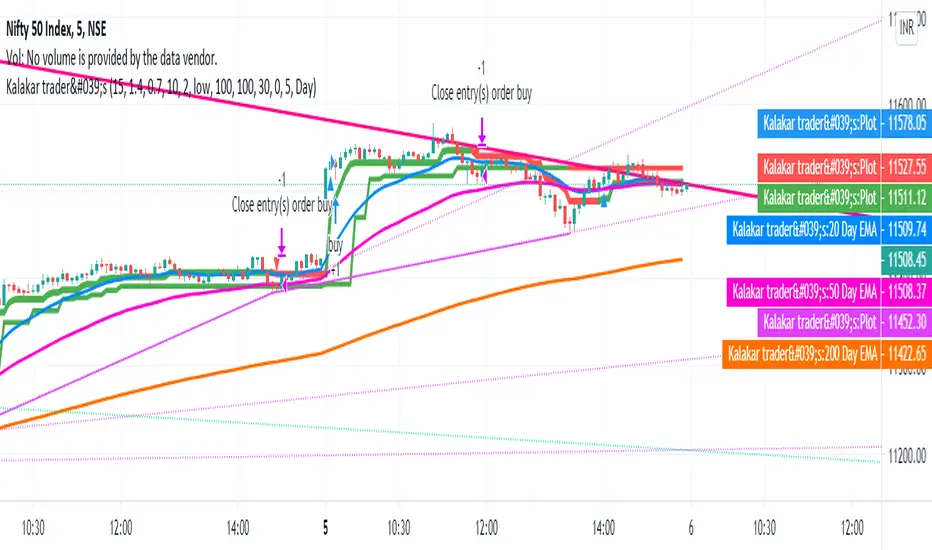
auto trend lines with buy sell signalKalakar trader's Tools is the tool where Buy and sell signals generates automatically according to the candles behavior.
It automatically made trend line
It as build in moving average also
It uses WD Gann Levels to calculate entry point with the help of VWAP .
Pivot points determines the recent support and resistance levels.
Trading rule for this indicator
This indicator is designed for Indian equity stocks
Best performance is expected on 10 minutes chart basic user can use 5 minutes chart for stock value less than 500 rupees, else 15 minutes chart
Plotted line shows the market sentiment, green for buy, red for sell and black for neutral market.
Order thumb rule
For buy signals there is a up triangle in green color
For sell signal there is a down triangle in red color
1. avoid any trade signal before 9:35 AM Indian time
2. signal and related stop loss candle must be formed in the same day
3. if order placed in 5 minutes chart then don't go for a target of 15 minutes chart
4. if order placed in 15 minutes time frame and target is too far then check the target in 5 minutes time frame
5. if signal candle touches the target then avoid the signal.
6. Money management is most important for this indicator.
7. Take trade only if it satisfy risk reward ratio.
8. It has long target but need patience.
Signal
using vwap calculates gann square of 9 levels and if any smart money activity on that level then checks the confirmation of the trend by higherhigh or lowerlow formation
Buy Entry : entry price should be on the high of the candle before signal for buy and sl on bottom of flagged candle just before signal
SellEntry : entry price should be on the low of the candle before signal for sell and sl on top of flagged candle just before signal
Please add some extra value to the Stop Loss for safe trading
Warning : Don't place any order without stop loss, This tool is made for educational and learning purpose only, take any trade at your own risk.
Cyatophilum Levels [BACKTEST]Cyatophilum Levels - Version 1.0 - Backtest
This indicator allows you to build your own strategy based on Fibonacci levels, and see the backtest results in the Strategy Tester.
The Fibonacci levels are printed automatically in real time and without repainting on the chart.
You configure your own strategy in the indicator parameters. You can choose to go long or to go short, or both, on which Fib levels to enter Long/Short, and on which Fib levels to exit (up to 2 entry levels and exit levels).
Detailed Guide:
This is a guide that can be useful if you do not understand the strategy or an indicator parameter. Instructions on how to get access are at the bottom.
To configure your strategy, you need to open the indicator settings. You can either right-click on the indicator and click "settings", or click the settings button near the indicator's name.
You should know that the Fibonnaci levels are calculated from the support and resistance levels, which are calculated using the last swing high and swing low. This behavior can be tweaked in the settings with the first 2 parameters:
· Noise reduction
Dropdown menu. Options are "NONE", "SMALL", "MEDIUM", "HUGE". Used to get a smoother level behavior. The higher it is, the less often the support and resistance levels will move. Can be useful to cut off fakeouts.
· Swings lookback
This is the number of historical bars used to calculate the last swing high and swing low.
In TradingView, we usually wait bar close to validate a signal (trade entry or exit), in order to avoid repainting. But since this indicator is purely based on price action, there is an option called Alert Type if you want to receive intra-bar alerts or not.
· Entry Alert Type
2 options : "Once Per Bar Close", "Once Per Bar". These correspond to the alerts options. You must use the same alert type in the indicator settings and in the alert options. When using "Once Per Bar", the candle high and low are used for the cross conditions, otherwise, candle close is used.
· Exit Alert Type
Same but for exit alerts.
The long trades setup can be configured independantly from the short trade setup, but the parameters are the same.
■ Go Long/Short
Check this box to enable/disable long/short trades.
· Long/Short Entry Condition
Dropdown menu from which you can pick the condition for your entry. Options available are "Cross Over","Cross Under" and "Just Cross".
· Long/Short Entry 1
Dropdown menu from which you can pick the level for your entry n°1. Options available are "Support","FIB 23", "FIB 38", "FIB 50","FIB 61","FIB 78" and "Resistance".
· Long/Short Entry 2
Additional FIB level entry.
· Long/Short Exit 1
Dropdown menu from which you can pick the level for your exit. Options available are "Support","FIB 23", "FIB 38", "FIB 50","FIB 61","FIB 78" and "Resistance".
· Long/Short Exit 2
Additional FIB level exit.
■ Trend Filter
Optionnal Tilson T3 TrendLine to make the strategy go long only when price is above T3 (green) and short only when price is below (red). The length in bars is configurable.
· Backtest period
The day of the start and end period of the backtest can be configured, as long as it is included in the available chart data which is around 20 000 candles. For example a 3 minutes chart data is around 41 days. (20000x3/60/24 = 41.3)
· Limit orders
By default the strategy tester uses market orders. With this option you can simulate limit orders with a limit price.
· Configuration Panel
It should appear on the left of the chart. This panel displays the whole indicator settings in a compact and easy-to-read way. You can replicate a strategy from just this info panel. Can be turned off if needed.
· Graphic options
A red/green background corresponding to the strategy position (short/long) can be turned off.
The Fib levels labels can be turned off all at once.
Backtesting Guide:
To open the backtest parameters, open the indicator settings and go to the "properties" tab.
The commission is set by to 0.1 % by default. You can change it to suit your exchange's fees.
Futures, Forex:
- The Order Size must be set to "contracts", or else you will get "no data".
Stocks, CFD, Cryptocurrency, Index:
- Both "% equity" and "contracts" can be used as Order Size.
Note: the net profit percentage is related to the initial capital set in the backtest properties.
Risk management
Place your secondary exit one or two levels above/below your entry to act as a stop loss.
Backtest Settings:
· Initial Capital: 10 000 $
· Order Size: 5 000 contracts
· Commission : 0.1€ per order (total commission paid: 20.00 €)
Oldest trade: 2019-10-01
Backtest Period: From 2019-10-01 to 2020-07-14
Default settings set for 15m.
Use the link below to obtain access to this indicator

positive percent(Lirshah)positive percent strategy is written based on percentage of positive candles.
so the buy signals trigger when the percentage reach an extreme and the similar scenario for sell signals.
the strategy has best results on 5 sec and 30 sec time frame and specially on indices SPX500, US30, DE30 and ...
the parameters are as below:
numbers of candles
take profit pips
stop loss pips.
the below overview is results of 1 contract on US30 index with 2$ commissions per order.
in order to access scripts contact me directly.

Twin Range Filter Algo@Colinmck used two different ranges to generate signals. Read his release notes to find out what the original script does.
I added one condition which seems to increase performance on 15m BTCUSD as well as 1h BTCUSD and that is ATR with 32 periods being smaller than ATR with 64 periods. I used my script Volatility Optimiser to discover this tendency.
Both buying and selling conditions are same as in @Colinmck's script plus one condition of my own. You can disable my condition.
Target and stop-loss are manually set values in ticks.
Time stop-loss is manually set value in a number of candles. After this number of candles, a position always exits (or should 😇). You can disable it by inserting a very long period. I do not recommend it, because a value of indicator should not be measured in luck and if market starts moving in the direction after 40 periods, the predictive capability of an indicator is questionable.
I used 300/150/17 for 15m BTCUSD chart and 900/30/17 for 1h BTCUSD. I didn't try to optimize any other parameters for these periods.
Since this script relies mostly on volatility for its prediction, I wouldn't recommend using it on its own. Individual approach to the market is recommended. Also, it didn't work on EURUSD when using the same default values and different order management (tp, sl, time sl), so it is probably not as versatile.
Let me know what do you think of this strategy. If you have some ideas about how to make it more reliable, share it in the comments, I might put it to the test. Good luck 🍀

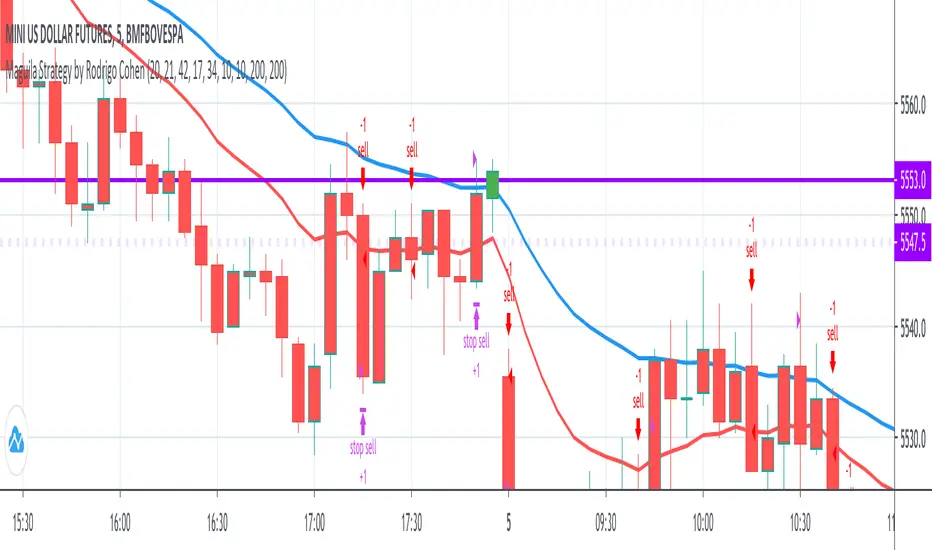
Maguila Strategy by Rodrigo CohenREAD BEFORE USE!!!
!!!ALERT!!!! THIS CODE ONLY WORKS WITH WDO AND WIN , BOTH WITH TIMEFRAMES 1 MINUTE AND 5 MINUTE.
This is a test to the Maguila strategy created by Rodrigo Cohen.
This code MUST be validaded by Rodrigo Cohen, use ONLY for tests.
Some results are different from Cohen's videos, so the McGuinley indicator needs some ajustments.
FUTURES: WIN , WDO
TIME FRAME: 1 Minute (also works in 5 minutes)
INDICATORS: McGinley Dynamic accompanied by the Exponential Moving Average coloring rule of 21 and 42 periods
MARKET TYPE: In trend (up or down)
INPUT:
1. When buying (long) = Market in an upward trend, the average of 21 crosses that of 42 upwards. When the price returns to the average of 21, wait for a positive candle in the Maguila's color and buy a break from the maximum of this signal candle.
2. On sale (short) = Downtrend market, the average of 21 crosses that of 42 downwards. When the price returns to the average of 21, wait for a negative candle in the Maguila's color and sell when the minimum of this signal candle breaks.
GAIN and LOSS are technical.
DEFAULT VALUES:
Averages:
- 1 minute - EMA 21 and EMA 42
- 5 minute - EMA 17 and EMA 34
Gains and Loss:
- WDO - 10 points
- WIN - 200 points
Cyato Grid Basic Buy & Sell [BACKTEST]Private indicator
This Grid bot strategy creates buy orders when the price goes down one level or more, and sell order when the price goes up one level or more.
To avoid useless trades, the lastest traded level is disabled until another level is crossed.
To create the grid, one upper level and one lower level is calculated. Those 2 levels are either given by the user using "MANUAL" mode or automatically calculated by an AI. The space between these two levels are then divided equally into several steps, creating the grid. The number of steps is chosen by the user, from 3 to 20.
HOW IT WORKS
This is the Backtest version meaning this is the one you should use with the Strategy Tester (more below).
Select either "MANUAL" or "AI" mode.
When using "MANUAL", you have to configure an upper level and a lower level.
When using "AI", the upper and lower level are automatically calculated from last 7 days high/low plus a 3% deviation. You can configure the timeframe and the deviation.
Select the grid quantity, from 3 to 20.
Example with 3:
Example with 10:
Example with 20:
You can choose between "Once Per Bar Close" or "Once Per Bar" alert type.
"Once Per Bar Close" will wait candle close to confirm a trade.
"Once Per Bar" will trigger a trade if the price crossed a step anytime inside a candle. Note that the backtest will still use bar close price in its calculation.
BACKTESTING
The strategy will buy 1 contract when a BUY signal appears and sell 1 contract when a SELL signal appears.
Here 1 contract = 1 BTC
The strategy can buy up to 20 contracts. Pyramiding is enabled.
The Backtest info panel is here to show how many trades are open in the backtest.
I know very well that a backtest has no value if several trades are left open. That is why I coded a feature to close all open trades at once on the last candle. This feature can be turned on and off.
To get this indicator, use the link in my signature below, thanks!

Scalping with Bill Williams AlligatorScalping strategy based on Bill Williams Alligator technique but calculated with heikin ashi candles.
This strategy has to be applied to standard candles and low time frames (1min to 5min)
Thanks to all pinescripters mentined in the code for their snippets.
It could be improved with stop loss based on ATR etc.
I have also a study with alerts.
Please use comment section for any feedback or contact me if you need support.

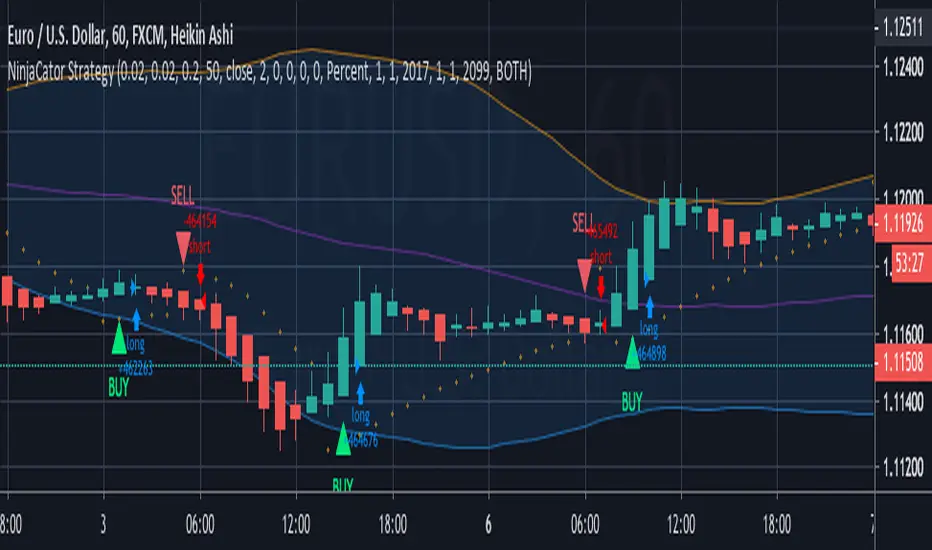
NinjaCator StrategyThis strategy is based on Heiken Ashi Price bars that have flipped on the Parabolic SAR. It is intended for backtesting purposes only and not offered as a trading system. The entry points are based on standard candle price entry values and not those offered by the HA candles.
It will show a BUY/SELL Alert for the First Flat Bottom/Top HK candle that has flipped on the PSAR.
Bollinger Bands have been added to enhance the potential Alerts when the price reaches extremes.
It is designed to provide a visual demonstration that selected indicators have met certain criteria and is NOT meant to be a trading system or offer trading advice. The indicator offers alert possibilities when the above criteria are met.
Noro's CrossLimitStrategy for altcoin/bitcoin currency pairs. Do not use for pairs of type coin/USD with this strategy. You need the taker fee to be zero, or ribate. Because this strategy has very frequent trades.
A simple moving average (SMA) is used to determine the trend.
If not enable Anti-Saw filter
- If candle closing price is higher than SMA - uptrend started
- If candle closing price is lower than SMA - downtrend started
If enable Anti-Saw Filter
- If low candles are higher than SMA - uptrend started
- If high candles are lower than SMA - downtrend started
Only limit orders are created at SMA price and towards the trend.

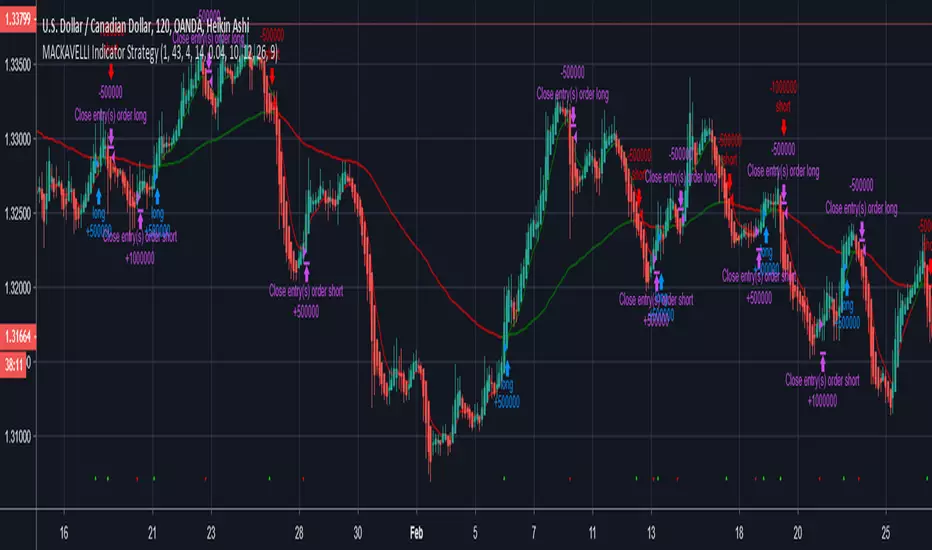
MACKAVELLI Algorithmic StrategyI had a hard time finding a strategy that would work in different time-frames and multiple different currency pairs. This is what I ended up with after countless hours of research and testing. I designed this strategy for auto-algorithmic trading and it uses three different indicators for Long/Short positions and a 4th indicator for exiting positions.
1) A green-light indicator that tells you whether or not you can go long/short.
2) A confirmation indicator that executes the long/short positions.
3) A chop indicator that measures the distance between the two MA's. When they're too close a trade will not be executed, as this usually indicates a chop zone.
4) A third MA is used as an exit indicator.
5) Finally, a loop function is designed to prevent repeat signals. Once a signal is produced on bar close it cannot happen again until that trade is closed or a new position is opened.
Be advised, you need to adjust the settings for each currency pair and time-frame. Once you do that, back-test it and count the last 100 trades to determine accurately your wins/losses. Long entries are the top of the previous bar, shorts are the bottom of the previous bar. This is a more accurate way of counting wins/losses. Tradingview back-test's are not accurate because of where they estimate your long/short entries are, it's very misleading.
Right now I have it setup for 2hr USDCAD with a back-test of 58% win rate on the last 100 trades.
The chop indicator is set to 0.04, I suggest starting there. 0.03 is the lowest I would go. You can go all the way up to 0.1 and higher if needed. You'll start missing big trades though.
The EMA for green-light signal is set to 10, a lower number will give you more entries but less accurate results, bigger number will give less entries with more accuracy but with missed opportunities. 10 is a good starting point.
This strategy is also designed so you can use tight stop losses to prevent large losses. This is because the strategy typically catches trends on the way up/down, minimizing risk for reversal.
I use Heikin Ashi candles for a smoother chart to work with. I have not tested this strategy with normal candles.
DEMO this strategy before using it live and make sure you back-test and tune it before you start. This is written in PINE V3 SO IT WILL NOT REPAINT.
MA cross strategyThis strategy uses simple moving average cross for entry signals, but it can be customized with 3 cases:
1- exit at take profit and stop loss;
2- exit when distance between close and moving average is above a user defined minimum;
3- use Renko candles to calculate the moving average without changing the graph candles.
The third case is the one with better results, but for non-pro users can be used only with daily time frame.
Look at profit factor and percent of winning trades.
You can test also on your favorite pair, but most important is setting correct brick size.
At request, I could share also a screener with alarms for finding which symbol statisfy entry rules.
Please use comment section for any feedback.
********************************** IMPORTANT*******************************
I have developed an expert advisor for metatrader4 (MT4): results of expert advisor form 2015-01-01 to today are very good with low drawdown and good profit.
********************************************************************************
