Lorentzian Classification - Advanced Trading DashboardLorentzian Classification - Relativistic Market Analysis
A Journey from Theory to Trading Reality
What began as fascination with Einstein's relativity and Lorentzian geometry has evolved into a practical trading tool that bridges theoretical physics and market dynamics. This indicator represents months of wrestling with complex mathematical concepts, debugging intricate algorithms, and transforming abstract theory into actionable trading signals.
The Theoretical Foundation
Lorentzian Distance in Market Space
Traditional Euclidean distance treats all feature differences equally, but markets don't behave uniformly. Lorentzian distance, borrowed from spacetime geometry, provides a more nuanced similarity measure:
d(x,y) = Σ ln(1 + |xi - yi|)
This logarithmic formulation naturally handles:
Scale invariance: Large price moves don't overwhelm small but significant patterns
Outlier robustness: Extreme values are dampened rather than dominating
Non-linear relationships: Captures market behavior better than linear metrics
K-Nearest Neighbors with Relativistic Weighting
The algorithm searches historical market states for patterns similar to current conditions. Each neighbor receives weight inversely proportional to its Lorentzian distance:
w = 1 / (1 + distance)
This creates a "gravitational" effect where closer patterns have stronger influence on predictions.
The Implementation Challenge
Creating meaningful market features required extensive experimentation:
Price Features: Multi-timeframe momentum (1, 2, 3, 5, 8 bar lookbacks) Volume Features: Relative volume analysis against 20-period average
Volatility Features: ATR and Bollinger Band width normalization Momentum Features: RSI deviation from neutral and MACD/price ratio
Each feature undergoes min-max normalization to ensure equal weighting in distance calculations.
The Prediction Mechanism
For each current market state:
Feature Vector Construction: 12-dimensional representation of market conditions
Historical Search: Scan lookback period for similar patterns using Lorentzian distance
Neighbor Selection: Identify K nearest historical matches
Outcome Analysis: Examine what happened N bars after each match
Weighted Prediction: Combine outcomes using distance-based weights
Confidence Calculation: Measure agreement between neighbors
Technical Hurdles Overcome
Array Management: Complex indexing to prevent look-ahead bias
Distance Calculations: Optimizing nested loops for performance
Memory Constraints: Balancing lookback depth with computational limits
Signal Filtering: Preventing clustering of identical signals
Advanced Dashboard System
Main Control Panel
The primary dashboard provides real-time market intelligence:
Signal Status: Current prediction with confidence percentage
Neighbor Analysis: How many historical patterns match current conditions
Market Regime: Trend strength, volatility, and volume analysis
Temporal Context: Real-time updates with timestamp
Performance Analytics
Comprehensive tracking system monitors:
Win Rate: Percentage of successful predictions
Signal Count: Total predictions generated
Streak Analysis: Current winning/losing sequence
Drawdown Monitoring: Maximum equity decline
Sharpe Approximation: Risk-adjusted performance estimate
Risk Assessment Panel
Multi-dimensional risk analysis:
RSI Positioning: Overbought/oversold conditions
ATR Percentage: Current volatility relative to price
Bollinger Position: Price location within volatility bands
MACD Alignment: Momentum confirmation
Confidence Heatmap
Visual representation of prediction reliability:
Historical Confidence: Last 10 periods of prediction certainty
Strength Analysis: Magnitude of prediction values over time
Pattern Recognition: Color-coded confidence levels for quick assessment
Input Parameters Deep Dive
Core Algorithm Settings
K Nearest Neighbors (1-20): More neighbors create smoother but less responsive signals. Optimal range 5-8 for most markets.
Historical Lookback (50-500): Deeper history improves pattern recognition but reduces adaptability. 100-200 bars optimal for most timeframes.
Feature Window (5-30): Longer windows capture more context but reduce sensitivity. Match to your trading timeframe.
Feature Selection
Price Changes: Essential for momentum and reversal detection Volume Profile: Critical for institutional activity recognition Volatility Measures: Key for regime change detection Momentum Indicators: Vital for trend confirmation
Signal Generation
Prediction Horizon (1-20): How far ahead to predict. Shorter horizons for scalping, longer for swing trading.
Signal Threshold (0.5-0.9): Confidence required for signal generation. Higher values reduce false signals but may miss opportunities.
Smoothing (1-10): EMA applied to raw predictions. More smoothing reduces noise but increases lag.
Visual Design Philosophy
Color Themes
Professional: Corporate blue/red for institutional environments Neon: Cyberpunk cyan/magenta for modern aesthetics
Matrix: Green/red hacker-inspired palette Classic: Traditional trading colors
Information Hierarchy
The dashboard system prioritizes information by importance:
Primary Signals: Largest, most prominent display
Confidence Metrics: Secondary but clearly visible
Supporting Data: Detailed but unobtrusive
Historical Context: Available but not distracting
Trading Applications
Signal Interpretation
Long Signals: Prediction > threshold with high confidence
Look for volume confirmation
- Check trend alignment
- Verify support levels
Short Signals: Prediction < -threshold with high confidence
Confirm with resistance levels
- Check for distribution patterns
- Verify momentum divergence
- Market Regime Adaptation
Trending Markets: Higher confidence in directional signals
Ranging Markets: Focus on reversal signals at extremes
Volatile Markets: Require higher confidence thresholds
Low Volume: Reduce position sizes, increase caution
Risk Management Integration
Confidence-Based Sizing: Larger positions for higher confidence signals
Regime-Aware Stops: Wider stops in volatile regimes
Multi-Timeframe Confirmation: Align signals across timeframes
Volume Confirmation: Require volume support for major signals
Originality and Innovation
This indicator represents genuine innovation in several areas:
Mathematical Approach
First application of Lorentzian geometry to market pattern recognition. Unlike Euclidean-based systems, this naturally handles market non-linearities.
Feature Engineering
Sophisticated multi-dimensional feature space combining price, volume, volatility, and momentum in normalized form.
Visualization System
Professional-grade dashboard system providing comprehensive market intelligence in intuitive format.
Performance Tracking
Real-time performance analytics typically found only in institutional trading systems.
Development Journey
Creating this indicator involved overcoming numerous technical challenges:
Mathematical Complexity: Translating theoretical concepts into practical code
Performance Optimization: Balancing accuracy with computational efficiency
User Interface Design: Making complex data accessible and actionable
Signal Quality: Filtering noise while maintaining responsiveness
The result is a tool that brings institutional-grade analytics to individual traders while maintaining the theoretical rigor of its mathematical foundation.
Best Practices
- Parameter Optimization
- Start with default settings and adjust based on:
Market Characteristics: Volatile vs. stable
Trading Timeframe: Scalping vs. swing trading
Risk Tolerance: Conservative vs. aggressive
Signal Confirmation
Never trade on Lorentzian signals alone:
Price Action: Confirm with support/resistance
Volume: Verify with volume analysis
Multiple Timeframes: Check higher timeframe alignment
Market Context: Consider overall market conditions
Risk Management
Position Sizing: Scale with confidence levels
Stop Losses: Adapt to market volatility
Profit Targets: Based on historical performance
Maximum Risk: Never exceed 2-3% per trade
Disclaimer
This indicator is for educational and research purposes only. It does not constitute financial advice or guarantee profitable trading results. The Lorentzian classification system reveals market patterns but cannot predict future price movements with certainty. Always use proper risk management, conduct your own analysis, and never risk more than you can afford to lose.
Market dynamics are inherently uncertain, and past performance does not guarantee future results. This tool should be used as part of a comprehensive trading strategy, not as a standalone solution.
Bringing the elegance of relativistic geometry to market analysis through sophisticated pattern recognition and intuitive visualization.
Thank you for sharing the idea. You're more than a follower, you're a leader!
@vasanthgautham1221
Trade with precision. Trade with insight.
— Dskyz , for DAFE Trading Systems
ابحث في النصوص البرمجية عن "change"

Adaptable Relative Momentum Index [ParadoxAlgo]The Adaptable Relative Momentum Index (RMI) by ParadoxAlgo is an advanced momentum-based indicator that builds upon the well-known RSI (Relative Strength Index) concept by introducing a customizable momentum length. This indicator measures price momentum over a specified number of periods and applies a Rolling Moving Average (RMA) to both the positive and negative price changes. The result is a versatile tool that can help traders gauge the strength of a trend, pinpoint overbought/oversold levels, and potentially identify breakout opportunities.
⸻
Smart Configuration Feature
What sets this version of the RMI apart is ParadoxAlgo’s exclusive “Smart Configuration” functionality. Instead of manually adjusting parameters, traders can simply select their Asset Class (e.g., Stocks, Forex, Futures/Indices, Crypto, Commodities) and Trading Style (e.g., Scalping, Day Trading, Swing Trading, Short-Term Investing, Long-Term Investing). Based on these selections, the indicator automatically optimizes its core parameters:
• Length – The period over which the price changes are smoothed.
• Momentum Length – The number of bars used to calculate the price change.
By automating this process, users save time on tedious trial-and-error adjustments, ensuring that the RMI’s settings are tailored to the characteristics of specific markets and personal trading horizons.
⸻
Key Features & Benefits
1. Momentum-Based Insights
• Uses RMA to smooth price movements, helping identify shifts in market momentum more clearly than a basic RSI.
• Enhanced adaptability for a wide range of asset classes and time horizons.
2. Simple Yet Powerful Configuration
• Smart Configuration automatically sets optimal parameter values for each combination of asset class and trading style.
• Eliminates guesswork and manual recalibration when switching between markets or timeframes.
3. Overbought & Oversold Visualization
• Integrated highlight zones mark potential overbought and oversold extremes (default at 80 and 20).
• Optional breakout highlighting draws attention to times when the indicator crosses these key thresholds, helping spot possible entry or exit signals.
4. Intuitive Design & Ease of Use
• Clean plotting and color-coded signal lines make it easy to interpret bullish or bearish shifts in momentum.
• Straightforward dropdown menus keep the interface user-friendly, even for novice traders.
⸻
Practical Applications
• Early Trend Detection: Spot emerging trends when the RMI transitions from oversold to higher levels or vice versa.
• Breakout Confirmation: Confirm potential breakout trades by tracking overbought/oversold breakouts alongside other technical signals.
• Support/Resistance Confluence: Combine RMI signals with horizontal support/resistance levels to reinforce trade decisions.
• Trade Timing: Quickly gauge when momentum could be shifting, helping you time entries and exits more effectively.
⸻
Disclaimer
As with any technical indicator, the Adaptable Relative Momentum Index should be used as part of a broader trading strategy that includes risk management, fundamental analysis, and other forms of technical confirmation. Past performance does not guarantee future results.
⸻
Enjoy using the Adaptable RMI and experience a more streamlined, flexible approach to momentum analysis. Feel free to explore different asset classes and trading styles to discover which configurations resonate best with your unique trading preferences.

Moving Average Convergence DivergenceThis script is written in Pine Script (version 6) for TradingView and implements the **Moving Average Convergence Divergence (MACD)** indicator. The MACD is a popular momentum oscillator used to identify trend direction, strength, and potential reversals. This version includes customizable inputs, visual enhancements (like crossover markers), and alerts for key events. Below is a detailed explanation of the script:
---
### **1. Purpose**
- The script calculates and displays the MACD line, signal line, and histogram.
- It highlights key events such as MACD/signal line crossovers and zero-line crosses with shapes and colors.
- It provides alerts for changes in the histogram's direction (rising to falling or vice versa).
---
### **2. User Inputs**
- **Fast Length**: Period for the fast moving average (default: 12).
- **Slow Length**: Period for the slow moving average (default: 26).
- **Source**: Data input for calculation (default: closing price, `close`).
- **Signal Smoothing**: Period for the signal line (default: 9, range: 1–50).
- **Oscillator MA Type**: Type of moving average for MACD calculation (options: SMA or EMA, default: EMA).
- **Signal Line MA Type**: Type of moving average for the signal line (options: SMA or EMA, default: EMA).
---
### **3. MACD Calculation**
The MACD is calculated in three parts:
1. **MACD Line**: Difference between the fast and slow moving averages.
- Fast MA: Either SMA or EMA of the source over `fast_length`.
- Slow MA: Either SMA or EMA of the source over `slow_length`.
- Formula: `macd = fast_ma - slow_ma`.
2. **Signal Line**: A moving average (SMA or EMA) of the MACD line over `signal_length`.
- Formula: `signal = sma_signal == "SMA" ? ta.sma(macd, signal_length) : ta.ema(macd, signal_length)`.
3. **Histogram**: Difference between the MACD line and the signal line.
- Formula: `hist = macd - signal`.
---
### **4. Key Events Detection**
#### **MACD/Signal Line Crossovers**
- **Bullish Cross**: MACD crosses above the signal line (`ta.crossover(macd, signal)`).
- **Bearish Cross**: MACD crosses below the signal line (`ta.crossunder(macd, signal)`).
#### **Zero Line Crosses**
- **Cross Above Zero**: MACD crosses above 0 (`ta.crossover(macd, 0)`).
- **Cross Below Zero**: MACD crosses below 0 (`ta.crossunder(macd, 0)`).
---
### **5. Colors**
- **MACD Line**: Green (#089981) if MACD > signal (bullish), red (#f23645) if MACD < signal (bearish).
- **Signal Line**: White (`color.white`).
- **Histogram**:
- Positive (MACD > signal): Light green (#B2DFDB) if decreasing, darker green (#26A69A) if increasing.
- Negative (MACD < signal): Light red (#FFCDD2) if increasing in magnitude, darker red (#FF5252) if decreasing in magnitude.
- **Zero Line**: Gray with 50% transparency (`color.new(#787B86, 50)`).
---
### **6. Visual Outputs**
#### **Plotted Lines**
- **MACD Line**: Plotted with dynamic coloring based on its position relative to the signal line.
- **Signal Line**: Plotted in white.
- **Histogram**: Displayed as columns, with colors indicating direction and momentum.
- **Zero Line**: Horizontal line at 0 for reference.
#### **Shapes for Key Events**
- **Bullish Cross Below Zero**: Green circle on the MACD line when MACD crosses above the signal line while still below zero.
- **Bearish Cross Above Zero**: Red circle on the MACD line when MACD crosses below the signal line while still above zero.
- **Cross Above Zero**: Green upward label at the zero line when MACD crosses above 0.
- **Cross Below Zero**: Red downward label at the zero line when MACD crosses below 0.
---
### **7. Alerts**
- **Rising to Falling**: Triggers when the histogram switches from positive (or zero) to negative.
- Condition: `hist >= 0 and hist < 0`.
- Message: "MACD histogram switched from rising to falling".
- **Falling to Rising**: Triggers when the histogram switches from negative (or zero) to positive.
- Condition: `hist <= 0 and hist > 0`.
- Message: "MACD histogram switched from falling to rising".
---
### **8. How It Works**
1. **Trend Direction**:
- MACD above signal line (green) suggests bullish momentum.
- MACD below signal line (red) suggests bearish momentum.
2. **Momentum Strength**:
- Histogram height shows the strength of the momentum (larger bars = stronger momentum).
- Histogram color changes indicate whether momentum is increasing or decreasing.
3. **Reversal Signals**:
- Crossovers between MACD and signal lines often signal potential trend changes.
- Zero-line crosses indicate shifts between bullish (above 0) and bearish (below 0) territory.
---
### **9. How to Use**
1. Add the script to TradingView.
2. Adjust inputs (e.g., fast/slow lengths, MA types) to suit your trading style.
3. Monitor the chart:
- Green MACD and upward histogram bars suggest bullish conditions.
- Red MACD and downward histogram bars suggest bearish conditions.
- Watch for circles (crossovers) and labels (zero-line crosses) for trade signals.
4. Set up alerts to notify you of histogram direction changes.
---
### **10. Key Features**
- **Customization**: Flexible MA types and periods.
- **Visual Clarity**: Dynamic colors and shapes highlight key events.
- **Alerts**: Notifies users of momentum shifts via histogram changes.
- **Intuitive**: Combines all MACD components (line, signal, histogram) in one indicator.
This script is ideal for traders who rely on MACD for momentum analysis and want clear visual cues and alerts for decision-making.

Panic Drop Stock Market Bull/Bear Market Panic Drop Bull/Bear
What It Does:
This indicator identifies bull and bear markets for the S&P 500 (or any stock/index) using the 50-period and 150-period Simple Moving Averages (SMAs). A green background signals a confirmed bull market when the 50 SMA is above the 150 SMA and the 150 SMA slope is flat or upward. A red background signals a confirmed bear market when the 50 SMA is below the 150 SMA and the 150 SMA slope is downward. The background color persists until a new confirmed state is detected, ensuring no gaps—perfect for spotting long-term market trends whether you’re a beginner, trend trader, or long-term investor.
Key Features:
Plots 50 SMA (default: blue line) and 150 SMA (default: orange line).
Background highlights: green for bull markets, red for bear markets.
Persistent background color—no gaps during unconfirmed periods.
Alerts for confirmed bull and bear market transitions.
Fully adjustable: MA periods, slope lookback, and more.
How to Use It:
Add to your S&P 500 chart (e.g., SPX or SPY) on a daily or weekly timeframe (daily default recommended for long-term trends).
Watch for background color changes:
Green background: Confirmed bull market—consider long positions or holding.
Red background: Confirmed bear market—consider shorting or exiting longs.
Customize via settings:
Adjust MA periods (default: 50 and 150).
Set slope lookback (default: 5 bars) to control slope sensitivity.
Change MA colors if desired.
Set alerts: Right-click on the chart > "Add Alert" > Select "Bull Market Confirmed" or "Bear Market Confirmed."
Trade smart: Use the background to confirm market regimes—e.g., go long during green (bull) phases above key support levels, or protect capital during red (bear) phases.
Why It’s Great:
Beginners: Simple background colors make market trends easy to spot.
Trend Traders: 50/150 SMA crossover with slope confirmation catches major market shifts.
Long-Term Investors: Persistent background ensures you stay in the trend without noise.
Created by Timothy Assi (Panic Drop), eToro’s elite investor. Test it, tweak it, and trade with confidence!

Uptrick: Alpha TrendIntroduction
Uptrick: Alpha Trend is a comprehensive technical analysis indicator designed to provide traders with detailed insights into market trends, momentum, and risk metrics. It adapts to various trading styles—from quick scalps to longer-term positions—by dynamically adjusting its calculations and visual elements. By combining multiple smoothing techniques, advanced color schemes, and customizable data tables, the indicator offers a holistic view of market behavior.
Originality
The Alpha Trend indicator distinguishes itself by blending established technical concepts with innovative adaptations. It employs three different smoothing techniques tailored to specific trading modes (Scalp, Swing, and Position), and it dynamically adjusts its parameters to match the chosen mode. The indicator also offers a wide range of color palettes and multiple on-screen tables that display key metrics. This unique combination of features, along with its ability to adapt in real time, sets it apart as a versatile tool for both novice and experienced traders.
Features
1. Multi-Mode Trend Line
The indicator automatically selects a smoothing method based on the trading mode:
- Scalp Mode uses the Hull Moving Average (HMA) for rapid responsiveness.
- Swing Mode employs the Exponential Moving Average (EMA) for balanced reactivity.
- Position Mode applies the Weighted Moving Average (WMA) for smoother, long-term trends.
Each method is chosen to best capture the price action dynamics appropriate to the trader’s timeframe.
2. Adaptive Momentum Thresholds
It tracks bullish and bearish momentum with counters that increment as the trend confirms directional movement. When these counters exceed a user-defined threshold, the indicator generates optional buy or sell signals. This approach helps filter out minor fluctuations and highlights significant market moves.
3. Gradient Fills
Two types of fills enhance visual clarity:
- Standard Gradient Fill displays ATR-based zones above and below the trend line, indicating potential bullish and bearish areas.
- Fading Gradient Fill creates a smooth transition between the trend line and the price, visually emphasizing the distance between them.
4. Bar Coloring and Signal Markers
The indicator can color-code bars based on market conditions—bullish, bearish, or neutral—allowing for immediate visual assessment. Additionally, signal markers such as buy and sell arrows are plotted when momentum thresholds are breached.
5. Comprehensive Data Tables
Uptrick: Alpha Trend offers several optional tables for detailed analysis:
- Insider Info: Displays key metrics like the current trend value, bullish/bearish momentum counts, and ATR.
- Indicator Metrics: Lists input settings such as trend length, damping, signal threshold, and net momentum.
- Market Analysis: Summarizes overall trend direction, trend strength, Sortino ratio, return, and volatility.
- Price & Trend Dynamics: Details price deviation from the trend, trend slope, and ATR ratio.
- Momentum & Volatility Insights: Presents RSI, standard deviation (volatility), and net momentum.
- Performance & Acceleration Metrics: Focuses on the Sortino ratio, trend acceleration, return, and trend strength.
Each table can be positioned flexibly on the chart, allowing traders to customize the layout according to their needs.
Why It Combines Specific Smoothing Techniques
Smoothing techniques are essential for filtering out market noise and revealing underlying trends. The indicator combines three smoothing methods for the following reasons:
- The Hull Moving Average (HMA) in Scalp Mode minimizes lag and responds quickly to price changes, which is critical for short-term trading.
- The Exponential Moving Average (EMA) in Swing Mode gives more weight to recent data, striking a balance between speed and smoothness. This makes it suitable for mid-term trend analysis.
- The Weighted Moving Average (WMA) in Position Mode smooths out short-term fluctuations, offering a clear view of longer-term trends and reducing the impact of transient market volatility.
By using these specific methods in their respective trading modes, the indicator ensures that the trend line is appropriately responsive for the intended time frame, enhancing decision-making while maintaining clarity.
Inputs
1. Trend Length (Default: 30)
Defines the lookback period for the smoothing calculation. A shorter trend length results in a more responsive line, while a longer length produces a smoother, less volatile trend.
2. Trend Damping (Default: 0.75)
Controls the degree of smoothing applied to the trend line. Lower values lead to a smoother curve, whereas higher values increase sensitivity to price fluctuations.
3. Signal Strength Threshold (Default: 5)
Specifies the number of consecutive bullish or bearish bars required to trigger a signal. Higher thresholds reduce the frequency of signals, focusing on stronger moves.
4. Enable Bar Coloring (Default: True)
Toggles whether each price bar is colored to indicate bullish, bearish, or neutral conditions.
5. Enable Signals (Default: True)
When enabled, this option plots buy or sell arrows on the chart once the momentum thresholds are met.
6. Enable Standard Gradient Fill (Default: False)
Activates ATR-based gradient fills around the trend line to visualize potential support and resistance zones.
7. Enable Fading Gradient Fill (Default: True)
Draws a gradual color transition between the trend line and the current price, emphasizing their divergence.
8. Trading Mode (Options: Scalp, Swing, Position)
Determines which smoothing method and ATR period to use, adapting the indicator’s behavior to short-term, medium-term, or long-term trading.
9. Table Position Inputs
Allows users to select from nine possible chart positions (top, middle, bottom; left, center, right) for each data table.
10. Show Table Booleans
Separate toggles control the display of each table (Insider Info, Indicator Metrics, Market Analysis, and the three Deep Tables), enabling a customized view of the data.
Color Schemes
(Default) - The colors in the preview image of the indicator.
(Emerald)
(Sapphire)
(Golden Blaze)
(Mystic)
(Monochrome)
(Pastel)
(Vibrant)
(Earth)
(Neon)
Calculations
1. Trend Line Methods
- Scalp Mode: Utilizes the Hull Moving Average (HMA), which computes two weighted moving averages (one at half the length and one at full length), subtracts them, and then applies a final weighted average based on the square root of the length. This method minimizes lag and increases responsiveness.
- Swing Mode: Uses the Exponential Moving Average (EMA), which assigns greater weight to recent prices, thus balancing quick reaction with smoothness.
- Position Mode: Applies the Weighted Moving Average (WMA) to focus on longer-term trends by emphasizing the entire lookback period and reducing the impact of short-term volatility.
2. Momentum Tracking
The indicator maintains separate counters for bullish and bearish momentum. These counters increase as the trend confirms directional movement and reset when the trend reverses. When a counter exceeds the defined signal strength threshold, a corresponding signal (buy or sell) is triggered.
3. Volatility and ATR Zones
The Average True Range (ATR) is calculated using a period that adapts to the selected trading mode (shorter for Scalp, longer for Position). The ATR value is then used to define upper and lower zones around the trend line, highlighting the current level of market volatility.
4. Return and Trend Acceleration
- Return is calculated as the difference between the current and previous closing prices, providing a simple measure of price change.
- Trend Acceleration is derived from the change in the trend line’s movement (its first derivative) compared to the previous bar. This metric indicates whether the trend is gaining or losing momentum.
5. Sortino Ratio and Standard Deviation
- The Sortino Ratio measures risk-adjusted performance by comparing returns to downside volatility (only considering negative price changes).
- Standard Deviation is computed over the lookback period to assess the extent of price fluctuations, offering insights into market stability.
Usage
This indicator is suitable for various time frames and market instruments. Traders can enable or disable specific visual elements such as gradient fills, bar coloring, and signal markers based on their preference. For a minimalist approach, one might choose to display only the primary trend line. For a deeper analysis, enabling multiple tables can provide extensive data on momentum, volatility, trend dynamics, and risk metrics.
Important Note on Risk
Trading involves inherent risk, and no indicator can eliminate the uncertainty of the markets. Past performance is not indicative of future results. It is essential to use proper risk management, test any new tool thoroughly, and consult multiple sources or professional advice before making trading decisions.
Conclusion
Uptrick: Alpha Trend unifies a diverse set of calculations, adaptive smoothing techniques, and customizable visual elements into one powerful tool. By combining the Hull, Exponential, and Weighted Moving Averages, the indicator is able to provide a trend line that is both responsive and smooth, depending on the trading mode. Its advanced color schemes, gradient fills, and detailed data tables deliver a comprehensive analysis of market trends, momentum, and risk. Whether you are a short-term trader or a long-term investor, this indicator aims to clarify price action and assist you in making more informed trading decisions.

Whale Supertrend (V1.2)The script "Whale Supertrend (V1.2)" is an advanced trend indicator that uses multiple Supertrends with different factors to determine entry and exit points in the market. The Supertrend is a popular indicator that combines price and volatility to help identify trend direction. The script displays buy and sell signals based on the confluence of Supertrends.
How the script works
Configuring Supertrends
The script configures six Supertrends with different factors (factor, factor1, factor2, factor3, factor4, factor5) while using the same ATR period (atrPeriod = 10).
Supertrend 1: factor = 3
Supertrend 2: factor1 = 4
Supertrend 3: factor2 = 6
Supertrend 4: factor3 = 9
Supertrend 5: factor4 = 13
Supertrend 6: factor5 = 18
For each Supertrend, the bullish (blue) and bearish (purple) trend conditions are plotted on the chart.
Signal Calculation
The script calculates the number of Supertrends in bullish and bearish trend:
bullishCount: Number of Supertrends indicating a bullish trend.
bearishCount: Number of Supertrends indicating a bearish trend.
Signal Detection
The script triggers a buy or sell signal when at least three of the six Supertrends indicate the same trend:
Buy Signal (buySignal): Triggers when bullishCount is greater than or equal to 3.
Sell Signal (sellSignal): Triggers when bearishCount is greater than or equal to 3.
To avoid repetition, signals are only displayed when the state changes:
triggerBuy: Buy signal only when buySignal becomes true for the first time.
triggerSell: Sell signal only when sellSignal becomes true for the first time.
Candle Coloring:
Candles now change color based on signals:
Green: When a Buy Signal is active.
Red: When a Sell Signal is active.
This provides a clearer visualization of market trends directly on the chart.
Dynamic Settings for Supertrends:
You can customize the ATR Period and Factor for each of the 6 Supertrends via the settings panel.
Each Supertrend has independent parameters:
ATR Period: Controls the ATR calculation period.
Factor: Adjusts the Supertrend sensitivity.
Benefits:
Enhanced Readability: Candle colors help identify buy and sell zones at a glance.
Greater Customization: Tailor Supertrend settings to your trading strategy or market conditions.

Uptrick: FRAMA Matrix RSIUptrick: FRAMA Matrix RSI
Introduction
The Uptrick: FRAMA Matrix RSI is a momentum-based indicator that integrates the Relative Strength Index (RSI) with the Fractal Adaptive Moving Average (FRAMA). By applying FRAMA's adaptive smoothing to RSI—and further refining it with a Zero-Lag Moving Average (ZLMA)—this script creates a refined and reliable momentum oscillator. The indicator now includes enhanced divergence detection, potential reversal signals, customizable buy/sell signal options, an internal stats table, and a fully customizable bar coloring system for an enhanced visual trading experience.
Why Combine RSI with FRAMA
Traditional RSI is a well-known momentum indicator but has several limitations. It is highly sensitive to price fluctuations, often generating false signals in choppy or volatile markets. FRAMA, in contrast, adapts dynamically to price changes by adjusting its smoothing factor based on market conditions.
By integrating FRAMA into RSI calculations, this indicator reduces noise while preserving RSI's ability to track momentum, adapts to volatility by reducing lag in trending markets and smoothing out choppiness in ranging conditions, enhances trend-following capability for more reliable momentum shifts, and refines overbought and oversold signals by adjusting to the current market structure.
With the new enhancements, such as a manual alpha input, noise filtering, divergence detection, and multiple buy/sell signal options, the indicator offers even greater flexibility and precision for traders. This combination improves the standard RSI by making it more adaptive and responsive to market changes.
Originality
This indicator is unique because it applies FRAMA's adaptive smoothing technique to RSI, creating a dynamic momentum oscillator that adjusts to different market conditions. Many traditional RSI-based indicators either use fixed smoothing methods like exponential moving averages or employ basic RSI calculations without adjusting for volatility.
This script stands out by integrating several elements, including the fractal dimension-based smoothing of FRAMA to reduce noise while retaining responsiveness, the use of Zero-Lag Moving Average smoothing to enhance trend sensitivity and reduce lag, divergence detection to highlight mismatches between price action and RSI momentum, a noise filter and manual alpha option to prevent minor fluctuations from generating false signals, customizable buy/sell signal options that let traders choose between ZLMA-based or FRAMA RSI-based signals, an internal stats table displaying real-time FRAMA calculations such as fractal dimension and the adaptive alpha factor, and a fully customizable bar coloring system to visually distinguish bullish, bearish, and neutral conditions.
Features
Adaptive FRAMA RSI
The indicator applies FRAMA to RSI values, making the momentum oscillator adaptive to volatility while filtering out noise. Unlike a traditional RSI that reacts equally to all price movements, FRAMA RSI adjusts its smoothing factor based on market structure, making it more effective for identifying true momentum shifts.
Zero-Lag Moving Average (ZLMA)
A smoothing technique that minimizes lag while preserving the responsiveness of price movements. It is applied to the FRAMA RSI to further refine signals and ensure smoother trend detection.
Bullish and Bearish Threshold Crossovers
This system compares FRAMA RSI to a user-defined threshold (default is 50). When FRAMA RSI moves above the threshold, it indicates bullish momentum, while movement below signals bearish conditions. The enhanced noise filter ensures that only significant moves trigger signals.
Noise Filter and Manual Alpha
A new noise filter input prevents tiny fluctuations from triggering false signals. In addition, a manual alpha option allows traders to override the automatically computed smoothing factor with a custom value, providing extra control over the indicator’s sensitivity.
Divergence Detection
The indicator identifies divergence patterns by comparing FRAMA RSI pivots to price action. Bullish divergence occurs when price makes a lower low while FRAMA RSI makes a higher low, and bearish divergence occurs when price makes a higher high while FRAMA RSI makes a lower high. These signals can help traders anticipate potential reversals.
Reversal Signals
Labels appear on the chart when FRAMA RSI confirms classic RSI overbought (70) or oversold (30) conditions, providing visual cues for potential trend reversals.
Buy and Sell Signal Options
Traders can now choose between two signal-generation methods. ZLMA-based signals trigger when the ZLMA of FRAMA RSI crosses key overbought (70) or oversold (30) levels, while FRAMA RSI-based signals trigger when FRAMA RSI itself crosses these levels. This added flexibility allows users to tailor the indicator to their preferred trading style.
ZLMA:
FRAMA:
Customizable Alerts
Alerts notify traders when FRAMA RSI crosses key levels, divergence signals occur, reversal conditions are met, or buy/sell signals trigger. This ensures that important trading events are not missed.
Fully Customizable Bar Coloring System
Users can color bars based on different conditions, enhancing visual clarity. Bar coloring modes include: FRAMA RSI threshold (bars change color based on whether FRAMA RSI is above or below the threshold), ZLMA crossover (bars change when ZLMA crosses overbought or oversold levels), buy/sell signals (bars change when official signals trigger), divergence (bars highlight when bullish or bearish divergence is detected), and reversals (bars indicate when RSI reaches overbought or oversold conditions confirmed by FRAMA RSI). The system also remembers the last applied bar color, ensuring a smooth visual transition.
Input Parameters and Features
Core Inputs
RSI Length (default: 14) defines the period for RSI calculations.
FRAMA Lookback (default: 16) determines the length for the FRAMA smoothing function.
RSI Bull Threshold (default: 50) sets the level above which the market is considered bullish and below which it is bearish.
Noise Filter (default: 1.0) ensures that small fluctuations do not trigger false bullish or bearish signals.
Additional Features
Show Bull and Bear Alerts (default: true) enables notifications when FRAMA RSI crosses the threshold.
Enable Divergence Detection (default: false) highlights bullish and bearish divergences based on price and FRAMA RSI pivots.
Show Potential Reversal Signals (default: false) identifies overbought (70) and oversold (30) levels as possible trend reversal points.
Buy and Sell Signal Option (default: ZLMA) allows traders to choose between ZLMA-based signals or FRAMA RSI-based signals for trade entry.
ZLMA Enhancements
ZLMA Length (default: 14) determines the period for the Zero-Lag Moving Average applied to FRAMA RSI.
Visualization Options
Show Internal Stats Table (default: false) displays real-time FRAMA calculations, including fractal dimension and the adaptive alpha smoothing factor.
Show Threshold FRAMA Signals (default: false) plots buy and sell labels when FRAMA RSI crosses the threshold level.
How It Works
FRAMA Calculation
FRAMA dynamically adjusts smoothing based on the price fractal dimension. The alpha smoothing factor is derived from the fractal dimension or can be set manually to maintain responsiveness.
RSI with FRAMA Smoothing
RSI is calculated using the user-defined lookback period. FRAMA is then applied to the RSI to make it more adaptive to volatility. Optionally, ZLMA is applied to further refine the signals and reduce lag.
Bullish and Bearish Threshold Crosses
A bullish condition occurs when FRAMA RSI crosses above the threshold, while a bearish condition occurs when it falls below. The noise filter ensures that only significant trend shifts generate signals.
Buy and Sell Signal Options
Traders can choose between ZLMA crossovers or FRAMA RSI crossovers as the basis for buy and sell signals, offering flexibility in trade entry timing.
Divergence Detection
The indicator identifies divergences where price action and FRAMA RSI momentum do not align, potentially signaling upcoming reversals.
Reversal Signal Labels
When classic RSI overbought or oversold levels are confirmed by FRAMA RSI conditions, reversal labels are added on the chart to highlight potential exhaustion points.
Bar Coloring System
Bars are dynamically colored based on various conditions such as RSI thresholds, ZLMA crossovers, buy/sell signals, divergence, and reversals, allowing traders to quickly interpret market sentiment.
Alerts and Internal Stats
Customizable alerts notify traders of key events, and an optional internal stats table displays real-time calculations (fractal dimension, alpha value, and RSI values) to help users understand the underlying dynamics of the indicator.
Summary
The Uptrick: FRAMA Matrix RSI offers an enhanced approach to momentum analysis by combining RSI with adaptive FRAMA smoothing and additional layers of signal refinement. The indicator now includes adaptive RSI smoothing to reduce noise and improve responsiveness, Zero-Lag Moving Average filtering to minimize lag, divergence and reversal detection to identify potential turning points, customizable buy/sell signal options that let traders choose between different signal methodologies, a fully customizable bar coloring system to visually distinguish market conditions, and an internal stats table for real-time insight into FRAMA calculation parameters.
Whether used for trend confirmation, divergence detection, or momentum-based strategies, this indicator provides a powerful and adaptive approach to trading.
Disclaimer
This script is for informational and educational purposes only. Trading involves risk, and past performance does not guarantee future results. Always conduct proper research and consult with a financial advisor before making trading decisions.

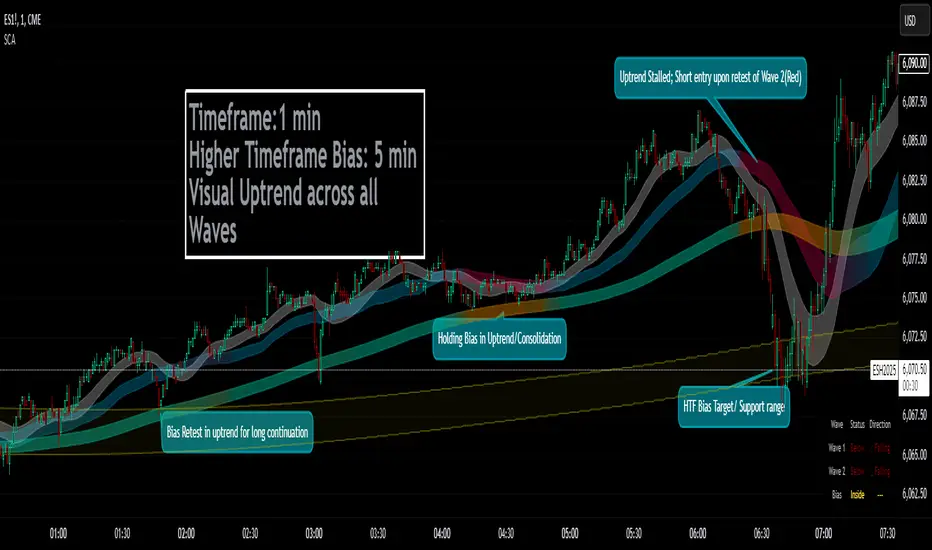
Smoothed Candle Averages- NovaTheMachineThis script utilizes a series of moving averages that the user is able to change as they see fit for their own use.
The averages plotted for the first 2 waves are the High-Low rays of the selected period of time with the chosen moving average style.
The Bias is the Heikin Ashi High-Low ray plotted over the chosen time period, while the Secondary Bias is a higher Timeframe Bias for the same period of time on a selected higher timeframe.
The visuals for each ray are able to be changed to either; lines, solid wave, or dynamic wave.
The Dynamic waves will change color according to the total dissection and utilize the Min-Max range selected as a weight for the strength of the trend. Thus providing an at-a-glance overview of the price relative to trend.
The key objective with this script is to gauge the longer term trend with the current price action, to establish patterns and determine strength of moves both away from and towards the moving average/bias.
When both waves are trending with the Bias, it can be reasoned that there is a strong trend established, when waves and Bias are mixed or trending sideways it can be reasoned there is a range forming or potential for a direction change. When price has broken the waves and biases we can reasonably assume that a new trend has been formed, using the waves and biases again to determine the strength and length of the trend.
The Table will display whether the current price is above or below each wave, and whether the price is continuing or retracing. The Signals plotted are used to help identify when price has broken a wave more swiftly.
Dynamic Market Structure DetectorTitle: Dynamic Market Structure Detector – Real-Time BoS & ChoCH Signals
Short Description:
Identify market structure dynamically with real-time Break of Structure (BoS) and Change of Character (ChoCH) signals. Highlight untested support and resistance zones to improve trading precision.
Full Description:
The Dynamic Market Structure Detector is a powerful TradingView indicator designed for traders who want to automate the identification of key market structure levels. This indicator simplifies market analysis by dynamically tracking swing highs and lows, marking critical Break of Structure (BoS) and Change of Character (ChoCH) points, and highlighting untested support and resistance zones.
Key Features:
1. Real-Time Signals:
• Marks Break of Structure (BoS) and Change of Character (ChoCH) points as they occur.
• Automatically updates as the market evolves.
2. Dynamic Swing Highs and Lows:
• Tracks swing highs and lows based on user-defined sensitivity (Swing Length).
• Adjust swing length to tailor signals for intraday or swing trading.
3. Untested Zones Highlight:
• Visualize untested support and resistance zones dynamically.
• Opacity settings allow customization for better chart readability.
4. Customizable Inputs:
• Swing Length:
Adjust the sensitivity of BoS and ChoCH signals.
• Smaller Swing Length values (e.g., 3–5): Capture short-term market movements, ideal for intraday trading.
• Larger Swing Length values (e.g., 10–20): Focus on significant market structure changes for swing or positional trading.
Experiment with these values to find the best fit for your trading style.
• Untested Zone Opacity:
Control the visibility of highlighted support and resistance zones.
• Lower opacity values (e.g., 10–50): Make the zones more prominent, helpful for darker chart backgrounds.
• Higher opacity values (e.g., 70–90): Provide subtle highlights, better suited for lighter chart setups.
• A value of 100% renders the zones completely transparent (invisible).
Use this setting to customize the visual appearance of your chart while still retaining key zone information.
5. User-Friendly Visualization:
• Color-coded labels for BoS (Green) and ChoCH (Red).
• Highlight zones for untested areas using customizable colors (Support: Blue, Resistance: Orange).
Why Use This Indicator?
• Simplifies market structure analysis by automating key calculations.
• Helps traders identify potential trend reversals and continuation points.
• Reduces the need for manual charting, saving time and effort.
• Provides visual clarity on untested zones for better decision-making.
Recommended Usage:
• Intraday Traders: Use smaller Swing Length values (e.g., 3–5) to capture short-term market movements.
• Swing Traders: Opt for higher Swing Length values (e.g., 10–20) to focus on larger market structure changes.
• Monitor untested zones for potential price reactions, enhancing your trade entries and exits.
Notes :
This indicator is best suited for traders who prefer price action trading and market structure analysis. While the indicator provides reliable insights, it is recommended to use it in conjunction with other analysis tools for a holistic trading approach.
Credits:
Developed by TradeTech Analysis to empower traders with automated tools for smarter trading decisions.

Uptrick: Zero Lag HMA Trend Suite1. Name and Purpose
Uptrick: Zero Lag HMA Trend Suite is a Pine Version 6 script that builds upon the Hull Moving Average (HMA) to offer an advanced trend analysis tool. Its purpose is to help traders identify trend direction, potential reversals, and overall market momentum with reduced lag compared to traditional moving averages. By combining the HMA with Average True Range (ATR) thresholds, slope-dependent coloring, Volume Weighted Average Price (VWAP) ribbons, and optional reversal signals, the script aims to give a detailed view of price activity in various market environments.
2. Overview
This script begins with the calculation of a Hull Moving Average, a method that blends Weighted Moving Averages in a way designed to cut down on lag while still smoothing out price fluctuations. Next, several enhancements are applied. The script compares current HMA values to previous ones for slope-based coloring, which highlights uptrends and downtrends at a glance. It also plots buy and sell signals when price moves beyond or below thresholds determined by the ATR and the user’s chosen signal multiplier. An optional VWAP ribbon can be shown to confirm bullish or bearish conditions relative to a volume-weighted benchmark. Additionally, the script can plot reversal signals (labeled with B) at points where price crosses back toward the HMA from above or below. Taken together, these elements allow traders to visualize both the short-term momentum and the broader context of how price interacts with volatility and overall market direction.
3. Why These Indicators Have Been Linked Together
The reason the Hull Moving Average, the Average True Range, and the VWAP have been integrated into one script is to tackle multiple facets of market analysis in a single tool. The Zero Lag Hull Moving Average provides a responsive trend line, the ATR offers a measure of volatility that helps distinguish significant price shifts from typical fluctuations, and the VWAP acts as a reference for fair value based on traded volume. By layering all three, the script helps traders avoid the need to juggle multiple separate indicators and offers a holistic perspective. The slope-based coloring focuses on trend direction, the ATR-based thresholds refine possible buy and sell zones, and the VWAP ribbons provide insight into how price stands relative to an important volume-weighted level. The inclusion of up and down signals and reversal B labels further refines entries and exits.
4. Why Use Uptrick: Zero Lag HMA Trend Suite
The Hull Moving Average is already known for reacting more quickly to price changes compared to other moving averages while retaining a degree of smoothness. This suite enhances the basic HMA by showing colored gradients that make it easy to spot trend direction changes, highlighting potential entry or exit points based on volatility-driven thresholds, and optionally layering a volume-based measure of bullish or bearish market sentiment. By relying on a zero lag approach and additional data points, the script caters to those wanting a more responsive method of identifying shifts in market dynamics. The added reversal signals and up or down alerts give traders extra confirmation for potential turning points.
5. How This Extension Improves on the Basic HMA
This extension not only plots the Hull Moving Average but also includes data-driven alerts and visual cues that traditional HMA lines do not provide. First, it offers multi-layered slope coloring, making up or down trends quickly apparent. Second, it uses ATR-based thresholds to pinpoint moments when price may be extending beyond normal volatility, thus generating buy or sell signals. Third, the script introduces an optional VWAP ribbon to indicate whether the market is trading above or below this pivotal volume-weighted benchmark, adding a further confirmation step for bullish or bearish conditions. Finally, it incorporates optional reversal signals labeled with B, indicating points where price might swing back toward the main HMA line.
6. Core Components
The script can be broken down into several primary functions and features.
a. Zero Lag HMA Calculation
Uses two Weighted Moving Averages (half-length and full-length) combined through a smoothing step based on the square root of the chosen length. This approach is designed to reduce lag significantly compared to other moving averages.
b. Slope Detection
Compares current and prior HMA values to determine if the trend is up or down. The slope-based coloring changes between turquoise shades for upward movement and magenta shades for downward movement, making trend direction immediately visible.
c. ATR-Based Thresholding for Up and Down Signals
The script calculates an Average True Range over a user-defined period, then multiplies it by a signal factor to form two bands around the HMA. When price crosses below the lower band, an up (buy) signal appears; when it crosses above the upper band, a down (sell) signal is shown.
d. Reversal Signals (B Labels)
Tracks when price transitions back toward the main HMA from an extreme zone. When enabled, these reversal points are labeled with a B and can help traders see potential turning points or mean-reversion setups.
e. VWAP Bands
An optional Volume Weighted Average Price ribbon that plots above or below the HMA, indicating bullish or bearish conditions relative to a volume-weighted price benchmark. This can also act as a kind of support/ resistance.
7. User Inputs
a. HMA Length
Controls how quickly the moving average responds to price changes. Shorter lengths react faster but can lead to more frequent signals, whereas longer lengths produce smoother lines.
b. Source
Specifies the price input, such as close or an alternative source, for the calculation. This can help align the HMA with specific trading strategies.
c. ATR Length and Signal Multiplier
Defines how the script calculates average volatility and sets thresholds for buy or sell alerts. Adjusting these values can help filter out noise or highlight more aggressive signals.
d. Slope Index
Determines how many bars to look back for detecting slope direction, influencing how sensitive the slope coloring is to small fluctuations.
e. Show Buy and Sell Signals, Reversal Signals, and VWAP
Lets users toggle the display of these features. Turning off certain elements can reduce chart clutter if traders prefer a simpler layout.
8. Calculation Process
The script’s calculation follows a step-by-step approach. It first computes two Weighted Moving Averages of the selected price source, one over half the specified length and one over the full length. It then combines these using 2*wma1 minus wma2 to reduce lag, followed by applying another weighted average using the square root of the length. Simultaneously, it computes the ATR for a user-defined period. By multiplying ATR by the signal multiplier, it establishes upper and lower bands around the HMA, where crossovers generate buy (up) or sell (down) signals. The script can also plot reversal signals (B labels) when price crosses back from these bands in the opposite direction. For the optional VWAP feature, Pine Script’s ta.vwap function is used, and differences between the HMA and VWAP levels determine the color and opacity of the ribbon.
9. Signal Generation and Filtering
The ATR-based thresholds reduce the influence of small, inconsequential price swings. When price falls below the lower band, the script issues an up (buy) signal. If price breaks above the upper band, a down (sell) signal appears. These signals are visible through labels placed near the bars. Reversal signals, labeled with B, can be turned on to help detect when price retraces from an extended area back toward the main HMA line. Traders can disable or enable these signals to match their preferred level of chart detail or risk tolerance.
10. Visualization on the Chart
The Zero HMA Lag Trend Suite aims for visual clarity. The HMA line is plotted multiple times with increasing transparency to create a gradient effect. Turquoise gradients indicate upward slopes, and magenta gradients signify downward slopes. Bar coloring can be configured to align with the slope direction, providing quick insight into current momentum. When enabled, buy or sell labels are placed under or above the bars as price crosses the ATR-defined boundaries. If the reversal option is active, B labels appear around areas where price changes direction. The optional VWAP ribbons form background bands, using distinct coloration to signal whether price is above or below the volume-weighted metric.
11. Market Adaptability
Because the script’s parameters (HMA length, ATR length, signal multiplier, and slope index) are user-configurable, it can adapt to a wide range of markets and timeframes. Intraday traders may prefer a shorter HMA length for quick signals, while swing or position traders might use a longer HMA length to filter out short-lived price changes. The source setting can also be adjusted, allowing for specialized data inputs beyond just close or open values.
12. Risk Management Considerations
The script’s signals and labels are based on past price data and volatility readings, and they do not guarantee profitable outcomes. Sharp market reversals or unforeseen fundamental events can produce false signals. Traders should combine this tool with broader risk management strategies, including stop-loss placement, position sizing, and independent market analyses. The Zero HMA Lag Trend Suite can help highlight potential opportunities, but it should not be relied upon as the sole basis for trade decisions.
13. Combining with Other Tools
Many traders choose to verify signals from the Zero HMA Lag Trend Suite using popular indicators like the Relative Strength Index (RSI), Moving Average Convergence Divergence (MACD), or even simple volume-based metrics to confirm whether a price movement has sufficient momentum. Conventional techniques such as support and resistance levels, chart patterns, or candlestick analysis can also supplement signals generated by the script’s up, down, or reversal B labels.
14. Parameter Customization and Examples
a. Short-Term Day Trading
Using a shorter HMA length (for instance, 9 or 14) and a slightly higher ATR multiplier might provide timely buy and sell signals, though it may also produce more whipsaws in choppy markets.
b. Swing or Position Trading
Selecting a longer HMA length (such as 50 or 100) with a moderate ATR multiplier can help users track more significant and sustained market moves, potentially reducing the effect of minor fluctuations.
c. Multiple Timeframe Blends
Some traders load two versions of the indicator on the same chart, one for short-term signals (with frequent B label reversals) and another for the broader trend direction, aligning entry and exit decisions with the bigger picture.
15. Realistic Expectations
Even though the Hull Moving Average helps minimize lag and the script incorporates volatility-based filters and optional VWAP overlays, it cannot predict future market behavior with complete accuracy. Periods of low liquidity or sudden market shocks can still lead to signals that do not reflect longer-term trends. Frequent parameter review and manual confirmation are advised before executing trades based solely on the script’s outputs.
16. Theoretical Background
The Hull Moving Average formula aims to balance smoothness with reactivity, accomplished by combining Weighted Moving Averages at varying lengths. By subtracting a slower average from a faster one and then applying another smoothing step with the square root of the original length, the HMA is designed to respond more promptly to price changes than typical exponential or simple moving averages. The ATR component, introduced by J. Welles Wilder, calculates the average range of price movement over a user-defined period, allowing the script to assess volatility and adapt signals accordingly. VWAP provides a volume-weighted benchmark that many institutional traders track to gauge fair intraday value.
17. Originality and Uniqueness
Although multiple HMA-based indicators can be found, Uptrick: Zero Lag HMA Trend Suite sets itself apart by merging slope-based coloring, ATR thresholds, VWAP ribbons, up or down labels, and optional reversal signals all in one cohesive platform. This synergy aims to reduce chart clutter while still giving traders a comprehensive look at trend direction, volatility, and volume-based sentiment.
18. Summary
Uptrick: Zero Lag HMA Trend Suite is a specialized trading script designed to highlight potential market trends and reversals with minimal delay. It leverages the Hull Moving Average for an adaptive yet smooth price line, pairs ATR-based thresholds for detecting possible breakouts or dips, and provides VWAP-based ribbons for added volume-weighted context. Traders can further refine their entries and exits by enabling up or down signals and reversal labels (B) where price may revert toward the HMA. Suitable for a wide range of timeframes and instrument types, the script encourages a disciplined approach to trade management and risk control.
19. Disclaimer
This script is provided for informational and educational purposes only. Trading and investing involve significant financial risk, and no indicator can guarantee success under all conditions. Users should practice robust risk management, including the placement of stop losses and position sizing, and should confirm signals with additional analysis tools. The developer of this script assumes no liability for any trading decisions or outcomes resulting from its use.

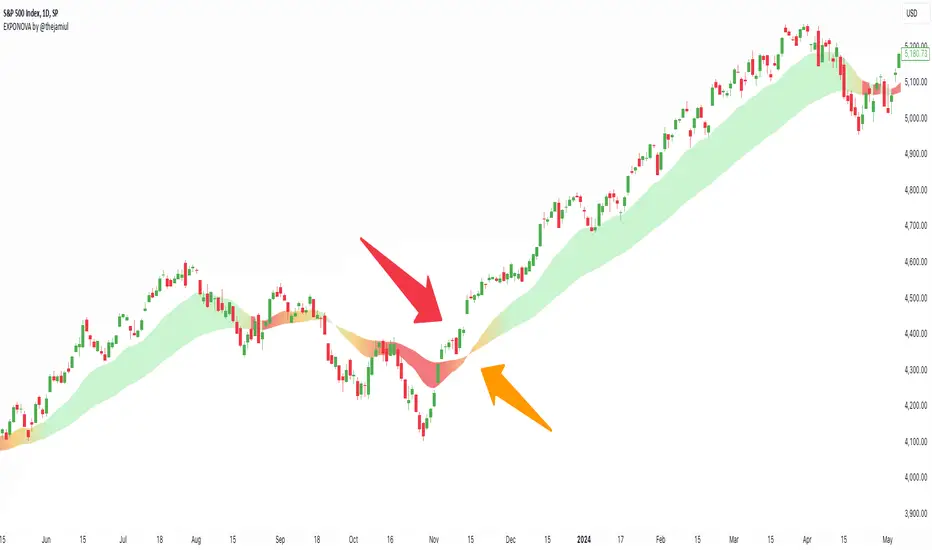
EXPONOVA by @thejamiulEXPONOVA is an advanced EMA-based indicator designed to provide a visually intuitive and actionable representation of market trends. It combines two EMAs (Exponential Moving Averages) with a custom gradient fill to help traders identify trend reversals, strength, and the potential duration of trends.
This indicator uses a gradient color fill between two EMAs—one short-term (20-period) and one longer-term (55-period). The gradient dynamically adjusts based on the proximity and relationship of the closing price to the EMAs, giving traders a unique visual insight into trend momentum and potential exhaustion points.
Key Features:
Dynamic Gradient Fill:
The fill color between the EMAs changes based on the bar's position relative to the longer-term EMA.
A fading gradient visually conveys the strength and duration of the trend. The closer the closing price is to crossing the EMA, the stronger the gradient, making trends easy to spot.
Precision EMA Calculations:
The indicator plots two EMAs (20 and 55) without cluttering the chart, ensuring traders have a clean and informative display.
Ease of Use:
Designed for both novice and advanced traders, this tool is effective in identifying trend reversals and entry/exit points.
Trend Reversal Detection:
Built-in logic identifies bars since the last EMA cross, dynamically adjusting the gradient to signal potential trend changes.
How It Works:
This indicator calculates two EMAs:
EMA 20 (Fast EMA): Tracks short-term price movements, providing early signals of potential trend changes.
EMA 55 (Slow EMA): Captures broader trends and smoothens noise for a clearer directional bias.
The area between the two EMAs is filled with a dynamic color gradient, which evolves based on how far the price has moved above or below EMA 55. The gradient acts as a visual cue to the strength and duration of the current trend:
Bright green shades indicate bullish momentum building over time.
Red tones highlight bearish momentum.
The fading effect in the gradient provides traders with an intuitive representation of trend strength, helping them gauge whether the trend is accelerating, weakening, or reversing.
Gradient-Filled Region: Unique visualization to simplify trend analysis without cluttering the chart.
Dynamic Trend Strength Indication: The gradient dynamically adjusts based on the price's proximity to EMA 55, giving traders insight into momentum changes.
Minimalist Design: The EMAs themselves are not displayed by default to maintain a clean chart while still benefiting from their analysis.
Customizable Lengths: Pre-configured with EMA lengths of 20 and 55, but easily modifiable for different trading styles or instruments.
How to Use This Indicator
Trend Detection: Look at the gradient fill for visual confirmation of trend direction and strength.
Trade Entries:
Enter long positions when the price crosses above EMA 55, with the gradient transitioning to green.
Enter short positions when the price crosses below EMA 55, with the gradient transitioning to red.
Trend Strength Monitoring:
A brighter gradient suggests a sustained and stronger trend.
A fading gradient may indicate weakening momentum and a potential reversal.
Important Notes
This indicator uses a unique method of color visualization to enhance decision-making but does not generate buy or sell signals directly.
Always combine this indicator with other tools or methods for comprehensive analysis.
Past performance is not indicative of future results; please practice risk management while trading.
How to Use:
Trend Following:
Use the gradient fill to identify the trend direction.
A consistently bright gradient indicates a strong trend, while fading colors suggest weakening momentum.
Reversal Signals:
Watch for gradient changes near the EMA crossover points.
These can signal potential trend reversals or consolidation phases.
Confirmation Tool:
Combine EXPONOVA with other indicators or candlestick patterns for enhanced confirmation of trade setups.
Ultra Market StructureThe Ultra Market Structure indicator detects key market structure breaks, such as Break of Structure (BoS) and Change of Character (CHoCH), to help identify trend reversals. It plots lines and labels on the chart to visualize these breakpoints with alerts for important signals.
Introduction
This script is designed to help traders visualize important market structure events, such as trend breaks and reversals, using concepts like Break of Structure (BoS) and Change of Character (CHoCH). The indicator highlights internal and external price levels where the market shifts direction. It offers clear visual signals and alerts to keep traders informed of potential changes in the market trend.
Detailed Description
The indicator focuses on detecting "market structure breaks," which occur when the price moves past significant support or resistance levels, suggesting a potential reversal or continuation of the trend.
.........
Type of structure
Internal Structure: Focuses on smaller, shorter-term price levels within the current market trend.
External Structure: Focuses on larger, longer-term price levels that may indicate more significant shifts in the market.
.....
Key events
Break of Structure (BoS): A market structure break where the price surpasses a previous high (bullish BoS) or low (bearish BoS).
Change of Character (CHoCH): A shift in market behavior when the price fails to continue in the same direction, indicating a possible trend reversal.
Once a break or shift is detected, the script plots lines and labels on the chart to visually mark the breakpoints.
It also provides alerts when a BoS or CHoCH occurs, keeping traders informed in real-time.
The indicator can color the background and candles based on the market structure, making it easy to identify the current trend.
.....
Special feature
At news events or other momentum pushes most structure indicators will go into "sleep mode" because of too far away structure highs/lows. This indicator has a structure reset feature to solve this issue.
.........
Detects Break of Structure (BoS) and Change of Character (CHoCH) signals.
Marks internal and external support/resistance levels where market trends change.
Provides visual cues (lines, labels) and real-time alerts for structure breaks.
Offers background and candle color customization to highlight market direction.

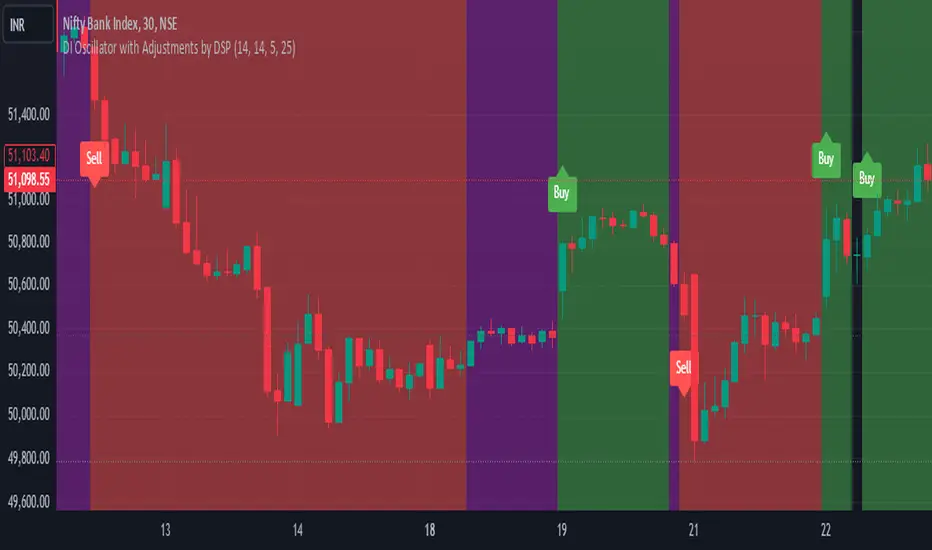
DI Oscillator with Adjustments by DSPDI Oscillator with Adjustments by DSP – High-Volatility Commodity Trading Tool 📈💥
Maximize Your Trading Efficiency in volatile commodity markets with the DI Oscillator with Adjustments by DSP. This unique indicator combines the classic +DI and -DI (Directional Indicators) with advanced adjustments that help you identify key trends and reversals in highly volatile conditions.
Whether you're trading commodities, forex, or stocks, this tool is engineered to help you navigate price fluctuations and make timely, informed decisions. Let this powerful tool guide you through turbulent market conditions with ease!
Key Features:
Dynamic Background Color Shifts 🌈:
Green Background: Signals a strong uptrend where +DI is clearly above -DI, and the trend is supported by clear separation between the two indicators.
Red Background: Signals a strong downtrend where -DI is above +DI, indicating bearish pressure.
Violet Background: Shows a neutral or consolidating market where the +DI and -DI lines are closely interwoven, giving you a clear picture of sideways movement.
Buy and Sell Labels 📊:
Buy Signal: Automatically triggers when the background changes to green, indicating a potential entry point during a bullish trend.
Sell Signal: Automatically triggers when the background shifts from purple to red, indicating a bearish trend reversal.
Labels are positioned away from the bars, ensuring your chart remains uncluttered and easy to read.
Enhanced Adjustments for Volatile Markets ⚡:
Custom adjustments based on consecutive green or red bars (excluding “sandwiched” bars) provide you with more nuanced signals, improving the accuracy of trend detection in volatile conditions.
Horizontal Line Reference 📏:
Set a custom horizontal level to mark significant price levels that may act as resistance or support, helping you identify key price points in volatile market swings.
Separation Threshold 🧮:
A custom separation threshold defines when the +DI and -DI lines are far enough apart to confirm a strong trend. This is crucial for commodity markets that experience rapid price changes and fluctuations.
Visual Clarity ✨:
Both +DI and -DI lines are plotted clearly in green and red, respectively, with a dedicated background color system that makes trend shifts visually intuitive.
Why This Indicator Works for Volatile Commodities 🌍📊:
Commodity markets are notorious for their volatility, with prices often experiencing rapid and unpredictable movements. This indicator gives you clear visual cues about trend strength and reversals, enabling you to act quickly and confidently.
By adjusting the +DI based on consecutive green and red bars, this tool adapts to the specific price action in high-volatility conditions, helping you stay ahead of the curve.
The background color system ensures that you can visually track market trends at a glance, making it easier to make split-second decisions without missing opportunities.
How to Use:
Add the Indicator: Simply add the DI Oscillator with Adjustments by DSP to your TradingView chart.
Watch for Background Color Shifts: Stay alert for the background color to shift from violet to green (for buy) or purple to red (for sell), signaling potential trade opportunities.
Set Alerts: Receive notifications when background color changes, providing you with real-time alerts to keep track of market movements.
Interpret the DI Lines: Use the +DI and -DI lines to gauge trend strength and adjust your strategy accordingly.
Who Can Benefit:
Day Traders: Take advantage of quick trend reversals and high volatility in commodities markets, such as gold, oil, or agricultural products.
Swing Traders: Identify key trend shifts over longer periods, making it easier to enter or exit trades during major price movements.
Risk Managers: Use this tool’s visual cues to better understand price fluctuations and adjust your position sizes according to market conditions.
💡 Unlock Your Potential with the DI Oscillator 💡
For traders in high-volatility commodity markets, this indicator is a game-changer. It simplifies the complexity of trend analysis and gives you the actionable insights you need to make fast, profitable decisions. Whether you're trading gold, oil, or other volatile commodities, the DI Oscillator with Adjustments by DSP can help you navigate market chaos and make better-informed trades.
Don’t miss out — enhance your trading strategy today with this powerful tool and stay ahead in any market environment!
Custom Zig Zag with Absolute Price DifferenceThis Zig-Zag indicator visualizes the price movements of a financial instrument and highlights the relevant turning points (pivots) where the price has undergone a significant change. It uses a deviation threshold to mark only substantial movements and ignore minor fluctuations.
The input parameters allow the user to customize the indicator:
Deviation (%): Defines the minimum percentage deviation required to mark a turning point.
Depth: Specifies how many periods before and after a pivot are considered to determine whether it is a real high or low.
Line Color: Allows the user to change the color of the lines that connect the pivots.
Extend to Last Bar: If enabled, extends the last lines to the current bar.
Display Absolute Price Difference: If enabled, the indicator shows the absolute price difference between the current pivot and the previous one.
Label Size: Allows adjusting the font size of the displayed labels.
The logic of the indicator is based on calculating pivots (highs and lows) using price movements. The indicator then tracks the changes between successive pivots and represents them as lines. When the price shows a significant difference from the last pivot (measured in percentage), a line is drawn, and a label displaying the price difference is shown.
Additionally, the indicator uses the calc_dev function to compute the price deviation between the last pivot and the current price. This provides users with a clear visualization of price changes, helping to identify larger price movements.

RSI and Dev Advanced Volatility IndexEnglish Explanation of the "RSI and Dev Advanced Volatility Index" Pine Script Code
Understanding the Code
Purpose:
This Pine Script code creates a custom indicator that combines the Relative Strength Index (RSI) and Deviation (DEV) to provide insights into market volatility.
Key Components:
* Deviation (DEV): Calculates the difference between the closing price and the 10-period simple moving average. This measures the extent to which the price deviates from its recent average, indicating volatility.
* RSI: The traditional RSI is then applied to the calculated deviations. This helps to smooth the data and identify overbought or oversold conditions in terms of volatility.
Calculation Steps:
* Deviation Calculation: The difference between the closing price and its 10-period simple moving average is calculated.
* RSI Calculation: The RSI is calculated on the deviations, providing a measure of the speed and change of volatility relative to recent volatility changes.
* Plotting:
* The RSI of the deviations is plotted on the chart.
* Horizontal lines are plotted at 50, 0, and 110 to visually represent different volatility zones.
* The area between the lines is filled with color to highlight low and high volatility regions.
Interpretation and Usage
* Volatility Analysis:
* High Volatility: When the RSI is above 50, it indicates high volatility, suggesting the market might be in a consolidation or trend reversal phase.
* Low Volatility: When the RSI is below 50, it indicates low volatility, suggesting a relatively calm market.
* Trading Signals:
* Buy Signal: When the RSI crosses above 50 from below, it might signal increasing volatility, which could be a buying opportunity.
* Sell Signal: When the RSI crosses below 50 from above, it might signal decreasing volatility, which could be a selling opportunity.
* Risk Management:
* By monitoring volatility, traders can better manage their risk. During periods of high volatility, traders might reduce their position size or adopt more conservative strategies.
Advantages
* Comprehensive: Combines RSI and DEV for a more holistic view of volatility.
* Sensitivity: Quickly responds to changes in market volatility.
* Visual Clarity: Color-coded zones provide a clear visual representation of different volatility levels.
Limitations
* Parameter Sensitivity: The indicator's performance is sensitive to parameter changes, such as the lookback period for the moving average.
* Lag: Like most technical indicators, it has some lag and might not capture every market movement.
* Not Predictive: It can only indicate current and past volatility, not future movements.
Summary
This custom indicator offers a valuable tool for analyzing market volatility. By combining RSI and DEV, it provides a more nuanced perspective on price fluctuations. However, it should be used in conjunction with other technical indicators and fundamental analysis for more robust trading decisions.
Key points to remember:
* Higher RSI values indicate higher volatility.
* Lower RSI values indicate lower volatility.
* Crossovers of the RSI line above or below 50 can provide potential trading signals.
* The indicator should be used in conjunction with other analysis tools for a more complete picture of the market.
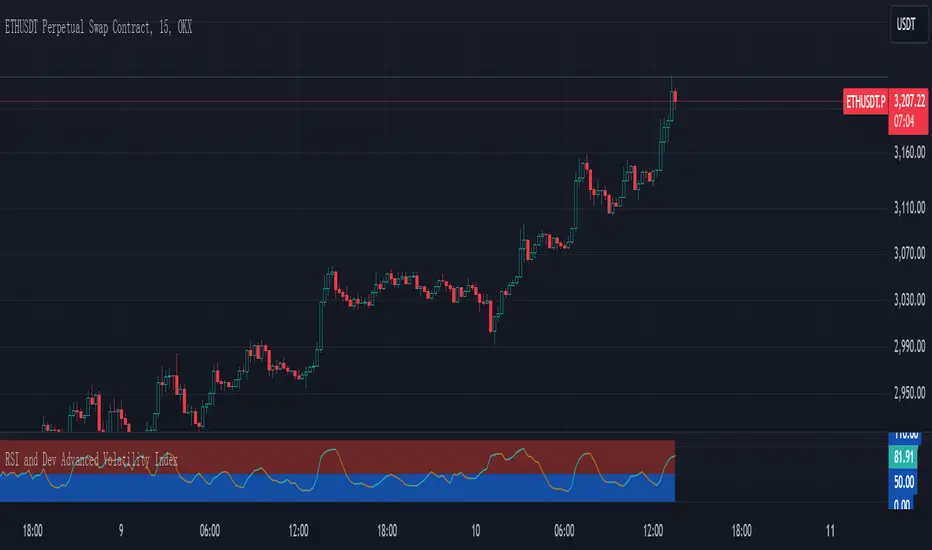
RTI Thresholds Index | mad_tiger_slayerOverview of the Script
The Relative Trend Index (RTI) Threshold Index is a custom indicator for TradingView that enhances a Relative Trend Index (RTI) . The RTI is designed to reflect the market’s trend strength by comparing the current price to dynamically calculated upper and lower trend boundaries. Additionally, the indicator includes overbought and oversold thresholds, and Trend-coded signals to visually represent market conditions for easier analysis. The RTI Threshold Index is created and meant for long term investments targeted for longer swing trades over a few months to years.
How Do Investors Use the RTI Trend Index?
In the provided chart image, the indicator is displayed on a Bitcoin price chart. Here’s what each visual component represents:
INTENDED USES
The RTI Threshold Index is NOT intended for SCALPING.
With the nature of its components and calculations. This indicator will give false signals when the Timeframe is too low. The best intended use for high-quality signals are above the 12hr timeframes (Note: Coded to be used above 1 Day Timeframes)
The RTI Threshold Index is a TREND-FOLLOWING and MEAN REVERTING INDICATOR . With the explanation below of the image you can see both Trend-Following and Mean Reversion Uses.
A VISUAL REPRESENTATION INTENDED USES
Relative Trend Index Line (Green/Red): The main RTI line changes colors based on long or short conditions, providing an immediate visual cue of the trend direction. This conditional state enter long when the RTI is greater than the long threshold and will not enter short until it is less than the short threshold. (vice versa) When the RTI is less than the short threshold and will not enter long until it is greater than the long threshold.
EMA of RTI: A smoothed version of the RTI in yellow for more stable trend analysis. This EMA can be used for LONGER TERM trends. When the smoothed RTI is above 50, investors can assume that the trend will be in a trending state. Because this is slower than the RTI, you will get slower entries and slower exits.
Threshold Lines: Green and red lines for long and short thresholds, along with dashed lines for overbought and oversold levels. These lines can be calibrated to allow the RTI to enter a long trending or short trending state. The lower the value is for Long Threshold line , it will enter a long trend faster. The higher the value for Short Threshold Line , it will exit faster. We can also set Overbought and Oversold Thresholds. With the RTI entering above the Overbought Threshold line, Investors can assume that the environment is getting heated or is overbought. Same for oversold with the RTI entering below the Oversold Threshold line, Investors can assume that the environment is getting heated or is overbought.
Gradient Background: Shaded overbought and oversold areas improve readability by distinguishing these zones. This coloring of the shaded area tells us the oversold and overbought levels.
Colored Candles: Candles change color based on the RTI condition, aligning the price action visually with the trend status. The Green symbolizes a long state while red symbolizes a short state.
__________________________________________________________________________________
The indicator's primary elements include:
Input Parameters: Configurable settings for trend length, sensitivity, moving average (MA) period, thresholds, and overbought/oversold levels.
RTI Calculation: Computation of trend boundaries and the RTI value based on the price's position within these boundaries.
Visual Components: Horizontal threshold lines, plotted RTI values, color-coded candles, and gradient fills for overbought and oversold zones.
1. Input Parameters
The script includes several configurable inputs, allowing users to customize the indicator’s sensitivity and behavior according to market conditions:
Trend Length: Controls the number of data points for trend calculations. Higher values produce a smoother, less responsive trend, while lower values make the trend more sensitive to recent price changes.
Trend Sensitivity: Sets the sensitivity by defining the upper and lower percentiles for the trend boundaries. Higher sensitivity values make the RTI less reactive, while lower values increase responsiveness.
MA length: Defines the period for the Exponential Moving Average (EMA) applied to the RTI, smoothing its output.
longThreshold and shortThreshold: Set the levels for entering long and short positions. The RTI crossing above longThreshold or below shortThreshold signals a long or short condition, respectively.
Overbought and oversold thresholds: When RTI exceeds overbought or falls below oversold, it indicates overbought or oversold market conditions.
2. Relative Trend Index (RTI) Calculation
The RTI is calculated by dynamically setting upper and lower trend boundaries:
Upper Trend and Lower Trend: Calculated by adding and subtracting the standard deviation of the closing price to/from the close, providing a measure of price variation.
upper array and Lower Arrays : Arrays that hold the upper and lower trend values over the specified trend length period.
Sorting and Indexing: After sorting these arrays, the values at specific percentiles (based on trend sensitivity) are selected as UpperTrend and LowerTrend.
RTI formula: The RTI is calculated by normalizing the close price within the range of UpperTrend and LowerTrend. This yields a percentage that reflects the price's relative position within the trend range.
3. Threshold and Signal Lines
Several horizontal lines mark key threshold levels:
midline: A dashed line at 50, marking the RTI midpoint.
overbought and oversold: Dashed lines for the overbought and oversold levels as set by overbought and oversold.
long hline and short hline: Solid lines marking the longThreshold and shortThreshold levels for entering long and short trades. They are colored Green for long threshold and Red for short threshold
4. Long and Short Conditions
The script defines long and short conditions based on the RTI’s position relative to the longThreshold and shortThreshold:
isLong: Set to true when the RTI exceeds longThreshold, signaling a long condition.
isShort: Set to true when the RTI drops below shortThreshold, signaling a short condition. overboughtcandles and oversoldcandles: Boolean variables that indicate when the RTI crosses the overbought or oversold thresholds, enhancing visual feedback.
5. Color Coding
Color-coded elements help to visually indicate the RTI's current state:
rtiColor: Sets the RTI line color based on the long or short condition (green for long, red for short).
obosColor: Colors specific candles in the overbought (yellow) and oversold (purple) regions, adding clarity to these conditions.
6. Plotting and Visualization
The following components display the RTI indicator and its conditions visually:
RTI and EMA Plot: The RTI line is plotted alongside an EMA line for smooth trend observation. The RTI line uses the conditional colors to indicate market conditions.
Background Gradient Fill: Shaded areas between the overbought and oversold levels highlight these zones in the background.
Colored Candles: Candles on the price chart are color-coded based on the RTI condition (green for long, red for short), making it easy to see trend direction changes.
Overbought and Oversold Gradient Fill: Gradient fills are applied to the overbought and oversold regions, creating a visual effect when the RTI reaches extreme levels.
Conclusion
The RTI Threshold Indicator is a powerful tool for assessing trend strength and market conditions. With configurable parameters, it adapts well to various timeframes and market environments, providing investors with a reliable means to identify potential entry and exit points. With configurable parameters, RTI Threshold Indicator can identify market conditions for potential buy and sell zones.

Multi-Timeframe Supertrend Dashboard - EnhancedOverview
The Multi-Timeframe Supertrend Dashboard is a powerful tool designed to give traders a clear view of market trends across multiple timeframes, all from a single dashboard. This indicator leverages the Supertrend method to calculate buy and sell signals based on the direction of price relative to dynamically calculated support and resistance lines. The dashboard is optimized for dark mode and provides easy-to-interpret color-coded signals for each timeframe.
How It Works
The Supertrend indicator is a trend-following indicator that uses the Average True Range (ATR) to set upper and lower bands around the price, adapting dynamically as volatility changes. When the price is above the Supertrend line, the market is considered in an uptrend, triggering a "BUY" signal. Conversely, when the price falls below the Supertrend line, the market is in a downtrend, triggering a "SELL" signal.
This Multi-Timeframe Supertrend Dashboard calculates Supertrend signals for the following timeframes:
1 minute
5 minutes
15 minutes
1 hour
Daily
Weekly
Monthly
For each timeframe, the dashboard shows either a "BUY" or "SELL" signal, allowing traders to assess whether trends align across timeframes. A "BUY" signal displays in green, and a "SELL" signal displays in red, giving a quick visual reference of the overall trend direction for each timeframe.
Customization Options
ATR Period: Defines the period for the Average True Range (ATR) calculation, which determines how responsive the Supertrend lines are to changes in market volatility.
Multiplier: Sets the sensitivity of the Supertrend bands to price movements. Higher values make the bands less sensitive, while lower values increase sensitivity, allowing quicker reactions to changes in price.
How to Interpret the Dashboard
The Multi-Timeframe Supertrend Dashboard allows traders to see at a glance if trends across multiple timeframes are aligned. Here’s how to interpret the signals:
BUY (Green): The current timeframe’s price is in an uptrend based on the Supertrend calculation.
SELL (Red): The current timeframe’s price is in a downtrend based on the Supertrend calculation.
For example:
If all timeframes display "BUY," the asset is in a strong uptrend across multiple time horizons, which may indicate a bullish market.
If all timeframes display "SELL," the asset is likely in a strong downtrend, signaling a bearish market.
Mixed signals across timeframes suggest market consolidation or differing trends across short- and long-term periods.
Use Cases
Trend Confirmation: Use the dashboard to confirm trends across multiple timeframes before entering or exiting a position.
Quick Market Analysis: Get a snapshot of market conditions across timeframes without having to change charts.
Multi-Timeframe Alignment: Identify alignment across timeframes, which is often a strong indicator of market momentum in one direction.
Dark Mode Optimization
The dashboard has been optimized for dark mode, with white text and contrasting background colors to ensure easy readability on darker TradingView themes.

SMA Angle AlertsSMA Angle Alerts
Overview:
The "SMA Angle Alerts" indicator measures the angle of the Simple Moving Average (SMA) over a specified number of bars, helping traders identify when the market is gaining or losing momentum. The indicator provides real-time alerts when the angle of the SMA crosses user-defined thresholds, indicating strong upward or downward movements in the trend.
How it works:
SMA Calculation: The indicator calculates the Simple Moving Average (SMA) of the closing price over a customizable length.
Angle Calculation: It determines the slope of the SMA by measuring the price change over a set number of bars and converts that slope into an angle (in degrees).
Alerts: Alerts are triggered when the SMA angle crosses above or below specified thresholds, allowing traders to react to significant trend changes in real time.
Key Features:
Customizable SMA and Angle Threshold:
The length of the SMA and the threshold for the angle can be customized to fit your trading strategy.
Real-Time Alerts:
Alerts are triggered when the angle of the SMA crosses upward or downward by more than the defined threshold, providing actionable insights into trend strength and direction.
Visual Markers:
The chart visually highlights points where the angle of the SMA exceeds the threshold, with "UP" and "DOWN" labels to mark when the angle is steep enough to signal significant trend changes.
Background Color Alerts:
The chart’s background color changes when the angle exceeds the thresholds—green for upward crosses and red for downward crosses—allowing traders to quickly spot moments of interest.
Plotting the Angle:
The slope of the SMA is plotted in degrees, giving traders a visual representation of the market's momentum. Horizontal lines mark the upper and lower angle thresholds, offering a clear view of when price momentum is accelerating or decelerating.
Use Case:
This indicator is ideal for traders looking to catch strong trend reversals, breakouts, or momentum shifts. It can be used across multiple timeframes to monitor market momentum and identify key moments when the trend is gaining strength in either direction.
Customization:
SMA Length: Adjust the length of the SMA to suit different timeframes or asset classes.
Angle Threshold: Define the angle at which alerts are triggered, allowing you to focus on strong upward or downward movements.
Bars to Check: Customize how many bars are used to calculate the slope and angle of the SMA.
Alerts:
Set alerts to notify you when the SMA is angling up or down by more than your specified threshold, ensuring that you never miss a significant trend shift.

Adaptive EMA with ATR and Standard Deviation [QuantAlgo]Adaptive EMA with ATR and Standard Deviation by QuantAlgo 📈✨
Introducing the Adaptive EMA with ATR and Standard Deviation , a comprehensive trend-following indicator designed to combine the smoothness of an Exponential Moving Average (EMA) with the volatility adjustments of Average True Range (ATR) and Standard Deviation. This synergy allows traders and investors to better identify market trends while accounting for volatility, delivering clearer signals in both trending and volatile market conditions. This indicator is suitable for traders and investors seeking to balance trend detection and volatility management, offering a robust and adaptable approach across various asset classes and timeframes.
💫 Core Concept and Innovation
The Adaptive EMA with ATR and Standard Deviation brings together the trend-smoothing properties of the EMA and the volatility sensitivity of ATR and Standard Deviation. By using the EMA to track price movements over time, the indicator smooths out minor fluctuations while still providing valuable insights into overall market direction. However, market volatility can sometimes distort simple moving averages, so the ATR and Standard Deviation components dynamically adjust the trend signals, offering more nuanced insights into trend strength and reversals. This combination equips traders with a powerful tool to navigate unpredictable markets while minimizing false signals.
📊 Technical Breakdown and Calculations
The Adaptive EMA with ATR and Standard Deviation relies on three key technical components:
1. Exponential Moving Average (EMA): The EMA forms the base of the trend detection. Unlike a Simple Moving Average (SMA), the EMA gives more weight to recent price changes, allowing it to react more quickly to new data. Users can adjust the length of the EMA to make it more or less responsive to price movements.
2. Standard Deviation Bands: These bands are calculated from the standard deviation of the EMA and represent dynamic volatility thresholds. The upper and lower bands expand or contract based on recent price volatility, providing more accurate signals in both calm and volatile markets.
3. ATR-Based Volatility Filter: The Average True Range (ATR) is used to measure market volatility over a user-defined period. It helps refine the trend signals by filtering out false positives caused by minor price swings. The ATR filter ensures that the indicator only signals significant market movements.
⚙️ Step-by-Step Calculation:
1. EMA Calculation: First, the indicator calculates the EMA over a specified period based on the chosen price source (e.g., close, high, low).
2. Standard Deviation Bands: Then, it computes the standard deviation of the EMA and applies a multiplier to create upper and lower bands around the EMA. These bands adjust dynamically with the level of market volatility.
3. ATR Filtering: In addition to the standard deviation bands, the ATR is applied as a secondary filter to help refine the trend signals. This step helps eliminate signals generated by short-term price spikes or corrections, ensuring that the signals are more reliable.
4. Trend Detection: When the price crosses above the upper band, a bullish trend is identified, while a move below the lower band signals a bearish trend. The system accounts for both the standard deviation and ATR bands to generate these signals.
✅ Customizable Inputs and Features
The Adaptive EMA with ATR and Standard Deviation provides a range of customizable options to fit various trading/investing styles:
📈 Trend Settings:
1. Price Source: Choose the price type (e.g., close, high, low) to base the EMA calculation on, influencing how the trend is tracked.
2. EMA Length: Adjust the length to control how quickly the EMA reacts to price changes. A shorter length provides a more responsive EMA, while a longer period smooths out short-term fluctuations.
🌊 Volatility Controls:
1. Standard Deviation Multiplier: This parameter controls the sensitivity of the trend detection by adjusting the distance between the upper and lower bands from the EMA.
2. TR Length and Multiplier: Fine-tune the ATR settings to control how volatility is filtered, adjusting the indicator’s responsiveness during high or low volatility phases.
🎨 Visualization and Alerts:
1. Bar Coloring: Select different colors for uptrends and downtrends, providing a clear visual cue when trends change.
2. Alerts: Set up alerts to notify you when the price crosses the upper or lower bands, signaling a potential long or short trend shift. Alerts can help you stay informed without constant chart monitoring.
📈 Practical Applications
The Adaptive EMA with ATR and Standard Deviation is ideal for traders and investors looking to balance trend-following strategies with volatility management. Key uses include:
Detecting Trend Reversals: The dynamic bands help identify when the market shifts direction, providing clear signals when a trend reversal is likely.
Filtering Market Noise: By applying both Standard Deviation and ATR filtering, the indicator helps reduce false signals during periods of heightened volatility.
Volatility-Based Risk Management: The adaptability of the bands ensures that traders can manage risk more effectively by responding to shifts in volatility while keeping focus on long-term trends.
⭐️ Comprehensive Summary
The Adaptive EMA with ATR and Standard Deviation is a highly customizable indicator that provides traders with clearer signals for trend detection and volatility management. By dynamically adjusting its calculations based on market conditions, it offers a powerful tool for navigating both trending and volatile markets. Whether you're looking to detect early trend reversals or avoid false signals during periods of high volatility, this indicator gives you the flexibility and accuracy to improve your trading and investing strategies.
Note: The Adaptive EMA with ATR and Standard Deviation is designed to enhance your market analysis but should not be relied upon as the sole basis for trading or investing decisions. Always combine it with other analytical tools and practices. No statements or signals from this indicator constitute financial advice. Past performance is not indicative of future results.

Kalman PSaR [BackQuant]Kalman PSaR
Overview and Innovation
The Kalman PSaR combines the well-known Parabolic SAR (PSaR) with the advanced smoothing capabilities of the Kalman Filter . This innovative tool aims to enhance the traditional PSaR by integrating Kalman filtering, which reduces noise and improves trend detection. The Kalman PSaR adapts dynamically to price movements, making it a highly effective indicator for spotting trend shifts while minimizing the impact of false signals caused by market volatility.
Please Find the Basic Kalman Here:
Kalman Filter Dynamics
The Kalman Filter is a powerful algorithm for estimating the true value of a system amidst noisy data. In the Kalman PSaR, this filter is applied to the high, low, and closing prices, resulting in a smoother and more accurate representation of price action. The filter’s parameters—process noise and measurement noise—are customizable, allowing traders to fine-tune the sensitivity of the indicator to market conditions. By reducing the impact of noise, the Kalman-filtered PSaR offers clearer signals for identifying trend reversals and continuations.
Enhanced PSaR Calculation
The traditional Parabolic SAR is a popular trend-following indicator that highlights potential entry and exit points based on price acceleration. In the Kalman PSaR, this calculation is enhanced by the Kalman-filtered prices, providing a smoother and more reliable signal. The indicator continuously updates based on the acceleration factor and max step values, while the Kalman filter ensures that sudden price spikes or market noise do not trigger false signals.
Min Step and Max Step: These settings control the sensitivity of the PSaR. The Min Step sets the initial acceleration factor, while the Max Step limits how fast the PSaR adapts to price changes, helping traders fine-tune the indicator’s responsiveness.
Optional Smoothing Techniques To further enhance the signal clarity, the Kalman PSaR includes an optional smoothing feature. Traders can choose from various smoothing methods, such as SMA, Hull, EMA, WMA, TEMA, and more, to reduce short-term fluctuations and emphasize the underlying trend. The smoothing period is customizable, allowing traders to adjust the indicator’s behavior according to their preferred trading style and timeframe.
Color-Coded Candle Painting The Kalman PSaR features color-coded candles that change according to the trend direction. When the price is above the PSaR, candles are painted green to indicate a long trend, and when the price is below the PSaR, candles are painted red to signal a short trend. This visual representation makes it easy to interpret market sentiment at a glance, improving decision-making speed during fast-moving markets.
Key Features and Customization
Kalman Filter Customization: The process noise and measurement noise parameters allow traders to adjust how aggressively the filter adapts to price changes, making it suitable for both volatile and stable markets.
Smoothing Options: A variety of moving average types, such as SMA, Hull, EMA, and more, can be applied to smooth the PSaR values, ensuring that the signal remains clear even in choppy markets.
Dynamic Trend Detection: The Kalman PSaR dynamically updates based on price movements, helping traders spot trend reversals early while filtering out false signals caused by short-term volatility.
Bar Coloring and PSaR Plotting: Traders can choose to color candles based on trend direction or plot the PSaR directly on the chart for additional visual clarity.
Practical Applications
Trend-Following Strategies: The Kalman PSaR excels in trend-following strategies by providing timely signals of trend changes. The dynamic nature of the indicator allows traders to capture significant price movements while avoiding market noise.
Reversal Identification: The indicator’s ability to filter out noise and provide smoother signals makes it ideal for identifying reversals in volatile markets.
Risk Management: By plotting clear stop levels based on the PSaR, traders can use this indicator to effectively manage risk, placing stop-loss orders at key points based on the trend direction.
Conclusion
The Kalman PSaR is a fusion of the classic Parabolic SAR and the Kalman filter, offering enhanced trend detection with reduced noise. Its customizable filtering and smoothing options, combined with dynamic trend-following capabilities, make it a versatile tool for traders seeking to improve their timing and signal accuracy. The adaptive nature of the Kalman filter, combined with the robust PSaR logic, helps traders stay on the right side of the market and manage risk more effectively.

Uptrick: Volume-Weighted EMA Signal### **Uptrick: Volume-Weighted EMA Signal (UVES) Indicator - Comprehensive Description**
#### **Overview**
The **Uptrick: Volume-Weighted EMA Signal (UVES)** is an advanced, multifaceted trading indicator meticulously designed to provide traders with a holistic view of market trends by integrating Exponential Moving Averages (EMA) with volume analysis. This indicator not only identifies the direction of market trends through dynamic EMAs but also evaluates the underlying strength of these trends using real-time volume data. UVES is a versatile tool suitable for various trading styles and markets, offering a high degree of customization to meet the specific needs of individual traders.
#### **Purpose**
The UVES indicator aims to enhance traditional trend-following strategies by incorporating a critical yet often overlooked component: volume. Volume is a powerful indicator of market strength, providing insights into the conviction behind price movements. By merging EMA-based trend signals with detailed volume analysis, UVES offers a more nuanced and reliable approach to identifying trading opportunities. This dual-layer analysis allows traders to differentiate between strong trends supported by significant volume and weaker trends that may be prone to reversals.
#### **Key Features and Functions**
1. **Dynamic Exponential Moving Average (EMA):**
- The core of the UVES indicator is its dynamic EMA, calculated over a customizable period. The EMA is a widely used technical indicator that smooths price data to identify the underlying trend. In UVES, the EMA is dynamically colored—green when the current EMA value is above the previous value, indicating an uptrend, and red when below, signaling a downtrend. This visual cue helps traders quickly assess the trend direction without manually calculating or interpreting raw data.
2. **Comprehensive Moving Average Customization:**
- While the EMA is the default moving average in UVES, traders can select from various other moving average types, including Simple Moving Average (SMA), Smoothed Moving Average (SMMA), Weighted Moving Average (WMA), and Volume-Weighted Moving Average (VWMA). Each type offers unique characteristics:
- **SMA:** Provides a simple average of prices over a specified period, suitable for identifying long-term trends.
- **EMA:** Gives more weight to recent prices, making it more responsive to recent market movements.
- **SMMA (RMA):** A slower-moving average that reduces noise, ideal for capturing smoother trends.
- **WMA:** Weighs prices based on their order in the dataset, making recent prices more influential.
- **VWMA:** Integrates volume data, emphasizing price movements that occur with higher volume, making it particularly useful in volume-sensitive markets.
3. **Signal Line for Trend Confirmation:**
- UVES includes an optional signal line, which applies a secondary moving average to the primary EMA. This signal line can be used to smooth out the EMA and confirm trend changes. The signal line’s color changes based on its slope—green for an upward slope and red for a downward slope—providing a clear visual confirmation of trend direction. Traders can adjust the length and type of this signal line, allowing them to tailor the indicator’s responsiveness to their trading strategy.
4. **Buy and Sell Signal Generation:**
- UVES generates explicit buy and sell signals based on the interaction between the EMA and the signal line. A **buy signal** is triggered when the EMA transitions from a red (downtrend) to a green (uptrend), indicating a potential entry point. Conversely, a **sell signal** is triggered when the EMA shifts from green to red, suggesting an exit or shorting opportunity. These signals are displayed directly on the chart as upward or downward arrows, making them easily identifiable even during fast market conditions.
5. **Volume Analysis with Real-Time Buy/Sell Volume Table:**
- One of the standout features of UVES is its integration of volume analysis, which calculates and displays the volume attributed to buying and selling activities. This analysis includes:
- **Buy Volume:** The portion of the total volume associated with price increases (close higher than open).
- **Sell Volume:** The portion of the total volume associated with price decreases (close lower than open).
- **Buy/Sell Ratio:** A ratio of buy volume to sell volume, providing a quick snapshot of market sentiment.
- These metrics are presented in a real-time table positioned in the top-right corner of the chart, with customizable colors and formatting. The table updates with each new bar, offering continuous feedback on the strength and direction of the market trend based on volume data.
6. **Customizable Settings and User Control:**
- **EMA Length and Source:** Traders can specify the lookback period for the EMA, adjusting its sensitivity to price changes. The source for EMA calculations can also be customized, with options such as close, open, high, low, or other custom price series.
- **Signal Line Customization:** The signal line’s length, type, and width can be adjusted to suit different trading strategies, allowing traders to optimize the balance between trend detection and noise reduction.
- **Offset Adjustment:** The offset feature allows users to shift the EMA and signal line forward or backward on the chart. This can help align the indicator with specific price action or adjust for latency in decision-making processes.
- **Volume Table Positioning and Formatting:** The position, size, and color scheme of the volume table are fully customizable, enabling traders to integrate the table seamlessly into their chart setup without cluttering the visual workspace.
7. **Versatility Across Markets and Trading Styles:**
- UVES is designed to be effective across a wide range of financial markets, including Forex, stocks, cryptocurrencies, commodities, and indices. Its adaptability to different markets is supported by its comprehensive customization options and the inclusion of volume analysis, which is particularly valuable in markets where volume plays a crucial role in price movement.
#### **How Different Traders Can Benefit from UVES**
1. **Trend Followers:**
- Trend-following traders will find UVES particularly beneficial for identifying and riding trends. The dynamic EMA and signal line provide clear visual cues for trend direction, while the volume analysis helps confirm the strength of these trends. This combination allows trend followers to stay in profitable trades longer and exit when the trend shows signs of weakening.
2. **Volume-Based Traders:**
- Traders who focus on volume as a key indicator of market strength can leverage the UVES volume table to gain insights into the buying and selling pressure behind price movements. By monitoring the buy/sell ratio, these traders can identify periods of strong conviction (high buy volume) or potential reversals (high sell volume) with greater accuracy.
3. **Scalpers and Day Traders:**
- For traders operating on shorter time frames, UVES provides quick and reliable signals that are essential for making rapid trading decisions. The ability to customize the EMA length and type allows scalpers to fine-tune the indicator for responsiveness, while the volume analysis offers an additional layer of confirmation to avoid false signals.
4. **Swing Traders:**
- Swing traders, who typically hold positions for several days to weeks, can use UVES to identify medium-term trends and potential entry and exit points. The indicator’s ability to filter out market noise through the signal line and volume analysis makes it ideal for capturing significant price movements without being misled by short-term volatility.
5. **Position Traders and Long-Term Investors:**
- Even long-term investors can benefit from UVES by using it to identify major trend reversals or confirm the strength of long-term trends. The flexibility to adjust the EMA and signal line to longer periods ensures that the indicator remains relevant for detecting shifts in market sentiment over extended time frames.
#### **Optimal Settings for Different Markets**
- **Forex Markets:**
- **EMA Length:** 9 to 14 periods.
- **Signal Line:** Use VWMA or WMA for the signal line to incorporate volume data, which is crucial in the highly liquid Forex markets.
- **Best Use:** Short-term trend following, with an emphasis on identifying rapid changes in market sentiment.
- **Stock Markets:**
- **EMA Length:** 20 to 50 periods.
- **Signal Line:** SMA or EMA with a slightly longer length (e.g., 50 periods) to capture broader market trends.
- **Best Use:** Medium to long-term trend identification, with volume analysis confirming the strength of institutional buying or selling.
- **Cryptocurrency Markets:**
- **EMA Length:** 9 to 12 periods, due to the high volatility in crypto markets.
- **Signal Line:** SMMA or EMA for smoothing out extreme price fluctuations.
- **Best Use:** Identifying entry and exit points in volatile markets, with the volume table providing insights into market manipulation or sudden shifts in trader sentiment.
- **Commodity Markets:**
- **EMA Length:** 14 to 21 periods.
- **Signal Line:** WMA or VWMA, considering the impact of trading volume on commodity prices.
- **Best Use:** Capturing medium-term price movements and confirming trend strength with volume data.
#### **Customization for Advanced Users**
- **Advanced Offset Usage:** Traders can experiment with different offset values to see how shifting the EMA and signal line impacts the timing of buy/sell signals. This can be particularly useful in markets with known latency or for strategies that require a delayed confirmation of trend changes.
- **Volume Table Integration:** The position, size, and colors of the volume table can be adjusted to fit seamlessly into any trading setup. For example, a trader might choose to position the table in the bottom-right corner and use a smaller size to keep the focus on price action while still having access to volume data.
- **Signal Filtering:** By combining the signal line with the primary EMA, traders can filter out false signals during periods of low volatility or when the market is range-bound. Adjusting the length of the signal line allows for greater control over the sensitivity of the trend detection.
#### **Conclusion**
The **Uptrick: Volume-Weighted EMA Signal (UVES)** is a powerful and adaptable indicator designed for traders who demand more from their technical analysis tools. By integrating dynamic EMA trend signals with real-time volume analysis, UVES offers a comprehensive view of market conditions, making it an invaluable resource for identifying trends, confirming signals, and understanding market sentiment. Whether you are a day trader, swing trader, or long-term investor, UVES provides the versatility, precision, and customization needed to make more informed and profitable trading decisions. With its ability to adapt to various markets and trading styles, UVES is not just an indicator but a complete trend analysis solution.

MTOBVR_CheckOverview.
This indicator checks to see if the OBV follows a specific pattern and visually displays the trend of the OBV on different time legs. It also has the ability to set alerts when certain conditions are met.
How to use
Setting up the indicator
Add a new indicator on a chart in TradingView.
Copy the code into the “Pine Script™ Editor” and save it as a new script.
Apply the script to your chart.
Indicator Functions
OBV Calculation
Calculates OBV for each time frame (5-minute, 15-minute, 30-minute, 1-hour, 4-hour, daily, and weekly) and displays it on the chart OBV is an indicator that combines price changes and trading volume.
Pattern Detection
Detects whether a particular pattern, such as a double or triple bottom, appears in the OBV. This allows us to identify buy or sell signals.
When these patterns are detected, the background color changes.
Background Color Change
When an OBV forms a particular pattern, the background color of the chart changes. This provides visual confirmation that a pattern has appeared.
Minimum pattern (min_bool): when the 5-, 15-, and 30-minute conditions for OBV are met.
High hourly pattern (h_bool): when the condition is met for the 1-hour, 4-hour, and daily legs of the OBV.
One-week pattern (range_obv_1w_bool): when the condition is met for the 1-week OBV pattern.
When all conditions are met: when the minimum pattern, high hourly pattern, and one-week pattern are all met.
Alert Settings
You can set alerts when certain conditions are met. This allows you to receive signals in real time.
Minimum conditions (min_bool): conditions at 5, 15, and 30 minutes of OBV.
High timeframe condition (h_bool): condition on the 1-hour, 4-hour, and daily legs of the OBV.
When all conditions are met: When all of the above conditions are met.
One-week condition (range_obv_1w_bool): Condition for the one-week leg of the OBV.
When all conditions are met: when the minimum, high time leg, and one week conditions are all met.
Arrows
OBV_ALL_UP: A green triangle arrow is displayed when the OBV is rising on all time legs.
OBV_ALL_DOWN: A red triangle arrow appears when the OBV is falling on all time legs.
Usage Notes
Time Leg Settings: This script uses OBVs of different time legs to detect patterns. Depending on the time leg used, appropriate settings and interpretation are required.
Alert settings: In order to activate the alert function, the alert conditions and notification method must be configured using TradingView's alert system.
This indicator allows you to visually see trends and patterns in the OBV across multiple time frames, allowing you to make more informed trading decisions.
VWAP Bands [TradingFinder] 26 Brokers Data (Forex + Crypto)🔵 Introduction
Indicators are tools that help analysts predict the price trend of a stock through mathematical calculations on price or trading volume. It is evident that trading volume significantly impacts the price trend of a stock symbol.
The Volume-Weighted Average Price (VWAP) indicator combines the influence of trading volume and price, providing technical analysts with a practical tool.
This technical indicator determines the volume-weighted average price of a symbol over a specified time period. Consequently, this indicator can be used to identify trends and entry or exit points.
🟣 Calculating the VWAP Indicator
Adding the VWAP indicator to a chart will automatically perform all calculations for you. However, if you wish to understand how this indicator is calculated, the following explains the steps involved.
Consider a 5-minute chart. In the first candle of this chart (which represents price information in the first 5 minutes), sum the high, low, and close prices, and divide by 3. Multiply the resulting number by the volume for the period and call it a variable (e.g., X).
Then, divide the resulting output by the total volume for that period to calculate your VWAP. To maintain the VWAP sequence throughout the trading day, it is necessary to add the X values obtained from each period to the previous period and divide by the total volume up to that time. It is worth noting that the calculation method is the same for intervals shorter than a day.
The mathematical formula for this VWAP indicator : VWAP = ∑ (Pi×Vi) / ∑ Vi
🔵 How to Use
Traders might consider the VWAP indicator as a tool for predicting trends. For example, they might buy a stock when the price is above the VWAP level and sell it when the price is below the VWAP.
In other words, when the price is above the VWAP, the price is rising, and when it is below the VWAP, the price is falling. Major traders and investment funds also use the VWAP ratio to help enter or exit stocks with the least possible market impact.
It is important to note that one should not rely solely on the VWAP indicator when analyzing symbols. This is because if prices rise quickly, the VWAP indicator may not adequately describe the conditions. This indicator is generally used for daily or shorter time frames because using longer intervals can distort the average.
Since this indicator uses past data in its calculations, it can be considered a lagging indicator. As a result, the more data there is, the greater the delay.
🟣 Difference Between VWAP and Simple Moving Average
On a chart, the VWAP and the simple moving average may look similar, but these two indicators have different calculations. The VWAP calculates the total price considering volume, while the simple moving average does not consider volume.
In simpler terms, the VWAP indicator measures each day's price change relative to the trading volume that occurred that day. In contrast, the simple moving average implicitly assumes that all trading days have the same volume.
🟣 Reasons Why Traders Like the VWAP Indicator
The VWAP Considers Volume: Since VWAP takes volume into account, it can be more reliable than a simple arithmetic average of prices. Theoretically, one person can buy 200,000 shares of a symbol in one transaction at a single price.
However, during the same time frame, 100 other people might place 200 different orders at various prices that do not total 100,000 shares. In this case, if you only consider the average price, you might be mistaken because trading volume is ignored.
The Indicator Can Help Day Traders: While reviewing your trades, you might notice that the shares you bought at market price are trading below the VWAP indicator.
In this case, there's no need to worry because with the help of VWAP, you always get a price below the average. By knowing the volume-weighted average price of a stock, you can easily make an informed decision about paying more or less than other traders for the stock.
VWAP Can Signal Market Trend Changes: Buying low and selling high can be an excellent strategy for individuals. However, you are looking to buy when prices start to rise and sell your shares when prices start to fall.
Since the VWAP indicator simulates a balanced price in the market, when the price crosses above the VWAP line, one can assume that traders are willing to pay more to acquire shares, and as a result, the market will grow. Conversely, when the price crosses below the line, this can be considered a sign of a downward movement.
🔵 Setting
Period : Indicator calculation time frame.
Source : The Price used for calculations.
Market Ultra Data : If you turn on this feature, 26 large brokers will be included in the calculation of the trading volume.
The advantage of this capability is to have more reliable volume data. You should be careful to specify the market you are in, FOREX brokers and Crypto brokers are different.
Multiplier : Coefficient of band lines.
