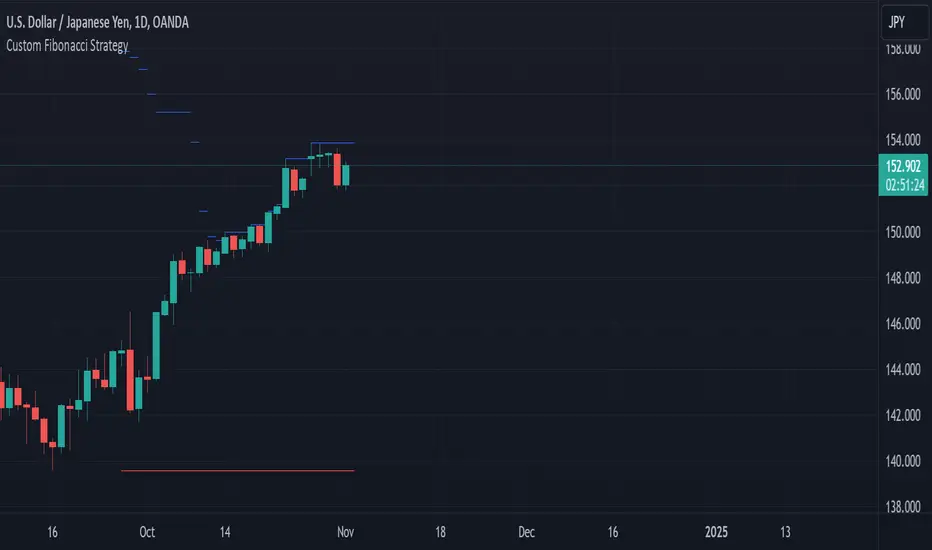
Custom Fibonacci StrategyCustom Fibonacci Strategy:
This strategy relies on analyzing Fibonacci levels to identify entry points for trades. It works by identifying peaks and troughs over a specified time period (50 bars in this code). Here are the steps of the strategy:
Identifying Peaks and Troughs:
The highest peak and lowest trough over the last 50 bars are identified.
If the price exceeds the previous peak, it is considered a break of the peak.
If the price falls below the previous trough after breaking the peak, it is considered a break of the trough.
Calculating Fibonacci Levels:
The 50% level (midway point) between the identified peak and trough is calculated.
Buy Signals:
When a trough is broken, and the price trades at or below the 50% level, the risk-to-reward ratio is evaluated.
If the risk-to-reward ratio is greater than or equal to 2, a buy signal is generated.
Displaying Levels:
Horizontal lines are displayed on the chart to illustrate the peak, trough, and Fibonacci level.
Summary
This strategy provides a systematic approach to trading based on Fibonacci retracement levels and price action, allowing traders to make informed decisions about entry points and manage risk effectively.
ابحث في النصوص البرمجية عن "chart"
Vishnu's Magics**Vishnu's Magics** is a powerful RSI (Relative Strength Index) indicator designed to enhance trading strategies through effective divergence detection and alerting features. This indicator provides the following key functionalities:
1. **RSI Calculation**: Calculates the RSI over a customizable length, allowing traders to identify overbought and oversold conditions.
2. **Customizable Bands**: Users can set multiple upper and lower bands to define different overbought and oversold levels, facilitating precise trading decisions.
3. **Divergence Detection**: The indicator identifies both bullish and bearish divergences by comparing price action with RSI movements. It highlights these divergences on the chart, helping traders anticipate potential reversals.
4. **Visual Alerts**: When divergences are detected, the indicator visually marks the points on the chart with labeled shapes ("Bull" for bullish divergence and "Bear" for bearish divergence) and changes the background color to indicate the condition.
5. **Alert System**: Users can set alerts for significant events, such as crossing specified bands or detecting divergences, ensuring timely notifications for trading opportunities.
6. **Custom Line Values**: Traders can edit the values for the divergence lines, providing flexibility to tailor the indicator according to their trading strategies.
Overall, **Vishnu's Magics** serves as an intuitive tool for traders looking to leverage RSI analysis and divergence strategies for informed trading decisions.

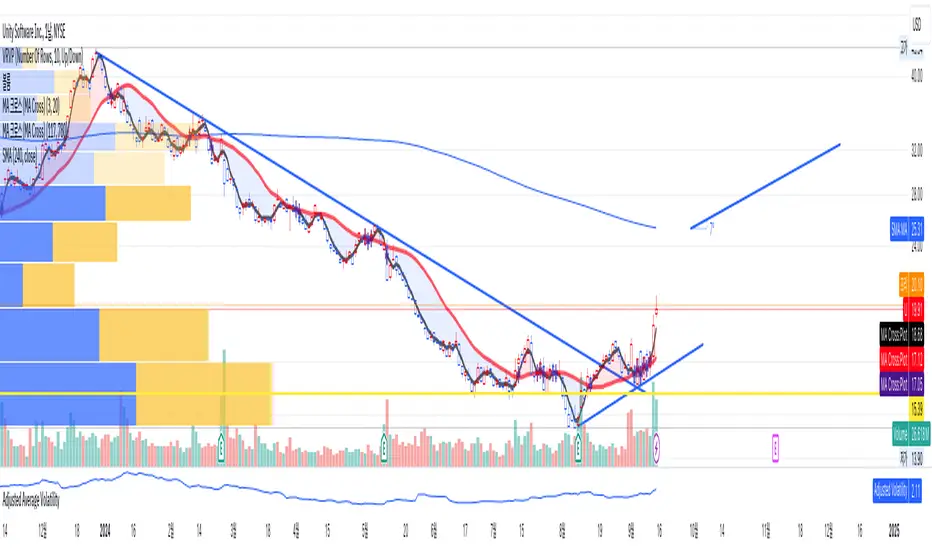
Adjusted Average VolatilityThis Pine Script calculates the average volatility over the past 20 bars by taking the difference between the high and low prices. It then adjusts this volatility based on the previous closing price: if the price is below $20, the volatility is multiplied by 2, and if it’s above $20, the volatility is multiplied by 1.5. The adjusted volatility is then plotted on the chart, helping traders visualize how volatility changes relative to the asset's price level.
5-9-20-100 Day EMAIndicator Name: "5-9-20-100 Day EMA"
Purpose: This indicator plots four key EMAs (5, 9, 20, and 100-day) on a daily chart, providing a clear visualization of both short-term and long-term trends. The EMAs serve as critical triggers for identifying potential entry and exit points based on price interactions with these moving averages.
Technical Details:
Version: Pine Script v5
EMAs Used:
5-Day EMA (Lime): Captures the most recent price trends, useful for identifying short-term momentum.
9-Day EMA (Yellow): Offers a slightly broader view, often used to confirm the short-term trend.
20-Day EMA (Orange): Represents a medium-term trend, commonly used as a signal for trend reversals.
100-Day EMA (Red): Indicates the long-term trend, often serving as strong support or resistance levels.
Trigger Points:
Crossovers: Price crossing above or below these EMAs can trigger potential buy or sell signals.
Convergence/Divergence: The interaction between the EMAs, such as a faster EMA crossing a slower one, can signal trend reversals or continuations.
Utility: This indicator is ideal for traders who rely on EMA crossovers and the relationship between different EMAs to make informed trading decisions.

T-Wave Pattern IdentifierA T-wave might describe a pattern where the price movement forms a "T" shape on the chart, which could involve:
Strong Vertical Movement (The Stem of the T):
This could represent a sharp, decisive move in one direction (up or down), often occurring in a single candle or a few candles. This movement could be seen as the "stem" of the T.
For example, a sudden spike up in price followed by a horizontal consolidation.
Horizontal Movement (The Cross of the T):
Following the sharp move, the price might consolidate sideways, forming a horizontal base or resistance/support level, which creates the top cross of the "T."
This could indicate a pause or a consolidation phase after a significant move, where the price moves within a narrow range.
Contexts Where a T-Wave Pattern Might Be Useful:
Breakout Scenarios: If a T-wave forms after a significant upward or downward movement, it could suggest a potential continuation in the direction of the initial move, especially if the price breaks out of the consolidation range.
Reversal Signals: Alternatively, the T-wave could act as a reversal pattern if the price fails to continue in the direction of the initial move and instead breaks out in the opposite direction.
T-Wave Logic Example:
Stem (Vertical Movement):
Identify a candle or series of candles with a significant price move (e.g., a large-bodied candle with a relatively small wick). This shows momentum in one direction.
Cross (Horizontal Movement):
Following the vertical move, identify a consolidation phase where the price moves sideways in a relatively tight range. This could be visualized as a series of small candles with overlapping highs and lows.

Custom Time HighlighterThis indicator draws a vertical line on the chart at every Sunday opening price.
The indicator is intended to help divide the chart into individual weeks.
You can adjust the time when the line is drawn in the settings.

W and M Pattern with Trend AlertThis script detects W and M patterns in price action and alerts the trader when these patterns occur, providing potential trading opportunities.
W Pattern: A W pattern forms when the price creates two bottoms, separated by a higher low in the middle. It often indicates a reversal from a downtrend to an uptrend. The script plots a green line at the neckline of the W pattern.
M Pattern: An M pattern forms when the price creates two tops, separated by a lower high in the middle. It often indicates a reversal from an uptrend to a downtrend. The script plots a red line at the neckline of the M pattern.
Key Features:
Alerts: The script generates alerts when W or M patterns are detected, allowing traders to stay informed of potential trading opportunities.
Recent Breakout: W and M pattern lines are drawn only after the recent breakout of support or resistance levels, helping traders focus on current market conditions.
Visual Representation: The script visually represents W and M patterns with vertical lines at the neckline, making it easier for traders to identify potential reversal points.
Usage:
Watch for alerts indicating the detection of W or M patterns.
Verify the pattern visually on the chart, paying attention to recent support or resistance levels.
Consider entering a trade based on the direction suggested by the pattern (e.g., long on W pattern, short on M pattern), using additional technical analysis to confirm the trade setup.

Xen's Flag Pattern Scalper1. Input Parameters:
FlagLength: Determines the length of the flag pattern.
TakeProfit1Ratio, takeProfit2Ratio, takeProfit3Ratio: Define the ratios for calculating
the take-profit levels relative to the entry price.
RiskRewardRatio: Specifies the risk-reward ratio for calculating the stop-loss level
relative to the entry price.
2 Flag Conditions:
BullishFlag: Checks if the current bar meets the conditions for a bullish flag pattern. It
evaluates to true if the low of the current bar is lower than the low flagLength bars
ago, and the close of the current bar is higher than the high flagLength bars ago.
BearishFlag: Checks if the current bar meets the conditions for a bearish flag pattern. It evaluates to true if the high of the current bar is higher than the high flagLength bars
ago, and the close of the current bar is lower than the low flagLength bars ago.
3. Entry Price:
EntryPrice: Calculates the entry price based on whether a bullish or bearish flag
pattern is identified. For a bullish flag, the entry price is set to the low of the current bar.
For a bearish flag, the entry price is set to the high of the current bar.
4. Stop Loss:
StopLoss: Determines the stop-loss level based on the entry price and the specified
riskRewardRatio . For a bullish flag, the stop-loss level is calculated by subtracting the
difference between the high and low of the current bar multiplied by the riskRewardRatio from the low of the current bar. For a bearish flag, the stop-loss level
is calculated similarly but added to the high of the current bar.
5. Take Profit Levels:
Three take-profit levels ( takeProfit1, takeProfit2, takeProfit3 ) are calculated based on
the entry price, stop-loss level, and specified take-profit ratios ( takeProfit1Ratio,
takeProfit2Ratio, takeProfit3Ratio ).
6. Plotting Signals and Levels:
Bullish and bearish flag patterns are plotted using triangle shapes ( shape.triangleup for
bullish and shape.triangledown for bearish) above or below the bars, respectively.
Entry, stop-loss, and take-profit levels are plotted using horizontal lines ( line.new )
with different colors and styles. Entry and stop-loss levels are labeled with "Entry" and "SL",
respectively, while take-profit levels are labeled with "TP 1", "TP 2", and "TP 3".
The colors for bullish flags are white for entry, red for stop-loss, and green for take-profit levels. For bearish flags, the colors are the same, but the labels are plotted above the bars.
7. Label Placement:
Labels for entry, stop-loss, and take-profit levels are placed a distance of 4 bars to the right
of the entry price using bar_index + 4 .
This indicator is intended to help traders identify flag patterns on price charts and visualize potential entry, stop-loss, and take-profit levels associated with these patterns.
Please use risk management and when TP1 is hit, move stoploss to breakeven .

Tomorrow CamarillaThis indicator will help you to find the next day camarilla pivots
note: you need to customise the settings use #ENABLE PRICE LINE# then you got the next day line on your chart

NDOG + ASIA CONFLUENCENDOG (New Day Opening Gap) Visualization:
The indicator identifies and visualizes New Day Opening Gaps (NDOGs), which are essentially the differences between the opening price of a new trading day and the closing price of the previous day.
For each NDOG identified, it creates a box on the chart that highlights the high and low price range of the NDOG.
The color of these boxes, as well as the number of NDOGs to be displayed, can be customized by the user.
Asia Session Highlighting:
The indicator includes a feature to highlight the Asia trading session, typically spanning from 18:00 to 00:00, but customizable to suit different time zones or preferences.
It does not dynamically calculate or display the Asia session but uses a fixed time input by the user.
The color for highlighting the Asia session can be chosen by the user.
Additional Lines on NDOGs:
The script draws horizontal lines at the high and low of each NDOG, spanning from 18:00 to 00:00, to visually represent the range of the NDOG during the Asia session.
The color of these lines can be customized.
Customizability:
The indicator provides various input options for users to customize the colors of the NDOG boxes and the lines that represent the high and low of the NDOGs.
Purpose and Usage:
This indicator is useful for traders who focus on price gaps between trading days and are particularly interested in the price action during the Asia trading session.
It helps in identifying potential zones of interest where significant price movements or trading activities could occur, especially at the opening of a new trading day.

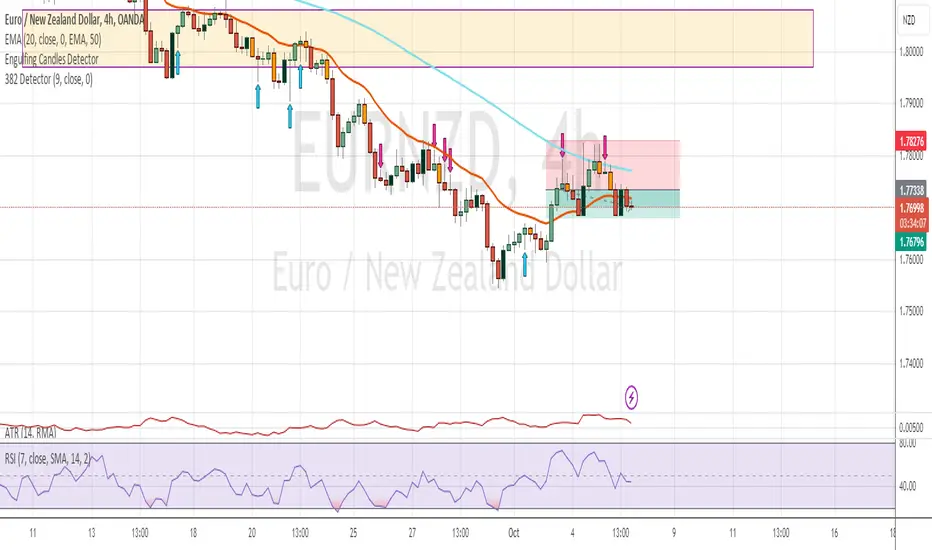
382 Detector with ArrowsThis indicator searches for all 382 candles on the chart.
For a bullish 382 candle, it means that the body of the candle (open to close) are on the top 38.2% of the entire candle (including the wick). Such candlestick pattern displays a bullish pattern because the buyers are in control and pushed for higher prices at the close of the bar.
On the other hand, a bearish 382 candle, the body of the candle (close to open) are on the bottom 38.2% of the entire candle (including the wick). Such candlestick pattern displays a bearish pattern because the sellers are in control and pushed for lower prices at the close of the bar.
If a bullish 382 candle is detected, a light blue arrow will be displayed on the bottom of the candlestick.
If a bearish 382 candle is detected, a pink arrow will be displayed on the top of the candlestick.
Please note that these are only candlestick pattern detectors and are by no means bullish or bearish trade signals. An upward arrow does not represent any long trade opportunity and similarly a downward arrow does not represent any short trade opportunity. These are just visual representation of candlestick patterns. Please trade at your own risk.
Improved EMA & CDC Trailing Stop StrategyImproved EMA & CDC Trailing Stop Strategy
Objective: This strategy seeks to exploit potential trend reversals or continuations using Exponential Moving Averages (EMAs) and a trailing stop based on the Chande Dynamic Convergence Divergence (CDC) ATR method.
Components:
Exponential Moving Averages (EMAs):
60-period EMA (Blue Line): Faster-moving average that reacts more quickly to price changes.
90-period EMA (Red Line): Slower-moving average that provides a smoother indication of long-term price direction.
MACD Indicator:
Utilized to confirm the trend direction. When the MACD line is above its signal line, it may indicate a bullish trend. Conversely, when the MACD line is below its signal line, it may indicate a bearish trend.
CDC Trailing Stop ATR:
Used to set dynamic stop-loss levels that adjust with market volatility. This stop is based on the Average True Range (ATR) with a user-defined multiplier, providing the strategy with a flexible way to protect against adverse price movements.
Profit Targets:
Based on a multiple of the ATR, this sets an objective level at which to take profits, ensuring gains are captured while potentially still leaving room for further profitable movement.
Trading Rules:
Entry:
Long (Buy) Entry Conditions:
Price is above the 60-period EMA.
The 60-period EMA is above the 90-period EMA.
The MACD line is above its signal line.
Price is above the calculated CDC Trailing Stop ATR level.
Short (Sell) Entry Conditions:
Price is below the 60-period EMA.
The 60-period EMA is below the 90-period EMA.
The MACD line is below its signal line.
Price is below the calculated CDC Trailing Stop ATR level.
Exit:
Long (Buy) Exit Conditions:
Price reaches the predetermined profit target based on the ATR.
Price drops below the CDC Trailing Stop ATR level.
Short (Sell) Exit Conditions:
Price reaches the predetermined profit target based on the ATR.
Price rises above the CDC Trailing Stop ATR level.
Visualization:
The strategy displays the 60-period and 90-period EMAs on the chart.
The CDC Trailing Stop ATR levels for both long and short trades are also plotted for clarity.
The MACD Histogram is shown to visualize the difference between the MACD line and its signal line.
Recommendations: Before deploying this strategy, traders should backtest it across various historical data sets and market conditions. Regularly reviewing and potentially adjusting the strategy is recommended as market dynamics evolve.

Southern Star Shadows with AlertThe "Southern Star Shadows with Alert" indicator in Pine Script is designed to identify and visually represent a specific candlestick pattern known as the "Southern Star Shadows" pattern on a TradingView chart. This pattern can provide traders with potential signals for both bullish and bearish market conditions.
Here's a short description of how the indicator works:
Pattern Identification: The indicator scans price data to identify the conditions that constitute a "Southern Star Shadows" pattern. It checks for a combination of factors, including the relationship between the current and previous candle's high, low, open, and close prices.
Signal Generation: The indicator assigns a signal based on the identified pattern. It generates a "1" for a bullish signal and "-1" for a bearish signal. If the pattern conditions are not met, it assigns a "0," indicating no clear signal.
Visualization: The indicator visually represents the signals by coloring the price bars. Bullish signals are typically colored in blue, while bearish signals are colored in red.
Triangle Plots: Additionally, the indicator plots small triangle shapes above the respective candles to highlight where the pattern occurred. Green triangles are used for bullish signals, and red triangles are used for bearish signals.
Alerts: Traders can set up alerts based on the indicator. When the pattern is detected and a signal is generated, the indicator sends an alert message, providing traders with a timely notification of potential trading opportunities.
Overall, the "Southern Star Shadows with Alert" indicator helps traders identify and react to potential trend reversal or continuation opportunities in the market by recognizing specific candlestick patterns and providing visual and alert-based signals.

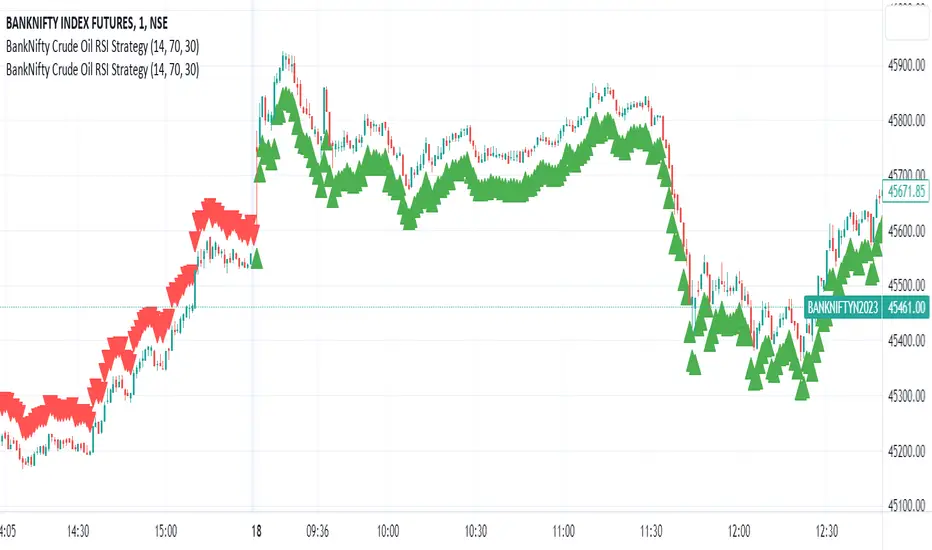
BankNifty Crude Oil RSI Strategy
The "BankNifty Crude Oil RSI Strategy" is a trading strategy that combines the BankNifty index with the WTI Crude Oil price index using the Relative Strength Index (RSI) as the primary indicator. The strategy aims to generate buy and sell signals based on the RSI of the Crude Oil price index, which might influence the BankNifty index.
Here's how the strategy works step by step:
Data Fetching:
The strategy fetches the daily closing prices of WTI Crude Oil from the provided TradingView link "TVC:USOIL" using the request.security function.
RSI Calculation:
The Relative Strength Index (RSI) is calculated using the closing prices of WTI Crude Oil. The RSI is a momentum oscillator that measures the speed and change of price movements. It oscillates between 0 and 100, indicating overbought conditions when above a specified threshold (overbought level) and oversold conditions when below a specified threshold (oversold level).
Buy and Sell Conditions:
The strategy defines two conditions based on the RSI values:
Buy Signal: When the Crude Oil RSI falls below a specified rsiOversold level (default is 30), the strategy generates a buy signal. This implies that the Crude Oil is in an oversold condition, and there might be a potential buying opportunity in the BankNifty index.
Sell Signal: When the Crude Oil RSI rises above a specified rsiOverbought level (default is 70), the strategy generates a sell signal. This implies that the Crude Oil is in an overbought condition, and there might be a potential selling opportunity in the BankNifty index.
Buy and Sell Signal Visualization:
The strategy uses the plotshape function to plot triangular shapes (upward for buy and downward for sell) below and above the price bars, respectively, to indicate the buy and sell signals on the chart visually.
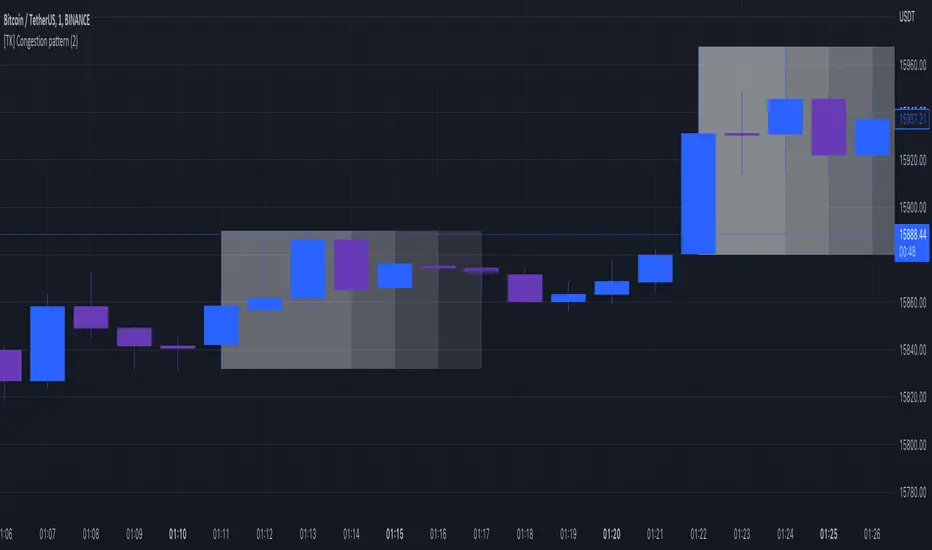
[TK] Congestion patternDraw on your chart the congestion zone.
The exit of the congestion zone is an interesting time for trading.
How is calculated the congestion zone ?
If the candle close in the range of the previous candle : this is a continuation of the congestion zone
if the candle close out of the range of the previous candle : the congestion zone is over
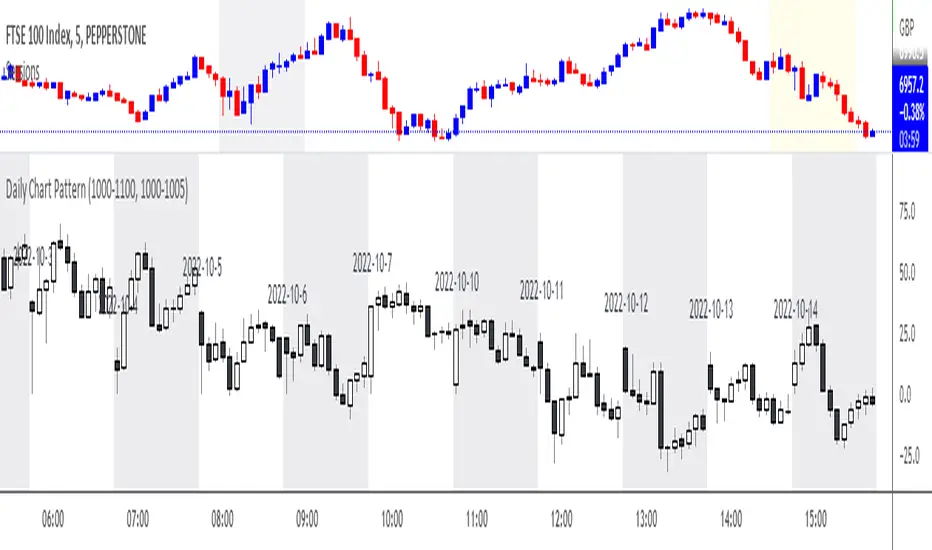
Daily Chart PatternWill automatically print all the candle pattern on the time range set, and move it to the right side for easy learning and simulation
Time Range Bar PatternThis will show candle pattern in separate window to maintain candle pattern and candle's shape consistently (as in big trading range, candle is much smaller and in small trading range, candle is much bigger)
There are 4 parameters:
- Bull color and bear color - clear enough
- Candle Time Range - you can input time range you desire (remember you need to set the value based on chart time as well, for example if M5, then the time range need to be in M5 time range)
- First Candle Time Range - need your help to input the first candle time range for easier calculation and visual (remember you need to set the value based on chart time as well, for example if M5, then the time range of first candle should be in 5 minutes period)

three bar breakout diegothree bar breakout linda
this indicator ienables me to see this chart pattern, inside day within two previous bars
Luxy Momentum, Trend, Bias and Breakout Indicators V7
TABLE OF CONTENTS
This is Version 7 (V7) - the latest and most optimized release. If you are using any older versions (V6, V5, V4, V3, etc.), it is highly recommended to replace them with V7.
Why This Indicator is Different
Who Should Use This
Core Components Overview
The UT Bot Trading System
Understanding the Market Bias Table
Candlestick Pattern Recognition
Visual Tools and Features
How to Use the Indicator
Performance and Optimization
FAQ
---
### CREDITS & ATTRIBUTION
This indicator implements proven trading concepts using entirely original code developed specifically for this project.
### CONCEPTUAL FOUNDATIONS
• UT Bot ATR Trailing System
- Original concept by @QuantNomad: (search "UT-Bot-Strategy"
- Our version is a complete reimplementation with significant enhancements:
- Volume-weighted momentum adjustment
- Composite stop loss from multiple S/R layers
- Multi-filter confirmation system (swing, %, 2-bar, ZLSMA)
- Full integration with multi-timeframe bias table
- Visual audit trail with freeze-on-touch
- NOTE: No code was copied - this is a complete reimplementation with enhancements.
• Standard Technical Indicators (Public Domain Formulas):
- Supertrend: ATR-based trend calculation with custom gradient fills
- MACD: Gerald Appel's formula with separation filters
- RSI: J. Welles Wilder's formula with pullback zone logic
- ADX/DMI: Custom trend strength formula inspired by Wilder's directional movement concept, reimplemented with volume weighting and efficiency metrics
- ZLSMA: Zero-lag formula enhanced with Hull MA and momentum prediction
### Custom Implementations
- Trend Strength: Inspired by Wilder's ADX concept but using volume-weighted pressure calculation and efficiency metrics (not traditional +DI/-DI smoothing)
- All code implementations are original
### ORIGINAL FEATURES (70%+ of codebase)
- Multi-Timeframe Bias Table with live updates
- Risk Management System (R-multiple TPs, freeze-on-touch)
- Opening Range Breakout tracker with session management
- Composite Stop Loss calculator using 6+ S/R layers
- Performance optimization system (caching, conditional calcs)
- VIX Fear Index integration
- Previous Day High/Low auto-detection
- Candlestick pattern recognition with interactive tooltips
- Smart label and visual management
- All UI/UX design and table architecture
### DEVELOPMENT PROCESS
**AI Assistance:** This indicator was developed over 2+ months with AI assistance (ChatGPT/Claude) used for:
- Writing Pine Script code based on design specifications
- Optimizing performance and fixing bugs
- Ensuring Pine Script v6 compliance
- Generating documentation
**Author's Role:** All trading concepts, system design, feature selection, integration logic, and strategic decisions are original work by the author. The AI was a coding tool, not the system designer.
**Transparency:** We believe in full disclosure - this project demonstrates how AI can be used as a powerful development tool while maintaining creative and strategic ownership.
---
1. WHY THIS INDICATOR IS DIFFERENT
Most traders use multiple separate indicators on their charts, leading to cluttered screens, conflicting signals, and analysis paralysis. The Suite solves this by integrating proven technical tools into a single, cohesive system.
Key Advantages:
All-in-One Design: Instead of loading 5-10 separate indicators, you get everything in one optimized script. This reduces chart clutter and improves TradingView performance.
Multi-Timeframe Bias Table: Unlike standard indicators that only show the current timeframe, the Bias Table aggregates trend signals across multiple timeframes simultaneously. See at a glance whether 1m, 5m, 15m, 1h are aligned bullish or bearish - no more switching between charts.
Smart Confirmations: The indicator doesn't just give signals - it shows you WHY. Every entry has multiple layers of confirmation (MA cross, MACD momentum, ADX strength, RSI pullback, volume, etc.) that you can toggle on/off.
Dynamic Stop Loss System: Instead of static ATR stops, the SL is calculated from multiple support/resistance layers: UT trailing line, Supertrend, VWAP, swing structure, and MA levels. This creates more intelligent, price-action-aware stops.
R-Multiple Take Profits: Built-in TP system calculates targets based on your initial risk (1R, 1.5R, 2R, 3R). Lines freeze when touched with visual checkmarks, giving you a clean audit trail of partial exits.
Educational Tooltips Everywhere: Every single input has detailed tooltips explaining what it does, typical values, and how it impacts trading. You're not guessing - you're learning as you configure.
Performance Optimized: Smart caching, conditional calculations, and modular design mean the indicator runs fast despite having 15+ features. Turn off what you don't use for even better performance.
No Repainting: All signals respect bar close. Alerts fire correctly. What you see in history is what you would have gotten in real-time.
What Makes It Unique:
Integrated UT Bot + Bias Table: No other indicator combines UT Bot's ATR trailing system with a live multi-timeframe dashboard. You get precision entries with macro trend context.
Candlestick Pattern Recognition with Interactive Tooltips: Patterns aren't just marked - hover over any emoji for a full explanation of what the pattern means and how to trade it.
Opening Range Breakout Tracker: Built-in ORB system for intraday traders with customizable session times and real-time status updates in the Bias Table.
Previous Day High/Low Auto-Detection: Automatically plots PDH/PDL on intraday charts with theme-aware colors. Updates daily without manual input.
Dynamic Row Labels in Bias Table: The table shows your actual settings (e.g., "EMA 10 > SMA 20") not generic labels. You know exactly what's being evaluated.
Modular Filter System: Instead of forcing a fixed methodology, the indicator lets you build your own strategy. Start with just UT Bot, add filters one at a time, test what works for your style.
---
2. WHO WHOULD USE THIS
Designed For:
Intermediate to Advanced Traders: You understand basic technical analysis (MAs, RSI, MACD) and want to combine multiple confirmations efficiently. This isn't a "one-click profit" system - it's a professional toolkit.
Multi-Timeframe Traders: If you trade one asset but check multiple timeframes for confirmation (e.g., enter on 5m after checking 15m and 1h alignment), the Bias Table will save you hours every week.
Trend Followers: The indicator excels at identifying and following trends using UT Bot, Supertrend, and MA systems. If you trade breakouts and pullbacks in trending markets, this is built for you.
Intraday and Swing Traders: Works equally well on 5m-1h charts (day trading) and 4h-D charts (swing trading). Scalpers can use it too with appropriate settings adjustments.
Discretionary Traders: This isn't a black-box system. You see all the components, understand the logic, and make final decisions. Perfect for traders who want tools, not automation.
Works Across All Markets:
Stocks (US, international)
Cryptocurrency (24/7 markets supported)
Forex pairs
Indices (SPY, QQQ, etc.)
Commodities
NOT Ideal For :
Complete Beginners: If you don't know what a moving average or RSI is, start with basics first. This indicator assumes foundational knowledge.
Algo Traders Seeking Black Box: This is discretionary. Signals require context and confirmation. Not suitable for blind automated execution.
Mean-Reversion Only Traders: The indicator is trend-following at its core. While VWAP bands support mean-reversion, the primary methodology is trend continuation.
---
3. CORE COMPONENTS OVERVIEW
The indicator combines these proven systems:
Trend Analysis:
Moving Averages: Four customizable MAs (Fast, Medium, Medium-Long, Long) with six types to choose from (EMA, SMA, WMA, VWMA, RMA, HMA). Mix and match for your style.
Supertrend: ATR-based trend indicator with unique gradient fill showing trend strength. One-sided ribbon visualization makes it easier to see momentum building or fading.
ZLSMA : Zero-lag linear-regression smoothed moving average. Reduces lag compared to traditional MAs while maintaining smooth curves.
Momentum & Filters:
MACD: Standard MACD with separation filter to avoid weak crossovers.
RSI: Pullback zone detection - only enter longs when RSI is in your defined "buy zone" and shorts in "sell zone".
ADX/DMI: Trend strength measurement with directional filter. Ensures you only trade when there's actual momentum.
Volume Filter: Relative volume confirmation - require above-average volume for entries.
Donchian Breakout: Optional channel breakout requirement.
Signal Systems:
UT Bot: The primary signal generator. ATR trailing stop that adapts to volatility and gives clear entry/exit points.
Base Signals: MA cross system with all the above filters applied. More conservative than UT Bot alone.
Market Bias Table: Multi-timeframe dashboard showing trend alignment across 7 timeframes plus macro bias (3-day, weekly, monthly, quarterly, VIX).
Candlestick Patterns: Six major reversal patterns auto-detected with interactive tooltips.
ORB Tracker: Opening range high/low with breakout status (intraday only).
PDH/PDL: Previous day levels plotted automatically on intraday charts.
VWAP + Bands : Session-anchored VWAP with up to three standard deviation band pairs.
---
4. THE UT BOT TRADING SYSTEM
The UT Bot is the heart of the indicator's signal generation. It's an advanced ATR trailing stop that adapts to market volatility.
Why UT Bot is Superior to Fixed Stops:
Traditional ATR stops use a fixed multiplier (e.g., "stop = entry - 2×ATR"). UT Bot is smarter:
It TRAILS the stop as price moves in your favor
It WIDENS during high volatility to avoid premature stops
It TIGHTENS during consolidation to lock in profits
It FLIPS when price breaks the trailing line, signaling reversals
Visual Elements You'll See:
Orange Trailing Line: The actual UT stop level that adapts bar-by-bar
Buy/Sell Labels: Aqua triangle (long) or orange triangle (short) when the line flips
ENTRY Line: Horizontal line at your entry price (optional, can be turned off)
Suggested Stop Loss: A composite SL calculated from multiple support/resistance layers:
- UT trailing line
- Supertrend level
- VWAP
- Swing structure (recent lows/highs)
- Long-term MA (200)
- ATR-based floor
Take Profit Lines: TP1, TP1.5, TP2, TP3 based on R-multiples. When price touches a TP, it's marked with a checkmark and the line freezes for audit trail purposes.
Status Messages: "SL Touched ❌" or "SL Frozen" when the trade leg completes.
How UT Bot Differs from Other ATR Systems:
Multiple Filters Available: You can require 2-bar confirmation, minimum % price change, swing structure alignment, or ZLSMA directional filter. Most UT implementations have none of these.
Smart SL Calculation: Instead of just using the UT line as your stop, the indicator suggests a better SL based on actual support/resistance. This prevents getting stopped out by wicks while keeping risk controlled.
Visual Audit Trail: All SL/TP lines freeze when touched with clear markers. You can review your trades weeks later and see exactly where entries, stops, and targets were.
Performance Options: "Draw UT visuals only on bar close" lets you reduce rendering load without affecting logic or alerts - critical for slower machines or 1m charts.
Trading Logic:
UT Bot flips direction (Buy or Sell signal appears)
Check Bias Table for multi-timeframe confirmation
Optional: Wait for Base signal or candlestick pattern
Enter at signal bar close or next bar open
Place stop at "Suggested Stop Loss" line
Scale out at TP levels (TP1, TP2, TP3)
Exit remaining position on opposite UT signal or stop hit
---
5. UNDERSTANDING THE MARKET BIAS TABLE
This is the indicator's unique multi-timeframe intelligence layer. Instead of looking at one chart at a time, the table aggregates signals across seven timeframes plus macro trend bias.
Why Multi-Timeframe Analysis Matters:
Professional traders check higher and lower timeframes for context:
Is the 1h uptrend aligning with my 5m entry?
Are all short-term timeframes bullish or just one?
Is the daily trend supportive or fighting me?
Doing this manually means opening multiple charts, checking each indicator, and making mental notes. The Bias Table does it automatically in one glance.
Table Structure:
Header Row:
On intraday charts: 1m, 5m, 15m, 30m, 1h, 2h, 4h (toggle which ones you want)
On daily+ charts: D, W, M (automatic)
Green dot next to title = live updating
Headline Rows - Macro Bias:
These show broad market direction over longer periods:
3 Day Bias: Trend over last 3 trading sessions (uses 1h data)
Weekly Bias: Trend over last 5 trading sessions (uses 4h data)
Monthly Bias: Trend over last 30 daily bars
Quarterly Bias: Trend over last 13 weekly bars
VIX Fear Index: Market regime based on VIX level - bullish when low, bearish when high
Opening Range Breakout: Status of price vs. session open range (intraday only)
These rows show text: "BULLISH", "BEARISH", or "NEUTRAL"
Indicator Rows - Technical Signals:
These evaluate your configured indicators across all active timeframes:
Fast MA > Medium MA (shows your actual MA settings, e.g., "EMA 10 > SMA 20")
Price > Long MA (e.g., "Price > SMA 200")
Price > VWAP
MACD > Signal
Supertrend (up/down/neutral)
ZLSMA Rising
RSI In Zone
ADX ≥ Minimum
These rows show emojis: GREEB (bullish), RED (bearish), GRAY/YELLOW (neutral/NA)
AVG Column:
Shows percentage of active timeframes that are bullish for that row. This is the KEY metric:
AVG > 70% = strong multi-timeframe bullish alignment
AVG 40-60% = mixed/choppy, no clear trend
AVG < 30% = strong multi-timeframe bearish alignment
How to Use the Table:
For a long trade:
Check AVG column - want to see > 60% ideally
Check headline bias rows - want to see BULLISH, not BEARISH
Check VIX row - bullish market regime preferred
Check ORB row (intraday) - want ABOVE for longs
Scan indicator rows - more green = better confirmation
For a short trade:
Check AVG column - want to see < 40% ideally
Check headline bias rows - want to see BEARISH, not BULLISH
Check VIX row - bearish market regime preferred
Check ORB row (intraday) - want BELOW for shorts
Scan indicator rows - more red = better confirmation
When AVG is 40-60%:
Market is choppy, mixed signals. Either stay out or reduce position size significantly. These are low-probability environments.
Unique Features:
Dynamic Labels: Row names show your actual settings (e.g., "EMA 10 > SMA 20" not generic "Fast > Slow"). You know exactly what's being evaluated.
Customizable Rows: Turn off rows you don't care about. Only show what matters to your strategy.
Customizable Timeframes: On intraday charts, disable 1m or 4h if you don't trade them. Reduces calculation load by 20-40%.
Automatic HTF Handling: On Daily/Weekly/Monthly charts, the table automatically switches to D/W/M columns. No configuration needed.
Performance Smart: "Hide BIAS table on 1D or above" option completely skips all table calculations on higher timeframes if you only trade intraday.
---
6. CANDLESTICK PATTERN RECOGNITION
The indicator automatically detects six major reversal patterns and marks them with emojis at the relevant bars.
Why These Six Patterns:
These are the most statistically significant reversal patterns according to trading literature:
High win rate when appearing at support/resistance
Clear visual structure (not subjective)
Work across all timeframes and assets
Studied extensively by institutions
The Patterns:
Bullish Patterns (appear at bottoms):
Bullish Engulfing: Green candle completely engulfs prior red candle's body. Strong reversal signal.
Hammer: Small body with long lower wick (at least 2× body size). Shows rejection of lower prices by buyers.
Morning Star: Three-candle pattern (large red → small indecision → large green). Very strong bottom reversal.
Bearish Patterns (appear at tops):
Bearish Engulfing: Red candle completely engulfs prior green candle's body. Strong reversal signal.
Shooting Star: Small body with long upper wick (at least 2× body size). Shows rejection of higher prices by sellers.
Evening Star: Three-candle pattern (large green → small indecision → large red). Very strong top reversal.
Interactive Tooltips:
Unlike most pattern indicators that just draw shapes, this one is educational:
Hover your mouse over any pattern emoji
A tooltip appears explaining: what the pattern is, what it means, when it's most reliable, and how to trade it
No need to memorize - learn as you trade
Noise Filter:
"Min candle body % to filter noise" setting prevents false signals:
Patterns require minimum body size relative to price
Filters out tiny candles that don't represent real buying/selling pressure
Adjust based on asset volatility (higher % for crypto, lower for low-volatility stocks)
How to Trade Patterns:
Patterns are NOT standalone entry signals. Use them as:
Confirmation: UT Bot gives signal + pattern appears = stronger entry
Reversal Warning: In a trade, opposite pattern appears = consider tightening stop or taking profit
Support/Resistance Validation: Pattern at key level (PDH, VWAP, MA 200) = level is being respected
Best combined with:
UT Bot or Base signal in same direction
Bias Table alignment (AVG > 60% or < 40%)
Appearance at obvious support/resistance
---
7. VISUAL TOOLS AND FEATURES
VWAP (Volume Weighted Average Price):
Session-anchored VWAP with standard deviation bands. Shows institutional "fair value" for the trading session.
Anchor Options: Session, Day, Week, Month, Quarter, Year. Choose based on your trading timeframe.
Bands: Up to three pairs (X1, X2, X3) showing statistical deviation. Price at outer bands often reverses.
Auto-Hide on HTF: VWAP hides on Daily/Weekly/Monthly charts automatically unless you enable anchored mode.
Use VWAP as:
Directional bias (above = bullish, below = bearish)
Mean reversion levels (outer bands)
Support/resistance (the VWAP line itself)
Previous Day High/Low:
Automatically plots yesterday's high and low on intraday charts:
Updates at start of each new trading day
Theme-aware colors (dark text for light charts, light text for dark charts)
Hidden automatically on Daily/Weekly/Monthly charts
These levels are critical for intraday traders - institutions watch them closely as support/resistance.
Opening Range Breakout (ORB):
Tracks the high/low of the first 5, 15, 30, or 60 minutes of the trading session:
Customizable session times (preset for NYSE, LSE, TSE, or custom)
Shows current breakout status in Bias Table row (ABOVE, BELOW, INSIDE, BUILDING)
Intraday only - auto-disabled on Daily+ charts
ORB is a classic day trading strategy - breakout above opening range often leads to continuation.
Extra Labels:
Change from Open %: Shows how far price has moved from session open (intraday) or daily open (HTF). Green if positive, red if negative.
ADX Badge: Small label at bottom of last bar showing current ADX value. Green when above your minimum threshold, red when below.
RSI Badge: Small label at top of last bar showing current RSI value with zone status (buy zone, sell zone, or neutral).
These labels provide quick at-a-glance confirmation without needing separate indicator windows.
---
8. HOW TO USE THE INDICATOR
Step 1: Add to Chart
Load the indicator on your chosen asset and timeframe
First time: Everything is enabled by default - the chart will look busy
Don't panic - you'll turn off what you don't need
Step 2: Start Simple
Turn OFF everything except:
UT Bot labels (keep these ON)
Bias Table (keep this ON)
Moving Averages (Fast and Medium only)
Suggested Stop Loss and Take Profits
Hide everything else initially. Get comfortable with the basic UT Bot + Bias Table workflow first.
Step 3: Learn the Core Workflow
UT Bot gives a Buy or Sell signal
Check Bias Table AVG column - do you have multi-timeframe alignment?
If yes, enter the trade
Place stop at Suggested Stop Loss line
Scale out at TP levels
Exit on opposite UT signal
Trade this simple system for a week. Get a feel for signal frequency and win rate with your settings.
Step 4: Add Filters Gradually
If you're getting too many losing signals (whipsaws in choppy markets), add filters one at a time:
Try: "Require 2-Bar Trend Confirmation" - wait for 2 bars to confirm direction
Try: ADX filter with minimum threshold - only trade when trend strength is sufficient
Try: RSI pullback filter - only enter on pullbacks, not chasing
Try: Volume filter - require above-average volume
Add one filter, test for a week, evaluate. Repeat.
Step 5: Enable Advanced Features (Optional)
Once you're profitable with the core system, add:
Supertrend for additional trend confirmation
Candlestick patterns for reversal warnings
VWAP for institutional anchor reference
ORB for intraday breakout context
ZLSMA for low-lag trend following
Step 6: Optimize Settings
Every setting has a detailed tooltip explaining what it does and typical values. Hover over any input to read:
What the parameter controls
How it impacts trading
Suggested ranges for scalping, day trading, and swing trading
Start with defaults, then adjust based on your results and style.
Step 7: Set Up Alerts
Right-click chart → Add Alert → Condition: "Luxy Momentum v6" → Choose:
"UT Bot — Buy" for long entries
"UT Bot — Sell" for short entries
"Base Long/Short" for filtered MA cross signals
Optionally enable "Send real-time alert() on UT flip" in settings for immediate notifications.
Common Workflow Variations:
Conservative Trader:
UT signal + Base signal + Candlestick pattern + Bias AVG > 70%
Enter only at major support/resistance
Wider UT sensitivity, multiple filters
Aggressive Trader:
UT signal + Bias AVG > 60%
Enter immediately, no waiting
Tighter UT sensitivity, minimal filters
Swing Trader:
Focus on Daily/Weekly Bias alignment
Ignore intraday noise
Use ORB and PDH/PDL less (or not at all)
Wider stops, patient approach
---
9. PERFORMANCE AND OPTIMIZATION
The indicator is optimized for speed, but with 15+ features running simultaneously, chart load time can add up. Here's how to keep it fast:
Biggest Performance Gains:
Disable Unused Timeframes: In "Time Frames" settings, turn OFF any timeframe you don't actively trade. Each disabled TF saves 10-15% calculation time. If you only day trade 5m, 15m, 1h, disable 1m, 2h, 4h.
Hide Bias Table on Daily+: If you only trade intraday, enable "Hide BIAS table on 1D or above". This skips ALL table calculations on higher timeframes.
Draw UT Visuals Only on Bar Close: Reduces intrabar rendering of SL/TP/Entry lines. Has ZERO impact on logic or alerts - purely visual optimization.
Additional Optimizations:
Turn off VWAP bands if you don't use them
Disable candlestick patterns if you don't trade them
Turn off Supertrend fill if you find it distracting (keep the line)
Reduce "Limit to 10 bars" for SL/TP lines to minimize line objects
Performance Features Built-In:
Smart Caching: Higher timeframe data (3-day bias, weekly bias, etc.) updates once per day, not every bar
Conditional Calculations: Volume filter only calculates when enabled. Swing filter only runs when enabled. Nothing computes if turned off.
Modular Design: Every component is independent. Turn off what you don't need without breaking other features.
Typical Load Times:
5m chart, all features ON, 7 timeframes: ~2-3 seconds
5m chart, core features only, 3 timeframes: ~1 second
1m chart, all features: ~4-5 seconds (many bars to calculate)
If loading takes longer, you likely have too many indicators on the chart total (not just this one).
---
10. FAQ
Q: How is this different from standard UT Bot indicators?
A: Standard UT Bot (originally by @QuantNomad) is just the ATR trailing line and flip signals. This implementation adds:
- Volume weighting and momentum adjustment to the trailing calculation
- Multiple confirmation filters (swing, %, 2-bar, ZLSMA)
- Smart composite stop loss system from multiple S/R layers
- R-multiple take profit system with freeze-on-touch
- Integration with multi-timeframe Bias Table
- Visual audit trail with checkmarks
Q: Can I use this for automated trading?
A: The indicator is designed for discretionary trading. While it has clear signals and alerts, it's not a mechanical system. Context and judgment are required.
Q: Does it repaint?
A: No. All signals respect bar close. UT Bot logic runs intrabar but signals only trigger on confirmed bars. Alerts fire correctly with no lookahead.
Q: Do I need to use all the features?
A: Absolutely not. The indicator is modular. Many profitable traders use just UT Bot + Bias Table + Moving Averages. Start simple, add complexity only if needed.
Q: How do I know which settings to use?
A: Every single input has a detailed tooltip. Hover over any setting to see:
What it does
How it affects trading
Typical values for scalping, day trading, swing trading
Start with defaults, adjust gradually based on results.
Q: Can I use this on crypto 24/7 markets?
A: Yes. ORB will not work (no defined session), but everything else functions normally. Use "Day" anchor for VWAP instead of "Session".
Q: The Bias Table is blank or not showing.
A: Check:
"Show Table" is ON
Table position isn't overlapping another indicator's table (change position)
At least one row is enabled
"Hide BIAS table on 1D or above" is OFF (if on Daily+ chart)
Q: Why are candlestick patterns not appearing?
A: Patterns are relatively rare by design - they only appear at genuine reversal points. Check:
Pattern toggles are ON
"Min candle body %" isn't too high (try 0.05-0.10)
You're looking at a chart with actual reversals (not strong trending market)
Q: UT Bot is too sensitive/not sensitive enough.
A: Adjust "Sensitivity (Key×ATR)". Lower number = tighter stop, more signals. Higher number = wider stop, fewer signals. Read the tooltip for guidance.
Q: Can I get alerts for the Bias Table?
A: The Bias Table is a dashboard for visual analysis, not a signal generator. Set alerts on UT Bot or Base signals, then manually check Bias Table for confirmation.
Q: Does this work on stocks with low volume?
A: Yes, but turn OFF the volume filter. Low volume stocks will never meet relative volume requirements.
Q: How often should I check the Bias Table?
A: Before every entry. It takes 2 seconds to glance at the AVG column and headline rows. This one check can save you from fighting the trend.
Q: What if UT signal and Base signal disagree?
A: UT Bot is more aggressive (ATR trailing). Base signals are more conservative (MA cross + filters). If they disagree, either:
Wait for both to align (safest)
Take the UT signal but with smaller size (aggressive)
Skip the trade (conservative)
There's no "right" answer - depends on your risk tolerance.
---
FINAL NOTES
The indicator gives you an edge. How you use that edge determines results.
For questions, feedback, or support, comment on the indicator page or message the author.
Happy Trading!

SCE Price Action SuiteThis is an indicator designed to use past market data to mark key price action levels as well as provide a different kind of insight. There are 8 different features in the script that users can turn on and off. This description will go in depth on all 8 with chart examples.
#1 Absorption Zones
I defined Absorption Zones as follows.
//----------------------------------------------
//---------------Absorption---------------------
//----------------------------------------------
box absorptionBox = na
absorptionBar = ta.highest(bodySize, absorptionLkb)
bsab = ta.barssince(bool(ta.change(absorptionBar)))
if bsab == 0 and upBar and showAbsorption
absorptionBox := box.new(left = bar_index - 1, top = close, right = bar_index + az_strcuture, bottom = open, border_color = color.rgb(0, 80, 75), border_width = boxLineSize, bgcolor = color.rgb(0, 80, 75))
absorptionBox
else if bsab == 0 and downBar and showAbsorption
absorptionBox := box.new(left = bar_index - 1, top = close, right = bar_index + az_strcuture, bottom = open, border_color = color.rgb(105, 15, 15), border_width = boxLineSize, bgcolor = color.rgb(105, 15, 15))
absorptionBox
What this means is that absorption bars are defined as the bars with the largest bodies over a selected lookback period. Those large bodies represent areas where price may react. I was inspired by the concept of a Fair Value Gap for this concept. In that body price may enter to be a point of support or resistance, market participants get “absorbed” in the area so price can continue in whichever direction.
#2 Candle Wick Theory/Strategy
I defined Candle Wick Theory/Strategy as follows.
//----------------------------------------------
//---------------Candle Wick--------------------
//----------------------------------------------
highWick = upBar ? high - close : downBar ? high - open : na
lowWick = upBar ? open - low : downBar ? close - low : na
upWick = upBar ? close + highWick : downBar ? open + highWick : na
downWick = upBar ? open - lowWick : downBar ? close - lowWick : na
downDelivery = upBar and downBar and high > upWick and highWick > lowWick and totalSize > totalSize and barstate.isconfirmed and session.ismarket
upDelivery = downBar and upBar and low < downWick and highWick < lowWick and totalSize > totalSize and barstate.isconfirmed and session.ismarket
line lG = na
line lE = na
line lR = na
bodyMidpoint = math.abs(body) / 2
upWickMidpoint = math.abs(upWickSize) / 2
downWickkMidpoint = math.abs(downWickSize) / 2
if upDelivery and showCdTheory
cpE = chart.point.new(time, bar_index - 1, downWickkMidpoint)
cpE2 = chart.point.new(time, bar_index + bl, downWickkMidpoint)
cpG = chart.point.new(time, bar_index + bl, downWickkMidpoint * (1 + tp))
cpR = chart.point.new(time, bar_index + bl, downWickkMidpoint * (1 - sl))
cpG1 = chart.point.new(time, bar_index - 1, downWickkMidpoint * (1 + tp))
cpR1 = chart.point.new(time, bar_index - 1, downWickkMidpoint * (1 - sl))
lG := line.new(cpG1, cpG, xloc.bar_index, extend.none, color.green, line.style_solid, 1)
lE := line.new(cpE, cpE2, xloc.bar_index, extend.none, color.white, line.style_solid, 1)
lR := line.new(cpR1, cpR, xloc.bar_index, extend.none, color.red, line.style_solid, 1)
lR
else if downDelivery and showCdTheory
cpE = chart.point.new(time, bar_index - 1, upWickMidpoint)
cpE2 = chart.point.new(time, bar_index + bl, upWickMidpoint)
cpG = chart.point.new(time, bar_index + bl, upWickMidpoint * (1 - tp))
cpR = chart.point.new(time, bar_index + bl, upWickMidpoint * (1 + sl))
cpG1 = chart.point.new(time, bar_index - 1, upWickMidpoint * (1 - tp))
cpR1 = chart.point.new(time, bar_index - 1, upWickMidpoint * (1 + sl))
lG := line.new(cpG1, cpG, xloc.bar_index, extend.none, color.green, line.style_solid, 1)
lE := line.new(cpE, cpE2, xloc.bar_index, extend.none, color.white, line.style_solid, 1)
lR := line.new(cpR1, cpR, xloc.bar_index, extend.none, color.red, line.style_solid, 1)
lR
First I get the size of the wicks for the top and bottoms of the candles. This depends on if the bar is red or green. If the bar is green the wick is the high minus the close, if red the high minus the open, and so on. Next, the script defines the upper and lower bounds of the wicks for further comparison. If the candle is green, it's the open price minus the bottom wick. If the candle is red, it's the close price minus the bottom wick, and so on. Next we have the condition for when this strategy is present.
Down delivery:
Occurs when the previous candle is green, the current candle is red, and:
The high of the current candle is above the upper wick of the previous candle.
The size of the current candle's top wick is greater than its bottom wick.
The total size of the previous candle is greater than the total size of the current candle.
The current bar is confirmed (barstate.isconfirmed).
The session is during market hours (session.ismarket).
Up delivery:
Occurs when the previous candle is red, the current candle is green, and:
The low of the current candle is below the lower wick of the previous candle.
The size of the current candle's bottom wick is greater than its top wick.
The total size of the previous candle is greater than the total size of the current candle.
The current bar is confirmed.
The session is during market hours
Then risk is plotted from the percentage that users can input from an ideal entry spot.
#3 Candle Size Theory
I defined Candle Size Theory as follows.
//----------------------------------------------
//---------------Candle displacement------------
//----------------------------------------------
line lECD = na
notableDown = bodySize > bodySize * candle_size_sensitivity and downBar and session.ismarket and barstate.isconfirmed
notableUp = bodySize > bodySize * candle_size_sensitivity and upBar and session.ismarket and barstate.isconfirmed
if notableUp and showCdSizeTheory
cpE = chart.point.new(time, bar_index - 1, close)
cpE2 = chart.point.new(time, bar_index + bl_strcuture, close)
lECD := line.new(cpE, cpE2, xloc.bar_index, extend.none, color.rgb(0, 80, 75), line.style_solid, 3)
lECD
else if notableDown and showCdSizeTheory
cpE = chart.point.new(time, bar_index - 1, close)
cpE2 = chart.point.new(time, bar_index + bl_strcuture, close)
lECD := line.new(cpE, cpE2, xloc.bar_index, extend.none, color.rgb(105, 15, 15), line.style_solid, 3)
lECD
This plots candles that are “notable” or out of the ordinary. Candles that are larger than the last by a value users get to specify. These candles' highs or lows, if they are green or red, act as levels for support or resistance.
#4 Candle Structure Theory
I defined Candle Structure Theory as follows.
//----------------------------------------------
//---------------Structure----------------------
//----------------------------------------------
breakDownStructure = low < low and low < low and high > high and upBar and downBar and upBar and downBar and session.ismarket and barstate.isconfirmed
breakUpStructure = low > low and low > low and high < high and downBar and upBar and downBar and upBar and session.ismarket and barstate.isconfirmed
if breakUpStructure and showStructureTheory
cpE = chart.point.new(time, bar_index - 1, close)
cpE2 = chart.point.new(time, bar_index + bl_strcuture, close)
lE := line.new(cpE, cpE2, xloc.bar_index, extend.none, color.teal, line.style_solid, 3)
lE
else if breakDownStructure and showStructureTheory
cpE = chart.point.new(time, bar_index - 1, open)
cpE2 = chart.point.new(time, bar_index + bl_strcuture, open)
lE := line.new(cpE, cpE2, xloc.bar_index, extend.none, color.red, line.style_solid, 3)
lE
It is a series of candles to create a notable event. 2 lower lows in a row, a lower high, then green bar, red bar, green bar is a structure for a breakdown. 2 higher lows in a row, a higher high, red bar, green bar, red bar for a break up.
#5 Candle Swing Structure Theory
I defined Candle Swing Structure Theory as follows.
//----------------------------------------------
//---------------Swing Structure----------------
//----------------------------------------------
line htb = na
line ltb = na
if totalSize * swing_struct_sense < totalSize and upBar and downBar and high > high and showSwingSturcture and session.ismarket and barstate.isconfirmed
cpS = chart.point.new(time, bar_index - 1, high)
cpE = chart.point.new(time, bar_index + bl_strcuture, high)
htb := line.new(cpS, cpE, xloc.bar_index, color = color.red, style = line.style_dashed)
htb
else if totalSize * swing_struct_sense < totalSize and downBar and upBar and low > low and showSwingSturcture and session.ismarket and barstate.isconfirmed
cpS = chart.point.new(time, bar_index - 1, low)
cpE = chart.point.new(time, bar_index + bl_strcuture, low)
ltb := line.new(cpS, cpE, xloc.bar_index, color = color.teal, style = line.style_dashed)
ltb
A bearish swing structure is defined as the last candle’s total size, times a scalar that the user can input, is less than the current candles. Like a size imbalance. The last bar must be green and this one red. The last high should also be less than this high. For a bullish swing structure the same size imbalance must be present, but we need a red bar then a green bar, and the last low higher than the current low.
#6 Fractal Boxes
I define the Fractal Boxes as follows
//----------------------------------------------
//---------------Fractal Boxes------------------
//----------------------------------------------
box b = na
int indexx = na
if bar_index % (n * 2) == 0 and session.ismarket and showBoxes
b := box.new(left = bar_index, top = topBox, right = bar_index + n, bottom = bottomBox, border_color = color.rgb(105, 15, 15), border_width = boxLineSize, bgcolor = na)
indexx := bar_index + 1
indexx
The idea of this strategy is that the market is fractal. It is considered impossible to be able to tell apart two different time frames from just the chart. So inside the chart there are many many breakouts and breakdowns happening as price bounces around. The boxes are there to give you the view from your timeframe if the market is in a range from a time frame that would be higher than it. Like if we are inside what a larger time frame candle’s range. If we break out or down from this, we might be able to trade it. Users can specify a lookback period and the box is that period’s, as an interval, high and low. I say as an interval because it is plotted every n * 2 bars. So we get a box, price moves, then a new box.
#7 Potential Move Width
I define the Potential Move Width as follows
//----------------------------------------------
//---------------Move width---------------------
//----------------------------------------------
velocity = V(n)
line lC = na
line l = na
line l2 = na
line l3 = na
line l4 = na
line l5 = na
line l6 = na
line l7 = na
line l8 = na
line lGFractal = na
line lRFractal = na
cp2 = chart.point.new(time, bar_index + n, close + velocity)
cp3 = chart.point.new(time, bar_index + n, close - velocity)
cp4 = chart.point.new(time, bar_index + n, close + velocity * 5)
cp5 = chart.point.new(time, bar_index + n, close - velocity * 5)
cp6 = chart.point.new(time, bar_index + n, close + velocity * 10)
cp7 = chart.point.new(time, bar_index + n, close - velocity * 10)
cp8 = chart.point.new(time, bar_index + n, close + velocity * 15)
cp9 = chart.point.new(time, bar_index + n, close - velocity * 15)
cpG = chart.point.new(time, bar_index + n, close + R)
cpR = chart.point.new(time, bar_index + n, close - R)
if ((bar_index + n) * 2 - bar_index) % n == 0 and session.ismarket and barstate.isconfirmed and showPredictionWidtn
cp = chart.point.new(time, bar_index, close)
cpG1 = chart.point.new(time, bar_index, close + R)
cpR1 = chart.point.new(time, bar_index, close - R)
l := line.new(cp, cp2, xloc.bar_index, extend.none, color.aqua, line.style_solid, 1)
l2 := line.new(cp, cp3, xloc.bar_index, extend.none, color.aqua, line.style_solid, 1)
l3 := line.new(cp, cp4, xloc.bar_index, extend.none, color.red, line.style_solid, 1)
l4 := line.new(cp, cp5, xloc.bar_index, extend.none, color.red, line.style_solid, 1)
l5 := line.new(cp, cp6, xloc.bar_index, extend.none, color.teal, line.style_solid, 1)
l6 := line.new(cp, cp7, xloc.bar_index, extend.none, color.teal, line.style_solid, 1)
l7 := line.new(cp, cp8, xloc.bar_index, extend.none, color.blue, line.style_solid, 1)
l8 := line.new(cp, cp9, xloc.bar_index, extend.none, color.blue, line.style_solid, 1)
l8
By using the past n bar’s velocity, or directional speed, every n * 2 bars. I can use it to scale the close value and get an estimate for how wide the next moves might be.
#8 Linear regression
//----------------------------------------------
//---------------Linear Regression--------------
//----------------------------------------------
lr = showLR ? ta.linreg(close, n, 0) : na
plot(lr, 'Linear Regression', color.blue)
I used TradingView’s built in linear regression to not reinvent the wheel. This is present to see past market strength of weakness from a different perspective.
User input
Users can control a lot about this script. For the strategy based plots you can enter what you want the risk to be in percentages. So the default 0.01 is 1%. You can also control how far forward the line goes.
Look back at where it is needed as well as line width for the Fractal Boxes are controllable. Also users can check on and off what they would like to see on the charts.
No indicator is 100% reliable, do not follow this one blindly. I encourage traders to make their own decisions and not trade solely based on technical indicators. I encourage constructive criticism in the comments below. Thank you.

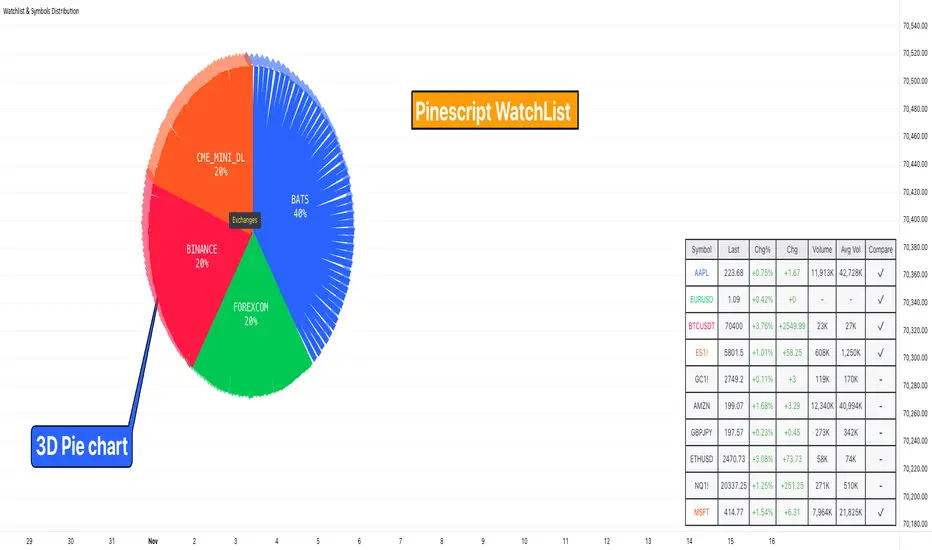
Watchlist & Symbols Distribution [Daveatt]TLDR;
I got bored so I just coded the TradingView watchlist interface in Pinescript :)
TLDR 2:
Sharing it open-source what took me 1 full day to code - haven't coded in Pinescript in a long time, so I'm a bit slow for now :)
█ OVERVIEW
This script offers a comprehensive market analysis tool inspired by TradingView's native watchlist interface features.
It combines an interactive watchlist with powerful distribution visualization capabilities and a performance comparison panel.
The script was developed with a focus on providing multiple visualization methods while working within PineScript's limitations.
█ DEVELOPMENT BACKGROUND
The pie chart implementation was greatly inspired by the ( "Crypto Map Dashboard" script / )
adapting its circular visualization technique to create dynamic distribution charts. However, due to PineScript's 500-line limitation per script, I had to optimize the code to allow users to switch between pie chart analysis and performance comparison modes rather than displaying both simultaneously.
█ SETUP AND DISPLAY
For optimal visualization, users need to adjust the chart's display settings manually.
This involves:
Expanding the indicator window vertically to accommodate both the watchlist and graphical elements
Adjusting the Y-axis scale by dragging it to ensure proper spacing for the comparison panel grid
Modifying the X-axis scale to achieve the desired time window display
Fine-tuning these adjustments whenever switching between pie chart and comparison panel modes
These manual adjustments are necessary due to PineScript's limitations in controlling chart scaling programmatically. While this requires some initial setup, it allows users to customize the display to their preferred viewing proportions.
█ MAIN FEATURES
Distribution Analysis
The script provides three distinct distribution visualization modes through a pie chart.
Users can analyze their symbols by exchanges, asset types (such as Crypto, Forex, Futures), or market sectors.
If you can't see it well at first, adjust your chart scaling until it's displayed nicely.
Asset Exchanges
www.tradingview.com
Asset Types
Asset Sectors
The pie charts feature an optional 3D effect with adjustable depth and angle parameters. To enhance visual customization, four different color schemes are available: Default, Pastel, Dark, and Neon.
Each segment of the pie chart includes interactive tooltips that can be configured to show different levels of detail. Importantly, the pie chart only visualizes the distribution of selected assets (those marked with a checkmark in the watchlist), providing a focused view of the user's current interests.
Interactive Watchlist
The watchlist component displays real-time data for up to 10 user-defined symbols. Each entry shows current price, price changes (both absolute and percentage), volume metrics, and a comparison toggle.
The table is dynamically updated and features color-coded entries that correspond to their respective performance lines in the comparison chart. The watchlist serves as both an information display and a control panel for the comparison feature.
Performance Comparison
One of the script's most innovative features is its performance comparison panel.
Using polylines for smooth visualization, it tracks the 30-day performance of selected symbols relative to a 0% baseline.
The comparison chart includes a sophisticated grid system with 5% intervals and a dynamic legend showing current performance values.
The polyline implementation allows for fluid, continuous lines that accurately represent price movements, providing a more refined visual experience than traditional line plots. Like the pie charts, the comparison panel only displays performance lines for symbols that have been selected in the watchlist, allowing users to focus on their specific assets of interest.
█ TECHNICAL IMPLEMENTATION
The script utilizes several advanced PineScript features:
Dynamic array management for symbol tracking
Polyline-based charting for smooth performance visualization
Real-time data processing with security calls
Interactive tooltips and labels
Optimized drawing routines to maintain performance
Selective visualization based on user choices
█ CUSTOMIZATION
Users can personalize almost every aspect of the script:
Symbol selection and comparison preferences
Visual theme selection with four distinct color schemes
Pie chart dimensions and positioning
Tooltip information density
Component visibility toggles
█ LIMITATIONS
The primary limitation stems from PineScript's 500-line restriction per script.
This constraint necessitated the implementation of a mode-switching system between pie charts and the comparison panel, as displaying both simultaneously would exceed the line limit. Additionally, the script relies on manual chart scale adjustments, as PineScript doesn't provide direct control over chart scaling when overlay=false is enabled.
However, these limitations led to a more focused and efficient design approach that gives users control over their viewing experience.
█ CONCLUSION
All those tools exist in the native TradingView watchlist interface and they're better than what I just did.
However, now it exists in Pinescript... so I believe it's a win lol :)
deKoder | Structural Flow [SF]deKoder | SF | Structural Flow - Swing/Pivot Structure Charting
Strips away the noise of standard candlestick charts and reveals the true underlying swing structure through clean, connected pivot lines.
Beneath the storm of wicks / Silent structure whispers truth
Extreme Noise Reduction
Replaces cluttered price action with a minimalist pivot based line chart. The user-defined Window length lets you control sensitivity: shorter for more detail on lower timeframes, longer for cleaner structure on higher timeframes.
Accurate Swing Detection
Only stronger pivots are accepted. Weaker same side pivots are ignored, preserving the true extreme highs and lows without distortion.
Real Time Extension
The final incomplete leg dynamically follows the current close until the next confirmed pivot forms.
Optional Directional Colouring
Enable Directional Colouring to automatically colour confirmed legs with the user defined bull and bear colours on upward and downward swings.
Adjustable Background Candles
Candles with adjustable transparency may be displayed on the chart. Adjust the visibility setting to find the perfect balance between full raw candle data and clean structure
Practical Uses
Instantly reveals classic chart patterns — head & shoulders, double tops/bottoms, triangles, flags with unmistakable clarity
Becomes simple to spot Wyckoff springs, upthrusts, and phase transitions inside trading ranges
Provides a clean foundation for manual Elliott Wave counting . Clear swing structure makes labeling impulses and corrections much easier
Makes trend changes and potential reversals stand out without second-guessing every wick
Excellent for higher-timeframe structural analysis — the longer window setting produces exceptionally clean swing views
Ideal for creating clean educational screenshots and annotated posts - the chart speaks for itself
Reduces emotional noise by shifting focus from every candle to meaningful swing structure
Well suited for swing and price action traders, Wyckoff and Elliott Wave analysis, and anyone who prefers calm, uncluttered charts over constant visual chaos.
Clean charts. Clear sight.
☠ FR33FA11 | deKoder ☠
Released January 2025 | Open Source
If this open-source script (or any of its free companions) has saved you time or helped you read the market better, a coffee or a few sats helps to keep the Pine coming ❤️
Solana: 2N8HWPAHSC7Z8SLyneMrZp234UAP9HCtQX7wNXw7LKQC
Ethereum: 0xE770D254DC579d1db7bA2fe74376b7009527356B
Bitcoin: bc1qd8j3awht5yrjtnvt5dagxldzhaesc83sftype3
Polygon: 0xE770D254DC579d1db7bA2fe74376b7009527356B
Hype: 0xE770D254DC579d1db7bA2fe74376b7009527356B
