Volume Delta Methods (Chart) [LuxAlgo]The Volume Delta Methods (Chart) aims at highlighting the relationship between Buying or Selling Pressure and Price by presenting Volume Delta , and multiple derivatives of volume delta such as Cumulative Volume Delta (CVD) , Buy/Sell Volume , Total Volume , etc on top of the Main Price Chart .
The script uses two different intrabar (chart bars at a lower timeframe than the chart's) analyses to achieve the most approximate calculation of the volume delta and offers fully customizable visualization features using various types of charts such as line, area, baseline, candles, and histograms.
The script allows traders to see "within" the price bar, provides more transparency over a traditional volume histogram, and also allows users to monitor price and volume activity together.
🔶 USAGE
Volume delta is the difference between the buying volume and the selling volume, in other words, it is the net demand at a given bar allowing traders a more detailed insight when analyzing the market sentiment. A volume delta greater than 0 indicates more buying than selling pressure, whereas a volume delta less than 0 indicates more selling than buying pressure.
Volume delta plus total volume (regular volume) adds additional insight, where the total volume represents all the recorded trades for security that occurs in a given time interval. It is a measurement of the participation, enthusiasm, and interest in a given security.
Divergences occur when the polarity of the volume delta does not match the polarity of the price bar.
The users can enable the display of the numerical values of the volume delta.
Cumulative Volume Delta (CVD) is a way of using Volume Delta to measure an asset’s mid-to-long-term buy and sell pressure. It compares buying and selling volume over time and offers insights into market behavior at specific price points. Cumulative Volume Delta is effectively a continuation of the principles of Volume Delta but involves longer time periods and offers different trading signals.
Like the Volume Delta, the Cumulative Volume Delta (CVD) indicator measures the relationship between buy and sell pressure but does not focus on one specific candle in particular. Rather, the Cumulative Volume Delta takes the relative differences and combines them all over an extended time period.
Users have the ability Cumulative Volume Delta in various types of charts along with an optional smoothing line.
Placed above price bars options.
Interacting with price bar options helps to better identify CVD Divergences.
CVD Divergences
CVD reveals buying and selling trends that may or may not complement the price trend of the asset itself. Sometimes, price trends can run in contrast to trading behavior — sell volume can be dominant while the spot price is rising, and vice versa.
🔶 DETAILS
Theoretically, volume delta is calculated by taking the difference between the volume that traded at the ask price and the volume that traded at the bid price. The most precise calculation method uses tick data but requires huge amounts of data on historical bars, which usually limits the historical depth of charts. This indicator uses two different intrabar analysis methods for the volume delta calculation, where intrabars are chart bars at a lower timeframe than the chart's timeframe:
The logic used to assign intrabar volume to the "up" or "down".
- Buying/Selling pressure of the intrabar option (default)
(close - low) > (high - close) => UP
(close - low) < (high - close) => DOWN
(close - low) = (high - close) => close - previous close is used
- Polarity of the intrabar option
close > open => UP
close < open => DOWN
close = open => close - previous close is used
🔶 SETTINGS
The script takes into account user-defined parameters and performs calculations and presentations based on them, where detailed usage for each user-defined input parameter in indicator settings is provided with the related input's tooltip.
🔹 Calculation Settings
Calculation Method: Calculation method selection, available options 'Intrabar Buying/Selling Pressure' or 'Intrabar Polarity'.
Lower Timeframe Precision: Sets indicator precision, default option is 'Auto'.
🔹 Presentation Settings
Volume Delta: Toggles the visibility of the Volume Delta
Cumulative Volume Delta: Toggles the visibility of the Cumulative Volume Delta
Volume Delta/Price Bar Divergences: Toggles the visibility of the Volume Delta Divergences
Volume Delta Numerical Values: Toggles the visibility of the Volume Delta Numerical Values
🔹 Other Features
Volume MA: Toggles the visibility of the Volume Moving Average
CVD Smoothing: Toggles the visibility of the Cumulative Volume Delta's Smoothing Line
🔹 Volume Delta, Others
Volume Delta: Positive, Negative: Volume Delta color customization options
Volume Histogram: Growing, Falling: Volume Histogram color customization options
Display Length: Length of the visual objects presented with this indicator
Volume Delta Height: Volume delta height customization options
Volume Histogram Height: Volume histogram height customization options
Vertical Offset: Volume delta and histogram vertical positioning customization options
🔹 Cumulative Volume Delta, Others
CVD Line, Width, and Color: Cumulative Volume Delta - Line Width and Color customization options
CVD Area/Baseline, Gradient Coloring: Cumulative Volume Delta - Area and Baseline background gradient coloring customization options
CVD Candles Color, Positive, and Negative: Cumulative Volume Delta - Candles coloring customization options
CVD/Smoothing Background: Highlights and adjusts the transparency of the area between the Cumulative Volume Delta Line and it's Smoothing Line
🔶 RELATED SCRIPTS
Liquidity-Sentiment-Profile
EquiVolume
Volume-Footprint
ابحث في النصوص البرمجية عن "charts"

LNL Scalper ArrowsLNL Scalper Arrows
The indicator consist of various different types of candlestick patterns that are truly time tested by multiple veteran traders. These arrows are a combination of short-term scalping strategies taught by Linda Raschke & a trader that goes by name Quant Trade Edge. These strategies/patterns occur regularly within the markets. They offer high probability quick moves during the trending days. These four patterns are based on pure price action, no oscillators, no trend, no momentum indicators involved. Trend (ema) is there just as a simple trend gauge.
LNL Scalper Arrows were designed specifically for intra-day trading. Mostly useful for the futures but also stocks as well. These arrows can work anywhere between the fast-moving 512 or 1600 tick charts to a 1min, 2min and up to 5min or 10min charts.
Trend Gauge (Exponential Moving Average)
Nothing fancy just a classic EMA that can guide the direction of the short-term trend. I have added a custom coloring of the EMA that is based on a simple RSI filter. That should help to visualize the non-directional moments within the trend. Although the length is adjustable, for scalping it is better to focus on smaller periods such as 9, 13 or 20 or 34 but anything above 50 loses its purpose as a short-term trend gauge. Again, this is a scalping tool not a trend tool, you are not going to get rid of the fakeouts by increasing the period of the trend.
Tail Arrows (Eat the Tail Pattern)
Tail is a candlestick that is either a price rejection spike, or a flag continuation pattern on a lower time frame. A failed action. It is basically a candle with much bigger wick (shadow) of the candle than the actual body. Such candles are usually telling us about strong participation from the other side of the market. Eat the tail pattern occurs whenever the low of the Tail candle is immediately broken on a following candle "the tail is eaten alive". Such a breaks occurs in a most aggressive types of markets with a strong momentum. DO NOT try to trade this in a low volume or a ranging market. Tail Arrows are the most aggressive arrows & should be only used on the highest volume or a parabolic momentum markets.
Scalp Arrows (Scallop Pattern)
Known as Scallops or minor lows or highs, these patterns are the most common within the all scalper arrows. They occur regularly on 1min & 5min charts - basically everyday. Scallops provide the best possible risk to reward entry within the trend without the need of any indicators or oscillators. The Scallop Up 3 bar pattern consist of a high that is lower that the previous high but also low that is lower than the previous low. Scallop Up or a minor low triggers when the last high is broken, creating a three bar mountain or a peak within the 5 bar span.
Hoagie Arrows (Hoagie Pattern)
Hoagies occur way less often than any other scalping patterns. Hoagies represent two (or more) inside candles within the shadow of a first candle. Such a formation is creating a small compression or a range that sooner or later breaks out. The hoagie is triggered whenever the high or low of the shadow (first) candle is broken. The great thing about the hoagies is that they can work either way despite the trend direction. Although this indicator is coded for the 2 bar hoagies, there are no limitations on how much inside bars can hoagie include.
Umbrella Arrows (Umbrella Pattern)
Another really awesome 3 bar pattern that is really fun to trade. Umbrella occurs when the candle before the previous candle is a pin bar or a tail bar and the body of the previous candle is within the shadow or a wick of the candle before. The umbrella is triggered once the high or low of the previous bar is broken. Umbrellas are more frequent than Hoagies but occur much less than the Scallops.
Outside Bar Wedges (Outside Bar Pattern)
Pretty much self-explanatory candlestick pattern. Outside Bar is basically any bar that peaks outside of the both ends of the previous candle. So the range of the candle is higher & it looked beyond the high and beyond the low of the previous candle. These candles are signalizing the potenial momentum change. Ouside Bars usually occur at the tops or bottoms of the moves. I decided to add them because they can serve as a great addition to these scalping patterns.
Signal vs. SignalBreak Mode
The trigger can be viewed in two different ways:
1. Signal: Plots the trigger before the trigger bar, basically right when the pattern is formed but NOT YET triggered. The signal is triggered once the next candle break the high or low of the current candle.
2. SignalBrake: Plots the trigger after the break of the high or low of the actual pattern. It is basically a candle after the signal candle. (Signal is better for trading because it gives you time to prepare for the actual break of the high or low = the actual signal. SignalBrake is great for looking back in history only for the patterns that actually traded).
Pin Bar BTW Ratio
Pin Bar (Body-To-Wick) Ratio represents the size of the body of a pin bar candle for Eat the Tail and Umbrella patterns. Pin Bar BTW Ratio measures the ratio between the wick & the body of the candle. Ref. interval is 2.0 - 5.0 (ideal pin bar is 2.0 - 3.0 = the wick or a shadow is 2x - 3x bigger than the body of the candle)
ATR Stop & Target Labels
I also created three simple labels (tables) that can show you the ideal target & stop as well as the current ATR. Since LNL Scalper Arrows consist of high probability scalping patterns, a good rule of thumb to follow is to use a half of the current ATR as a target and a current ATR as a stop (or two times the target). So if the current 7 period ATR is 30 the target would be 15 pts. and a stop around 30 pts. With such a risk management you should aim for a win rate 70% or higher. Obviously you can adjust the risk management in the settings to your personal preference.
Low Range vs. High Range Markets
There are two major downsides with the Scalper Arrows:
1. You need volume and a volatility. These patterns really do struggle in ranging "boring" sideways action. It is absolutely crucial to recognize the current market environment and really stay cautions and (or completely out) in case the chop continues. Adding something like DMI can help you recognize the potential flat markets.
2. Not only do you need volume & momentum, you also need a decent range. This indicator works better on a rangy market such as NQ futures or YM. But are much tougher to trade on lower range markets such as some stocks or ZB futures or basically any other lower range market.
Hope it helps.

Optimized Zhaocaijinbao strategyIntroduction:
The Optimized Zhaocaijinbao strategy is a mid and long-term quantitative trading strategy that combines momentum and trend factors. It generates buy and sell signals by using a combination of exponential moving averages, moving averages, volume and slope indicators. It generates buy signals when the stock is above the 35-day moving average, the trading volume is higher than the 20-day moving average, and the stock is in an upward trend on a weekly timeframe."招财进宝" is a Chinese phrase that can be translated to "Attract Wealth and Bring in Treasure" in English. It is a common expression used to wish for good luck and prosperity in various contexts, such as in business or personal finances.
Highlights:
The strategy has several special optimizations that make it unique.
Firstly, the strategy is optimized for T+1 trading in the Chinese stock market and is only suitable for long positions. The optimizations are also applicable to international stock markets.
Secondly, the trend strategy is optimized to only show indicators on the right side and oscillations. This helps to prevent false signals in choppy markets.
Thirdly, the strategy uses a risk factor for dynamic position sizing to ensure position sizes are adjusted according to the current net asset value and risk preferences. This helps to lower drawdown risks.
The strategy has good resilience even without using stop loss modules in backtesting, making it suitable for trading hourly, 2-hourly, and daily K-line charts (depending on the stock being traded). We recommend experimenting with backtesting using SSE 1-hour or 2-hour or daily Kline charts.
Backtesting outcomes:
The strategy was backtested over the period from October 13th, 2005 to April 14th, 2023, using daily candlestick charts for the commodity code SSE:600763, with a currency of CNY and tick size of 0.01. The strategy used an initial capital of 1,000,000 CNY, with order sizes set to 10% equity and a pyramid of 1 order. The strategy also had a Max Position Size of 0.01 and a Risk Factor of 2.
Here is a summary of the performance of the trading strategy:
Total net profit: 288,577.32 CNY, representing a return of 128.86%
Total number of closed trades: 61
Winning trades: 37, representing a win rate of 60.66%
Profit factor: 2.415
Largest losing trade: 222,021.46 CNY, representing a loss of 14.08%
Average trade: 21,124.22 CNY, representing a return of 3.1%
Average holding period for all trades: 12 days
Conclusion:
In conclusion, the Optimized Zhaocaijinbao strategy is a mid and long-term quantitative trading strategy that combines momentum and trend factors. It is suitable for both Chinese stocks and global stocks. While the Optimized Zhaocaijinbao strategy has performed well in backtesting, it is important to note that past performance is not a guarantee of future results. Traders should conduct their own research and analysis and exercise caution when using any trading strategy.

Advanced VWAP_Pullback Strategy_Trend-Template QualifierGeneral Description and Unique Features of this Script
Introducing the Advanced VWAP Momentum-Pullback Strategy (long-only) that offers several unique features:
1. Our script/strategy utilizes Mark Minervini's Trend-Template as a qualifier for identifying stocks and other financial securities in confirmed uptrends. Mark Minervini, a 2x US Investment Champion, developed the Trend-Template, which covers eight different and independent characteristics that can be adjusted and optimized in this trend-following strategy to ensure the best results. The strategy will only trigger buy-signals in case the optimized qualifiers are being met.
2. Our strategy is based on the supply/demand balance in the market, making it timeless and effective across all timeframes. Whether you are day trading using 1- or 5-min charts or swing-trading using daily charts, this strategy can be applied and works very well.
3. We have also integrated technical indicators such as the RSI and the MA / VWAP crossover into this strategy to identify low-risk pullback entries in the context of confirmed uptrends. By doing so, the risk profile of this strategy and drawdowns are being reduced to an absolute minimum.
Minervini’s Trend-Template and the ‘Stage-Analysis’ of the Markets
This strategy is a so-called 'long-only' strategy. This means that we only take long positions, short positions are not considered.
The best market environment for such strategies are periods of stable upward trends in the so-called stage 2 - uptrend.
In stable upward trends, we increase our market exposure and risk.
In sideways markets and downward trends or bear markets, we reduce our exposure very quickly or go 100% to cash and wait for the markets to recover and improve. This allows us to avoid major losses and drawdowns.
This simple rule gives us a significant advantage over most undisciplined traders and amateurs!
'The Trend is your Friend'. This is a very old but true quote.
What's behind it???
• 98% of stocks made their biggest gains in a Phase 2 upward trend.
• If a stock is in a stable uptrend, this is evidence that larger institutions are buying the stock sustainably.
• By focusing on stocks that are in a stable uptrend, the chances of profit are significantly increased.
• In a stable uptrend, investors know exactly what to expect from further price developments. This makes it possible to locate low-risk entry points.
The goal is not to buy at the lowest price – the goal is to buy at the right price!
Each stock goes through the same maturity cycle – it starts at stage 1 and ends at stage 4
Stage 1 – Neglect Phase – Consolidation
Stage 2 – Progressive Phase – Accumulation
Stage 3 – Topping Phase – Distribution
Stage 4 – Downtrend – Capitulation
This strategy focuses on identifying stocks in confirmed stage 2 uptrends. This in itself gives us an advantage over long-term investors and less professional traders.
By focusing on stocks in a stage 2 uptrend, we avoid losses in downtrends (stage 4) or less profitable consolidation phases (stages 1 and 3). We are fully invested and put our money to work for us, and we are fully invested when stocks are in their stage 2 uptrends.
But how can we use technical chart analysis to find stocks that are in a stable stage 2 uptrend?
Mark Minervini has developed the so-called 'trend template' for this purpose. This is an essential part of our JS-TechTrading pullback strategy. For our watchlists, only those individual values that meet the tough requirements of Minervini's trend template are eligible.
The Trend Template
• 200d MA increasing over a period of at least 1 month, better 4-5 months or longer
• 150d MA above 200d MA
• 50d MA above 150d MA and 200d MA
• Course above 50d MA, 150d MA and 200d MA
• Ideally, the 50d MA is increasing over at least 1 month
• Price at least 25% above the 52w low
• Price within 25% of 52w high
• High relative strength according to IBD.
NOTE: In this basic version of the script, the Trend-Template has to be used as a separate indicator on TradingView (Public Trend-Template indicators are available in TradingView – community scripts). It is recommended to only execute buy signals in case the stock or financial security is in a stage 2 uptrend, which means that the criteria of the trend-template are fulfilled.
This strategy can be applied to all timeframes from 5 min to daily.
The VWAP Momentum-Pullback Strategy
For the JS-TechTrading VWAP Momentum-Pullback Strategy, only stocks and other financial instruments that meet the selected criteria of Mark Minervini's trend template are recommended for algorithmic trading with this startegy.
A further prerequisite for generating a buy signals is that the individual value is in a short-term oversold state (RSI).
When the selling pressure is over and the continuation of the uptrend can be confirmed by the MA / VWAP crossover after reaching a price low, a buy signal is issued by this strategy.
Stop-loss limits and profit targets can be set variably. You also have the option to make use of the trailing stop exit strategy.
Relative Strength Index (RSI)
The Relative Strength Index (RSI) is a technical indicator developed by Welles Wilder in 1978. The RSI is used to perform a market value analysis and identify the strength of a trend as well as overbought and oversold conditions. The indicator is calculated on a scale from 0 to 100 and shows how much an asset has risen or fallen relative to its own price in recent periods.
The RSI is calculated as the ratio of average profits to average losses over a certain period of time. A high value of the RSI indicates an overbought situation, while a low value indicates an oversold situation. Typically, a value > 70 is considered an overbought threshold and a value < 30 is considered an oversold threshold. A value above 70 signals that a single value may be overvalued and a decrease in price is likely , while a value below 30 signals that a single value may be undervalued and an increase in price is likely.
For example, let's say you're watching a stock XYZ. After a prolonged falling movement, the RSI value of this stock has fallen to 26. This means that the stock is oversold and that it is time for a potential recovery. Therefore, a trader might decide to buy this stock in the hope that it will rise again soon.
The MA / VWAP Crossover Trading Strategy
This strategy combines two popular technical indicators: the Moving Average (MA) and the Volume Weighted Average Price (VWAP). The MA VWAP crossover strategy is used to identify potential trend reversals and entry/exit points in the market.
The VWAP is calculated by taking the average price of an asset for a given period, weighted by the volume traded at each price level. The MA, on the other hand, is calculated by taking the average price of an asset over a specified number of periods. When the MA crosses above the VWAP, it suggests that buying pressure is increasing, and it may be a good time to enter a long position. When the MA crosses below the VWAP, it suggests that selling pressure is increasing, and it may be a good time to exit a long position or enter a short position.
Traders typically use the MA VWAP crossover strategy in conjunction with other technical indicators and fundamental analysis to make more informed trading decisions. As with any trading strategy, it is important to carefully consider the risks and potential rewards before making any trades.
This strategy is applicable to all timeframes and the relevant parameters for the underlying indicators (RSI and MA/VWAP) can be adjusted and optimized as needed.
Backtesting
Backtesting gives outstanding results on all timeframes and drawdowns can be reduced to a minimum level. In this example, the hourly chart for MCFT has been used.
Settings for backtesting are:
- Period from Jan 2020 until March 2023
- Starting capital 100k USD
- Position size = 25% of equity
- 0.01% commission = USD 2.50.- per Trade
- Slippage = 2 ticks
Other comments
- This strategy has been designed to identify the most promising, highest probability entries and trades for each stock or other financial security.
- The combination of the Trend-Template and the RSI qualifiers results in a highly selective strategy which only considers the most promising swing-trading entries. As a result, you will normally only find a low number of trades for each stock or other financial security per year in case you apply this strategy for the daily charts. Shorter timeframes will result in a higher number of trades / year.
- Consequently, traders need to apply this strategy for a full watchlist rather than just one financial security.

JS-TechTrading: VWAP Momentum_Pullback StrategyGeneral Description and Unique Features of this Script
Introducing the VWAP Momentum-Pullback Strategy (long-only) that offers several unique features:
1. Our script/strategy utilizes Mark Minervini's Trend-Template as a qualifier for identifying stocks and other financial securities in confirmed uptrends.
NOTE: In this basic version of the script, the Trend-Template has to be used as a separate indicator on TradingView (Public Trend-Template indicators are available on TradingView – community scripts). It is recommended to only execute buy signals in case the stock or financial security is in a stage 2 uptrend, which means that the criteria of the trend-template are fulfilled.
2. Our strategy is based on the supply/demand balance in the market, making it timeless and effective across all timeframes. Whether you are day trading using 1- or 5-min charts or swing-trading using daily charts, this strategy can be applied and works very well.
3. We have also integrated technical indicators such as the RSI and the MA / VWAP crossover into this strategy to identify low-risk pullback entries in the context of confirmed uptrends. By doing so, the risk profile of this strategy and drawdowns are being reduced to an absolute minimum.
Minervini’s Trend-Template and the ‘Stage-Analysis’ of the Markets
This strategy is a so-called 'long-only' strategy. This means that we only take long positions, short positions are not considered.
The best market environment for such strategies are periods of stable upward trends in the so-called stage 2 - uptrend.
In stable upward trends, we increase our market exposure and risk.
In sideways markets and downward trends or bear markets, we reduce our exposure very quickly or go 100% to cash and wait for the markets to recover and improve. This allows us to avoid major losses and drawdowns.
This simple rule gives us a significant advantage over most undisciplined traders and amateurs!
'The Trend is your Friend'. This is a very old but true quote.
What's behind it???
• 98% of stocks made their biggest gains in a Phase 2 upward trend.
• If a stock is in a stable uptrend, this is evidence that larger institutions are buying the stock sustainably.
• By focusing on stocks that are in a stable uptrend, the chances of profit are significantly increased.
• In a stable uptrend, investors know exactly what to expect from further price developments. This makes it possible to locate low-risk entry points.
The goal is not to buy at the lowest price – the goal is to buy at the right price!
Each stock goes through the same maturity cycle – it starts at stage 1 and ends at stage 4
Stage 1 – Neglect Phase – Consolidation
Stage 2 – Progressive Phase – Accumulation
Stage 3 – Topping Phase – Distribution
Stage 4 – Downtrend – Capitulation
This strategy focuses on identifying stocks in confirmed stage 2 uptrends. This in itself gives us an advantage over long-term investors and less professional traders.
By focusing on stocks in a stage 2 uptrend, we avoid losses in downtrends (stage 4) or less profitable consolidation phases (stages 1 and 3). We are fully invested and put our money to work for us, and we are fully invested when stocks are in their stage 2 uptrends.
But how can we use technical chart analysis to find stocks that are in a stable stage 2 uptrend?
Mark Minervini has developed the so-called 'trend template' for this purpose. This is an essential part of our JS-TechTrading pullback strategy. For our watchlists, only those individual values that meet the tough requirements of Minervini's trend template are eligible.
The Trend Template
• 200d MA increasing over a period of at least 1 month, better 4-5 months or longer
• 150d MA above 200d MA
• 50d MA above 150d MA and 200d MA
• Course above 50d MA, 150d MA and 200d MA
• Ideally, the 50d MA is increasing over at least 1 month
• Price at least 25% above the 52w low
• Price within 25% of 52w high
• High relative strength according to IBD.
NOTE: In this basic version of the script, the Trend-Template has to be used as a separate indicator on TradingView (Public Trend-Template indicators are available in TradingView – community scripts). It is recommended to only execute buy signals in case the stock or financial security is in a stage 2 uptrend, which means that the criteria of the trend-template are fulfilled.
This strategy can be applied to all timeframes from 5 min to daily.
The VWAP Momentum-Pullback Strateg y
For the JS-TechTrading VWAP Momentum-Pullback Strategy, only stocks and other financial instruments that meet the selected criteria of Mark Minervini's trend template are recommended for algorithmic trading with this startegy.
A further prerequisite for generating a buy signals is that the individual value is in a short-term oversold state (RSI).
When the selling pressure is over and the continuation of the uptrend can be confirmed by the MA / VWAP crossover after reaching a price low, a buy signal is issued by this strategy.
Stop-loss limits and profit targets can be set variably.
Relative Strength Index (RSI)
The Relative Strength Index (RSI) is a technical indicator developed by Welles Wilder in 1978. The RSI is used to perform a market value analysis and identify the strength of a trend as well as overbought and oversold conditions. The indicator is calculated on a scale from 0 to 100 and shows how much an asset has risen or fallen relative to its own price in recent periods.
The RSI is calculated as the ratio of average profits to average losses over a certain period of time. A high value of the RSI indicates an overbought situation, while a low value indicates an oversold situation. Typically, a value > 70 is considered an overbought threshold and a value < 30 is considered an oversold threshold. A value above 70 signals that a single value may be overvalued and a decrease in price is likely , while a value below 30 signals that a single value may be undervalued and an increase in price is likely.
For example, let's say you're watching a stock XYZ. After a prolonged falling movement, the RSI value of this stock has fallen to 26. This means that the stock is oversold and that it is time for a potential recovery. Therefore, a trader might decide to buy this stock in the hope that it will rise again soon.
The MA / VWAP Crossover Trading Strategy
This strategy combines two popular technical indicators: the Moving Average (MA) and the Volume Weighted Average Price (VWAP). The MA VWAP crossover strategy is used to identify potential trend reversals and entry/exit points in the market.
The VWAP is calculated by taking the average price of an asset for a given period, weighted by the volume traded at each price level. The MA, on the other hand, is calculated by taking the average price of an asset over a specified number of periods. When the MA crosses above the VWAP, it suggests that buying pressure is increasing, and it may be a good time to enter a long position. When the MA crosses below the VWAP, it suggests that selling pressure is increasing, and it may be a good time to exit a long position or enter a short position.
Traders typically use the MA VWAP crossover strategy in conjunction with other technical indicators and fundamental analysis to make more informed trading decisions. As with any trading strategy, it is important to carefully consider the risks and potential rewards before making any trades.
This strategy is applicable to all timeframes and the relevant parameters for the underlying indicators (RSI and MA/VWAP) can be adjusted and optimized as needed.
Backtesting
Backtesting gives outstanding results on all timeframes and drawdowns can be reduced to a minimum level. In this example, the hourly chart for MCFT has been used.
Settings for backtesting are:
- Period from April 2020 until April 2021 (1 yr)
- Starting capital 100k USD
- Position size = 25% of equity
- 0.01% commission = USD 2.50.- per Trade
- Slippage = 2 ticks
Other comments
• This strategy has been designed to identify the most promising, highest probability entries and trades for each stock or other financial security.
• The RSI qualifier is highly selective and filters out the most promising swing-trading entries. As a result, you will normally only find a low number of trades for each stock or other financial security per year in case you apply this strategy for the daily charts. Shorter timeframes will result in a higher number of trades / year.
• As a result, traders need to apply this strategy for a full watchlist rather than just one financial security.

Trend Line Trendlines are easily recognizable lines that traders draw on charts to connect a series of prices together or show some data's best fit. The resulting line is then used to give the trader a good idea of the direction in which an investment's value might move.
A trendline is a line drawn over pivot highs or under pivot lows to show the prevailing direction of price. Trendlines are a visual representation of support and resistance in any time frame. They show direction and speed of price, and also describe patterns during periods of price contraction.
Key Takeaways
Trendlines indicate the best fit of some data using a single line.
A single trendline can be applied to a chart to give a clearer picture of the trend.
The time period being analyzed and the exact points used to create a trendline vary from trader to trader.
The trendline is among the most important tools used by technical analysts. Instead of looking at past business performance or other fundamentals, technical analysts look for trends in price action. A trendline helps technical analysts determine the current direction in market prices. Technical analysts believe the trend is your friend, and identifying this trend is the first step in the process of making a good trade.
To create a trendline, an analyst must have at least two points on a price chart. Some analysts like to use different time frames such as one minute or five minutes. Others look at daily charts or weekly charts. Some analysts put aside time altogether, choosing to view trends based on tick intervals rather than intervals of time. What makes trendlines so universal in usage and appeal is they can be used to help identify trends regardless of the time period, time frame or interval used.

Stan Weinstein Trend IndicatorThis indicator is a trend indicator for trading charts based on the method of Stan Weinstein. It uses various technical methods to identify four trend phases on an asset: consolidation, advancement, plateauing, and decline. Users can customize the indicator by modifying parameters such as the periods for various calculations, such as the exponential moving average (EMA), the relative strength index (RSI), and support and resistance levels. The results of these calculations are then used to determine if an asset is in a phase of consolidation, advancement, plateauing, or decline.
The results are displayed as markers on the chart, with the following colors:
White: Consolidation
Green: Advancement
Blue: Plateauing
Red: Decline
According to the method of Stan Weinstein, it is recommended to buy an asset during an advancement phase and sell it during a plateauing phase. Similarly, it is recommended to sell an asset during a decline phase and cut this sale when the consolidation phase starts. It is important to note that this indicator is for informational purposes only and should not be used as investment advice. It is important to conduct fundamental and technical analysis before making an investment decision. It is also recommended to combine this analysis with other methods for optimal results and to consider the risks associated with any investment.
All default parameters of this indicator have been carefully chosen to provide the best possible results, however, it is possible to modify them according to personal preferences. It is important to note that modifying certain parameters may make the indicator less relevant and it is therefore recommended not to deviate too much from default values, unless you have a good understanding of the Stan Weinstein method and the technical indicators used.
It is important to note that this indicator is optimized for 1-week charts. It can be used to look at charts at other timeframes but calculations will always be based on weekly data.
Also, it is noteworthy that this indicator is optimized for cryptocurrencies, except Bitcoin, as it is used to calculate the relative strength of a token. However, you can choose the asset or index you want in the menu to calculate the relative strength. Furthermore, all the default settings are carefully chosen, but users are free to modify them, but doing so may result in less relevant results.

CVD - Cumulative Volume Delta (Chart)█ OVERVIEW
This indicator displays cumulative volume delta (CVD) as an on-chart oscillator. It uses intrabar analysis to obtain more precise volume delta information compared to methods that only use the chart's timeframe.
The core concepts in this script come from our first CVD indicator , which displays CVD values as plot candles in a separate indicator pane. In this script, CVD values are scaled according to price ranges and represented on the main chart pane.
█ CONCEPTS
Bar polarity
Bar polarity refers to the position of the close price relative to the open price. In other words, bar polarity is the direction of price change.
Intrabars
Intrabars are chart bars at a lower timeframe than the chart's. Each 1H chart bar of a 24x7 market will, for example, usually contain 60 bars at the lower timeframe of 1min, provided there was market activity during each minute of the hour. Mining information from intrabars can be useful in that it offers traders visibility on the activity inside a chart bar.
Lower timeframes (LTFs)
A lower timeframe is a timeframe that is smaller than the chart's timeframe. This script utilizes a LTF to analyze intrabars, or price changes within a chart bar. The lower the LTF, the more intrabars are analyzed, but the less chart bars can display information due to the limited number of intrabars that can be analyzed.
Volume delta
Volume delta is a measure that separates volume into "up" and "down" parts, then takes the difference to estimate the net demand for the asset. This approach gives traders a more detailed insight when analyzing volume and market sentiment. There are several methods for determining whether an asset's volume belongs in the "up" or "down" category. Some indicators, such as On Balance Volume and the Klinger Oscillator , use the change in price between bars to assign volume values to the appropriate category. Others, such as Chaikin Money Flow , make assumptions based on open, high, low, and close prices. The most accurate method involves using tick data to determine whether each transaction occurred at the bid or ask price and assigning the volume value to the appropriate category accordingly. However, this method requires a large amount of data on historical bars, which can limit the historical depth of charts and the number of symbols for which tick data is available.
In the context where historical tick data is not yet available on TradingView, intrabar analysis is the most precise technique to calculate volume delta on historical bars on our charts. This indicator uses intrabar analysis to achieve a compromise between simplicity and accuracy in calculating volume delta on historical bars. Our Volume Profile indicators use it as well. Other volume delta indicators in our Community Scripts , such as the Realtime 5D Profile , use real-time chart updates to achieve more precise volume delta calculations. However, these indicators aren't suitable for analyzing historical bars since they only work for real-time analysis.
This is the logic we use to assign intrabar volume to the "up" or "down" category:
• If the intrabar's open and close values are different, their relative position is used.
• If the intrabar's open and close values are the same, the difference between the intrabar's close and the previous intrabar's close is used.
• As a last resort, when there is no movement during an intrabar and it closes at the same price as the previous intrabar, the last known polarity is used.
Once all intrabars comprising a chart bar are analyzed, we calculate the net difference between "up" and "down" intrabar volume to produce the volume delta for the chart bar.
█ FEATURES
CVD resets
The "cumulative" part of the indicator's name stems from the fact that calculations accumulate during a period of time. By periodically resetting the volume delta accumulation, we can analyze the progression of volume delta across manageable chunks, which is often more useful than looking at volume delta accumulated from the beginning of a chart's history.
You can configure the reset period using the "CVD Resets" input, which offers the following selections:
• None : Calculations do not reset.
• On a fixed higher timeframe : Calculations reset on the higher timeframe you select in the "Fixed higher timeframe" field.
• At a fixed time that you specify.
• At the beginning of the regular session .
• On trend changes : Calculations reset on the direction change of either the Aroon indicator, Parabolic SAR , or Supertrend .
• On a stepped higher timeframe : Calculations reset on a higher timeframe automatically stepped using the chart's timeframe and following these rules:
Chart TF HTF
< 1min 1H
< 3H 1D
<= 12H 1W
< 1W 1M
>= 1W 1Y
Specifying intrabar precision
Ten options are included in the script to control the number of intrabars used per chart bar for calculations. The greater the number of intrabars per chart bar, the fewer chart bars can be analyzed.
The first five options allow users to specify the approximate amount of chart bars to be covered:
• Least Precise (Most chart bars) : Covers all chart bars by dividing the current timeframe by four.
This ensures the highest level of intrabar precision while achieving complete coverage for the dataset.
• Less Precise (Some chart bars) & More Precise (Less chart bars) : These options calculate a stepped LTF in relation to the current chart's timeframe.
• Very precise (2min intrabars) : Uses the second highest quantity of intrabars possible with the 2min LTF.
• Most precise (1min intrabars) : Uses the maximum quantity of intrabars possible with the 1min LTF.
The stepped lower timeframe for "Less Precise" and "More Precise" options is calculated from the current chart's timeframe as follows:
Chart Timeframe Lower Timeframe
Less Precise More Precise
< 1hr 1min 1min
< 1D 15min 1min
< 1W 2hr 30min
> 1W 1D 60min
The last five options allow users to specify an approximate fixed number of intrabars to analyze per chart bar. The available choices are 12, 24, 50, 100, and 250. The script will calculate the LTF which most closely approximates the specified number of intrabars per chart bar. Keep in mind that due to factors such as the length of a ticker's sessions and rounding of the LTF, it is not always possible to produce the exact number specified. However, the script will do its best to get as close to the value as possible.
As there is a limit to the number of intrabars that can be analyzed by a script, a tradeoff occurs between the number of intrabars analyzed per chart bar and the chart bars for which calculations are possible.
Display
This script displays raw or cumulative volume delta values on the chart as either line or histogram oscillator zones scaled according to the price chart, allowing traders to visualize volume activity on each bar or cumulatively over time. The indicator's background shows where CVD resets occur, demarcating the beginning of new zones. The vertical axis of each oscillator zone is scaled relative to the one with the highest price range, and the oscillator values are scaled relative to the highest volume delta. A vertical offset is applied to each oscillator zone so that the highest oscillator value aligns with the lowest price. This method ensures an accurate, intuitive visual comparison of volume activity within zones, as the scale is consistent across the chart, and oscillator values sit below prices. The vertical scale of oscillator zones can be adjusted using the "Zone Height" input in the script settings.
This script displays labels at the highest and lowest oscillator values in each zone, which can be enabled using the "Hi/Lo Labels" input in the "Visuals" section of the script settings. Additionally, the oscillator's value on a chart bar is displayed as a tooltip when a user hovers over the bar, which can be enabled using the "Value Tooltips" input.
Divergences occur when the polarity of volume delta does not match that of the chart bar. The script displays divergences as bar colors and background colors that can be enabled using the "Color bars on divergences" and "Color background on divergences" inputs.
An information box in the lower-left corner of the indicator displays the HTF used for resets, the LTF used for intrabars, the average quantity of intrabars per chart bar, and the number of chart bars for which there is LTF data. This is enabled using the "Show information box" input in the "Visuals" section of the script settings.
FOR Pine Script™ CODERS
• This script utilizes `ltf()` and `ltfStats()` from the lower_tf library.
The `ltf()` function determines the appropriate lower timeframe from the selected calculation mode and chart timeframe, and returns it in a format that can be used with request.security_lower_tf() .
The `ltfStats()` function, on the other hand, is used to compute and display statistical information about the lower timeframe in an information box.
• The script utilizes display.data_window and display.status_line to restrict the display of certain plots.
These new built-ins allow coders to fine-tune where a script’s plot values are displayed.
• The newly added session.isfirstbar_regular built-in allows for resetting the CVD segments at the start of the regular session.
• The VisibleChart library developed by our resident PineCoders team leverages the chart.left_visible_bar_time and chart.right_visible_bar_time variables to optimize the performance of this script.
These variables identify the opening time of the leftmost and rightmost visible bars on the chart, allowing the script to recalculate and draw objects only within the range of visible bars as the user scrolls.
This functionality also enables the scaling of the oscillator zones.
These variables are just a couple of the many new built-ins available in the chart.* namespace.
For more information, check out this blog post or look them up by typing "chart." in the Pine Script™ Reference Manual .
• Our ta library has undergone significant updates recently, including the incorporation of the `aroon()` indicator used as a method for resetting CVD segments within this script.
Revisit the library to see more of the newly added content!
Look first. Then leap.

VWAP & Previous VWAP - MTF█ Volume Weighted Average Price & Previous Volume Weighted Average Price - Multi Timeframe
This script can display the daily, weekly, monthly, quarterly, yearly and rolling VWAP but also the previous ones.
█ Volume Weighted Average Price (VWAP)
The VWAP is a technical analysis tool used to measure the average price weighted by volume.
VWAP is typically used with intraday charts as a way to determine the general direction of intraday prices.
VWAP is similar to a moving average in that when price is above VWAP, prices are rising and when price is below VWAP, prices are falling.
VWAP is primarily used by technical analysts to identify market trends.
█ Rolling VWAP
The typical VWAP is designed to be used on intraday charts, as it resets at the beginning of the day.
Such VWAPs cannot be used on daily, weekly or monthly charts. Instead, this rolling VWAP uses a time period that automatically adjusts to the chart's timeframe.
You can thus use the rolling VWAP on any chart that includes volume information in its data feed.
Because the rolling VWAP uses a moving window, it does not exhibit the jumpiness of VWAP plots that reset.
For the version with standard deviation bands.
MTF VWAP & StDev Bands

Delta Volume Channels [LucF]█ OVERVIEW
This indicator displays on-chart visuals aimed at making the most of delta volume information. It can color bars and display two channels: one for delta volume, another calculated from the price levels of bars where delta volume divergences occur. Markers and alerts can also be configured using key conditions, and filtered in many different ways. The indicator caters to traders who prefer chart visuals over raw values. It will work on historical bars and in real time, using intrabar analysis to calculate delta volume in both conditions.
█ CONCEPTS
Delta Volume
The volume delta concept divides a bar's volume in "up" and "down" volumes. The delta is calculated by subtracting down volume from up volume. Many calculation techniques exist to isolate up and down volume within a bar. The simplest techniques use the polarity of interbar price changes to assign their volume to up or down slots, e.g., On Balance Volume or the Klinger Oscillator . Others such as Chaikin Money Flow use assumptions based on a bar's OHLC values. The most precise calculation method uses tick data and assigns the volume of each tick to the up or down slot depending on whether the transaction occurs at the bid or ask price. While this technique is ideal, it requires huge amounts of data on historical bars, which usually limits the historical depth of charts and the number of symbols for which tick data is available.
This indicator uses intrabar analysis to achieve a compromise between the simplest and most precise methods of calculating volume delta. In the context where historical tick data is not yet available on TradingView, intrabar analysis is the most precise technique to calculate volume delta on historical bars on our charts. TradingView's Volume Profile built-in indicators use it, as do the CVD - Cumulative Volume Delta Candles and CVD - Cumulative Volume Delta (Chart) indicators published from the TradingView account . My Volume Delta Columns Pro indicator also uses intrabar analysis. Other volume delta indicators such as my Realtime 5D Profile use realtime chart updates to achieve more precise volume delta calculations. Indicators of that type cannot be used on historical bars however; they only work in real time.
This is the logic I use to assign intrabar volume to up or down slots:
• If the intrabar's open and close values are different, their relative position is used.
• If the intrabar's open and close values are the same, the difference between the intrabar's close and the previous intrabar's close is used.
• As a last resort, when there is no movement during an intrabar and it closes at the same price as the previous intrabar, the last known polarity is used.
Once all intrabars making up a chart bar have been analyzed and the up or down property of each intrabar's volume determined, the up volumes are added and the down volumes subtracted. The resulting value is volume delta for that chart bar, which can be used as an estimate of the buying/selling pressure on an instrument.
Delta Volume Percent (DV%)
This value is the proportion that delta volume represents of the total intrabar volume in the chart bar. Note that on some symbols/timeframes, the total intrabar volume may differ from the chart's volume for a bar, but that will not affect our calculations since we use the total intrabar volume.
Delta Volume Channel
The DV channel is the space between two moving averages: the reference line and a DV%-weighted version of that reference. The reference line is a moving average of a type, source and length which you select. The DV%-weighted line uses the same settings, but it averages the DV%-weighted price source.
The weight applied to the source of the reference line is calculated from two values, which are multiplied: DV% and the relative size of the bar's volume in relation to previous bars. The effect of this is that DV% values on bars with higher total volume will carry greater weight than those with lesser volume.
The DV channel can be in one of four states, each having its corresponding color:
• Bull (teal): The DV%-weighted line is above the reference line.
• Strong bull (lime): The bull condition is fulfilled and the bar's close is above the reference line and both the reference and the DV%-weighted lines are rising.
• Bear (maroon): The DV%-weighted line is below the reference line.
• Strong bear (pink): The bear condition is fulfilled and the bar's close is below the reference line and both the reference and the DV%-weighted lines are falling.
Divergences
In the context of this indicator, a divergence is any bar where the slope of the reference line does not match that of the DV%-weighted line. No directional bias is assigned to divergences when they occur.
Divergence Channel
The divergence channel is the space between two levels (by default, the bar's low and high ) saved when divergences occur. When price has breached a channel and a new divergence occurs, a new channel is created. Until that new channel is breached, bars where additional divergences occur will expand the channel's levels if the bar's price points are outside the channel.
Prices breaches of the divergence channel will change its state. Divergence channels can be in one of five different states:
• Bull (teal): Price has breached the channel to the upside.
• Strong bull (lime): The bull condition is fulfilled and the DV channel is in the strong bull state.
• Bear (maroon): Price has breached the channel to the downside.
• Strong bear (pink): The bear condition is fulfilled and the DV channel is in the strong bear state.
• Neutral (gray): The channel has not been breached.
█ HOW TO USE THE INDICATOR
Load the indicator on an active chart (see here if you don't know how).
The default configuration displays:
• The DV channel, without the reference or DV%-weighted lines.
• The Divergence channel, without its level lines.
• Bar colors using the state of the DV channel.
The default settings use an Arnaud-Legoux moving average on the close and a length of 20 bars. The DV%-weighted version of it uses a combination of DV% and relative volume to calculate the ultimate weight applied to the reference. The DV%-weighted line is capped to 5 standard deviations of the reference. The lower timeframe used to access intrabars automatically adjusts to the chart's timeframe and achieves optimal balance between the number of intrabars inspected in each chart bar, and the number of chart bars covered by the script's calculations.
The Divergence channel's levels are determined using the high and low of the bars where divergences occur. Breaches of the channel require a bar's low to move above the top of the channel, and the bar's high to move below the channel's bottom.
No markers appear on the chart; if you want to create alerts from this script, you will need first to define the conditions that will trigger the markers, then create the alert, which will trigger on those same conditions.
To learn more about how to use this indicator, you must understand the concepts it uses and the information it displays, which requires reading this description. There are no videos to explain it.
█ FEATURES
The script's inputs are divided in four sections: "DV channel", "Divergence channel", "Other Visuals" and "Marker/Alert Conditions". The first setting is the selection method used to determine the intrabar precision, i.e., how many lower timeframe bars (intrabars) are examined in each chart bar. The more intrabars you analyze, the more precise the calculation of DV% results will be, but the less chart coverage can be covered by the script's calculations.
DV Channel
Here, you control the visibility and colors of the reference line, its weighted version, and the DV channel between them.
You also specify what type of moving average you want to use as a reference line, its source and length. This acts as the DV channel's baseline. The DV%-weighted line is also a moving average of the same type and length as the reference line, except that it will be calculated from the DV%-weighted source used in the reference line. By default, the DV%-weighted line is capped to five standard deviations of the reference line. You can change that value here. This section is also where you can disable the relative volume component of the weight.
Divergence Channel
This is where you control the appearance of the divergence channel and the key price values used in determining the channel's levels and breaching conditions. These choices have an impact on the behavior of the channel. More generous level prices like the default low and high selection will produce more conservative channels, as will the default choice for breach prices.
In this section, you can also enable a mode where an attempt is made to estimate the channel's bias before price breaches the channel. When it is enabled, successive increases/decreases of the channel's top and bottom levels are counted as new divergences occur. When one count is greater than the other, a bull/bear bias is inferred from it.
Other Visuals
You specify here:
• The method used to color chart bars, if you choose to do so.
• The display of a mark appearing above or below bars when a divergence occurs.
• If you want raw values to appear in tooltips when you hover above chart bars. The default setting does not display them, which makes the script faster.
• If you want to display an information box which by default appears in the lower left of the chart.
It shows which lower timeframe is used for intrabars, and the average number of intrabars per chart bar.
Marker/Alert Conditions
Here, you specify the conditions that will trigger up or down markers. The trigger conditions can include a combination of state transitions of the DV and the divergence channels. The triggering conditions can be filtered using a variety of conditions.
Configuring the marker conditions is necessary before creating an alert from this script, as the alert will use the marker conditions to trigger.
Markers only appear on bar closes, so they will not repaint. Keep in mind, when looking at markers on historical bars, that they are positioned on the bar when it closes — NOT when it opens.
Raw values
The raw values calculated by this script can be inspected using a tooltip and the Data Window. The tooltip is visible when you hover over the top of chart bars. It will display on the last 500 bars of the chart, and shows the values of DV, DV%, the combined weight, and the intermediary values used to calculate them.
█ INTERPRETATION
The aim of the DV channel is to provide a visual representation of the buying/selling pressure calculated using delta volume. The simplest characteristic of the channel is its bull/bear state. One can then distinguish between its bull and strong bull states, as transitions from strong bull to bull states will generally happen when buyers are losing steam. While one should not infer a reversal from such transitions, they can be a good place to tighten stops. Only time will tell if a reversal will occur. One or more divergences will often occur before reversals.
The nature of the divergence channel's design makes it particularly adept at identifying consolidation areas if its settings are kept on the conservative side. A gray divergence channel should usually be considered a no-trade zone. More adventurous traders can use the DV channel to orient their trade entries if they accept the risk of trading in a neutral divergence channel, which by definition will not have been breached by price.
If your charts are already busy with other stuff you want to hold on to, you could consider using only the chart bar coloring component of this indicator:
At its simplest, one way to use this indicator would be to look for overlaps of the strong bull/bear colors in both the DV channel and a divergence channel, as these identify points where price is breaching the divergence channel when buy/sell pressure is consistent with the direction of the breach. I have highlighted all those points in the chart below. Not all of them would have produced profitable trades, but nothing is perfect in the markets. Also, keep in mind that the circles identify the visual you would be looking for — not the trade's entry level.
█ LIMITATIONS
• The script will not work on symbols where no volume is available. An error will appear when that is the case.
• Because a maximum of 100K intrabars can be analyzed by a script, a compromise is necessary between the number of intrabars analyzed per chart bar
and chart coverage. The more intrabars you analyze per chart bar, the less coverage you will obtain.
The setting of the "Intrabar precision" field in the "DV channel" section of the script's inputs
is where you control how the lower timeframe is calculated from the chart's timeframe.
█ NOTES
Volume Quality
If you use volume, it's important to understand its nature and quality, as it varies with sectors and instruments. My Volume X-ray indicator is one way you can appraise the quality of an instrument's intraday volume.
For Pine Script™ Coders
• This script uses the new overload of the fill() function which now makes it possible to do vertical gradients in Pine. I use it for both channels displayed by this script.
• I use the new arguments for plot() 's `display` parameter to control where the script plots some of its values,
namely those I only want to appear in the script's status line and in the Data Window.
• I wrote my script using the revised recommendations in the Style Guide from the Pine v5 User Manual.
█ THANKS
To PineCoders . I have used their lower_tf library in this script, to manage the calculation of the LTF and intrabar stats, and their Time library to convert a timeframe in seconds to a printable form for its display in the Information box.
To TradingView's Pine Script™ team. Their innovations and improvements, big and small, constantly expand the boundaries of the language. What this script does would not have been possible just a few months back.
And finally, thanks to all the users of my scripts who take the time to comment on my publications and suggest improvements. I do not reply to all but I do read your comments and do my best to implement your suggestions with the limited time that I have.

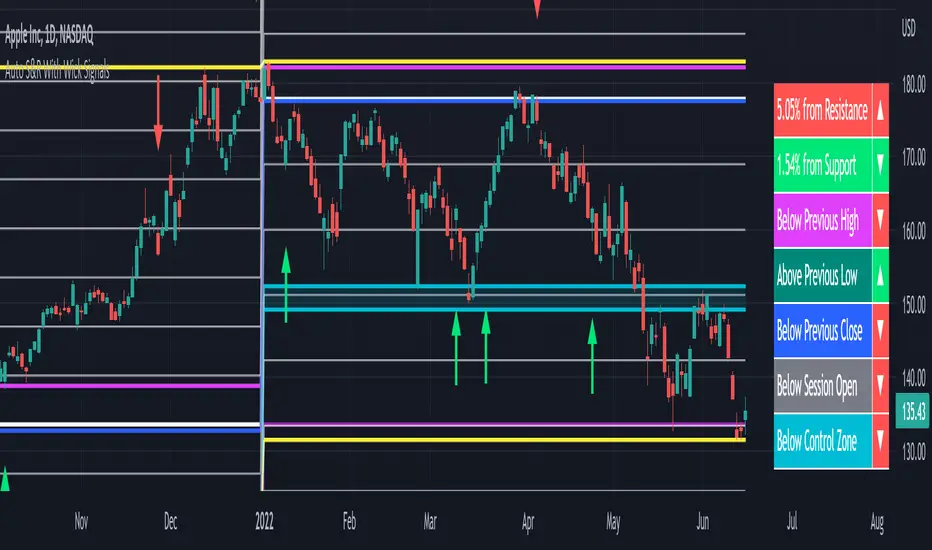
Auto Support & Resistance With Wick Signals & Percentage GapsThis auto support and resistance indicator uses percentage deviations from the previous session close to calculate levels. It provides arrows as signals when it detects 2 wicks in the last 5 bars from a support or resistance level. Includes alerts for price crossing any level as well as real time percentage gaps from current price to the next closest support and resistance level. You also have the option to set up to 3 major levels of your own for any levels that are very important on longer timeframes that you want included. Those will show on the chart as well as within your percentage gap table with color coded background. All features can be customized or turned off to suit your preferences.
SOURCE
This indicator uses the previous session close as a source by default but can be adjusted to use the previous session high or the previous session low. I find the close setting to provide the most accurate levels.
SESSION
The default setting for the previous session used is the daily session but can be adjusted to use the daily, weekly, monthly, quarterly or yearly session. Use longer sessions when looking at longer time frame charts.
SIGNALS
The signals by default are set to only show an arrow if there have been 2 bullish or bearish wicks off of a support or resistance level in the last 5 bars. This can be changed to one bullish wick off of support and one bearish wick off of resistance or it can be set to give a signal anytime a bar crosses a support or resistance level. This can be controlled in the indicator settings.
PERCENTAGE DEVIATION LEVELS
The default percentage deviation is set to 1% but can and should be adjusted according to whatever ticker you are using. For example use .25% or .5% when looking at forex intraday charts since they are not as volatile as other markets. For leveraged etfs used 1% multiplied by the leverage on the etf, so for SQQQ use 3% as it is a 3x leveraged etf. When looking at longer timeframes or highly volatile charts, set the percentage deviation to 2%, 5%, 10%, etc.
LINE COLORS
The color of the lines will change from red to green depending on if the price is above or below that level. You can customize these colors in the settings.
MAJOR LEVELS
If you have major levels of support and resistance from longer timeframes and your own charting, you can add up to 3 major levels that will show on the chart as well as show the percentage gaps in the table. The label for each major level will be colored to match the color of the line on the chart individually.
PERCENTAGE GAP TABLE
The gap table will update live with percentages to go from current price to the next closest support and resistance levels so you don’t have to calculate them manually. The position of the percentage gap table can also be changed within the indicator settings.
TURN FEATURES ON/OFF
There are 3 toggle switches so you can easily turn on or off certain features such as: the support and resistance lines, the percentage gaps table and the arrow signals.
LINE WIDTHS
You can also set the line width of all levels and the line width of the starting level within the indicator settings.
***MARKETS***
This indicator can be used as a signal on all markets, including stocks, crypto, futures and forex.
***TIMEFRAMES***
This automatic support and resistance indicator can be used on all timeframes as long as there is enough data for the session used.
***TIPS***
Try using numerous indicators of ours on your chart so you can instantly see the bullish or bearish trend of multiple indicators in real time without having to analyze the data. Some of our favorites are our Volume Spike Scanner, Volume Profile, Momentum and Trend Friend in combination with this auto support and resistance indicator. They all have real time Bullish and Bearish labels as well so you can immediately understand each indicator's trend.
richard tortorielloPRASHANT SHAH is one of India’s leading practitioners of one dimensional charts. He has worked for a number of years with various financial firms, using technical analysis and noiseless charts in particular. His first book on point and figure charts was a huge success. He appears on business channels and writes regular blogs and columns. He also conducts live market trading sessions on rule-based trading systems. His mission is to help others become objective, noiseless and process oriented traders. Prashant is the architect of a market analysis software called TradePoint, which is being used and appreciated by professional traders and market analysts due to its advanced and unlimited capabilities.

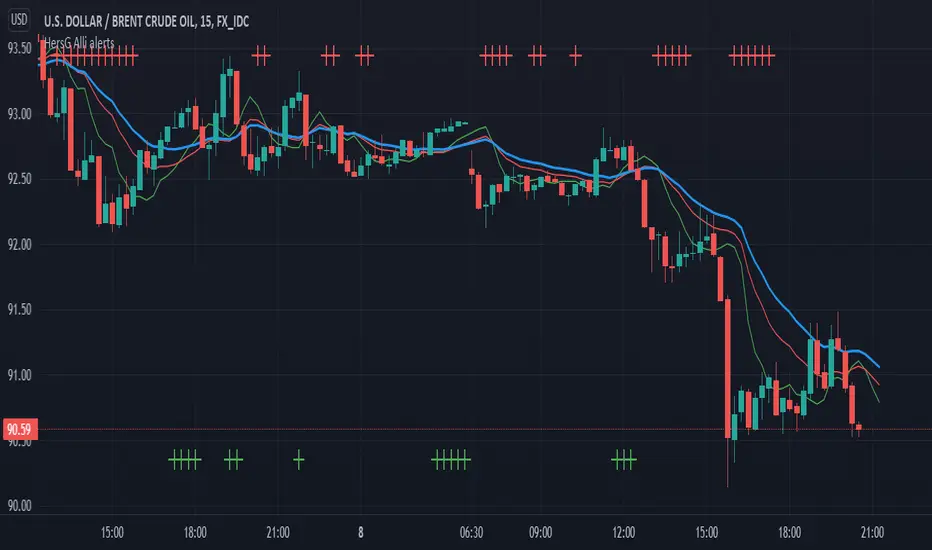
Alligator: Three signals confirmation with AlertsHello Trading Viewers,
The following is the William’s Alligator indicator with alerts indicating strong momentum, it can be used for scalping in lower time-frames or just riding the momentum in 1hr or 4hrs charts.
Input choices are:
1. Source of Data: Open, Low, High, Close, HL2, HLC3 and so on.
2. Simple and Exponential are the two choices of moving averages.
3. Lips, Teeth and Jaws input numbers are Fibonacci numbers with offsets from -4 to +4.
4. Up Momentum and Down Momentum signals will be plotted top and bottom of the charts respectively when conditions are met.
Idea used to confirm strong momentum
When (High + Low / 2) price is greater than Alligator’s Lips, Teeth, and Jaws, it is considered as a good time to go long; however, to strengthen the idea, the up-momentum condition needs to be approved three times consecutively. (Three consecutive candle bars should remain above Lips, Teeth, and Jaws to trigger an alert signal and plot Up- momentum shape on the charts)
The same idea with down-momentum, but the condition (High + Low / 2) price should be less than Alligator’s Lips, Teeth, and Jaws.
There is an alert set-up, once strong momentum is spotted it will send an alert once per bar close. You can relax and run an errand when the alert is not triggered.
Happy Trading!
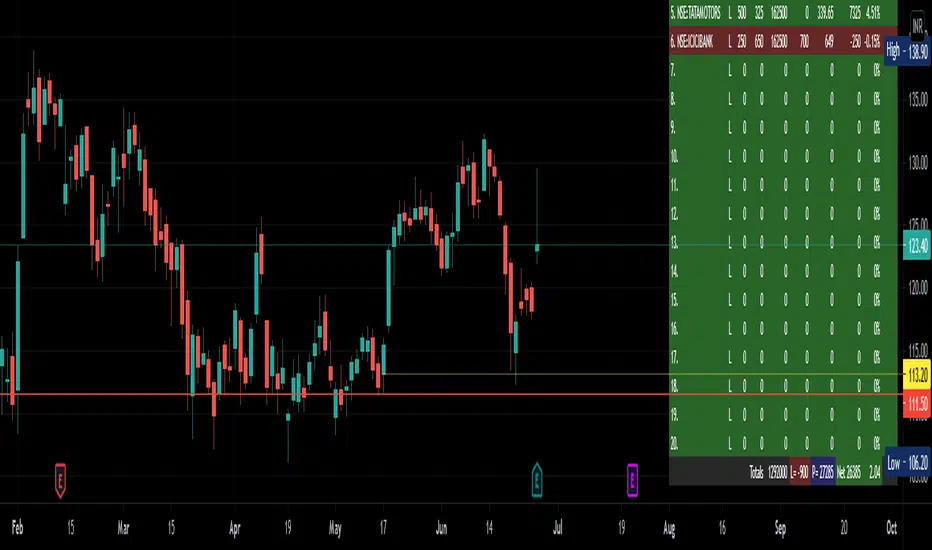
Tabular Portfolio by CJS V1This is a useful indicator that sits on top of the charts, in the right hand bottom corner and shows the current price, profit or loss in value and percent of upto 20 scrips fed in, in a Tabular form using tables feature.
Allows to mark a/c id also if you have multiple broker or individual accounts.
Colors are customisable.
Stocks get updated no matter what is your current selected scrip.
Gives total investment and total PnL also in percent.
Useful to monitor your portfolio status in once screen and while you are looking at charts.
Give feedback for improvement or issues, if any.
Credits to RedKTrader from where the idea was picked up.
Move visual order to front, if the charts and other indicators overlap the table view.
Camelback-IndikatorDer Camelback-Indikator stammt von Joe Ross. Er beinhaltet zwei einfache gleitende Durchschnitte mit 40 Perioden und einen exponentiellen gleitenden Durchschnitt mit 15 Perioden.
Sobald wir mit Preisbalken arbeiten, die vollständig unterhalb des MA40-Kanals liegen, versuchen wir einen Ausbruch durch das Tief des Balkens zu verkaufen, der das lokale Hoch macht. Mit dem lokalen Hoch ist das Hoch einer geringfügigen Korrektur außerhalb des MA40-Kanals gemeint.
Sobald wir mit Preisbalken arbeiten, die vollständig oberhalb des MA40-Kanals liegen, versuchen wir einen Ausbruch durch das Hoch des Balkens zu kaufen, der das lokale Tief macht. Mit dem lokalen Tief ist das Tief einer geringfügigen Korrektur außerhalb des Kanals gemeint.
Was wir hier tun, kann als Scalping bezeichnet werden. Das Skalieren des längerfristigen Charts mit kurzfristigen Handelstechniken ist eine großartige Möglichkeit, um die Art von Aktion zu handeln, die wir in diesen Charts sehen.
Der Camelback-Indikator kann auch zum scannen von Aktiemärkten benutzt werden.
Der Indikator beinhaltet neben der Camelback-Funktion außerdem noch einen einfachen gleitentenden Durchschnitt mit 200 Perioden, zwei einfache gleitentende Durchschnitte (im script short-term genannt) mit einstellbarer Periodendauer, einer davon angewendet auf Hochs, bei dem anderen kann die Anwendung der Quelle eingestellt werden. Bei beiden ist ein Offset einstellbar.
The Camelback indicator is from Joe Ross. It includes two simple moving averages with 40 periods and an exponential moving average with 15 periods.
Once we are working with price bars that are completely below the MA40 channel, we try to sell a breakout through the low of the bar which makes the local high. By the local high is meant the high of a minor correction outside of the MA40 channel.
Once we are working with price bars that are completely above the MA40 channel, we try to buy a breakout through the high of the bar which makes the local low. By the local low we mean the low of a minor correction outside the channel.
What we are doing here can be called scalping. Scaling the longer term chart with short term trading techniques is a great way to trade for the kind of action we see on these charts.
The Camelback indicator can also be used to scan stock markets.
In addition to the Camelback function, the indicator also includes a simple moving average with 200 periods, two simple moving averages (called short-term in the script) with adjustable period duration, one of which is applied to highs, the other can be used to set the source . An offset can be set for both.

Delta Volume Candles [LucF]█ OVERVIEW
This indicator plots on-chart volume delta information using candles that can replace your normal candles, tops and bottoms appended to normal candles, optional MAs of those tops and bottoms levels, a divergence channel and a chart background. The indicator calculates volume delta using intrabar analysis, meaning that it uses the lower timeframe bars constituting each chart bar.
█ CONCEPTS
Volume Delta
The volume delta concept divides a bar's volume in "up" and "down" volumes. The delta is calculated by subtracting down volume from up volume. Many calculation techniques exist to isolate up and down volume within a bar. The simplest use the polarity of interbar price changes to assign their volume to up or down slots, e.g., On Balance Volume or the Klinger Oscillator . Others such as Chaikin Money Flow use assumptions based on a bar's OHLC values. The most precise calculation method uses tick data and assigns the volume of each tick to the up or down slot depending on whether the transaction occurs at the bid or ask price. While this technique is ideal, it requires huge amounts of data on historical bars, which considerably limits the historical depth of charts and the number of symbols for which tick data is available. Furthermore, historical tick data is not yet available on TradingView.
This indicator uses intrabar analysis to achieve a compromise between the simplest and most precise methods of calculating volume delta. It is currently the most precise method usable on TradingView charts. TradingView's Volume Profile built-in indicators use it, as do the CVD - Cumulative Volume Delta Candles and CVD - Cumulative Volume Delta (Chart) indicators published from the TradingView account . My Delta Volume Channels and Volume Delta Columns Pro indicators also use intrabar analysis. Other volume delta indicators such as my Realtime 5D Profile use realtime chart updates to calculate volume delta without intrabar analysis, but that type of indicator only works in real time; they cannot calculate on historical bars.
This is the logic I use to determine the polarity of intrabars, which determines the up or down slot where its volume is added:
• If the intrabar's open and close values are different, their relative position is used.
• If the intrabar's open and close values are the same, the difference between the intrabar's close and the previous intrabar's close is used.
• As a last resort, when there is no movement during an intrabar, and it closes at the same price as the previous intrabar, the last known polarity is used.
Once all intrabars making up a chart bar have been analyzed and the up or down property of each intrabar's volume determined, the up volumes are added, and the down volumes subtracted. The resulting value is volume delta for that chart bar, which can be used as an estimate of the buying/selling pressure on an instrument. Not all markets have volume information. Without it, this indicator is useless.
Intrabar analysis
Intrabars are chart bars at a lower timeframe than the chart's. The timeframe used to access intrabars determines the number of intrabars accessible for each chart bar. On a 1H chart, each chart bar of an active market will, for example, usually contain 60 bars at the lower timeframe of 1min, provided there was market activity during each minute of the hour.
This indicator automatically calculates an appropriate lower timeframe using the chart's timeframe and the settings you use in the script's "Intrabars" section of the inputs. As it can access lower timeframes as small as seconds when available, the indicator can be used on charts at relatively small timeframes such as 1min, provided the market is active enough to produce bars at second timeframes.
The quantity of intrabars analyzed in each chart bar determines:
• The precision of calculations (more intrabars yield more precise results).
• The chart coverage of calculations (there is a 100K limit to the quantity of intrabars that can be analyzed on any chart,
so the more intrabars you analyze per chart bar, the less chart bars can be calculated by the indicator).
The information box displayed at the bottom right of the chart shows the lower timeframe used for intrabars, as well as the average number of intrabars detected for chart bars and statistics on chart coverage.
Balances
This indicator calculates five balances from volume delta values. The balances are oscillators with a zero centerline; positive values are bullish, and negative values are bearish. It is important to understand the balances as they can be used to:
• Color candle bodies.
• Calculate body and top and bottom divergences.
• Color an EMA channel.
• Color the chart's background.
• Configure markers and alerts.
The five balances are:
1 — Bar Balance : This is the only balance using instant values; it is simply the subtraction of the down volume from the up volume on the bar, so the instant volume delta for that bar.
2 — Average Balance : Calculates a distinct EMA for both the up and down volumes, and subtracts the down EMA from the up EMA.
The result is akin to MACD's histogram because it is the subtraction of two moving averages.
3 — Momentum Balance : Starts by calculating, separately for both up and down volumes, the difference between the same EMAs used in "Average Balance" and
an SMA of twice the period used for the "Average Balance" EMAs. The difference for the up side is subtracted from the difference for the down side,
and an RSI of that value is calculated and brought over the −50/+50 scale.
4 — Relative Balance : The reference values used in the calculation are the up and down EMAs used in the "Average Balance".
From those, we calculate two intermediate values using how much the instant up and down volumes on the bar exceed their respective EMA — but with a twist.
If the bar's up volume does not exceed the EMA of up volume, a zero value is used. The same goes for the down volume with the EMA of down volume.
Once we have our two intermediate values for the up and down volumes exceeding their respective MA, we subtract them. The final value is an ALMA of that subtraction.
The rationale behind using zero values when the bar's up/down volume does not exceed its EMA is to only take into account the more significant volume.
If both instant volume values exceed their MA, then the difference between the two is the signal's value.
The signal is called "relative" because the intermediate values are the difference between the instant up/down volumes and their respective MA.
This balance flatlines when the bar's up/down volumes do not exceed their EMAs, which makes it useful to spot areas where trader interest dwindles, such as consolidations.
The smaller the period of the final value's ALMA, the more easily it will flatline. These flat zones should be considered no-trade zones.
5 — Percent Balance : This balance is the ALMA of the ratio of the "Bar Balance" over the total volume for that bar.
From the balances and marker conditions, two more values are calculated:
1 — Marker Bias : This sums the up/down (+1/‒1) occurrences of the markers 1 to 4 over a period you define, so it ranges from −4 to +4, times the period.
Its calculation will depend on the modes used to calculate markers 3 and 4.
2 — Combined Balances : This is the sum of the bull/bear (+1/−1) states of each of the five balances, so it ranges from −5 to +5.
The periods for all of these balances can be configured in the "Periods" section at the bottom of the script's inputs. As you cannot see the balances on the chart, you can use my Volume Delta Columns Pro indicator in a pane; it can plot the same balances, so you will be able to analyze them.
Divergences
In the context of this indicator, a divergence is any bar where the bear/bull state of a balance (above/below its zero centerline) diverges from the polarity of a chart bar. No directional bias is assigned to divergences when they occur. Candle bodies and tops/bottoms can each be colored differently on divergences detected from distinct balances.
Divergence Channel
The divergence channel is the space between two levels (by default, the bar's open and close ) saved when divergences occur. When price (by default the close ) has breached a channel and a new divergence occurs, a new channel is created. Until that new channel is breached, bars where additional divergences occur will expand the channel's levels if the bar's price points are outside the channel.
Prices breaches of the divergence channel will change its state. Divergence channels can be in one of three different states:
• Bull (green): Price has breached the channel to the upside.
• Bear (red): Price has breached the channel to the downside.
• Neutral (gray): The channel has not yet been breached.
█ HOW TO USE THE INDICATOR
I do not make videos to explain how to use my indicators. I do, however, try hard to include in their description everything one needs to understand what they do. From there, it's up to you to explore and figure out if they can be useful in your trading practice. Communicating in videos what this description and the script's tooltips contain would make for very long videos that would likely exceed the attention span of most people who find this description too long. There is no quick way to understand an indicator such as this one because it uses many different concepts and has quite a bit of settings one can use to modify its visuals and behavior — thus how one uses it. I will happily answer questions on the inner workings of the indicator, but I do not answer questions like "How do I trade using this indicator?" A useful answer to that question would require an in-depth analysis of who you are, your trading methodology and objectives, which I do not have time for. I do not teach trading.
Start by loading the indicator on an active chart containing volume information. See here if you need help.
The default configuration displays:
• Normal candles where the bodies are only colored if the bar's volume has increased since the last bar.
If you want to use this indicator's candles, you may want to disable your chart's candles by clicking the eye icon to the right of the symbol's name in the top left of the chart.
• A top or bottom appended to the normal candles. It represents the difference between up and down volume for that bar
and is positioned at the top or bottom, depending on its polarity. If up volume is greater than down volume, a top is displayed. If down volume is greater, a bottom is plotted.
The size of tops and bottoms is determined by calculating a factor which is the proportion of volume delta over the bar's total volume.
That factor is then used to calculate the top or bottom size relative to a baseline of the average candle body size of the last 100 bars.
• An information box in the bottom right displaying intrabar and chart coverage information.
• A light red background when the intrabar volume differs from the chart's volume by more than 1%.
The script's inputs contain tooltips explaining most of the fields. I will not repeat them here. Following is a brief description of each section of the indicator's inputs which will give you an idea of what the indicator can do:
Normal Candles is where you configure the replacement candles plotted by the script. You can choose from different coloring schemes for their bodies and specify a unique color for bodies where a divergence calculated using the method you choose occurs.
Volume Tops & Botttoms is where you configure the display of tops and bottoms, and their EMAs. The EMAs are calculated from the high point of tops and the low point of bottoms. They can act as a channel to evaluate price, and you can choose to color the channel using a gradient reflecting the advances/declines in the balance of your choice.
Divergence Channel is where you set up the appearance and behavior of the divergence channel. These areas represent levels where price and volume delta information do not converge. They can be interpreted as regions with no clear direction from where one will look for breaches. You can configure the channel to take into account one or both types of divergences you have configured for candle bodies and tops/bottoms.
Background allows you to configure a gradient background color that reflects the advances/declines in the balance of your choice. You can use this to provide context to the volume delta values from bars. You can also control the background color displayed on volume discrepancies between the intrabar and the chart's timeframe.
Intrabars is where you choose the calculation mode determining the lower timeframe used to access intrabars. The indicator uses the chart's timeframe and the type of market you are on to calculate the lower timeframe. Your setting there should reflect which compromise you prefer between the precision of calculations and chart coverage. This is also where you control the display of the information box in the lower right corner of the chart.
Markers allows you to control the plotting of chart markers on different conditions. Their configuration determines when alerts generated from the indicator will fire. Note that in order to generate alerts from this script, they must be created from your chart. See this Help Center page to learn how. Only the last 500 markers will be visible on the chart, but this will not affect the generation of alerts.
Periods is where you configure the periods for the balances and the EMAs used in the indicator.
The raw values calculated by this script can be inspected using the Data Window.
█ INTERPRETATION
Rightly or wrongly, volume delta is considered by many a useful complement to the interpretation of price action. I use it extensively in an attempt to find convergence between my read of volume delta and price movement — not so much as a predictor of future price movement. No system or person can predict the future. Accordingly, I consider people who speak or act as if they know the future with certainty to be dangerous to themselves and others; they are charlatans, imprudent or blissfully ignorant.
I try to avoid elaborate volume delta interpretation schemes involving too many variables and prefer to keep things simple:
• Trends that have more chances of continuing should be accompanied by VD of the same polarity.
In trends, I am looking for "slow and steady". I work from the assumption that traders and systems often overreact, which translates into unproductive volatility.
Wild trends are more susceptible to overreactions.
• I prefer steady VD values over wildly increasing ones, as large VD increases often come with increased price volatility, which can backfire.
Large VD values caused by stopping volume will also often occur on trend reversals with abnormally high candles.
• Prices escaping divergence channels may be leading a trend in that direction, although there is no telling how long that trend will last; could be just a few bars or hundreds.
When price is in a channel, shifts in VD balances can sometimes give us an idea of the direction where price has the most chance of breaking.
• Dwindling VD will often indicate trend exhaustion and predate reversals by many bars, but the problem is that mere pauses in a trend will often produce the same behavior in VD.
I think it is too perilous to infer rigidly from VD decreases.
Divergence Channel
Here I have configured the divergence channels to be visible. First, I set the bodies to display divergences on the default Bar Balance. They are indicated by yellow bodies. Then I activated the divergence channels by choosing to draw levels on body divergences and checked the "Fill" checkbox to fill the channel with the same color as the levels. The divergence channel is best understood as a direction-less area from where a breach can be acted on if other variables converge with the breach's direction:
Tops and Bottoms EMAs
I find these EMAs rather interesting. They have no equivalent elsewhere, as they are calculated from the top and bottom values this indicator plots. The only similarity they have with volume-weighted MAs, including VWAP, is that they use price and volume. This indicator's Tops and Bottoms EMAs, however, use the price and volume delta. While the channel differs from other channels in how it is calculated, it can be used like others, as a baseline from which to evaluate price movement or, alternatively, as stop levels. Remember that you can change the period used for the EMAs in the "Periods" section of the inputs.
This chart shows the EMAs in action, filled with a gradient representing the advances/decline from the Momentum balance. Notice the anomaly in the chart's latest bars where the Momentum balance gradient has been indicating a bullish bias for some time, during which price was mostly below the EMAs. Price has just broken above the channel on positive VD. My interpretation of this situation would be that it is a risky opportunity for a long trade in the larger context where the market has been in a downtrend since the 5th. Intrepid traders choosing to enter here could do so with a "make or break" tight stop that will minimize their losses should the market continue its downtrend while hopefully preserving the potential upside of price continuing on the longer-term uptrend prevalent since the 28th:
█ NOTES
Volume
If you use indicators such as this one which depends on volume information, it is important to realize that the volume data they consume comes from data feeds, and that all data feeds are NOT created equally. Those who create the data feeds we use must make decisions concerning the nature of the transactions they tally and the way they are tallied in each feed, and these decisions affect the nature of our volume data. My Volume X-ray publication discusses some of the reasons why volume information from different timeframes, brokers/exchanges or sectors may vary considerably. I encourage you to read it. This indicator's display of a warning through a background color on volume discrepancies between the timeframe used to access intrabars and the chart's timeframe is an attempt to help you realize these variations in feeds. Don't take things for granted, and understand that the quality of a given feed's volume information affects the quality of the results this indicator calculates.
Markets as ecosystems
I believe it is perilous to think that behavioral patterns you discover in one market through the lens of this or any other indicator will necessarily port to other markets. While this may sometimes be the case, it will often not. Why is that? Because each market is its own ecosystem. As cities do, all markets share some common characteristics, but they also all have their idiosyncrasies. A proportion of a city's inhabitants is always composed of outsiders who come and go, but a core population of regulars and systems is usually the force that actually defines most of the city's observable characteristics. I believe markets work somewhat the same way; they may look the same, but if you live there for a while and pay attention, you will notice the idiosyncrasies. Some things that work in some markets will, accordingly, not work in others. Please keep that in mind when you draw conclusions.
On Up/Down or Buy/Sell Volume
Buying or selling volume are misnomers, as every unit of volume transacted is both bought and sold by two different traders. While this does not keep me from using the terms, there is no such thing as “buy only” or “sell only” volume. Trader lingo is riddled with peculiarities. Without access to order book information, traders work with the assumption that when price moves up during a bar, there was more buying pressure than selling pressure, just as when buy market orders take out limit ask orders in the order book at successively higher levels. The built-in volume indicator available on TradingView uses this logic to color the volume columns green or red. While this script’s calculations are more precise because it analyses intrabars to calculate its information, it uses pretty much the same imperfect logic. Until Pine scripts can have access to how much volume was transacted at the bid/ask prices, our volume delta calculations will remain a mere proxy.
Repainting
• The values calculated on the realtime bar will update as new information comes from the feed.
• Historical values may recalculate if the historical feed is updated or when calculations start from a new point in history.
• Markers and alerts will not repaint as they only occur on a bar's close. Keep this in mind when viewing markers on historical bars,
where one could understandably and incorrectly assume they appear at the bar's open.
To learn more about repainting, see the Pine Script™ User Manual's page on the subject .
Superfluity
In "The Bed of Procrustes", Nassim Nicholas Taleb writes: To bankrupt a fool, give him information . This indicator can display a lot of information. The inevitable adaptation period you will need to figure out how to use it should help you eliminate all the visuals you do not need. The more you eliminate, the easier it will be to focus on those that are the most useful to your trading practice. Don't be a fool.
█ THANKS
Thanks to alexgrover for his Dekidaka-Ashi indicator. His volume plots on candles were the inspiration for my top/bottom plots.
Kudos to PineCoders for their libraries. I use two of them in this script: Time and lower_tf .
The first versions of this script used functionality that I would not have known about were it not for these two guys:
— A guy called Kuan who commented on a Backtest Rookies presentation of their Volume Profile indicator.
— theheirophant , my partner in the exploration of the sometimes weird abysses of request.security() ’s behavior at lower timeframes.

HatiKO EnvelopesPublished source code is subject to the terms of the GNU Affero General Public License v3.0
This script describes and provides backtesting functionality to internal strategy of algorithmic crypto trading software "HatiKO bot".
Suitable for backtesting any Cryptocurrency Pair on any Exchange/Platform, any Timeframe.
Core Mechanics of this strategy are based on theory of price always returning to Moving Average + Envelopes indicator (Moving_average_envelope from Wiki)
Developement of this script and trading software is inspired by:
"Essential Technical Analysis: Tools and Techniques to Spot Market Trends" by Leigh Stevens (published on 12th of April 2002)
"Moving Average Envelopes" by ChartSchool, StockCharts platform (published on 13th of April 2015 or earlier)
"Коля Колеснік" from Crypto Times channel ("Метод сетка", published on 19th of August 2018)
"3 ways to use Moving Average Envelopes" by Rich Fitton, published on Trader's Nest (published on 28st of November 2018 or earlier)
noro's "Robot WhiteBox ShiftMA" strategy v1 script, published on TradingView platform (published on 29th of August 2018)
"Moving Average Envelopes: A Popular Trading Tool" Investopedia article (published 25th of June 2019)
and KROOL1980's blogpost on Argolabs ("Гридерство или Сетка как источник прибыли на форекс", published on 27th of February 2015)
Core Features:
1) Up to 4 Envelopes in each direction (Long/Short)
2) Use any of 6 different basis MAs, optionally use different MAs for Opening and Closure
3) Use different Timeframes for MA calculation, without any repainting and lookahead bias.
4) Fixed order size, not Martingale strategy
5) Close open position earlier by using Deviation parameter
6) PineScript v4 code
Options description:
Lot - % from your initial balance to use for order size calculation
Timeframe Short - Timeframe to use for Short Opening MA calculation, can be chosen from dropdown list, default is Current Graph Timeframe
MA Type Short - Type of MA to use for Short Opening MA calculation, can be chosen from dropdown list, default is SMA
Data Short - Source of Price for Short Opening MA calculation, can be chosen from dropdown list, default is OHLC4
MA Length Short - Period used for Short Opening MA calculation, should be >=1, default is 3
MA offset Short - Offset for MA value used for Short Envelopes calculation, should be >= 0, default is 0
Timeframe Long - Timeframe to use for Long Opening MA calculation, can be chosen from dropdown list, default is Current Graph Timeframe
MA Type Long - Type of MA to use for Long Opening MA calculation, can be chosen from dropdown list, default is SMA
Data Long - Source of Price for Long Opening MA calculation, can be chosen from dropdown list, default is OHLC4
MA Length Long - Period used for Long Opening MA calculation, should be >=1, default is 3
MA offset Long - Offset for MA value used for Long Envelopes calculation, should be >= 0, default is 0
Mode close MA Short - Enable different MA for Short position Closure, default is "false". If false, Closure MA = Opening MA
Timeframe Short Close - Timeframe to use for Short Position Closure MA calculation, can be chosen from dropdown list, default is Current Graph Timeframe
MA Type Close Short - Type of MA to use for Short Position Closure MA calculation, can be chosen from dropdown list, default is SMA
Data Short Close - Source of Price for Short Closure MA calculation, can be chosen from dropdown list, default is OHLC4
MA Length Short Close - Period used for Short Opening MA calculation, should be >=1, default is 3
Short Deviation - % to move from MA value, used to close position above or beyond MA, can be negative, default is 0
MA offset Short Close - Offset for MA value used for Short Position Closure calculation, should be >= 0, default is 0
Mode close MA Long - Enable different MA for Long position Closure, default is "false". If false, Closure MA = Opening MA
Timeframe Long Close - Timeframe to use for Long Position Closure MA calculation, can be chosen from dropdown list, default is Current Graph Timeframe
MA Type Close Long - Type of MA to use for Long Position Closure MA calculation, can be chosen from dropdown list, default is SMA
Data Long Close - Source of Price for Long Closure MA calculation, can be chosen from dropdown list, default is OHLC4
MA Length Long Close - Period used for Long Opening MA calculation, should be >=1, default is 3
Long Deviation - % to move from MA value, used to close position above or beyond MA, can be negative, default is 0
MA offset Long Close - Offset for MA value used for Long Position Closure calculation, should be >= 0, default is 0
Short Shift 1..4 - % from MA value to put Envelopes at, for Shorts numbers should be positive, the higher is number, the higher should be Shift position, example: "Shift 1 = 1, shift 2 = 2, etc."
Long Shift 1..4 - % from MA value to put Envelopes at, for Longs numbers should be negative, the lower is number, the lower should be Shift position, example: "Shift 1 = -1, shift 2 = -2, etc."
From Year 20XX - Backtesting Starting Year number, only 20xx supported as script is cryptocurrency-oriented.
To Year 20XX - Backtesting Final Year number, only 20xx supported as script is cryptocurrency-oriented.
From Month - Years starting Month, optional tweaking, changing not recommended
To Month - Years ending Month, optional tweaking, changing not recommended
From day - Months starting day, optional tweaking, changing not recommended
To day - Months ending day, optional tweaking, changing not recommended
Graph notes:
Green lines - Long Envelopes.
Red lines - Short Envelopes.
Orange line - MA for closing of Short positions.
Lime line - MA for closing of Long positions.
**************************************************************************************************************************************************************************************************************
Опубликованный исходный код регулируется Условиями Стандартной Общественной Лицензии GNU Affero v3.0
Этот скрипт описывает и предоставляет функции бектеста для внутренней стратегии алгоритмического программного обеспечения "HatiKO bot".
Подходит для тестирования любой криптовалютной пары на любой бирже/платформе, на любом таймфрейме.
Кор-механика этой стратегии основана на теории всегда возвращающейся к значению МА цены с использованием индикатора Envelopes (Moving_average_envelope from Wiki)
Разработка этого скрипта и программного обеспечения для торговли вдохновлена следующими источниками:
Книга "Essential Technical Analysis: Tools and Techniques to Spot Market Trends" Ли Стивенса (опубликовано 12 апреля 2002 года)
«Moving Average Envelopes» от ChartSchool, платформа StockCharts (опубликовано 13 апреля 2015 года или раньше)
«Коля Колеснік» с канала Crypto Times («Метод сетка», опубликовано 19 августа 2018 года)
«3 ways to use Moving Average Envelopes» Рича Фиттона, опубликованные в «Trader's Nest» (опубликовано 28 ноября 2018 года или раньше)
Скрипт стратегии noro "Robot WhiteBox ShiftMA" v1, опубликованный на платформе TradingView(опубликовано 29 августа 2018 года)
«Moving Average Envelopes: A Popular Trading Tool», статья Investopedia (опубликовано 25 июня 2019 года)
Блог KROOL1980 из Argolabs («Гридерство или Сетка как источник прибыли на форекс», опубликовано 27 февраля 2015 года)
Основные особенности:
1) До 4-х Ордеров в каждом из направлении (Лонг / Шорт)
2) Выбор из 6-ти разных базовых МА, опционально используйте разные МА для открытия и закрытия.
3) Используйте разные таймфреймы для расчета MA, без перерисовки и "эффекта стеклянного шара".
4) Фиксированный размер ордера, а не стратегия Мартингейла
5) Возможность закрытия открытой позиции заблаговременно, используя параметр Deviation
6) Код реализован на PineScript v4
Описание параметров:
Lot - % от вашего первоначального баланса, используется при расчете размера Ордера
Timeframe Short - таймфрейм, используемый для расчета МА Открытия Шорт позиций, может быть выбран из списка, по умолчанию - таймфрейм текущего графика
MA Type Short - тип MA, используемый для расчета МА Открытия Шорт позиций, может быть выбран из списка, по умолчанию SMA
Data Short - источник цены для расчета МА Открытия Шорт позиций, может быть выбран из списка, по умолчанию OHLC4
MA Length Short - период, используемый для расчета МА Открытия Шорт позиций, должен быть >= 1, по умолчанию 3
MA Offset Short - смещение значения MA, используемого для расчета Шорт Ордеров, должно быть >= 0, по умолчанию 0
Timeframe Long - таймфрейм, используемый для расчета МА Открытия Лонг позиций, может быть выбран из списка, по умолчанию - таймфрейм текущего графика
MA Type Long - тип MA, используемый для расчета МА Открытия Лонг позиций, может быть выбран из списка, по умолчанию SMA
Data Long - источник цены для расчета МА Открытия Лонг позиций, может быть выбран из списка, по умолчанию OHLC4
MA Length Long - период, используемый для расчета МА Открытия Лонг позиций, должен быть >= 1, по умолчанию 3
MA Offset Long - смещение значения MA, используемого для расчета Лонг Ордеров, должно быть >= 0, по умолчанию 0
Mode close MA Short - Включает отдельное MA для закрытия Шорт позиции, по умолчанию «false». Если false, MA Закрытия = MA Открытия
Timeframe Short Close - таймфрейм, используемый для расчета МА Закрытия Шорт позиций, может быть выбран из списка, по умолчанию - таймфрейм текущего графика
MA Type Close Short - тип MA, используемый при расчете МА Закрытия Шорт позиции. Mожно выбрать из списка, по умолчанию SMA
Data Short Close - источник цены для расчета МА Закрытия Шорт позиций, может быть выбран из списка, по умолчанию OHLC4
MA Length Short Close - период, используемый для расчета МА Закрытия Шорт позиции, должен быть >= 1, по умолчанию 3
Short Deviation - % отклонения от значения MA, используется для закрытия позиции выше или ниже рассчитанного значения MA, может быть отрицательным, по умолчанию 0
MA Offset Short Close - смещение значения MA, используемого для расчета закрытия Шорт позиции, должно быть >= 0, по умолчанию 0
Mode close MA Long - Включает разные MA для закрытия Лонг позиции, по умолчанию «false». Если false, MA Закрытия = MA Открытия
Timeframe Long Close - таймфрейм, используемый для расчета МА Закрытия Лонг позиций, может быть выбран из списка, по умолчанию - таймфрейм текущего графика
MA Type Close Long - тип MA, используемый при расчете МА Закрытия Лонг позиции. Mожно выбрать из списка, по умолчанию SMA
Data Long Close - источник цены для расчета МА Закрытия Лонг позиций, может быть выбран из списка, по умолчанию OHLC4
MA Length Long Close - период, используемый для расчета МА Закрытия Лонг позиции, должен быть >= 1, по умолчанию 3
Long Deviation -% для перехода от значения MA, используется для закрытия позиции выше или ниже рассчитанного значения MA, может быть отрицательным, по умолчанию 0
MA Offset Long Close - смещение значения MA, используемого для расчета закрытия Лонг позиции, должно быть >= 0, по умолчанию 0
Short Shift 1..4 - % от значения MA для размещения Ордеров, для Шорт Ордеров должен быть положительным, чем выше номер, тем выше должна располагаться позиция Shift, например: «Shift 1 = 1, Shift 2 = 2 и т.д. "
Long Shift 1..4 - % от значения MA для размещения Ордеров, для Лонг Ордеров должно быть отрицательным, чем ниже число, тем ниже должна располагаться позиция Shift, например: «Shift 1 = -1, Shift 2 = -2, и т.д."
From Year 20XX - Год начала тестирования, из-за ориентированности на криптовалюты поддерживаются только значения формата 20хх.
To Year 20XX - Год окончания тестирования, из-за ориентированности на криптовалюты поддерживаются только значения формата 20хх.
From Month - Начальный месяц, опционально, менять не рекомендуется
To Month - Конечный месяц, опционально, менять не рекомендуется
From day - Начальный день месяца, опционально, менять не рекомендуется
To day - Конечный день месяца, опционально, менять не рекомендуется
Пояснения к графику:
Зеленые линии - Лонг Ордера.
Красные линии - Шорт Ордера.
Оранжевая линия - MA Закрытия Шорт позиций.
Лаймовая линия - MA Закрытия Лонг позиций.

Awesome Moving AveragesThis script allows you to add up to four simple and exponential moving averages the the chart instead of adding 4 simple moving averages and 4 exponential moving averages individually.
The stronger lines are SMA's and the thinner lines are EMA's.
White - "1st SMA" and "1st EMA"
Green - "2nd SMA" and "2nd EMA"
Blue - "3rd SMA" and "3rd EMA"
Red - "4th SMA" and "4th EMA"
You can modify which moving averages are visible on the chart and also modify the period of the moving averages.
There are four periods which you can edit - each period applies to a pair of moving averages (a pair of SMA and EMA). For example: "1st MA Length" option applies to "1st SMA" and "1st EMA" etc.
ibb.co
In addition to that Awesome Moving Averages script allows you to keep the daily moving averages resolution on intraday charts.
For example - here we have only "1st SMA" and "1st EMA" enabled and we are viewing a daily chart:
Now if we have "Keep Daily MA Resolution On Intraday Periods" option enabled we would see the daily moving averages (SMA and EMA) on intraday periods. Here we are viewing a 4h chart:
If you disable this option you would see the moving averages on intraday charts with the intraday MA lengths as you expect:
"Visible MA's On Intraday Periods" option allows you to choose which MA's you would like to be visible on intraday charts if the "Keep Daily MA Resolution On Intraday Periods" option is enabled.
If you have any thoughts or ideas on how to improve the "Awesome Moving Averages" script then let me know!

GMACD MTF EMA14 Strategy (1H TF)GMACD MTF EMA14 Strategy (1H TF) - FINAL SAFE
Overview
The GMACD MTF EMA14 Strategy is a multi-timeframe momentum trading strategy designed for the 1-hour timeframe. It combines a custom GMACD (Geometric MACD) with multi-timeframe EMA14 alignment to generate high-probability long and short trade signals. The strategy includes state-controlled entries and unique alerts to ensure trades are executed only once per confirmed setup.
Key Components
GMACD Core
Uses a custom geometric MACD formula with fast (12), slow (26), and smooth (14) lengths.
Signal line is an EMA of the GMACD with a length of 9.
GMACD normalizes price movement against the daily range (high-low), making it more sensitive to momentum changes.
Multi-Timeframe EMA14 Filter (MTF)
EMA14 is calculated on 15m, 30m, and 1H timeframes.
Bullish alignment: price closes above at least 2 of the 3 EMAs.
Bearish alignment: price closes below at least 2 of the 3 EMAs.
Acts as a trend filter, ensuring trades align with broader momentum.
Signal Conditions
Long Entry: GMACD > Signal AND EMA14 bullish alignment.
Short Entry: GMACD < Signal AND EMA14 bearish alignment.
Signals are triggered only when both momentum and trend conditions are met.
State-Controlled Alerts & Entries
Ensures unique entries per trade condition.
Alerts notify traders of confirmed setups with detailed reasoning:
"GMACD LONG | MACD > Signal | EMA14 aligned (15m,30m,1H)"
"GMACD SHORT | MACD < Signal | EMA14 aligned (15m,30m,1H)"
Avoids repeated alerts during ongoing trades.
Momentum + Trend Confluence: Combines momentum (GMACD) with trend alignment (MTF EMA14) to improve trade quality.
Multi-Timeframe Confirmation: Reduces false signals by requiring at least 2 timeframes to confirm trend direction.
Automated Alerts: Traders receive instant notifications when setups occur.
Safe Execution: State-controlled logic prevents repeated entries and false signals.
Customizable: All key parameters (GMACD lengths, EMA length, timeframes) can be adjusted for optimization.
Visual Reference: GMACD and Signal plotted on the chart for quick visual confirmation.
How Traders Can Use This Strategy
Intraday or Swing Trading (1H TF)
Ideal for 1-hour charts, capturing medium-term momentum moves.
Signal Confirmation
Use the dashboard plot (GMACD vs Signal) and EMA alignment to confirm trade direction.
Alerts for Active Monitoring
Traders can set alerts to receive notifications without constantly watching the charts.
Risk Management
Since the strategy ensures trades align with multi-timeframe trend, stop-loss placement and position sizing can be optimized based on volatility or account risk tolerance.
Summary
The GMACD MTF EMA14 Strategy is a robust and safe momentum trading tool for traders who want:
Multi-timeframe confirmation
Unique, actionable alerts
Momentum-based trade entries with trend filter
It’s especially suitable for traders looking for mechanical entries in trending markets, reducing emotional decisions while capturing high-probability trades.

Rate Trail IndicatorRate Trail Indicator Precision Trailing Stop & Multi-Timeframe Highs
Description The Rate Trail Indicator V2 is a professional-grade risk management tool designed to declutter your charts while providing precise, dynamic stop-loss levels. Unlike traditional indicators that paint a continuous "trail" or history across the chart, this script utilizes a Single Line visual approach. It draws only the currently active stop-loss level as a distinct horizontal line, keeping your workspace clean and focused on current price action.
This updated version now includes extensive Multi-Timeframe (MTF) Support, allowing you to overlay key Intraday and Higher Timeframe (HTF) highs directly on your chart.
Key Features Clean "Single Line" Visuals: Removes historical noise by plotting only the active stop-loss level and a dedicated price label. Dual Logic Modes: Percentage Mode: Classic trailing stop based on a percentage drop from the high. Renko Mode: Volatility-based stop that counts exact "Bricks" (supports decimals like 1.5 bricks). Dynamic Reset: The stop trails the "Lifetime High" of the current trend. If the stop is breached, it automatically resets to the current price to begin a new trail immediately. MTF High Breakout Levels: Optional toggles to display previous Intraday Highs (2H, 4H, 6H, 12H) and Historical Highs (1W, 2W, 1M, 3M). Rolling 3-Month Logic: The 3M level now uses a "Rolling" lookback (Highest of the last 3 monthly candles) rather than a fixed calendar quarter, ensuring the data is always recent and relevant. Full Customization: Control line styles (Solid, Dashed, Dotted), colors, and widths for every level independently via the inputs.
How to Use & Settings
1. Main Trailing Stop Setup Configure your primary risk line (Red Line) in the "Main Trailing Stop" group. Stop-Loss Mode: Select Percentage for standard equity/crypto trading (e.g., 2% trail) or Renko Boxes for Renko charts. Renko Boxes Down: Enter the number of bricks to trail. You can use decimals (e.g., 1.5) for fine-tuning. Use Fixed Lookback?: Unchecked (Default): The script tracks the "Infinite High" since the last reset. This is ideal for catching long trends. Checked: The script only looks at the highest price of the last X bars. This creates a more "rolling" stop-loss.
2. Intraday & Historical Highs (Resistance/Breakout) Enable up to eight additional lines to see where the price peaked on other timeframes. These act as strong breakout or resistance levels. Intraday Highs: Show the high of the previous 2H, 4H, 6H, or 12H session. 1W / 1M Highs: The highest price of the previous Week or Month. 2W High: The highest price of the last 2 Weeks . 3M High (Updated): The highest price of the last 3 Months (Rolling). This updates monthly, ensuring you aren't looking at data that is 6 months old.
3. Alerts You can set specific alerts to automate your trading or get notified instantly. Main Stop Breached: Fires when price closes below your trailing stop line. MTF High Cross: Fires when price crosses under any of the enabled Intraday or HTF High levels (2H, 4H, 1W, 3M, etc.).

SVP + candle + Max volume [midst]
SVP + DALY CANDLE + MAX VOLUME
A comprehensive trading indicator that combines Session Volume Profile (SVP), Higher Timeframe (HTF) Candles, and Intrabar Max Volume Price Detection into one powerful tool. Perfect for traders who want to understand price action, volume distribution, and key levels all in one place.
KEY FEATURES
Session Volume Profile
• Real-time volume distribution across price levels for the current session
• Point of Control (POC) - identifies the price with the highest traded volume
• Value Area High (VAH) & Low (VAL) - shows where 70% of the volume occurred (customizable percentage)
• Color-coded volume bars - distinguish between up volume (bullish) and down volume (bearish)
• Value area highlighting - clearly see the most important price zones
Higher Timeframe Candle Display
• Visual daily (or custom timeframe) candle overlaid on your current chart
• OHLC labels - see Open, High, Low, and Close prices clearly marked
• Fully customizable colors - separate colors for bullish/bearish bodies, borders, and wicks
• Adjustable positioning - move the candle and labels to your preferred location
Max Volume Price Detection
• Identifies the exact price level with maximum volume within each bar
• Uses Lower Timeframe (LTF) data for precise volume analysis (Premium+ required)
• Simple mode fallback - works on all TradingView plans
• Previous max volume marker - displays previous bar's max volume as a reference dot
• Real-time calculation - updates as each bar forms
ATR Table
• Dynamic ATR-based stop levels - automatically calculates potential stop-loss levels
• Multiple smoothing methods - RMA, SMA, EMA, WMA
• Customizable multiplier - adjust for your risk tolerance
• Clean table display - shows ATR value, high stop, and low stop
PERFECT FOR
Day traders analyzing intrabar volume distribution
Swing traders wanting HTF context on lower timeframes
Volume profile traders looking for key support/resistance levels
Price action traders seeking high-probability entry zones
HOW TO USE
Volume Profile Analysis
POC often acts as a magnet for price. VAH/VAL are key support/resistance levels. High volume nodes indicate strong price acceptance, while low volume nodes suggest potential breakout zones.
HTF Candle Context
See daily range while trading on 5m-1h charts. Daily open often acts as pivot point. Daily high/low are key levels to watch.
Max Volume Price
Black line shows where most volume traded in each bar. Previous max volume (dot) helps identify institutional activity. Clusters of max volume create strong support/resistance. Can possibly indicate a Wick bounce
ATR Stops
Use ATR-based levels for logical stop placement. Adjust multiplier based on market volatility.
SETTINGS & CUSTOMIZATION
Positioning
Control the global offset to move both candle and profile together. Fine-tune with individual offsets for candle and profile spacing.
Volume Profile
Adjustable number of rows (50-500) for granular or simplified view. Customizable width and placement (left/right). Value Area percentage control. Full color customization for all volume components.
HTF Candle
Any timeframe selection (default: Daily). Full color customization for bull/bear candles. Adjustable candle width. Toggle OHLC labels on/off. Control label distance and line widths.
Max Volume Price
Choose between Simple (all plans) or LTF mode (Premium+). Auto or manual LTF resolution. Custom color and line width. Toggle current and previous markers independently.
TECHNICAL NOTES
Maximum 5000 bars lookback for volume calculations
Works on all timeframes
LTF max volume requires TradingView Premium or higher
Optimized for performance with efficient array operations
For best results, use on liquid instruments with reliable volume data
Most effective on intraday charts (5min-1hour) for day trading and scalping strategies
For Entertainment and information only
Created by midst

InCrypto WatermarkInCrypto Watermark
A customizable overlay indicator that displays essential trading information directly on your TradingView charts. This tool helps traders quickly access key market data without cluttering the chart interface.
KEY FEATURES:
• Symbol Information: Displays current trading pair and active timeframe
• Price Display: Optional current price with smart precision formatting
• Price Change: Optional price change percentage over 24 bars with color-coded indicators
• Date & Time: Multiple format options for date (DD/MM/YYYY, MM/DD/YYYY, YYYY-MM-DD, DD.MM.YYYY) and time (HH:MM, HH:MM:SS)
• Custom Text: Customizable title and subtitle text
• Full Customization: Adjustable positioning, colors, sizes, alignment, and opacity for all elements
• Visibility Controls: Show/hide individual elements independently
• Background Options: Customizable background color, opacity, and optional borders
SETTINGS:
The indicator is organized into logical groups:
- Text Content: Title and subtitle customization
- Visibility: Individual show/hide controls for each element
- Watermark Position: Flexible placement options
- Symbol Info Position: Separate positioning controls
- Cell Size: Width and height adjustments
- Title/Subtitle/Symbol Info Settings: Color, size, alignment, and opacity controls
- Background Settings: Background color, opacity, and border options
USE CASES:
• Chart branding for trading groups or channels
• Quick reference for essential trading information
• Professional-looking charts for screenshots
• Multi-timeframe analysis assistance
TECHNICAL DETAILS:
• Pine Script v6
• Overlay indicator
• Works on all TradingView-supported markets and timeframes
• Real-time updates
HOW TO USE:
1. Add the indicator to your chart
2. Customize title and subtitle in Text Content settings
3. Adjust positioning for watermark and symbol info sections
4. Enable/disable individual information elements as needed
5. Fine-tune colors, sizes, and opacity to match your chart style
The indicator automatically adjusts price precision based on the asset's price level. Price change is calculated over 24 bars of the current timeframe (not 24 hours).
DISCLAIMER:
This indicator is for informational purposes only. It does not constitute investment advice, financial advice, trading advice, or any other type of advice. Past performance does not guarantee future results. Always conduct your own research and risk management before making trading decisions. Trading involves substantial risk of loss and is not suitable for every investor.

Gyspy Bot Trade Engine - V1.2B - Strategy 12-7-25 - SignalLynxGypsy Bot Trade Engine (MK6 V1.2B) - Ultimate Strategy & Backtest
Brought to you by Signal Lynx | Automation for the Night-Shift Nation 🌙
1. Executive Summary & Architecture
Gypsy Bot (MK6 V1.2B) is not merely a strategy; it is a massive, modular Trade Engine built specifically for the TradingView Pine Script environment. While most strategies rely on a single dominant indicator (like an RSI cross or a MACD flip) to generate signals, Gypsy Bot functions as a sophisticated Consensus Algorithm.
The engine calculates data from up to 12 distinct Technical Analysis Modules simultaneously on every bar closing. It aggregates these signals into a "Vote Count" and only executes a trade entry when a user-defined threshold of concurring signals is met. This "Voting System" acts as a noise filter, requiring multiple independent mathematical models—ranging from volume flow and momentum to cyclical harmonics and trend strength—to agree on market direction before capital is committed.
Beyond entries, Gypsy Bot features a proprietary Risk Management suite called the Dump Protection Team (DPT). This logic layer operates independently of the entry modules, specifically scanning for "Moon" (Parabolic) or "Nuke" (Crash) volatility events to force-exit positions, overriding standard stops to preserve capital during Black Swan events.
2. ⚠️ The Philosophy of "Curve Fitting" (Must Read)
One must be careful when applying Gypsy Bot to new pairs or charts.
To be fully transparent: Gypsy Bot is, by definition, a very advanced curve-fitting engine. Because it grants the user granular control over 12 modules, dozens of thresholds, and specific voting requirements, it is extremely easy to "over-fit" the data. You can easily toggle switches until the backtest shows a 100% win rate, only to have the strategy fail immediately in live markets because it was tuned to historical noise rather than market structure.
To use this engine successfully, you must adopt a specific optimization mindset:
Ignore Raw Net Profit: Do not tune for the highest dollar amount. A strategy that makes $1M in the backtest but has a 40% drawdown is useless.
Prioritize Stability: Look for a high Profit Factor (1.5+), a high Percent Profitable, and a smooth equity curve.
Regular Maintenance is Mandatory: Markets shift regimes (e.g., from Bull Trend to Crab Range). Parameters that worked perfectly in 2021 may fail in 2024. Gypsy Bot settings should be reviewed and adjusted at regular intervals (e.g., quarterly) to ensure the voting logic remains aligned with current market volatility.
Timeframe Recommendations:
Gypsy Bot is optimized for High Time Frame (HTF) trend following. It generally produces the most reliable results on charts ranging from 1-Hour to 12-Hours, with the 4-Hour timeframe historically serving as the "sweet spot" for most major cryptocurrency assets.
3. The Voting Mechanism: How Entries Are Generated
The heart of the Gypsy Bot engine is the ActivateOrders input (found in the "Order Signal Modifier" settings).
The engine constantly monitors the output of all enabled Modules.
Long Votes: GoLongCount
Short Votes: GoShortCount
If you have 10 Modules enabled, and you set ActivateOrders to 7:
The engine will ONLY trigger a Buy Entry if 7 or more modules return a valid "Buy" signal on the same closed candle.
If only 6 modules agree, the trade is rejected.
This allows you to mix "Leading" indicators (Oscillators) with "Lagging" indicators (Moving Averages) to create a high-probability entry signal that requires momentum, volume, and trend to all be in alignment.
4. Technical Deep Dive: The 12 Modules
Gypsy Bot allows you to toggle the following modules On/Off individually to suit the asset you are trading.
Module 1: Modified Slope Angle (MSA)
Logic: Calculates the geometric angle of a moving average relative to the timeline.
Function: It filters out "lazy" trends. A trend is only considered valid if the slope exceeds a specific steepness threshold. This helps avoid entering trades during weak drifts that often precede a reversal.
Module 2: Correlation Trend Indicator (CTI)
Logic: Based on John Ehlers' work, this measures how closely the current price action correlates to a straight line (a perfect trend).
Function: It outputs a confidence score (-1 to 1). Gypsy Bot uses this to ensure that we are not just moving up, but moving up with high statistical correlation, reducing fake-outs.
Module 3: Ehlers Roofing Filter
Logic: A sophisticated spectral filter that combines a High-Pass filter (to remove long-term drift) with a Super Smoother (to remove high-frequency noise).
Function: It attempts to isolate the "Roof" of the price action. It is excellent at catching cyclical turning points before standard moving averages react.
Module 4: Forecast Oscillator
Logic: Uses Linear Regression forecasting to predict where price "should" be relative to where it is.
Function: When the Forecast Oscillator crosses its zero line, it indicates that the regression trend has flipped. We offer both "Aggressive" and "Conservative" calculation modes for this module.
Module 5: Chandelier ATR Stop
Logic: A volatility-based trend follower that hangs a "leash" (ATR multiple) from the highest high (for longs) or lowest low (for shorts).
Function: Used here as an entry filter. If price is above the Chandelier line, the trend is Bullish. It also includes a "Bull/Bear Qualifier" check to ensure structural support.
Module 6: Crypto Market Breadth (CMB)
Logic: This is a macro-filter. It pulls data from multiple major tickers (BTC, ETH, and Perpetual Contracts) across different exchanges.
Function: It calculates a "Market Health" percentage. If Bitcoin is rising but the rest of the market is dumping, this module can veto a trade, ensuring you don't buy into a "fake" rally driven by a single asset.
Module 7: Directional Index Convergence (DIC)
Logic: Analyzes the convergence/divergence between Fast and Slow Directional Movement indices.
Function: Identifies when trend strength is expanding. A buy signal is generated only when the positive directional movement overpowers the negative movement with expanding momentum.
Module 8: Market Thrust Indicator (MTI)
Logic: A volume-weighted breadth indicator. It uses Advance/Decline data and Up/Down Volume data.
Function: This is one of the most powerful modules. It confirms that price movement is supported by actual volume flow. We recommend using the "SSMA" (Super Smoother) MA Type for the cleanest signals on the 4H chart.
Module 9: Simple Ichimoku Cloud
Logic: Traditional Japanese trend analysis using the Tenkan-sen and Kijun-sen.
Function: Checks for a "Kumo Breakout." Price must be fully above the Cloud (for longs) or below it (for shorts). This is a classic "trend confirmation" module.
Module 10: Simple Harmonic Oscillator
Logic: Analyzes the harmonic wave properties of price action to detect cyclical tops and bottoms.
Function: Serves as a counter-trend or early-reversal detector. It tries to identify when a cycle has bottomed out (for buys) or topped out (for sells) before the main trend indicators catch up.
Module 11: HSRS Compression / Super AO
Logic: Two options in one.
HSRS: Hirashima Sugita Resistance Support. Detects volatility compression (squeezes) relative to dynamic support/resistance bands.
Super AO: A combination of the Awesome Oscillator and SuperTrend logic.
Function: Great for catching explosive moves that result from periods of low volatility (consolidation).
Module 12: Fisher Transform (MTF)
Logic: Converts price data into a Gaussian normal distribution.
Function: Identifies extreme price deviations. This module uses Multi-Timeframe (MTF) logic to look at higher-timeframe trends (e.g., looking at the Daily Fisher while trading the 4H chart) to ensure you aren't trading against the major trend.
5. Global Inhibitors (The Veto Power)
Even if 12 out of 12 modules vote "Buy," Gypsy Bot performs a final safety check using Global Inhibitors. If any of these are triggered, the trade is blocked.
Bitcoin Halving Logic:
Hardcoded dates for past and projected future Bitcoin halvings (up to 2040).
Trading is inhibited or restricted during the chaotic weeks immediately surrounding a Halving event to avoid volatility crushes.
Miner Capitulation:
Uses Hash Rate Ribbons (Moving averages of Hash Rate).
If miners are capitulating (Shutting down rigs due to unprofitability), the engine flags a "Bearish" regime and can flip logic to Short-only or flat.
ADX Filter (Flat Market Protocol):
If the Average Directional Index (ADX) is below a specific threshold (e.g., 20), the market is deemed "Flat/Choppy." The bot will refuse to open trend-following trades in a flat market.
CryptoCap Trend:
Checks the total Crypto Market Cap chart. If the broad market is in a downtrend, it can inhibit Long entries on individual altcoins.
6. Risk Management & The Dump Protection Team (DPT)
Gypsy Bot separates "Entry Logic" from "Risk Management Logic."
Dump Protection Team (DPT)
This is a specialized logic branch designed to save the account during Black Swan events.
Nuke Protection: If the DPT detects a volatility signature consistent with a flash crash, it overrides all other logic and forces an immediate exit.
Moon Protection: If a parabolic pump is detected that violates statistical probability (Bollinger deviations), DPT can force a profit take before the inevitable correction.
Advanced Adaptive Trailing Stop (AATS)
Unlike a static trailing stop (e.g., "trail by 5%"), AATS is dynamic.
Penthouse Level: If price is at the top of the HSRS channel (High Volatility), the stop loosens to allow for wicks.
Dungeon Level: If price is compressed at the bottom, the stop tightens to protect capital.
Staged Take Profits
TP1: Scalp a portion (e.g., 10%) to cover fees and secure a win.
TP2: Take the bulk of profit.
TP3: Leave a "Runner" position with a loose trailing stop to catch "Moon" moves.
7. Recommended Setup Guide
When applying Gypsy Bot to a new chart, follow this sequence:
Set Timeframe: 4 Hours (4H).
Reset: Turn OFF Trailing Stop, Stop Loss, and Take Profits. (We want to see raw entry performance first).
Tune DPT: Adjust "Dump/Moon Protection" inputs first. These have the highest impact on net performance.
Tune Module 8 (MTI): This module is a heavy filter. Experiment with the MA Type (SSMA is recommended).
Select Modules: Enable/Disable modules 1-12 based on the asset's personality (Trending vs. Ranging).
Voting Threshold: Adjust ActivateOrders. A lower number = More Trades (Aggressive). A higher number = Fewer, higher conviction trades (Conservative).
Final Polish: Re-enable Stop Losses, Trailing Stops, and Staged Take Profits to smooth the equity curve and define your max risk per trade.
8. Technical Specs
Engine Version: Pine Script V6
Repainting: This strategy uses Closed Candle data for all Risk Management and Entry decisions. This ensures that Backtest results align closely with real-time behavior (no repainting of historical signals).
Alerts: This script generates Strategy alerts. If you require visual-only alerts, see the source code header for instructions on switching to "Study" (Indicator) mode.
Disclaimer:
This script is a complex algorithmic tool for market analysis. Past performance is not indicative of future results. Use this tool to assist your own decision-making, not to replace it.
9. About Signal Lynx
Automation for the Night-Shift Nation 🌙
Signal Lynx focuses on helping traders and developers bridge the gap between indicator logic and real-world automation. The same RM engine you see here powers multiple internal systems and templates, including other public scripts like the Super-AO Strategy with Advanced Risk Management.
We provide this code open source under the Mozilla Public License 2.0 (MPL-2.0) to:
Demonstrate how Adaptive Logic and structured Risk Management can outperform static, one-layer indicators
Give Pine Script users a battle-tested RM backbone they can reuse, remix, and extend
If you are looking to automate your TradingView strategies, route signals to exchanges, or simply want safer, smarter strategy structures, please keep Signal Lynx in your search.
License: Mozilla Public License 2.0 (Open Source).
If you make beneficial modifications, please consider releasing them back to the community so everyone can benefit.
