50-100-200 Day SMAA simple indicator that display the 50, 100, and 200 Daily SMA. It will always display the DAILY 50,100, 200, regardless of the time frame you are looking at. Makes it easy to quickly display these key averages while also looking at smaller timeframes like 1H candles.
ابحث في النصوص البرمجية عن "daily"

tvial/4MA Daily 20/50/100/200This indicator allows you to:
- display 4 Simple Moving Averages (SMA) at the same time with a single indicator
- display these MA in a DAILY timeframe whatever your current timeframe (4H in the example)
- settings are 20/50/100/200 but can be overridden
Simple but efficient.
Check my other indicators & strategy , they all start with "tvial/".

Pivot Points (with Mid-Pivots)Brief Description
Pivot points are horizontal support and resistance lines placed on a price chart. They make strong levels of support and resistance because banks, financial institutions and many traders use them.
The indicator is set to the Daily Pivot Range by default (no support for weekly, monthly, quarterly, or yearly Pivots).
Indicator Settings
Show Mid-Pivots?
Show R3 and S3 levels?
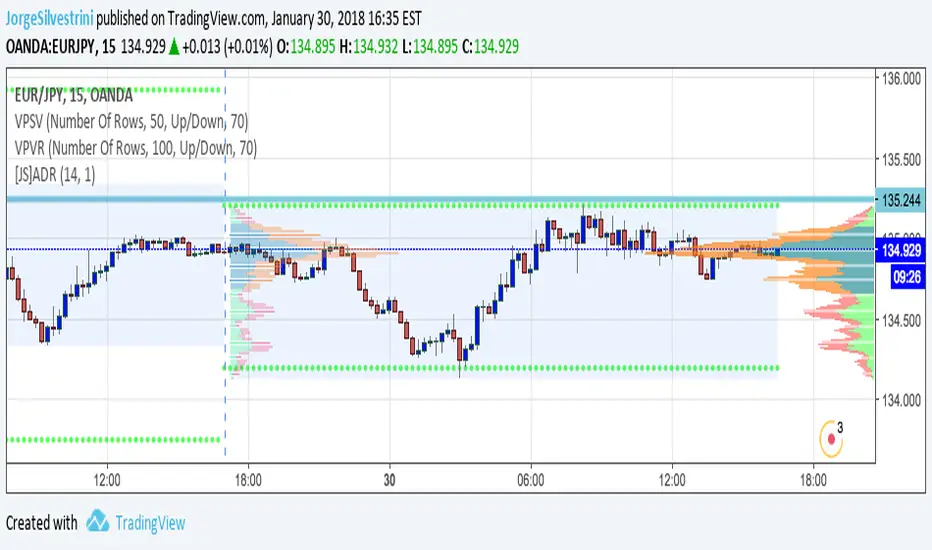
ADR - Average Daily Range [@treypeng] [v2]
This is an intraday indicator.
Average Daily Range provides an upper and lower level around the daily open. It is calculated by taking an EMA/SMA average of a given number of previous days' True Range.
It can be useful for helping guide support and resistance, for taking profits and for placing stops.
It's a similar idea to the ATR indicator, but calculated on a daily timeframe only.
Settings:
Length: number of days to take an average from
Offset: Set this to 0 to include today's range. Set to 1 to exclude today. Set to 2 to exclude today and yesterday.....and so on.
The other settings should be self explanatory :)

Key Levels [@treypeng]Draws horizontal lines for Daily, Hourly (1) and Weekly levels. Really handy to switch on quickly when scalping.
Light blue: Previous hour OHLC
Thick light blue: Previous hour Close / current hour Open
Dark blue: Yesterday OHLC
Thick dark blue: Yesterday Close / today Open
Purple: Weekly Open
It's a bit ugly, I'd prefer horizontal rays instead of lines stretching back across the chart but I couldn't figure out how to do this in PineScript. If I get it sorted, I'll publish an update.

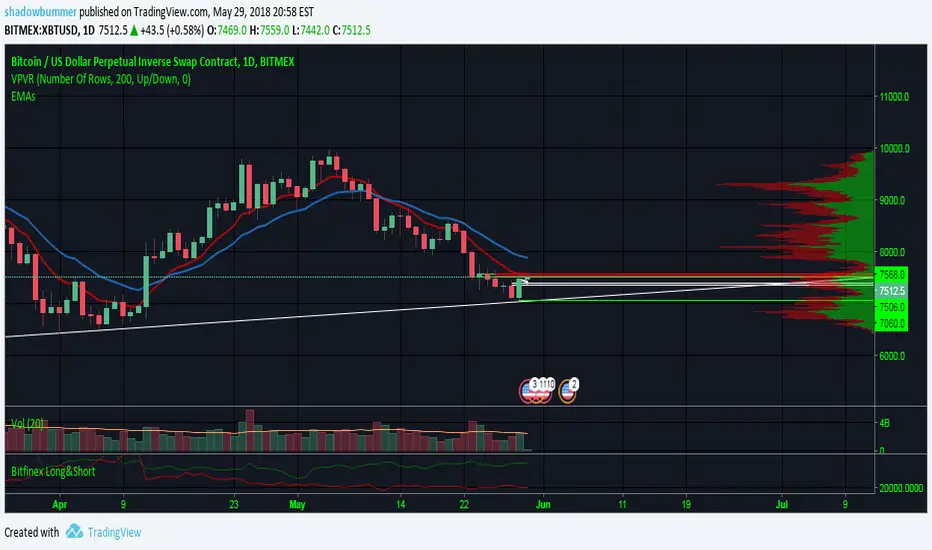
XBT Volatility Weighted Bottom Finder. [For Daily Charts]An update to:
Made it into and indicator.
v. 0.0.1
DESIGNED FOR DAILY CHARTS

Session RangeSimple script for showing the high/low/midrange of a session. By default configured to do the Daily range using the "regular" session. But it's configurable. For example on this chart I am showing the Weekly range.

BTCUSD - Previous Monthly and Daily Resistances [by JQBS]This indicator will plot the previous month's open/close and the last daily's high, low, close.


RSI: Daily + current TimeFrame
It plots the RSI of the current timeframe + the Daily RSI
it hihlights in green (or red) when they are both in oversold (or overbought)

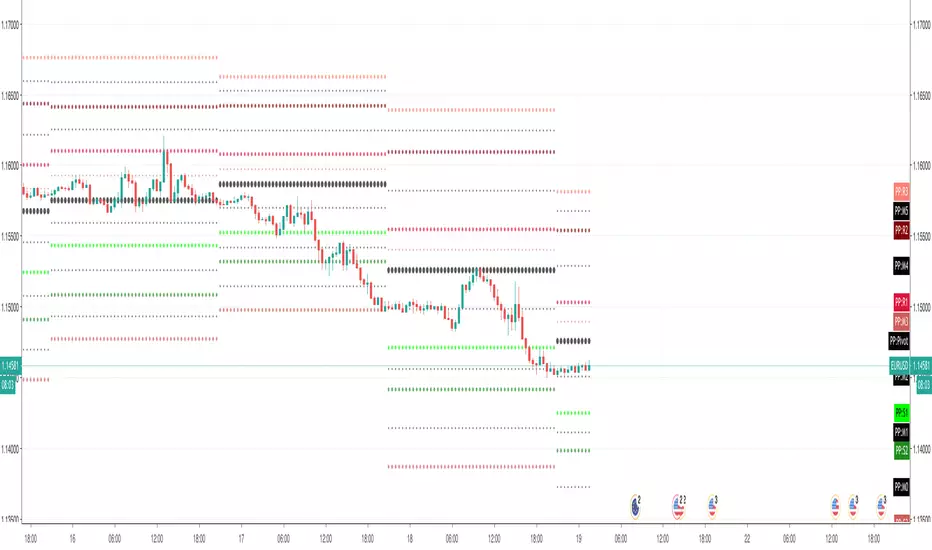
Fibonacci Pivots Enhanced Levels (daily)Fibonacci pivot point levels
multiply the previous day’s range with its corresponding Fibonacci level.
Tradingview Standard Pivot Template includes S/R Levels 1 – 3 only .
I take into account additional Fibonacci pivot levels (S/R 4 – 7) on daily basis (no need for higher timeframes - weekly, monthly).

SMA's for Daily (7 Week//49MA, 30Week//210MA, 55SMA)SMA's for Daily (7 Week//49MA, 30Week//210MA, 55SMA)

OHLC Daily Resolution BandsShout out to nPE- for the idea.
Bands made with stdev from 10 day OHLC.
Keeps resolution to daily, so you can use bands as daily pivots for day trading.
Upper band 1=yesterday close + 0.5 std(ohlc,10)
Upper band 1=yesterday close + 1 std(ohlc,10)
Mid=yesterday close
Lower band 1=yesterday close - 0.5 std(ohlc,10)
Lower band 2=yesterday close - 1 std(ohlc,1

DayHigh - Plot the Moving Average of the Daily HighPlot the Moving Average of the Daily High for short periods of time (i.e 3 day or 5 day). Great for detecting when a stocks SELL pressure is running out and time to switch to a BUY strategy. Use in the DayHIGH indicator for nice price channels on a chart.
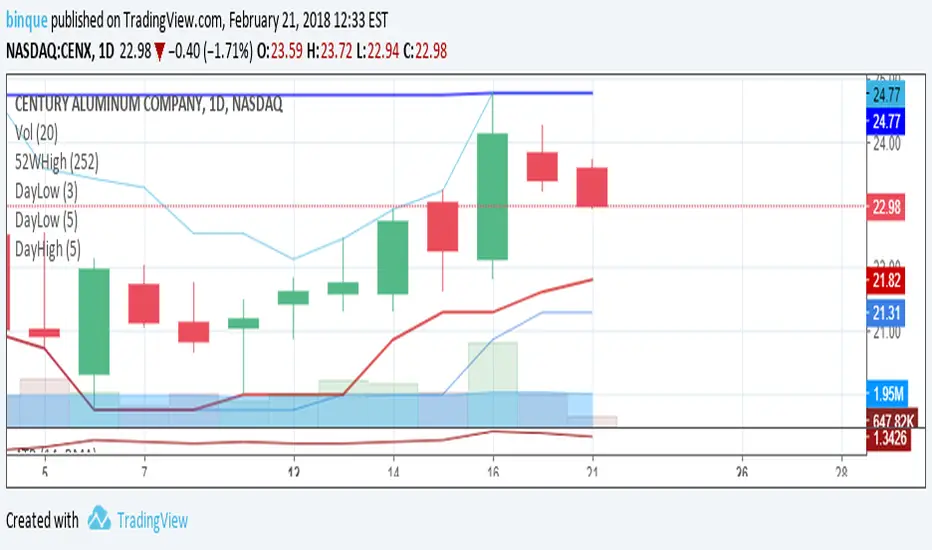
DayLow - Chart the Moving Average of the DAILY LOW PriceThis is a moving average of the Daily LOW Price over a short period of time (i.e. 3 day low moving average, etc...) Great for tracking trailing stops for a stock on an up swing.

Three Bars Down and Inside Bar v2Updated Version of my Script. Script includes a Filter for stocks that are down three days in a row. Also it checks for oversold rsi and inside bars. Works best daily with stocks.

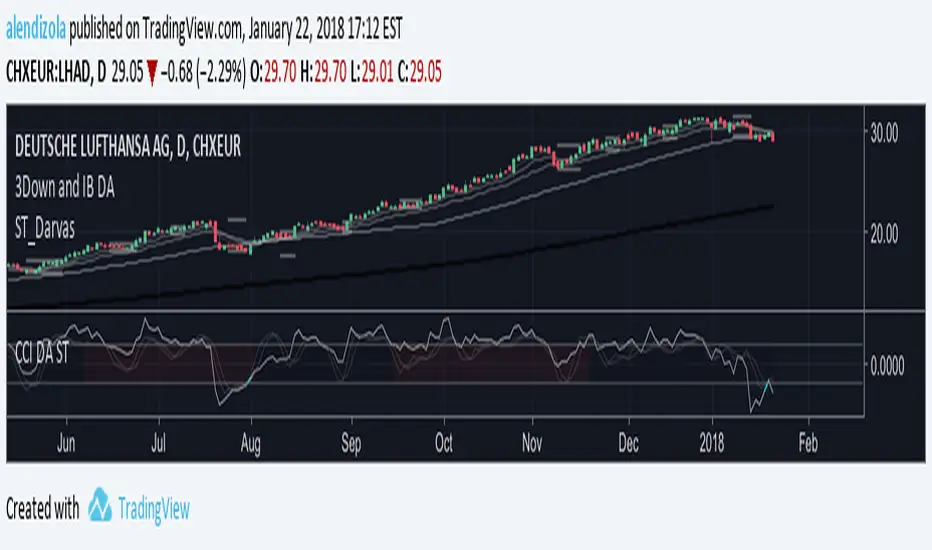
3Down and IB DAScript provides Multiple MAs and checks for 3 Bars down in a row. On top it displays inside Bars. Works best on a daily timeframe with stocks.
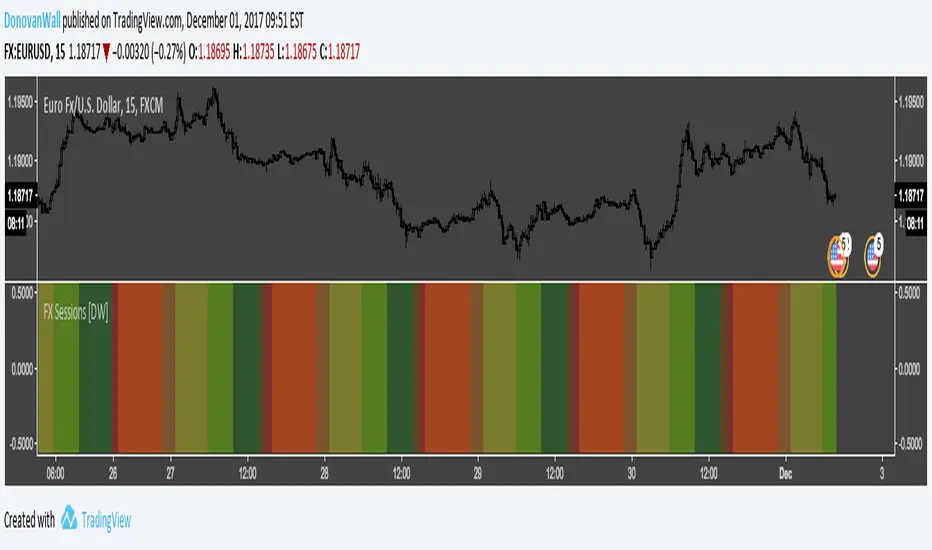
Forex Daily Trading Sessions [DW]This is a simple study designed to highlight the daily forex market sessions. Use it to identify the best sessions to trade your security in.
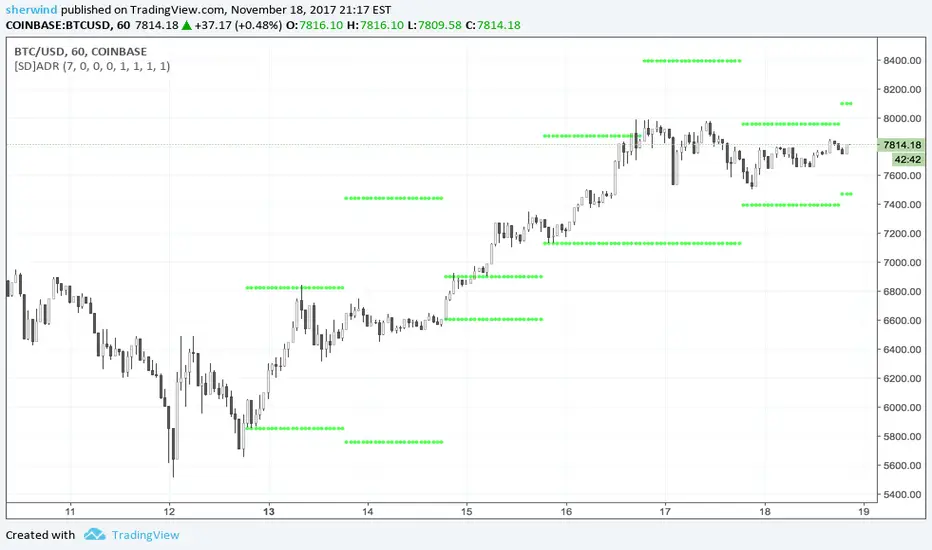
SD - Average Daily Range - Daily Weekly Monthly YearlyAverage Daily Range ('ADR') Indicator for TradingView
This script is based on the "Best 'ADR' Indicator for MT4" described at www.fxdayjob.com
Inputs:
Number of 'ADR' Back - Set the number of calendar days back to plot historical 'ADR'. The default value is 7.
Non-trading days are not taken into account.
A value of 7, for example, would display only 5 'ADR' for a 24x5 market.
Number of 'AWR' Back - Set the number of calendar weeks back to plot historical 'AWR'. The default value is 0.
Number of 'AMR' Back - Set the number of calendar months back to plot historical 'AMR'. The default value is 0.
Number of 'AYR' Back - Set the number of calendar years back to plot historical 'AYR'. The default value is 0.
'ADR' Length parameter - Set the length parameter of 'ADR'. The default value is 1.
'WDR' Length parameter - Set the length parameter of 'AWR'. The default value is 1.
'MDR' Length parameter - Set the length parameter of 'AMR'. The default value is 1.
'YDR' Length parameter - Set the length parameter of 'AYR'. The default value is 1.
See also:
- www.fxdayjob.com
- pivotboss.com
- www.jarrattdavis.com