ابحث في النصوص البرمجية عن "daily"

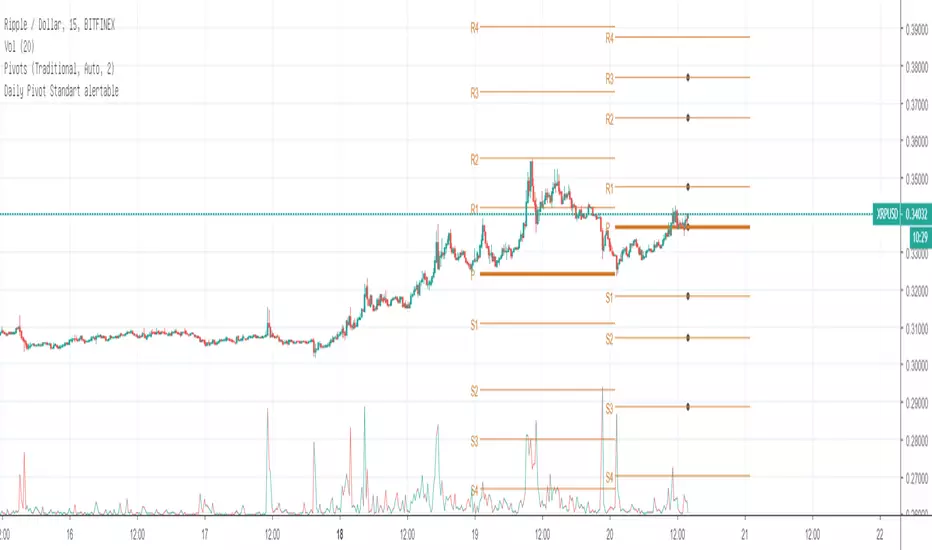
Daily Pivot Standart alertableWith this Indicator u can set allert between the Pivot points s15.directupload.net
So it is useful for scalping
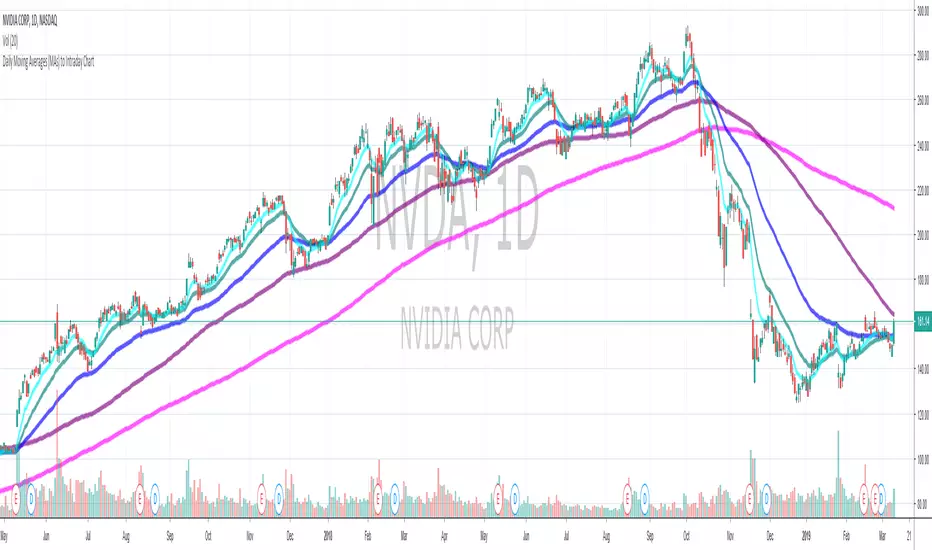
Daily Moving Average to Intraday Chart BradleyRUses Robertob's Script with Mike's colors for Warrior Pro Students.


BTC Swinger v1Daily interval swing trading algorithm based on momentum techniques using ATR Stops. Made by Kory Hoang from Stably.
Shout out to the Advanced Crypto Asset Trading crew! ;)

MY_CME eod OI vs CFTC eow OIDaily e-o-d Open Interest as published by CME.
As CFTC COT Open Interest relates to last Tuesday, here you can have an idea how things evolved day-by-day since then.
As CME total OI is not accessibl as data, here I sum OI of the next 9 outstanding contracts, which gives a fair idea of the trend in OI


MTF EMA Combo with Background ColorDaily/Weekly EMA combo for longer term trend direction, with combo background color for varying trend direction.


Daily Average True Range OverlayPlots the upper and lower average true range away from the previous days close on all time frames.

Daily Deviations (Lazy Edition)
Plots the standard deviation resistance/support lines.
Uses Previous days close and the VIX as the volatility factor.
credit to u/UberBotMan and u/Living_Granger for the idea and formulas

Daily Deviations (Self Input Version)
Plots the standard deviation resistance/support levels.
Input the previous settlement price and the implied volatility.
credit to u/UberBotMan and u/Living_Granger for the idea and formulas
(preview example is using settlement of 2420 and IV of 11)


Daily Returns & STDWhat happened last time when xx increased by xx%? - Start collecting some stats!
You can choose the ticker and the timeframe you're interested in

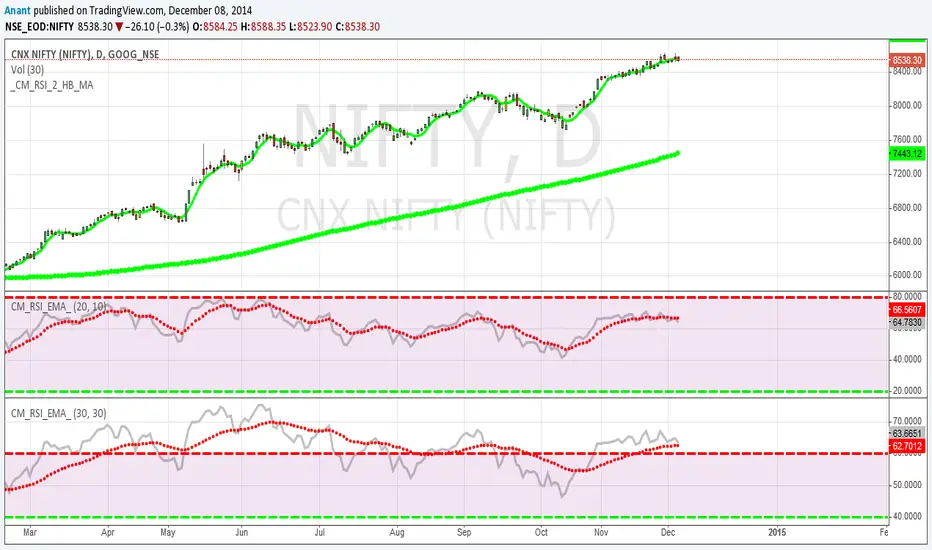
RSI Oversold/UndersoldThe study script will place GREEN BUY arrows BELOW oversold conditions and RED SHORT arrows ABOVE overbought conditions. You can configure the period
Most RSI(14) indicators use a 14-period, I prefer a 5-period. The period, overbought and oversold periods are settings that can easily be changed by adding this study to your chart and clicking the "gear" icon next to the study inside your chart.


Daily SMAThis pine script on intraday chart is exactly the same SMA as built-in MovingAverage on a 1Day chart (with the same lengths)


Top Indicators Suite [Abusuhil]📝 Top Indicators Suite - Complete Description
🌐 English Description Below | الوصف بالعربي في الأسفل
🇬🇧 ENGLISH DESCRIPTION
🎯 Overview
Top Indicators Suite is a comprehensive, professional-grade trading system that combines 8 of the most powerful technical indicators into one seamless, easy-to-use interface. Designed for traders who demand precision, flexibility, and efficiency, this all-in-one suite eliminates the need for multiple indicators cluttering your chart while providing complete customization and control.
⚡ Key Features
✅ 8 Professional Indicators in One System
No need to add multiple indicators separately
Clean, organized interface
Optimized performance with minimal resource usage
✅ Fully Modular Design
Enable/disable any indicator independently
Each indicator maintains its complete functionality
No conflicts or interference between indicators
✅ Complete Customization
Full settings control for every indicator
Customizable colors for all elements
Adjustable parameters to match your trading style
✅ Professional Code Quality
Clean, well-documented Pine Script v6 code
Efficient calculations (under 64 plot limit)
Template system for easy expansion
✅ Suitable for All Markets
Cryptocurrency
Forex
Stocks
Futures
All timeframes supported
📊 Included Indicators
🔷 OVERLAY INDICATORS (On Chart)
1. Moving Averages (4 MAs)
12 MA Types Available: SMA, EMA, WMA, RMA, HMA, VWMA, SWMA, ALMA, LSMA, DEMA, TEMA, ZLEMA
Features:
4 independent moving averages
Individual length, type, and color settings for each MA
Default lengths: 10, 20, 50, 200
All disabled by default for clean chart
Use Case: Trend identification, support/resistance levels, crossover strategies
2. Supertrend
Settings:
ATR Period (default: 10)
Factor/Multiplier (default: 3.0)
Customizable uptrend/downtrend colors
Background fill option
Features:
Clear visual trend direction
Dynamic support/resistance levels
Automatic color switching
Background shading for trend zones
Use Case: Trend following, entry/exit signals, stop-loss placement
3. VWAP (Volume Weighted Average Price)
10 Anchor Period Options:
Session, Week, Month, Quarter, Year, Decade, Century
Earnings, Dividends, Splits (for fundamental analysis)
3 Customizable Bands:
Standard Deviation or Percentage calculation modes
Independent multipliers for each band
Enable/disable each band individually
Default: Band #1 enabled (1.0x multiplier)
Additional Settings:
Hide on 1D or above option
Custom source (HLC3 default)
Offset capability
Use Case: Intraday trading, institutional price levels, mean reversion strategies
🔷 OSCILLATOR INDICATORS (Separate Pane)
4. RSI (Relative Strength Index)
Settings:
Period length (default: 14)
Source selection
Overbought/Oversold/Middle levels (70/30/50)
Optional Moving Average on RSI:
9 MA types available
Independent length setting
Customizable color
Features:
Color-coded background zones
Clear level lines
MA overlay option
Default Status: ✅ Enabled
Use Case: Momentum analysis, divergence trading, overbought/oversold conditions
5. MACD (Moving Average Convergence Divergence)
Settings:
Fast length (default: 12)
Slow length (default: 26)
Signal length (default: 9)
Source selection
EMA/SMA options for both oscillator and signal
Features:
4-color histogram (rising/falling states)
MACD line and Signal line
Zero line reference
Dynamic color changes
Default Status: ❌ Disabled
Use Case: Trend strength, momentum shifts, divergence signals
6. Stochastic Oscillator
Settings:
%K Length (default: 14)
%K Smoothing (default: 1)
%D Smoothing (default: 3)
Customizable upper/middle/lower bands (80/50/20)
Features:
%K and %D lines
Adjustable overbought/oversold levels
Background fill between bands
Color customization
Default Status: ❌ Disabled
Use Case: Reversal signals, overbought/oversold identification, divergence analysis
7. OBV (On Balance Volume)
Settings:
Source selection
7 Moving Average types (None, SMA, SMA+BB, EMA, SMMA, WMA, VWMA)
MA length (default: 14)
Bollinger Bands multiplier (default: 2.0)
Features:
Volume-based momentum indicator
Optional MA smoothing
Bollinger Bands option
Multiple MA types
Default Status: ❌ Disabled
Use Case: Volume confirmation, trend strength, divergence detection
8. ADX (Average Directional Index)
Settings:
ADX Smoothing (default: 14)
DI Length (default: 14)
Features:
Trend strength measurement
Single clean line
Standard calculation
Default Status: ❌ Disabled
Use Case: Trend strength evaluation, filter for ranging markets
🎨 Customization Options
Colors
Every line, band, and background is customizable
Pre-set professional color schemes
Easy color picker interface
Display
Toggle visibility for any indicator
Editable bands and levels
Clean, organized settings groups
Performance
Optimized calculations
Under 64 plots (TradingView limit)
Efficient memory usage
Smooth chart rendering
🔧 Technical Specifications
Pine Script Version: v6
Total Indicators: 8
Total Plots: 22 (well under 64 limit)
Overlay Mode: False (oscillators in separate pane)
Force Overlay: True (for chart indicators)
Code Structure: Modular, template-based
Expandability: Easy to add new indicators
💡 How to Use
Add to Chart: Search "Top Indicators Suite " in TradingView indicators
Configure Settings: Open indicator settings and navigate to each indicator's group
Enable Indicators: Toggle on the indicators you want to use
Customize: Adjust colors, lengths, and parameters to your preference
Trade: Use the combined insights from multiple indicators for better decision-making
📈 Trading Strategies Supported
✅ Trend Following: Moving Averages + Supertrend + ADX
✅ Momentum Trading: RSI + MACD + Stochastic
✅ Volume Analysis: OBV + VWAP
✅ Mean Reversion: VWAP Bands + RSI
✅ Divergence Trading: RSI + MACD + OBV + Stochastic
✅ Multi-Timeframe Analysis: All indicators with various timeframe settings
✅ Confirmation System: Combine multiple indicators for high-probability setups
⚠️ Important Notes
RSI is enabled by default - All other indicators are disabled by default for a clean chart
VWAP hides on Daily and above by default - Can be changed in settings
Overlay mode is false - Chart indicators use force_overlay to display on main chart
Band #1 of VWAP is enabled by default - Bands #2 and #3 are disabled
All settings are independent - Changes to one indicator don't affect others
🎓 Best Practices
Start Simple: Enable 2-3 indicators first, then add more as needed
Avoid Overcrowding: Don't enable all indicators at once unless necessary
Color Coordination: Use consistent color schemes for better visual clarity
Backtesting: Test your indicator combinations before live trading
Timeframe Alignment: Use appropriate indicators for your trading timeframe
Confirmation: Wait for multiple indicators to align before entering trades
📞 Support & Updates
Created by: Abusuhil
License: Creative Commons
Pine Script Version: v6
For questions, suggestions, or custom development, contact through TradingView.
🏆 Why Choose Top Indicators Suite?
✅ Save time - no need to add multiple indicators
✅ Save chart space - one clean interface
✅ Professional quality - thoroughly tested code
✅ Complete control - full customization
✅ Efficient performance - optimized calculations
✅ Regular updates - maintained and improved
✅ Documentation - clear and comprehensive
🇸🇦 الوصف بالعربي
🎯 نظرة عامة
Top Indicators Suite هو نظام تداول احترافي شامل يجمع 8 من أقوى المؤشرات الفنية في واجهة واحدة سهلة الاستخدام. صُمم للمتداولين الذين يطالبون بالدقة والمرونة والكفاءة، هذا النظام المتكامل يلغي الحاجة لإضافة عدة مؤشرات منفصلة مع توفير التحكم الكامل والتخصيص الشامل.
⚡ المميزات الرئيسية
✅ 8 مؤشرات احترافية في نظام واحد
لا حاجة لإضافة مؤشرات متعددة منفصلة
واجهة نظيفة ومنظمة
أداء محسّن مع استهلاك موارد ضئيل
✅ تصميم معياري بالكامل
تفعيل/إيقاف أي مؤشر بشكل مستقل
كل مؤشر يحتفظ بوظائفه الكاملة
لا توجد تعارضات بين المؤشرات
✅ تخصيص كامل
تحكم كامل في إعدادات كل مؤشر
ألوان قابلة للتخصيص لجميع العناصر
معاملات قابلة للتعديل لتناسب أسلوب تداولك
✅ جودة كود احترافية
كود Pine Script v6 نظيف وموثق
حسابات فعّالة (أقل من حد 64 plot)
نظام قوالب لسهولة التوسع
✅ مناسب لجميع الأسواق
العملات الرقمية
الفوركس
الأسهم
العقود الآجلة
جميع الأطر الزمنية مدعومة
📊 المؤشرات المتضمنة
🔷 مؤشرات الشارت (على الرسم البياني)
1. المتوسطات المتحركة (4 متوسطات)
12 نوع متوسط متاح: SMA, EMA, WMA, RMA, HMA, VWMA, SWMA, ALMA, LSMA, DEMA, TEMA, ZLEMA
المميزات:
4 متوسطات متحركة مستقلة
إعدادات فردية للطول والنوع واللون لكل متوسط
الأطوال الافتراضية: 10، 20، 50، 200
جميعها معطلة افتراضيًا للحصول على شارت نظيف
الاستخدام: تحديد الاتجاه، مستويات الدعم/المقاومة، استراتيجيات التقاطع
2. سوبر ترند (Supertrend)
الإعدادات:
فترة ATR (افتراضي: 10)
المضاعف/العامل (افتراضي: 3.0)
ألوان قابلة للتخصيص للاتجاه الصاعد/الهابط
خيار التعبئة الخلفية
المميزات:
اتجاه واضح بصريًا
مستويات دعم/مقاومة ديناميكية
تبديل ألوان تلقائي
تظليل خلفي لمناطق الاتجاه
الاستخدام: متابعة الاتجاه، إشارات الدخول/الخروج، وضع وقف الخسارة
3. VWAP (متوسط السعر المرجح بالحجم)
10 خيارات للفترة الزمنية:
جلسة، أسبوع، شهر، ربع سنة، سنة، عقد، قرن
الأرباح، التوزيعات، الانقسامات (للتحليل الأساسي)
3 نطاقات قابلة للتخصيص:
وضع حساب الانحراف المعياري أو النسبة المئوية
مضاعفات مستقلة لكل نطاق
تفعيل/إيقاف كل نطاق بشكل فردي
افتراضي: النطاق #1 مفعّل (مضاعف 1.0)
إعدادات إضافية:
خيار الإخفاء على الإطار اليومي وما فوق
مصدر مخصص (HLC3 افتراضي)
إمكانية الإزاحة
الاستخدام: التداول اللحظي، مستويات الأسعار المؤسسية، استراتيجيات العودة للمتوسط
🔷 مؤشرات التذبذب (نافذة منفصلة)
4. RSI (مؤشر القوة النسبية)
الإعدادات:
طول الفترة (افتراضي: 14)
اختيار المصدر
مستويات التشبع الشرائي/البيعي/الوسطى (70/30/50)
متوسط متحرك اختياري على RSI:
9 أنواع متوسط متاح
إعداد طول مستقل
لون قابل للتخصيص
المميزات:
مناطق خلفية ملونة
خطوط مستويات واضحة
خيار تراكب MA
الحالة الافتراضية: ✅ مفعّل
الاستخدام: تحليل الزخم، تداول التباعد، ظروف التشبع
5. MACD (تقارب وتباعد المتوسطات المتحركة)
الإعدادات:
الطول السريع (افتراضي: 12)
الطول البطيء (افتراضي: 26)
طول الإشارة (افتراضي: 9)
اختيار المصدر
خيارات EMA/SMA للمذبذب والإشارة
المميزات:
رسم بياني بـ 4 ألوان (حالات الصعود/الهبوط)
خط MACD وخط الإشارة
خط صفر مرجعي
تغييرات ألوان ديناميكية
الحالة الافتراضية: ❌ معطّل
الاستخدام: قوة الاتجاه، تحولات الزخم، إشارات التباعد
6. ستوكاستيك (Stochastic)
الإعدادات:
طول %K (افتراضي: 14)
تنعيم %K (افتراضي: 1)
تنعيم %D (افتراضي: 3)
نطاقات علوية/وسطى/سفلية قابلة للتخصيص (80/50/20)
المميزات:
خطوط %K و %D
مستويات تشبع قابلة للتعديل
تعبئة خلفية بين النطاقات
تخصيص الألوان
الحالة الافتراضية: ❌ معطّل
الاستخدام: إشارات الانعكاس، تحديد التشبع، تحليل التباعد
7. OBV (حجم التداول التراكمي)
الإعدادات:
اختيار المصدر
7 أنواع متوسط متحرك (لا شيء، SMA، SMA+BB، EMA، SMMA، WMA، VWMA)
طول MA (افتراضي: 14)
مضاعف بولينجر باند (افتراضي: 2.0)
المميزات:
مؤشر زخم مبني على الحجم
تنعيم MA اختياري
خيار بولينجر باند
أنواع MA متعددة
الحالة الافتراضية: ❌ معطّل
الاستخدام: تأكيد الحجم، قوة الاتجاه، كشف التباعد
8. ADX (مؤشر الاتجاه المتوسط)
الإعدادات:
تنعيم ADX (افتراضي: 14)
طول DI (افتراضي: 14)
المميزات:
قياس قوة الاتجاه
خط واحد نظيف
حساب قياسي
الحالة الافتراضية: ❌ معطّل
الاستخدام: تقييم قوة الاتجاه، فلتر للأسواق الجانبية
🎨 خيارات التخصيص
الألوان
كل خط ونطاق وخلفية قابلة للتخصيص
أنظمة ألوان احترافية مسبقة الإعداد
واجهة منتقي ألوان سهلة
العرض
تبديل الرؤية لأي مؤشر
نطاقات ومستويات قابلة للتعديل
مجموعات إعدادات نظيفة ومنظمة
الأداء
حسابات محسّنة
أقل من 64 plot (حد TradingView)
استخدام فعّال للذاكرة
عرض سلس للرسم البياني
🔧 المواصفات التقنية
إصدار Pine Script: v6
إجمالي المؤشرات: 8
إجمالي الـ Plots: 22 (أقل بكثير من حد 64)
وضع Overlay: False (oscillators في نافذة منفصلة)
Force Overlay: True (لمؤشرات الشارت)
هيكل الكود: معياري، قائم على القوالب
قابلية التوسع: سهل إضافة مؤشرات جديدة
💡 كيفية الاستخدام
أضف للشارت: ابحث عن "Top Indicators Suite " في مؤشرات TradingView
اضبط الإعدادات: افتح إعدادات المؤشر وانتقل إلى مجموعة كل مؤشر
فعّل المؤشرات: قم بتشغيل المؤشرات التي تريد استخدامها
خصص: عدّل الألوان والأطوال والمعاملات حسب تفضيلك
تداول: استخدم الرؤى المجمعة من عدة مؤشرات لاتخاذ قرارات أفضل
📈 استراتيجيات التداول المدعومة
✅ متابعة الاتجاه: المتوسطات المتحركة + سوبر ترند + ADX
✅ تداول الزخم: RSI + MACD + ستوكاستيك
✅ تحليل الحجم: OBV + VWAP
✅ العودة للمتوسط: نطاقات VWAP + RSI
✅ تداول التباعد: RSI + MACD + OBV + ستوكاستيك
✅ التحليل متعدد الأطر الزمنية: جميع المؤشرات مع إعدادات أطر زمنية متنوعة
✅ نظام التأكيد: دمج عدة مؤشرات للحصول على إعدادات عالية الاحتمالية
⚠️ ملاحظات مهمة
RSI مفعّل افتراضيًا - جميع المؤشرات الأخرى معطلة افتراضيًا للحصول على شارت نظيف
VWAP يختفي على الإطار اليومي وما فوق افتراضيًا - يمكن تغييره في الإعدادات
وضع Overlay هو false - مؤشرات الشارت تستخدم force_overlay للعرض على الشارت الرئيسي
النطاق #1 من VWAP مفعّل افتراضيًا - النطاقان #2 و #3 معطلان
جميع الإعدادات مستقلة - التغييرات على مؤشر واحد لا تؤثر على الآخرين
🎓 أفضل الممارسات
ابدأ ببساطة: فعّل 2-3 مؤشرات أولاً، ثم أضف المزيد حسب الحاجة
تجنب الازدحام: لا تفعّل جميع المؤشرات مرة واحدة إلا إذا كان ضروريًا
تنسيق الألوان: استخدم أنظمة ألوان متسقة لوضوح بصري أفضل
الاختبار الخلفي: اختبر مجموعات مؤشراتك قبل التداول الحقيقي
محاذاة الإطار الزمني: استخدم المؤشرات المناسبة لإطارك الزمني للتداول
التأكيد: انتظر توافق عدة مؤشرات قبل الدخول في صفقة
📞 الدعم والتحديثات
من إعداد: Abusuhil
الترخيص: Creative Commons
إصدار Pine Script: v6
للأسئلة أو الاقتراحات أو التطوير المخصص، تواصل عبر TradingView.
🏆 لماذا تختار Top Indicators Suite؟
✅ توفير الوقت - لا حاجة لإضافة مؤشرات متعددة
✅ توفير مساحة الشارت - واجهة واحدة نظيفة
✅ جودة احترافية - كود مختبر بشكل كامل
✅ تحكم كامل - تخصيص شامل
✅ أداء فعّال - حسابات محسّنة
✅ تحديثات منتظمة - صيانة وتحسين مستمر
✅ توثيق - واضح وشامل
