MY_CME eod OI vs CFTC eow OIDaily e-o-d Open Interest as published by CME.
As CFTC COT Open Interest relates to last Tuesday, here you can have an idea how things evolved day-by-day since then.
As CME total OI is not accessibl as data, here I sum OI of the next 9 outstanding contracts, which gives a fair idea of the trend in OI
ابحث في النصوص البرمجية عن "daily"


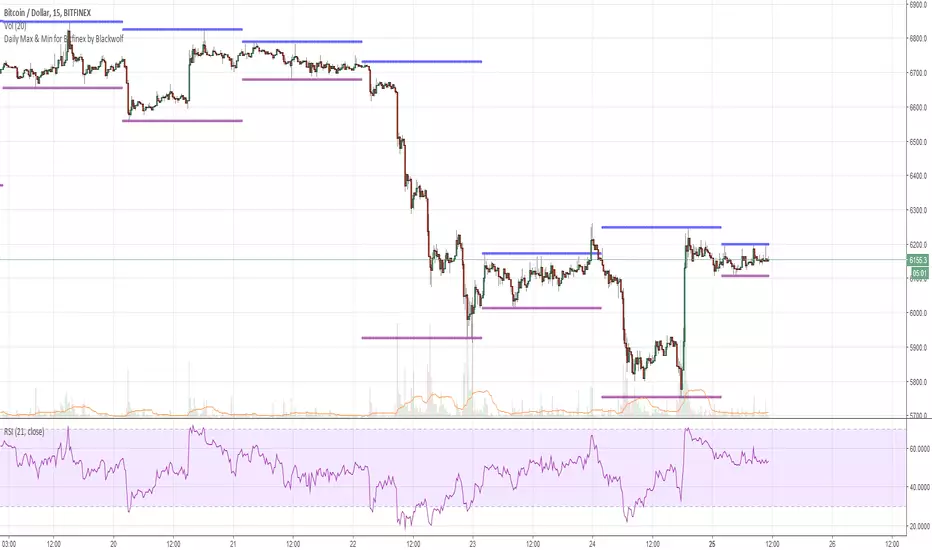
Daily Max & Min for Bitfinex by BlackwolfThis script shows the min and max price level of each day. It can be used also for support and resistance level.
Lo script mostra il prezzo massimo e minimo raggiunto nelle 24 ore. può essere utilizzato come idea per supporti e resistenze
MTF EMA Combo with Background ColorDaily/Weekly EMA combo for longer term trend direction, with combo background color for varying trend direction.

CMGB Pivot PointsDaily and weekly pivots.
Setting: specify how many candles are in a day (in the time frame you are using)
For example for 15m TF there are 91 (not 96) candles. When you get the number right, the lines will align nicely.


Daily SARThe image describes how to use the indicator fairly well, and I used 1 minute candles here, but it's best used on 1H candles.
There's a little bit of noise as the SAR updates, you can expect two movements before it settles. Ignore the first one, it is largely irrelevant except as a signal that the real movement is about to occur (and a hint at which direction).


Daily Average True Range OverlayPlots the upper and lower average true range away from the previous days close on all time frames.

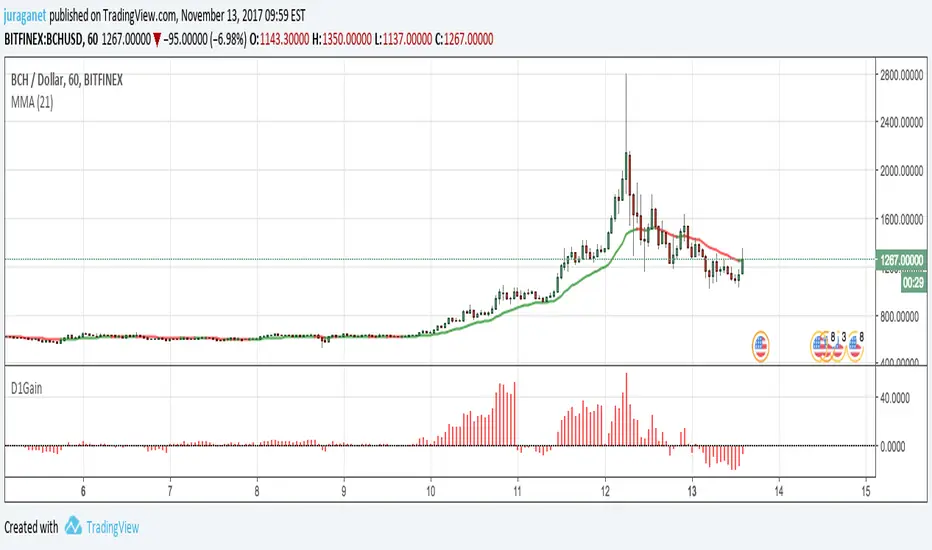
Daily GainPlot today's gain (%) of current security. It's a value of increase/decrease of current price compared to today's 00:00:00 candle open price.
I'm open for idea to improve this script. Drop me message or email to juraganet@gmail.com.
Daily one take and put toolthis script have two line
Each line acts as a line of support and resistance
판매용이 아닙니다. 댓글 남기시고 사용하세요~
사용법은 blog.naver.com

Daily Deviations (Lazy Edition)
Plots the standard deviation resistance/support lines.
Uses Previous days close and the VIX as the volatility factor.
credit to u/UberBotMan and u/Living_Granger for the idea and formulas

Daily Deviations (Self Input Version)
Plots the standard deviation resistance/support levels.
Input the previous settlement price and the implied volatility.
credit to u/UberBotMan and u/Living_Granger for the idea and formulas
(preview example is using settlement of 2420 and IV of 11)


Daily Returns & STDWhat happened last time when xx increased by xx%? - Start collecting some stats!
You can choose the ticker and the timeframe you're interested in

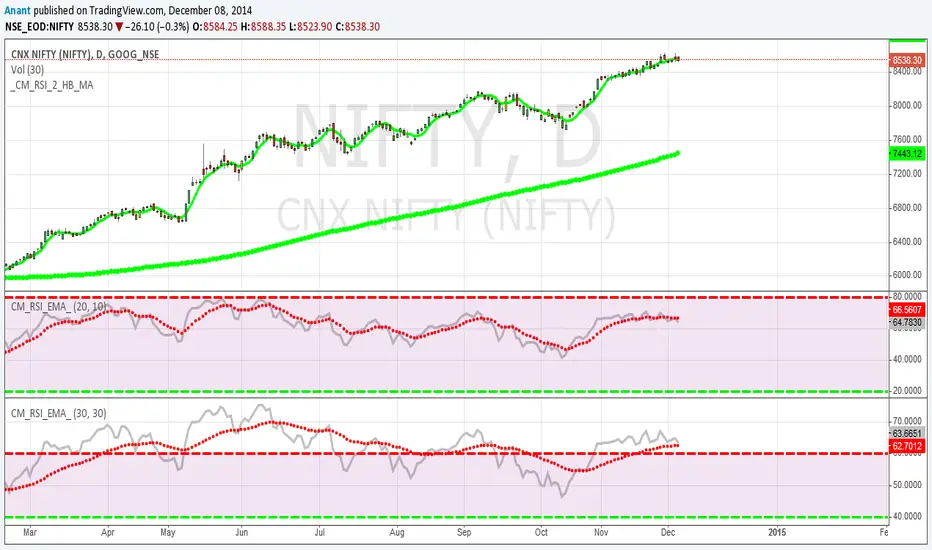
RSI Oversold/UndersoldThe study script will place GREEN BUY arrows BELOW oversold conditions and RED SHORT arrows ABOVE overbought conditions. You can configure the period
Most RSI(14) indicators use a 14-period, I prefer a 5-period. The period, overbought and oversold periods are settings that can easily be changed by adding this study to your chart and clicking the "gear" icon next to the study inside your chart.


Daily SMAThis pine script on intraday chart is exactly the same SMA as built-in MovingAverage on a 1Day chart (with the same lengths)


ICT Smart Bias Toolkit FVG, CRT and Multi-Timeframe Market Bias📌 Indicator Description — ICT Smart Bias Toolkit
ICT Smart Bias Toolkit is an advanced price action indicator designed for ICT / Smart Money traders.
It combines Fair Value Gaps (FVG), Candle Range Theory (CRT) logic, and a multi-timeframe (HTF) bias screener to provide clear top-down market context and precise areas of interest.
The indicator does not repaint and is based strictly on closed candles.
🔍 Core Features
🟩 Fair Value Gaps (FVG)
Automatically detects Bullish and Bearish FVGs on the current timeframe
FVG zones:
extend forward in time,
register first touch,
deactivate after full mitigation
User-configurable number of visible FVG zones (default: 2)
📏 CRT – Previous High / Low Levels
When a CRT candle forms, the previous candle’s High and Low are plotted
These levels:
extend until price is reached,
stop automatically on touch
Each level is labeled with its timeframe (W / D / H4)
No arrows or candle markers → clean and uncluttered chart
🧭 HTF Bias Screener (Weekly / Daily / H4)
A compact screener displays:
BIAS for Weekly, Daily, and H4
DIRECTION: Bullish / Bearish
REASON, using a strict priority logic:
If a CRT candle formed on the last closed candle
Otherwise, Close vs Previous Close
This screener is intended for context and directional bias, not trade entries.
🔔 Alerts (Fully Configurable)
Practical, trader-focused alerts are included for:
FVG formation
FVG touch
FVG full mitigation
CRT Previous High / Low hit
Bias change (Weekly / Daily / H4)
Top-down confluence alerts, such as:
Daily CRT bias + H4 FVG touch
Weekly CRT bias + Daily FVG touch
All alerts are designed for real trading scenarios, not signal spam.
🧠 How to Use
Identify directional bias using the HTF screener
Wait for price to return into a relevant FVG zone
Use CRT High/Low levels as liquidity reference points
Execute trades using your own price action confirmation
This indicator provides context, not entries.
⚠️ Disclaimer
This is not a signal indicator.
It is a market structure and bias tool, intended to support an ICT / Smart Money trading framework.

Altcoin Risk + RS vs BTC1. What is this indicator?
The Altcoin Risk + RS vs BTC indicator is a cycle-based investment tool, designed to answer one key question:
“Is this altcoin both relatively strong and not overheated?”
It combines two essential dimensions of decision-making:
Risk (cycle & valuation) – Is the price too extended?
Relative Strength (RS) – Is capital flowing into this altcoin instead of Bitcoin?
This indicator is not for short-term trading.
It is optimized for mid-to-long-term positioning, portfolio allocation, and avoiding cycle tops.
2. Core concepts
2.1 Risk Component – “Is the altcoin overheated?”
The Risk score (0 → 1) measures how far the altcoin has moved relative to its own historical growth path.
It combines three elements:
Deviation from long-term cycle SMA (2–3 years)
→ Measures long-term valuation vs cycle trend
Log distance from 20-week moving average
→ Identifies bull vs bear regime
Trend momentum (50-day / 50-week MA)
→ Captures acceleration or exhaustion
Interpretation:
Risk Level Meaning
Low (≤ 0.3) Undervalued / accumulation
Medium (0.3–0.6) Healthy trend
High (≥ 0.8) Overheated / distribution
2.2 Relative Strength (RS) vs Bitcoin – “Is it beating BTC?”
Relative Strength is calculated as:
RS = Altcoin Price / Bitcoin Price
Then compared to its 40-week moving average.
Interpretation:
RS Condition Meaning
RS > MA40 Altcoin outperforming BTC
RS < MA40 BTC stronger (alt underperforming)
This ensures you only buy altcoins that are actually attracting capital, not just rising because BTC is rising.
3. Combined logic (the key idea)
An altcoin is attractive only when BOTH conditions are true:
✅ Condition 1 – Risk filter
Altcoin Risk < Bitcoin Risk
→ The altcoin is not more overheated than BTC
✅ Condition 2 – Relative Strength filter
RS > RS 40W MA
→ The altcoin is outperforming BTC
4. Indicator signals (visual meaning)
Background Color Meaning Action
🟢 Green Low risk + strong RS Accumulate / DCA
🟡 Yellow Mixed conditions Wait / monitor
🔴 Red High risk or weak RS Avoid / reduce
5. How to use it correctly (step-by-step)
Step 1 – Timeframe
Weekly chart only
Daily or lower timeframes will generate noise
Step 2 – Asset selection
Best suited for:
ETH
SOL
BNB
KAS
AVAX
❌ Not recommended for meme coins or illiquid assets
Step 3 – Capital allocation
Focus only on green-zone altcoins
Ignore “interesting narratives” if the indicator is red
Step 4 – Portfolio discipline
Increase exposure when green appears after a long red/yellow period
Reduce exposure when risk turns red, even if price is still rising
6. What this indicator is NOT
❌ Not a scalping tool
❌ Not a top/bottom picker
❌ Not predictive of short-term price movements
It is a risk management and capital allocation framework.
7. Typical mistakes to avoid
Using it on daily charts
Buying altcoins with high RS but very high risk
Ignoring Bitcoin risk context
Applying it to hype-driven meme coins

Flux Momentum Oscillator[BullByte]Flux Momentum Oscillator is a professional-grade momentum analysis system built on an original methodology called Momentum Flux Bars (MFB). Unlike conventional oscillators that measure momentum over fixed time periods, this indicator constructs synthetic momentum bars based on actual price movement, creating a pure representation of directional pressure independent of time-based noise.
This is NOT a mashup or combination of existing indicators. The entire system is built from the ground up around a single cohesive concept: measuring momentum through price-triggered synthetic bars rather than time-triggered calculations.
CORE INNOVATION: MOMENTUM FLUX BARS (MFB)
Traditional momentum indicators calculate values at fixed time intervals, which means a slow, grinding move receives the same measurement weight as a fast, explosive move occurring over the same number of bars. This creates distortion in momentum readings.
Momentum Flux Bars solve this problem by forming only when price travels a volatility-adjusted distance. Each MFB represents genuine directional commitment from market participants.
Key Properties of Momentum Flux Bars:
- Form based on price movement, not time passage
- Automatically adjust their formation threshold based on current volatility
- Capture the velocity of price movement (how quickly each bar forms)
- Record volume participation during formation
- Create a noise-filtered view of true market momentum
The oscillator then analyzes the pattern, velocity, and characteristics of recent MFB formations to produce its readings.
WHY THIS APPROACH MATTERS FOR TRADERS
Time-Based Problem: A 14-period RSI on a choppy day produces the same calculation structure as on a trending day, even though market behavior differs completely. The indicator cannot distinguish between meaningful moves and noise.
Flux-Based Solution: When price chops sideways, fewer MFBs form because price fails to travel the required distance. When price trends strongly, MFBs form rapidly in sequence. The oscillator inherently adapts to actual market behavior.
Practical Benefits:
- Cleaner signals during trending conditions
- Automatic noise reduction during consolidation
- Earlier detection of momentum shifts through velocity analysis
- Reduced false signals in choppy markets
- No manual adjustment needed across different market conditions
COMPLETE FEATURE BREAKDOWN
FEATURE 1: AUTO-OPTIMIZATION ENGINE
The indicator includes an optional auto-optimization system that continuously evaluates different sensitivity parameters and selects the configuration producing the cleanest momentum measurement for current conditions.
How It Works:
- Tests multiple ATR multiplier values against recent price history
- Scores each configuration based on trend capture efficiency
- Automatically applies the optimal setting
- Re-evaluates periodically to adapt to changing conditions
Trader Benefit: Eliminates the guesswork of parameter tuning. The indicator finds its own optimal settings.
FEATURE 2: MARKET REGIME CLASSIFICATION
The system classifies current market conditions into four distinct regimes based on MFB formation patterns:
EXPLOSIVE: Rapid MFB formation with strong directional bias and high volume participation. Indicates powerful trending conditions with high momentum.
STEADY: Consistent MFB formation in a primary direction with normal velocity. Represents healthy, sustainable trends suitable for trend-following approaches.
CONSOLIDATING: Mixed direction MFB formation with decreasing velocity. Suggests range-bound conditions where breakout strategies may be appropriate.
DEAD: Minimal MFB formation activity. Indicates extremely low volatility or market indecision. Often precedes significant moves.
Trader Benefit: Instantly understand current market character and adjust strategy accordingly.
FEATURE 3: VELOCITY DIVERGENCE DETECTION
This advanced feature monitors the formation speed of Momentum Flux Bars and compares it against price direction.
Velocity Divergence Bearish: Price making higher highs but MFBs forming progressively slower. Suggests buying pressure is weakening despite higher prices.
Velocity Divergence Bullish: Price making lower lows but MFBs forming progressively slower. Suggests selling pressure is weakening despite lower prices.
Trader Benefit: Early warning system for potential reversals before they appear on price charts.
FEATURE 4: MOMENTUM EXHAUSTION DETECTION
The system identifies when a trending move may be running out of energy by analyzing the duration pattern of consecutive same-direction MFBs.
Exhaustion Pattern: When each successive MFB in a trend takes progressively longer to form, it indicates diminishing momentum even though direction remains unchanged.
States Displayed:
- BUILDING: Momentum is increasing or stable
- PEAK: Maximum momentum velocity reached
- EXHAUSTING: Progressive slowdown detected
Trader Benefit: Know when a trend is losing steam before price reverses.
FEATURE 5: HIGHER TIMEFRAME ALIGNMENT
The indicator checks whether higher timeframe MFB direction supports or conflicts with current timeframe momentum.
ALIGNED BULL: Both timeframes showing bullish MFB direction
ALIGNED BEAR: Both timeframes showing bearish MFB direction
DIVERGENT: Timeframes showing opposing directions
NEUTRAL: Higher timeframe direction unclear
Trader Benefit: Trade with higher timeframe support for higher probability setups.
FEATURE 6: CHOPPY MARKET DETECTION
A dedicated algorithm analyzes recent MFB patterns to determine if the market is in a choppy, directionless state.
Detection Factors:
- Frequency of direction changes in recent MFBs
- Lack of consecutive same-direction formations
- Weak directional bias in the MFB sequence
Trader Benefit: Avoid trend-following strategies when market conditions do not support them.
FEATURE 7: TREND STRENGTH MEASUREMENT
A percentage-based strength reading derived from MFB pattern analysis.
Flux Momentum Oscillator Chart Example
Chart Overview: Bitcoin 15-Minute Chart (Dec 21, 2025)
BTCUSD Market Snapshot
Price: $88,854.53 | Oscillator: 77.38 | Direction: BULLISH | Regime: EXPLOSIVE
1. EXPLOSIVE REGIME DETECTION (Current State - Right Side)
2. MOMENTUM EXHAUSTION ZONE (Mid-Chart)
3. CHOP/CONSOLIDATION PERIOD (Before Breakout)
4. VELOCITY DIVERGENCE (Around 21:00 the previous day)
5. BULLISH MOMENTUM SHIFT (Around 09:00)
6. FORMATION PROGRESS BAR (Bottom of Oscillator)
7. TREND STRENGTH INDICATOR (Bottom Bar)
8. EXTREME ZONES (Top and Bottom Boundaries)
Reading Interpretation:
- Above 70%: Strong trending conditions
- 40% to 70%: Moderate trend or developing move
- Below 40%: Weak trend or choppy conditions
Visual representation provided via the strength bar at the bottom of the indicator panel.
HOW TO READ THE OSCILLATOR PLOT
OSCILLATOR LINE (Main Line):
- Ranges from -100 to +100
- Above zero indicates bullish momentum
- Below zero indicates bearish momentum
- Color intensity reflects momentum direction and strength
- Glow effect (optional) enhances visibility of the main reading
SIGNAL LINE (Secondary Line):
- Smoothed version of the oscillator
- Crossovers indicate momentum shifts
- Purple/accent colored for visual distinction
HISTOGRAM BARS:
- Represent the difference between oscillator and signal line
- Increasing histogram in direction of oscillator confirms momentum
- Decreasing histogram warns of potential momentum shift
- Bright colors indicate increasing momentum
- Faded colors indicate decreasing momentum
ZONE INTERPRETATION:
+75 to +100 (Extreme Bullish Zone):
Very strong bullish momentum. Price has moved significantly and rapidly. Watch for exhaustion patterns. Not ideal for new long entries. Consider profit-taking on existing longs.
+50 to +75 (Strong Bullish Zone):
Healthy bullish momentum. Good conditions for trend-following long strategies. Pullbacks to signal line often provide continuation opportunities.
0 to +50 (Mild Bullish Zone):
Positive but moderate momentum. Trend may be developing or maturing. Watch for strength building or fading.
0 to -50 (Mild Bearish Zone):
Negative but moderate momentum. Downtrend may be developing or maturing. Watch for weakness building or recovering.
-50 to -75 (Strong Bearish Zone):
Healthy bearish momentum. Good conditions for trend-following short strategies. Rallies to signal line often provide continuation opportunities.
-75 to -100 (Extreme Bearish Zone):
Very strong bearish momentum. Price has moved significantly and rapidly to downside. Watch for exhaustion patterns. Not ideal for new short entries. Consider profit-taking on existing shorts.
HOW TO READ THE DASHBOARD
The dashboard provides comprehensive market analysis at a glance. Each row displays specific information:
OSCILLATOR ROW:
Shows current oscillator value with directional icon.
indicates reading above +50 (High)
indicates reading below -50 (Low)
DIRECTION ROW:
Current MFB direction.
BULLISH: Recent MFB formed upward
BEARISH: Recent MFB formed downward
NEUTRAL: No recent MFB or unclear
REGIME ROW:
Current market regime classification.
EXPLOSIVE / STEADY / CONSOLIDATING / DEAD
Color coded for quick recognition.
MARKET ROW:
Trend state assessment.
TRENDING UP: Confirmed uptrend in progress
TRENDING DN: Confirmed downtrend in progress
CHOPPY: No clear trend, high direction changes
MIXED: Partial trend characteristics
STRENGTH ROW:
Visual bar showing trend strength percentage.
More filled bars indicate stronger trend.
Color shifts from red (weak) to yellow (moderate) to green (strong).
VELOCITY ROW:
MFB formation speed status.
ACCELERATING: MFBs forming faster over time
STEADY: Consistent formation speed
DECELERATING: MFBs forming slower over time
MOMENTUM ROW:
Momentum development status.
BUILDING: Momentum increasing
PEAK: Maximum momentum reached
EXHAUSTING: Momentum declining despite same direction
HTF ALIGN ROW:
Higher timeframe alignment status.
BULL: HTF supports bullish bias
BEAR: HTF supports bearish bias
DIVERGENT: HTF opposes current direction
NEUTRAL: HTF unclear
FORMING ROW:
Progress toward next MFB formation.
Visual bar fills as price approaches formation threshold.
Helps anticipate when next MFB will complete.
Additional rows (when not in Compact Mode):
- Flux Size: Current MFB formation threshold value
- ATR Mult: Current optimized ATR multiplier (when auto-optimization enabled)
- Regime %: Numerical regime score
FORMATION PROGRESS INDICATOR
The horizontal line near the bottom of the indicator panel shows progress toward the next MFB formation.
Reading the Progress Line:
- Starts at baseline after each MFB completion
- Rises as price moves toward formation threshold
- Higher position indicates imminent MFB formation
- Color changes from neutral to accent to warning as formation approaches
Practical Use:
- Anticipate when new momentum data will become available
- Gauge intra-bar momentum development
- Understand why signals occur when they do
TREND STRENGTH BAR
The horizontal bar at the very bottom of the indicator displays trend strength visually.
Components:
- Gray background bar represents full scale (0-100%)
- Colored fill represents current strength reading
- Label displays exact percentage value
Color Interpretation:
- Green fill: Strong trend (above 70%)
- Yellow fill: Moderate trend (40-70%)
- Red fill: Weak trend (below 40%)
RECOMMENDED USAGE GUIDELINES
TIMEFRAME RECOMMENDATIONS:
Scalping (1m to 5m):
- Use lower Flux Period (8-10) for faster response
- Focus on oscillator crossovers and histogram momentum
- Regime should be STEADY or EXPLOSIVE for best results
Day Trading (5m to 30m):
- Default settings work well
- Use HTF alignment with 1H or 4H for confirmation
- Avoid trading when regime shows DEAD
Swing Trading (1H to 4H):
- Consider higher Flux Period (18-21) for smoother signals
- Regime classification becomes very valuable
- Velocity divergence provides excellent early warnings
Position Trading (Daily and above):
- Higher Flux Period (21-30) recommended
- Focus on regime changes and exhaustion patterns
- HTF alignment less relevant, oscillator zones more important
ASSET CLASS NOTES:
Forex: Works well on major pairs. Consider slightly higher sensitivity on less volatile pairs.
Crypto: Higher volatility may require lower sensitivity multiplier. Regime detection particularly useful.
Stocks: Excellent for liquid stocks. Less effective on illiquid names due to gappy price action.
Indices: Very effective. Clean price action produces clean MFB patterns.
Commodities: Works well, especially on gold and oil. Adjust sensitivity for different volatility profiles.
SETTINGS OVERVIEW
MODE AND THEME:
- Trading Mode: Simple (clean), Pro (full data), Hybrid (balanced)
- Visual Theme: Dark, Light, Neon, Stealth
- Compact Dashboard: Reduces dashboard rows
FLUX ENGINE:
- Flux Calculation Method: Choose optimization approach
- Enable Auto-Optimization: Let indicator find optimal parameters
- Flux Period: Base volatility calculation period
- Sensitivity Multiplier: Adjust MFB formation threshold
- Optimization Lookback: Bars analyzed for optimization
- Optimization Frequency: How often to re-optimize
OSCILLATOR:
- Oscillator Smoothing: Main line smoothness
- Signal Line Length: Signal line responsiveness
- Momentum Depth: MFBs analyzed for oscillator
- Histogram Scale: Visual scaling of histogram
MARKET STATE:
- Chop Detection Window: MFBs analyzed for chop detection
- Chop Threshold: Sensitivity of chop classification
- Min Trend Confirmation: Consecutive bars for trend confirmation
ADVANCED ANALYSIS:
- Enable Regime Classification: Market regime detection
- Enable Velocity Divergence: Formation speed analysis
- Enable Exhaustion Detection: Trend exhaustion warnings
- Enable HTF Alignment: Higher timeframe checking
- Higher Timeframe: Which timeframe to check
VISUALS:
- Glow Effect: Visual enhancement on oscillator
- Show Zone Fills: Background zone coloring
- Show Formation Progress: Progress indicator display
- Show Trend Strength Bar: Bottom strength bar
- Show Dashboard: Information panel display
- Dashboard Position: Corner placement
SIGNAL INTERPRETATION GUIDELINES
BULLISH MOMENTUM SHIFT:
Oscillator crosses above signal line while not in extreme bearish territory.
Suggests emerging bullish momentum.
Stronger when occurring near zero line or in mild bearish zone.
BEARISH MOMENTUM SHIFT:
Oscillator crosses below signal line while not in extreme bullish territory.
Suggests emerging bearish momentum.
Stronger when occurring near zero line or in mild bullish zone.
STRONG TREND CONDITIONS:
Oscillator beyond +/-55, in direction of signal line, trend strength above 55%, not choppy.
Indicates conditions favorable for trend-following approaches.
EXTREME ZONES:
Oscillator beyond +/-75.
Diamond markers appear.
Exercise caution with new positions in trend direction.
Watch for exhaustion and divergence signals.
ALERT SYSTEM
The indicator includes comprehensive alerts for automated monitoring:
Momentum Alerts:
- Bullish Momentum Shift
- Bearish Momentum Shift
- Strong Uptrend Initiated
- Strong Downtrend Initiated
Zone Alerts:
- Extreme Bullish Zone Reached
- Extreme Bearish Zone Reached
Market State Alerts:
- Choppy Conditions Detected
- Choppy Conditions Cleared
- Explosive Regime Entered
- Dead Regime Entered
Advanced Alerts:
- Velocity Divergence Detected
- Exhaustion Warning Triggered
- HTF Aligned Bullish
- HTF Aligned Bearish
- HTF Divergence Detected
MFB Alerts:
- Bullish MFB Formed
- Bearish MFB Formed
WHAT THIS INDICATOR IS NOT
This indicator is NOT:
- A buy/sell signal generator (it provides momentum context, not trade signals)
- A standalone trading system (combine with price action and other analysis)
- A guarantee of profitability (no indicator can guarantee results)
- A replacement for risk management (always use proper position sizing and stops)
- A mashup of existing indicators (this is original methodology)
ORIGINALITY STATEMENT
The Momentum Flux Bars concept was designed specifically to address limitations of time-based momentum calculations.
Every component of this system serves the central MFB methodology:
- The oscillator measures MFB directional weight
- The regime classifier interprets MFB patterns
- The velocity analysis tracks MFB formation speed
- The exhaustion detector monitors MFB duration progression
- The HTF alignment checks MFB direction across timeframes
This is a unified analytical framework, not a collection of separate indicators.
TECHNICAL NOTES
Non-Repainting Confirmation:
All signal generation uses confirmed bar data only. MFB formations occur on bar close. Historical signals will not change after they appear.
Performance Considerations:
Auto-optimization runs periodically, not every bar, to maintain performance.
MFB history is trimmed to prevent memory issues on extended sessions.
Reduce Max MFB History if experiencing performance issues.
Symbol and Timeframe Handling:
The indicator resets its MFB history when symbol or timeframe changes.
This ensures clean analysis without carryover from previous contexts.
DISCLAIMER
This indicator is provided for educational and informational purposes only. It is not financial advice and should not be considered as such.
Trading involves substantial risk of loss. Past performance of any trading methodology or indicator does not guarantee future results. The author makes no representations regarding the profitability or suitability of this indicator for any particular purpose.
Users are solely responsible for their own trading decisions. Always use proper risk management, including appropriate position sizing and stop-loss orders. Never risk more than you can afford to lose.
Before using this or any indicator in live trading, thoroughly test it on historical data and in a demo environment. Understand its behavior across different market conditions.
The author is not liable for any losses incurred through the use of this indicator.
Developed by BullByte
Version 1.0.0
