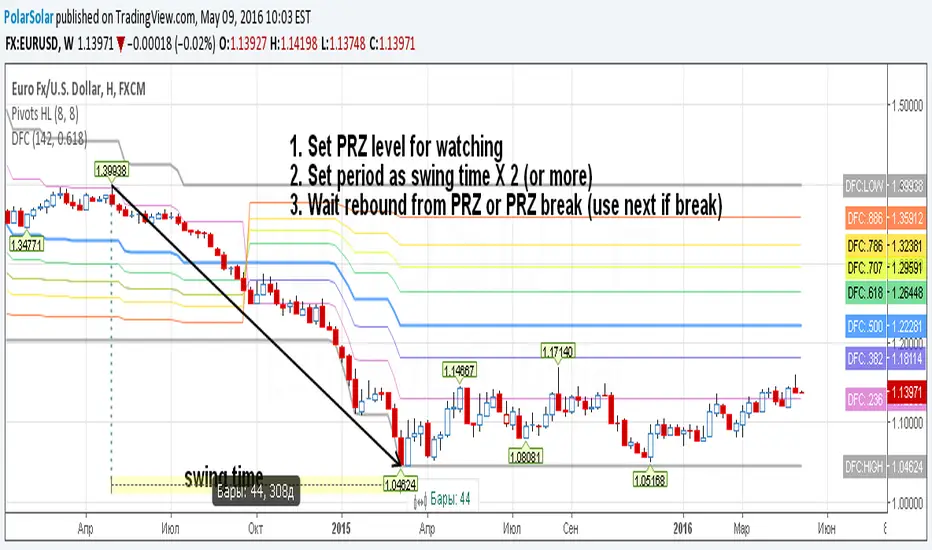
Donchian Fibo Channels1. Set PRZ level for watching
2. Set period as swing time X 2 (or more)
3. Wait rebound from PRZ or PRZ break (use next if break)
ابحث في النصوص البرمجية عن "donchian"
HelperTALibrary "HelperTA"
This library contains useful technical indicators that I use regularly in my charts.
`stockRSI` is not mine, but included because used often and referenced by internal functions.
`DCO` is a normalisation of the donchian channels; the price relative to the donchian channels, on a range.
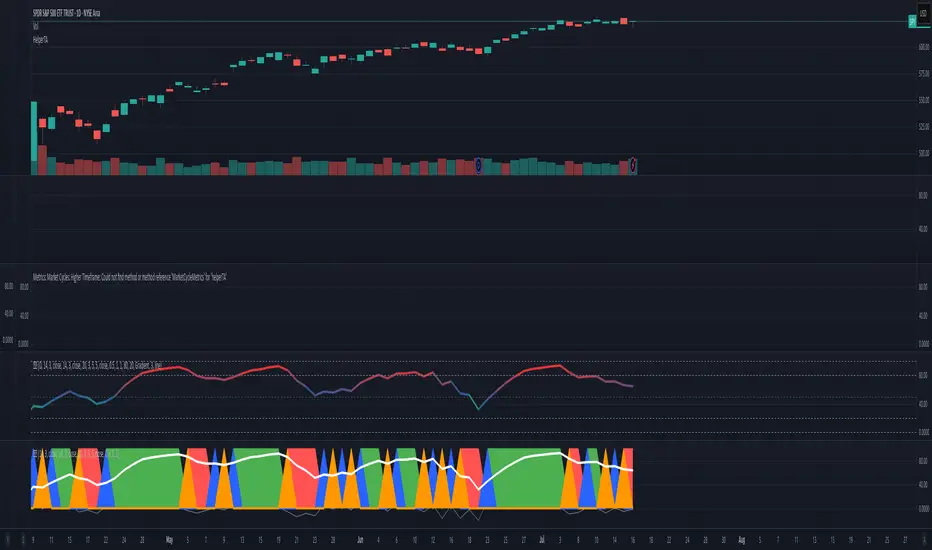
`MarketCycle` is a weighted aggregate of RSI, Stochastic RSI & DCO (demo on the chart)
stockRSI(src, K, D, rsiPeriod, stochPeriod)
stockRSI
Parameters:
src (float)
K (int)
D (int)
rsiPeriod (simple int)
stochPeriod (int)
Returns:
DCO(price, donchianPeriod, smaPeriod)
DCO
Parameters:
price (float)
donchianPeriod (int)
smaPeriod (int)
Returns:
MarketCycle(donchianPrice, rsiPrice, srsiPrice, donchianPeriod, donchianSmoothing, rsiPeriod, rsiSmoothing, srsiPeriod, srsiSmoothing, srsiK, srsiD, rsiWeight, srsiWeight, dcoWeight)
MarketCycle
Parameters:
donchianPrice (float)
rsiPrice (float)
srsiPrice (float)
donchianPeriod (simple int)
donchianSmoothing (simple int)
rsiPeriod (simple int)
rsiSmoothing (int)
srsiPeriod (simple int)
srsiSmoothing (simple int)
srsiK (simple int)
srsiD (simple int)
rsiWeight (simple float)
srsiWeight (simple float)
dcoWeight (simple float)
Returns:
Multiple (12) Strong Buy/Sell Signals + Momentum
Indicator Manual: "Multiple (12) Strong Buy/Sell Signals + Momentum"
This indicator is designed to identify strong buy and sell signals based on 12 configurable conditions, which include a variety of technical analysis methods such as trend-following indicators, pattern recognition, volume analysis, and momentum oscillators. It allows for customizable alerts and visual cues on the chart. The indicator helps traders spot potential entry and exit points by displaying buy and sell signals based on the selected conditions.
Key Observations:
• The script integrates multiple indicators and pattern recognition methods to provide comprehensive buy/sell signals.
• Trend-based indicators like EMAs and MACD are combined with pattern recognition (flags, triangles) and momentum-based signals (RSI, ADX, and volume analysis).
• User customization is a core feature, allowing adjustments to the conditions and thresholds for more tailored signals.
• The script is designed to be responsive to market conditions, with multiple conditions filtering out noise to generate reliable signals.
________________________________________
Key Features:
1. 12 Combined Buy/Sell Signal Conditions: This indicator incorporates a diverse set of conditions based on trend analysis, momentum, and price patterns.
2. Minimum Conditions Input: You can adjust the threshold of conditions that need to be met for the buy/sell signals to appear.
3. Alert Customization: Set alert thresholds for both buy and sell signals.
4. Dynamic Visualization: Buy and sell signals are shown as triangles on the chart, with momentum signals highlighted as circles.
________________________________________
Detailed Description of the 12 Conditions:
1. Exponential Moving Averages (EMA):
o Conditions: The indicator uses EMAs with periods 3, 8, and 13 for quick trend-following signals.
o Bullish Signal: EMA3 > EMA8 > EMA13 (Bullish stack).
o Bearish Signal: EMA3 < EMA8 < EMA13 (Bearish stack).
o Reversal Signal: The crossing over or under of these EMAs can signify trend reversals.
2. MACD (Moving Average Convergence Divergence):
o Fast MACD (2, 7, 3) is used to confirm trends quickly.
o Bullish Signal: When the MACD line crosses above the signal line.
o Bearish Signal: When the MACD line crosses below the signal line.
3. Donchian Channel:
o Tracks the highest high and lowest low over a given period (default 20).
o Breakout Signal: Price breaking above the upper band is bullish; breaking below the lower band is bearish.
4. VWAP (Volume-Weighted Average Price):
o Above VWAP: Bullish condition (price above VWAP).
o Below VWAP: Bearish condition (price below VWAP).
5. EMA Stacking & Reversal:
o Tracks the order of EMAs (3, 8, 13) to confirm strong trends and reversals.
o Bullish Reversal: EMA3 < EMA8 < EMA13 followed by a crossing to bullish.
o Bearish Reversal: EMA3 > EMA8 > EMA13 followed by a crossing to bearish.
6. Bull/Bear Flags:
o Bull Flag: Characterized by a strong price movement (flagpole) followed by a pullback and breakout.
o Bear Flag: Similar to Bull Flag but in the opposite direction.
7. Triangle Patterns (Ascending and Descending):
o Detects ascending and descending triangles using pivot highs and lows.
o Ascending Triangle: Higher lows and flat resistance.
o Descending Triangle: Lower highs and flat support.
8. Volume Sensitivity:
o Identifies price moves with significant volume increases.
o High Volume: When current volume is significantly above the moving average volume (set to 1.2x of the average).
9. Momentum Indicators:
o RSI (Relative Strength Index): Confirms overbought and oversold levels with thresholds set at 65 (overbought) and 35 (oversold).
o ADX (Average Directional Index): Confirms strong trends when ADX > 28.
o Momentum Up: Momentum is upward with strong volume and bullish RSI/ADX conditions.
o Momentum Down: Momentum is downward with strong volume and bearish RSI/ADX conditions.
10. Bollinger & Keltner Squeeze:
o Squeeze Condition: A contraction in both Bollinger Bands and Keltner Channels indicates low volatility, signaling a potential breakout.
o Squeeze Breakout: Price breaking above or below the squeeze bands.
11. 3 Consecutive Candles Condition:
o Bullish: Price rises for three consecutive candles with higher highs and lows.
o Bearish: Price falls for three consecutive candles with lower highs and lows.
12. Williams %R and Stochastic RSI:
o Williams %R: A momentum oscillator with signals when the line crosses certain levels.
o Stochastic RSI: Provides overbought/oversold levels with smoother signals.
o Combined Signals: You can choose whether to require both WPR and StochRSI to signal a buy/sell.
________________________________________
User Inputs (Inputs Tab):
1. Minimum Conditions for Buy/Sell:
o min_conditions: Number of conditions required to trigger a buy/sell signal on the chart (1 to 12).
o Alert_min_conditions: User-defined alert threshold (how many conditions must be met before an alert is triggered).
2. Donchian Channel Settings:
o Show Donchian: Toggle visibility of the Donchian channel.
o Donchian Length: The length of the Donchian Channel (default 20).
3. Bull/Bear Flag Settings:
o Bull Flag Flagpole Strength: ATR multiplier to define the strength of the flagpole.
o Bull Flag Pullback Length: Length of pullback for the bull flag pattern.
o Bull Flag EMA Length: EMA length used to confirm trend during bull flag pattern.
Similar settings exist for Bear Flag patterns.
4. Momentum Indicators:
o RSI Length: Period for calculating the RSI (default 9).
o RSI Overbought: Overbought threshold for the RSI (default 65).
o RSI Oversold: Oversold threshold for the RSI (default 35).
5. Bollinger/Keltner Squeeze Settings:
o Squeeze Width Threshold: The maximum width of the Bollinger and Keltner Bands for squeeze conditions.
6. Stochastic RSI Settings:
o Stochastic RSI Length: The period for calculating the Stochastic RSI.
7. WPR Settings:
o WPR Length: Period for calculating Williams %R (default 14).
________________________________________
User Inputs (Style Tab):
1. Signal Plotting:
o Control the display and colors of the buy/sell signals, momentum indicators, and pattern signals on the chart.
o Buy/Sell Signals: Can be customized with different colors and shapes (triangle up for buys, triangle down for sells).
o Momentum Signals: Custom circle placement for momentum-up or momentum-down signals.
2. Donchian Channel:
o Show Donchian: Toggle visibility of the Donchian upper, lower, and middle bands.
o Band Colors: Choose the color for each band (upper, lower, middle).
________________________________________
How to Use the Indicator:
1. Adjust Minimum Conditions: Set the minimum number of conditions that must be met for a signal to appear. For example, set it to 5 if you want only stronger signals.
2. Set Alert Threshold: Define the number of conditions needed to trigger an alert. This can be different from the minimum conditions for visual signals.
3. Customize Appearance: Modify the colors and styles of the signals to match your preferences.
________________________________________
Conclusion:
This comprehensive trading indicator uses a combination of trend-following, pattern recognition, and momentum-based conditions to help you spot potential buy and sell opportunities. By adjusting the input settings, you can fine-tune it to match your specific trading strategy, making it a versatile tool for different market conditions.
Signal Reliability Based on Condition Count
The reliability of the buy/sell signals increases as more conditions are met. Here's a breakdown of the probabilities:
1. 1-3 Conditions Met: Lower Probability
o Signals that meet only 1-3 conditions tend to have lower reliability and are considered less probable. These signals may represent false positives or weaker market movements, and traders should approach them with caution.
2. 4 Conditions Met: More Reliable Signal
o When 4 conditions are met, the signal becomes more reliable. This indicates that multiple indicators or market patterns are aligning, increasing the likelihood of a valid buy/sell opportunity. While not foolproof, it's a stronger indication that the market may be moving in a particular direction.
3. 5-6 Conditions Met: Strong Signal
o A signal meeting 5-6 conditions is considered a strong signal. This indicates a well-confirmed move, with several technical indicators and market factors aligning to suggest a higher probability of success. These are the signals that traders often prioritize.
4. 7+ Conditions Met: Rare and High-Confidence Signal
o Signals that meet 7 or more conditions are rare and should be considered high-confidence signals. These represent a significant alignment of multiple factors, and while they are less frequent, they are highly reliable when they do occur. Traders can be more confident in acting on these signals, but they should still monitor market conditions for confirmation.
________________________________________
You can adjust the number of conditions as needed, but this breakdown should give a clear structure on how the signal strength correlates with the number of conditions met!

Trading Rush Signals & AlertsThis is an unofficial script for strategies tested on TRADING RUSH Youtube channel. Over time, most successful strategies will be added with an option to set strategy-specific alerts . Trading Rush Signals & Alerts will draw signals on the chart when the entry conditions are met. You can also opt for displaying indicators .
My script is meant for beginners but can be used by veterans too. Just pick only one or two strategies, you don't want to flood your chart with conflicting signals. You may want to support your trades with a proper analysis. If a new signal occurs when there is still an open position, you are not supposed to take another.
The current version includes MACD and Donchian Channels.
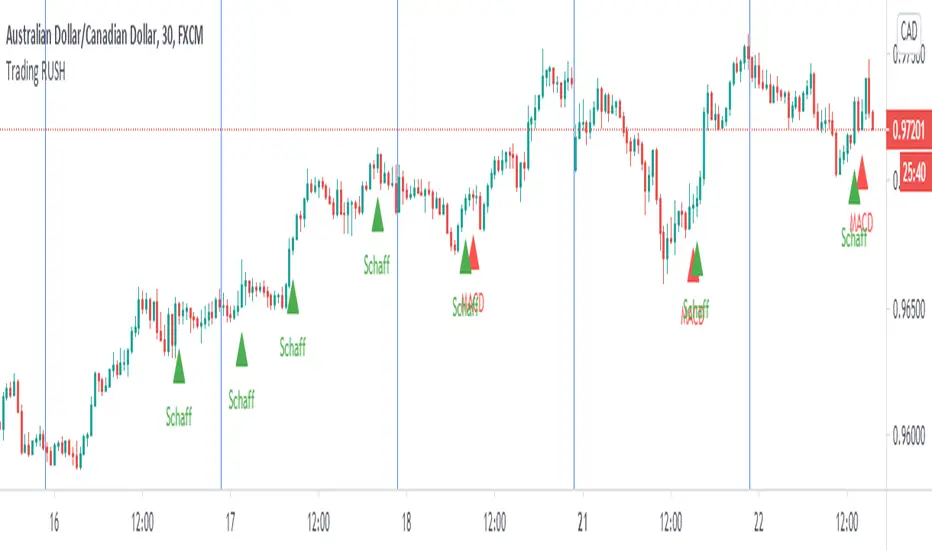
MACD strategy:
►Buy, when MACD crosses below the signal line when it is negative. The price must also be above 200 EMA.
►Sell, when MACD crosses above the signal line when it is positive. The price must also be below 200 EMA.
►This strategy was tested on 30-minute charts of EURUSD and EURJPY with reward-to-risk ratio 1,5 and win rate of 62% over 100 trades .
►►►MACD has to be added to your chart separately because it needs a new window. Indicators displaying will not add this indicator to the chart.
Donchian Channels strategy:
►Buy, when the price breaches Donchian to the upside after making a new low. The price must also be above 200 EMA.
►Sell, when the price breaches Donchian to the downside after making a new high. The price must also be below 200 EMA.
►Stop-loss is Donchian bottom for long and Donchian top for shorts. Check the channel for more information.
►This strategy was tested on 30-minute charts of EURUSD with reward-to-risk ratio 1,5 and win rate of 58% over 100 trades .
►►►I programmed alerts for Donchians to come ahead of an actual breach. If you often leave the screen when trading, this will help you. The necessary downside for that is the alerts might come when the signal doesn't trigger in the end. You will see a mark on the chart if the conditions are truly met.
Bear in mind that backtesting performance doesn't guarantee future profitability. • Most systematic strategies are not suitable for any timeframe. • You should perform your own backtest to base your trades on more data & to establish confidence in the selected strategy.
New strategies will be added when I have time. If I see multiple people asking for the same new feature, I might agree to release it with a new version. I am not going to add input options in this script, it could come as a separate script though. I am in no way affiliated with the Youtubechannel , so if you find the script helpful, shot me a message or send me some TradingView coins >)
If you encounter any bug, you can report it in a message or in comments. Support it with screenshot and relevant information such as a time when it occurred and what options were on etc.
saodisengxiaoyu-lianghua-2.1- This indicator is a modular, signal-building framework designed to generate long and short signals by combining a chosen leading indicator with selectable confirmation filters. It runs on Pine Script version 5, overlays directly on price, and is built to be highly configurable so traders can tailor the signal logic to their market, timeframe, and trading style. It includes a dashboard to visualize which conditions are active and whether they validate a signal, and it outputs clear buy/sell labels and alert conditions so you can automate or monitor trades with confidence.
Core Design
- Leading Indicator: You choose one primary signal generator from a broad list (for example, Range Filter, Supertrend, MACD, RSI, Ichimoku, and many others). This serves as the anchor of the system and determines when a preliminary long or short setup exists.
- Confirmation Filters: You can enable additional filters that validate the leading signal before it becomes actionable. Each “respect…” input toggles a filter on or off. These filters include popular tools like EMA, 2/3 EMA crosses, RQK (Nadaraya Watson), ADX/DMI, Bollinger-based oscillators, MACD variations, QQE, Hull, VWAP, Choppiness Index, Damiani Volatility, and more.
- Signal Expiry: To avoid waiting indefinitely for confirmations, the indicator counts how many consecutive bars the leading condition holds. If confirmations do not align within a defined number of bars, the setup expires. This controls latency and helps reduce late or stale entries.
- Alternating Signals: An optional mode enforces alternation (long must follow short and vice versa), helping avoid repeated entries in the same direction without a meaningful reset.
- Aggregation Logic: The final long/short conditions are formed by combining the leading condition with all selected confirmation filters through logical conjunction. Only if all enabled filters validate the signal (within expiry constraints) does the indicator consider it a confirmed long or short.
- Visualization and Alerts: The script plots buy/sell labels at signal points, provides alert conditions for automation, and displays a compact dashboard summarizing the leading indicator’s status and each confirmation’s pass/fail result using checkmarks.
Leading Indicator Options
- The indicator includes a very large menu of leading tools, each with its own logic to determine uptrend or downtrend impulses. Highlights include:
- Range Filter: Uses a dynamic centerline and bands computed via conditional EMA/SMA and range sizing to define directional movement. It can operate in a default mode or an alternative “DW” mode.
- Rational Quadratic Kernel (RQK): Applies a kernel smoothing model (Nadaraya Watson) to detect uptrends and downtrends with a focus on noise reduction.
- Supertrend, Half Trend, SSL Channel: Classic trend-following tools that derive direction from ATR-based bands or moving average channels.
- Ichimoku Cloud and SuperIchi: Multi-component systems validating trend via cloud position, conversion/base line relationships, projected cloud, and lagging span.
- TSI (True Strength Index), DPO (Detrended Price Oscillator), AO (Awesome Oscillator), MACD, STC (Schaff Trend Cycle), QQE Mod: Momentum and cycle tools that parse direction from crossovers, zero-line behavior, and momentum shifts.
- Donchian Trend Ribbon, Chandelier Exit: Trend and exit tools that can validate breakouts or sustained trend strength.
- ADX/DMI: Measures trend strength and directional movement via +DI/-DI relationships and minimum ADX thresholds.
- RSI and Stochastic: Use crossovers, level exits, or threshold filters to gate entries based on overbought/oversold dynamics or relative strength trends.
- Vortex, Chaikin Money Flow, VWAP, Bull Bear Power, ROC, Wolfpack Id, Hull Suite: A diverse set of directional, momentum, and volume-based indicators to suit different markets and styles.
- Trendline Breakout and Range Detector: Price-behavior filters that confirm signals during breakouts or within defined ranges.
Confirmation Filters
- Each filter is optional. When enabled, it must validate the leading condition for a signal to pass. Examples:
- EMA Filter: Requires price to be above a specified EMA for longs and below for shorts, filtering signals that contradict broader trend or baseline levels.
- 2 EMA Cross and 3 EMA Cross: Enforce moving average cross conditions (fast above slow for long, the reverse for short) or a three-line stacking logic for more stringent trend alignment.
- RQK, Supertrend, Half Trend, Donchian, QQE, Hull, MACD (crossover vs. zero-line), AO (zero line or AC momentum variants), SSL: Each adds its characteristic validation pattern.
- RSI family (MA cross, exits OB/OS zones, threshold levels) plus RSI MA direction and RSI/RSI MA limits: Multiple ways to constrain signals via relative strength behavior and trajectories.
- Choppiness Index and Damiani Volatility: Prevent entries during ranging conditions or insufficient volatility; choppiness thresholds and volatility states gate the trade.
- VWAP, Volume modes (above MA, simple up/down, delta), Chaikin Money Flow: Volume and flow conditions that ensure signals happen in supportive liquidity or accumulation/distribution contexts.
- ADX/DMI thresholds: Demand a minimum trend strength and directional DI alignment to reduce whipsaw trades.
- Trendline Breakout and Range Detector: Confirm that the price is breaking structure or remains within active range consistent with the leading setup.
- By combining several filters you can create strict, conservative entries or looser setups depending on your goals.
Range Filter Engine
- A core building block, the Range Filter uses conditional EMA and SMA functions to compute adaptive bands around a dynamic centerline. It supports two types:
- Type 1: The centerline updates when price exceeds the band thresholds; bands define acceptable drift ranges.
- Type 2: Uses quantized steps (via floor operations) relative to the previous centerline to handle larger moves in discrete increments.
- The engine offers smoothing for range values using a secondary EMA and can switch between raw and averaged outputs. Its hi/lo bands and centerline compose a corridor that defines directional movement and potential breakout confirmation.
Signal Construction
- The script computes:
- leadinglongcond and leadingshortcond : The primary directional signals from the chosen leading indicator.
- longCond and shortCond : Final signals formed by combining the leading conditions with all enabled confirmations. Each confirmation contributes a boolean gate. If a filter is disabled, it contributes a neutral pass-through, keeping the logic intact without enforcing that condition.
- Expiry Logic: The code counts consecutive bars where the leading condition remains true. If confirmations do not line up within the user-defined “Signal Expiry Candle Count,” the setup is abandoned and the signal does not trigger.
- Alternation: An optional state ensures that long and short signals alternate. This can reduce repeated entries in the same direction without a clear reset.
- Finally, longCondition and shortCondition represent the actionable signals after expiry and alternation logic. These drive the label plotting and alert conditions.
Visualization
- Buy and Sell Labels: When longCondition or shortCondition confirm, the script plots annotated labels directly on the chart, making entries easy to see at a glance. The labels use color coding and clear text tags (“long” vs. “short”).
- Dashboard: A table summarizes the status of the leading indicator and all confirmations. Each row shows the indicator label and whether it passed (✔️) or failed (❌) on the current bar. This intensely practical UI helps you diagnose why a signal did or did not trigger, empowering faster strategy iteration and parameter tuning.
- Failed Confirmation Markers: If a setup expires (count exceeds the limit) and confirmations failed to align, the script can mark the chart with a small label and provide a tooltip listing which confirmations did not pass. It’s a helpful audit trail to understand missed trades or prevent “chasing” invalid signals.
- Data Window Values: The script outputs signal states to the data window, which can be useful for debugging or building composite conditions in multi-indicator templates.
Inputs and Parameters
- You control the indicator from a comprehensive input panel:
- Setup: Signal expiry count, whether to enforce alternating signals, and whether to display labels and the dashboard (including position and size).
- Leading Indicator: Choose the primary signal generator from the large list.
- Per-Filter Toggles: For each confirmation, a respect... toggle enables or disables it. Many include sub-options (like MACD type, Stochastic mode, RSI mode, ADX variants, thresholds for choppiness/volatility, etc.) to fine-tune behavior.
- Range Filter Settings: Choose type and behavior; select default vs. DW mode and smoothing. The underlying functions adjust band sizes using ATR, average change, standard deviation, or user-defined scales.
- Because everything is customizable, you can adapt the indicator to different assets, volatility regimes, and timeframes.
Alerts and Automation
- The script defines alert conditions tied to longCondition and shortCondition . You can set these alerts in your chart to trigger notifications or webhook calls for automated execution in external bots. The alert text is simple, and you can configure your own message template when creating alerts in the chart, including JSON payloads for algorithmic integration.
Typical Workflow
- Select a Leading Indicator aligned with your style. For trend following, Supertrend or SSL may be appropriate; for momentum, MACD or TSI; for range/trend-change detection, Range Filter, RQK, or Donchian.
- Add a few key Confirmation Filters that complement the leading signal. For example:
- Pair Supertrend with EMA Filter and RSI MA Direction to ensure trend alignment and positive momentum.
- Combine MACD Crossover with ADX/DMI and Volume Above MA to avoid signals in low-trend or low-liquidity conditions.
- Use RQK with Choppiness Index and Damiani Volatility to only act when the market is trending and volatile enough.
- Set a sensible Signal Expiry Candle Count. Shorter expiry keeps entries timely and reduces lag; longer expiry captures setups that mature slowly.
- Observe the Dashboard during live markets to see which filters pass or fail, then iterate. Tighten or loosen thresholds and filter combinations as needed.
- For automation, turn on alerts for the final conditions and use webhook payloads to notify your trading robot.
Strengths and Practical Notes
- Flexibility: The indicator is a toolkit rather than a single rigid model. It lets you test different combinations rapidly and visualize outcomes immediately.
- Clarity: Labels, dashboard, and failed-confirmation markers make it easy to audit behavior and refine settings without digging into code.
- Robustness: The expiry and alternation options add discipline, avoiding the temptation to enter late or repeatedly in one direction without a reset.
- Modular Design: The logical gates (“respect…”) make the behavior transparent: if a filter is on, it must pass; if it’s off, the signal ignores it. This keeps reasoning clean.
- Avoiding Overfitting: Because you can stack many filters, it’s tempting to over-constrain signals. Start simple (one leading indicator and one or two confirmations). Add complexity only if it demonstrably improves your edge across varied market regimes.
Limitations and Recommendations
- No single configuration is universally optimal. Markets change; tune filters for the instrument and timeframe you trade and revisit settings periodically.
- Trend filters can underperform in choppy markets; likewise, momentum filters can false-trigger in quiet periods. Consider using Choppiness Index or Damiani to gate signals by regime.
- Use expiry wisely. Too short may miss good setups that need a few bars to confirm; too long may cause late entries. Balance responsiveness and accuracy.
- Always consider risk management externally (position sizing, stops, profit targets). The indicator focuses on signal quality; combining it with robust trade management methods will improve results.
Example Configurations
- Trend-Following Setup:
- Leading: Supertrend uptrend for longs and downtrend for shorts.
- Confirmations: EMA Filter (price above 200 EMA for long, below for short), ADX/DMI (trend strength above threshold with +DI/-DI alignment), Volume Above MA.
- Expiry: 3–4 bars to keep entries timely.
- Result: Strong bias toward sustained moves while avoiding weak trends and thin liquidity.
- Mean-Reversion to Momentum Crossover:
- Leading: RSI exits from OB/OS zones (e.g., RSI leaves oversold for long and leaves overbought for short).
- Confirmations: 2 EMA Cross (fast crossing slow in the same direction), MACD zero-line behavior for added momentum validation.
- Expiry: 2–3 bars for responsive re-entry.
- Result: Captures momentum transitions after short-term extremes, with extra confirmation to reduce head-fakes.
- Range Breakout Focus:
- Leading: Range Filter Type 2 or Donchian Trend Ribbon to detect breakouts.
- Confirmations: Damiani Volatility (avoid low-volatility false breaks), Choppiness Index (prefer trend-ready states), ROC positive/negative threshold.
- Expiry: 1–3 bars to act on breakout windows.
- Result: Better alignment to breakout dynamics, gating trades by volatility and regime.
Conclusion
- This indicator is a comprehensive, configurable framework that merges a chosen leading signal with an array of corroborating filters, disciplined expiry handling, and intuitive visualization. It’s designed to help you build high-quality entry signals tailored to your approach, whether that’s trend-following, breakout trading, momentum capturing, or a hybrid. By surfacing pass/fail states in a dashboard and allowing alert-based automation, it bridges the gap between discretionary analysis and systematic execution. With sensible parameter tuning and thoughtful filter selection, it can serve as a robust backbone for signal generation across diverse instruments and timeframes.

Volume Based Ichimoku CloudIntroduction
This release focuses primarily on a volume-based Donchian. For some time I was looking for a volume-based Donchian, not finding anything that satisfied me I tried to apply one, and then I applied it to Ichimoku.
I found advantages especially in the lateralization phase, where the integration with the volume filters some false signals.
I have added some features:
- Check the conditions of buy/sell of classic Ichimoku
- Verified reverse buy/sell condition
- Alerts
- Entrance package
- possibility to choose the type of Donchian to use (classic, volume-based)
Settings
There are the classic parameters of Ichimoku, for scalping, I use setting like(6-17-34-17 or 5-14-28-14), the new parameters are:
Donchian Type : Classic / Volume Based
Show Condition : it shows green/red square on the bottom when all the conditions of Ichimoku are satisfied, without the checkmark the inputs or the alarms will not work for this type of signal
Show Reversal : it shows yellow/purple triangle on the bottom when all during short/long state condition of Ichimoku Tenkan cross the Kijun, without the checkmark the inputs or the alarms will not work for this type of signal
Trades Framework
Show Trade Lines : show the lines for Entry Point, TP1, TP2, SL
Per n Bars : For how many bars the sending lines will be drawn
Enter Gap : It's the gap, in percentage, from the last candle low/high. For example, the entry point will be set 0.1% higher than the last high of the candle, in a long situation, or 0.1% lower than the last low of the candle in a short situation.
Take Profit 1 : It's the gap, in percentage, from the entry point. For example, the first take profit will be set 0.5% higher/lower than the entry point.
Take Profit 2 : It's the gap, in percentage, from the entry point. For example, the second take profit will be set 0.5% higher/lower than the entry point.
Stop Loss : It's the gap, in percentage, from the entry point. For example, the stop loss will be set 0.5% higher/lower than the entry point.
How to use
The use will be like that for the classic Ichimoku, the combination with a volatility indicator or the volume analysis will certainly help to reduce false signals and therefore to select only the most profitable signals.
Remember that every statistical indicator is just a tool, it needs to be understood to be used at its best, otherwise, it is just a colored line in a colored graph.

Noro's RiskChannel StrategyIndicator
The Donchian price channel is used. There are 2 methods available to close the position. The user can choose a method.
Wikipedia: en.wikipedia.org
Strategy #1 (stop-loss type = channel)
Old classic trading strategy, using breakouts of the Donchan price channel.
If the price is above the price channel top line, open the long position (and close the short position)
If the price is below the lower line of the price channel, open the short position (and close the long position)
It is recommended that you all use market stop orders.
Strategy #2 (stop-loss type = center)
This metod is better. This method is recommended.
The central line (red) is the middle of the Donchian price channel. Used to close any positions.
If the price is higher than the price channel top line, open the long position.
If the price is lower than the lower line of the price channel, open the short position.
If the price has crossed the central line of the channel, close any position.
It is recommended that you all use market stop orders.
Risk
There are 2 options. Risk for long positions and risk for short positions. This is the size of the possible loss. Order size depends on the possible loss and is calculated for each position.
For
BTC/USD, BTC/USDT, XBT/USD, ETH/USD, ETH/USD (need USD!)
Timeframes: 1h and length of price channel = 50 bars or 4h and length of price channel = 12

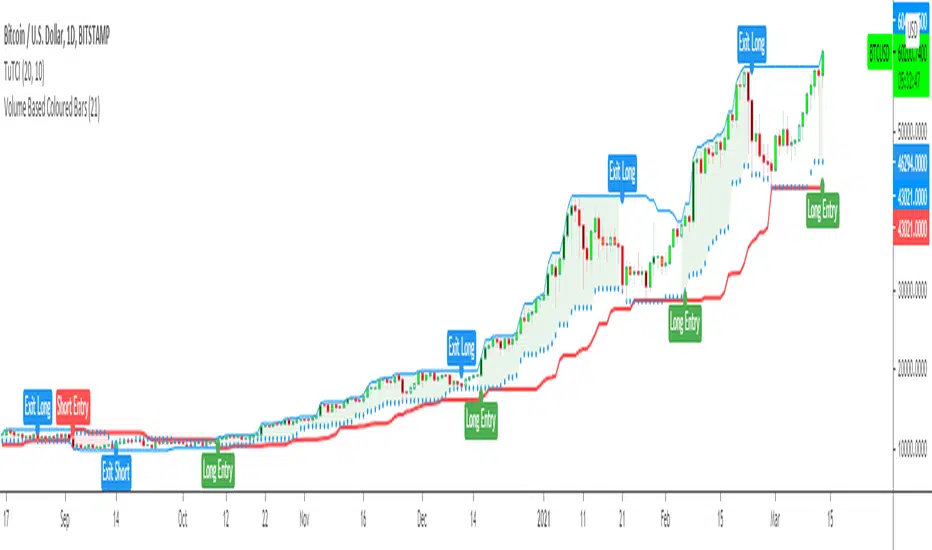
Turtle Trade Channels Indicator TUTCILegendary trade system which proved that great traders can be made, not born.
Turtle Trade Experiment made 80% annual return for 4 years and made 150 million $
Turtle Trade trend following system is a complete opposite to the "buy low and sell high" approach.
This trend following system was taught to a group of average and normal individuals, and almost everyone turned into a profitable trader.
They used the basis logic of well known DONCHIAN CHANNELS which developed by Richard Donchian.
The main rule is "Trade an 20-day breakout and take profits when an 10-day high or low is breached ". Examples:
Buy a 20-day breakout and close the trade when price action reaches a 10-day low.
Go short a 20-day breakout and close the trade when price action reaches a 10-day high.
In this indicator,
The red line is the trading line which indicates the trend directio n:
Price bars over the trend line indicates uptrend
Price bars under the trend line means downtrend
The dotted blue line is the exit line.
Original system is:
Go long when the price High is equal to or above previous 20 day Highest price.
Go short when the price Low is equal to or below previous 20 day Lowest price.
Exit long positions when the price touches the exit line
Exit short positions when the price touches the exit line
Recommended initial stop-loss is ATR * 2 from the opening price.
Default system parameters were 20,10 and 55,20.
Original Turtle Rules:
To trade exactly like the turtles did, you need to set up two indicators representing the main and the failsafe system.
Set up the main indicator with EntryPeriod = 20 and ExitPeriod = 10 (A.k.a S1)
Set up the failsafe indicator with EntryPeriod = 55 and ExitPeriod = 20 using a different color. (A.k.a S2)
The entry strategy using S1 is as follows
Buy 20-day breakouts using S1 only if last signaled trade was a loss.
Sell 20-day breakouts using S1 only if last signaled trade was a loss.
If last signaled trade by S1 was a win, you shouldn't trade -Irregardless of the direction or if you traded last signal it or not-
The entry strategy using S2 is as follows:
Buy 55-day breakouts only if you ignored last S1 signal and the market is rallying without you
Sell 55-day breakouts only if you ignored last S1 signal and the market is pluging without you
You can Highlight the chart with provided trade signals:
Green background color when Long
Red background color when Short
No background color when flat
WARNING: TURTLE TRADE STOP or ADDING more UNITS RULES ARE NOT INCLUDED.
Author: Kıvanç Özbilgiç
Also you can show or hide trade signals with the button on the settings menu
Multi-Band Breakout IndicatorThe Multi-Band Breakout Indicator was created to help identify potential breakout opportunities in the market. It combines multiple bands (ATR-Based and Donchian) and moving averages to provide valuable insights into the underlying trend and potential breakouts. By understanding the calculations, interpretation, parameter adjustments, potential applications, and limitations of the indicator, traders can effectively incorporate it into their trading strategy.
Calculation:
The indicator utilizes several calculations to plot the bands and moving averages. The length parameter determines the period used for the Average True Range (ATR), which measures volatility. A higher length captures a longer-term view of price movement, while a lower length focuses on shorter-term volatility. The multiplier parameter adjusts the distance of the upper and lower bands from the ATR. A higher multiplier expands the bands, accommodating greater price volatility, while a lower multiplier tightens the bands, reflecting lower volatility. The MA Length parameter determines the period for the moving averages used to calculate the trend and trend moving average. A higher MA Length creates a smoother trend line, filtering out shorter-term fluctuations, while a lower MA Length provides a more sensitive trend line.
The Donchian calculations in the Multi-Band Breakout Indicator play a significant role in identifying potential breakout opportunities and providing additional confirmation for trading signals. In this indicator, the Donchian calculations are applied to the trend line, which represents the average of the upper and lower bands. To calculate the Donchian levels, the indicator uses the Donchian Length parameter, which determines the period over which the highest high and lowest low are calculated. A longer Donchian Length captures a broader price range, while a shorter length focuses on more recent price action. By incorporating the Donchian calculations into the Multi-Band Breakout Indicator, traders gain an additional layer of confirmation for breakout signals.
Interpretation:
The Multi-Band Breakout Indicator offers valuable interpretation for traders. The upper and lower bands represent dynamic levels of resistance and support, respectively. These bands reflect the potential price range within which the asset is expected to trade. The trend line is the average of these bands and provides a central reference point for the overall trend. When the price moves above the upper band, it suggests a potential overbought condition and a higher probability of a pullback. Conversely, when the price falls below the lower band, it indicates a potential oversold condition and an increased likelihood of a bounce. The trend moving average further smooths the trend line, making it easier to identify the prevailing direction.
The crossover of the trend line (representing the average of the upper and lower bands) and the trend moving average holds a significant benefit for traders. This crossover serves as a powerful signal for potential trend changes and breakout opportunities in the market. When the trend line crosses above the trend moving average, it suggests a shift in momentum towards the upside, indicating a potential bullish trend. This provides traders with an early indication of a possible upward movement in prices. Conversely, when the trend line crosses below the trend moving average, it indicates a shift in momentum towards the downside, signaling a potential bearish trend. This crossover acts as an early warning for potential downward price movement. By identifying these crossovers, traders can capture the initial stages of a new trend, enabling them to enter trades at favorable entry points and potentially maximize their profit potential.
Breakout Signals:
For bullish breakouts, the indicator looks for a bullish crossover between the trend line and the trend moving average. This crossover suggests a shift in momentum towards the upside. Additionally, it checks if the current price has broken above the upper band and the previous Donchian high. This confirms that the price is surpassing a previous resistance level, indicating further upward movement.
For bearish breakouts, the indicator looks for a bearish crossunder between the trend line and the trend moving average. This crossunder indicates a shift in momentum towards the downside. It also checks if the current price has broken below the lower band and the previous Donchian low. This confirms that the price is breaking through a previous support level, signaling potential downward movement.
When a bullish or bearish breakout is detected, it suggests a potential trading opportunity. Traders may consider initiating positions in the direction of the breakout, anticipating further price movement in that direction. However, it's important to remember that breakouts alone do not guarantee a successful trade. Other factors, such as market conditions, volume, and confirmation from additional indicators, should be taken into account. Risk management techniques should also be implemented to manage potential losses.
Coloration:
The coloration in the Multi-Band Breakout Indicator is used to visually represent different aspects of the indicator and provide valuable insights to traders. Let's break down the coloration components:
-- Trend/Basis Color : The tColor variable determines the color of the bars based on the relationship between the trend line (trend) and the closing price (close), as well as the relationship between the trend line and the trend moving average (trendMA). If the trend line is above the closing price and the trend moving average is also above the closing price, the bars are colored fuchsia, indicating a potential bullish trend. If the trend line is below the closing price and the trend moving average is also below the closing price, the bars are colored lime, indicating a potential bearish trend. If neither of these conditions is met, the bars are colored yellow, representing a neutral or indecisive market condition.
-- Moving Average Color : The maColor variable determines the color of the filled area between the trend line and the trend moving average. If the trend line is above the trend moving average, the area is filled with a lime color with 70% opacity, indicating a potential bullish trend. Conversely, if the trend line is below the trend moving average, the area is filled with a fuchsia color with 70% opacity, indicating a potential bearish trend. This coloration helps traders visually identify the relationship between the trend line and the trend moving average.
-- highColor and lowColor : The highColor and lowColor variables determine the colors of the high Donchian band (hhigh) and the low Donchian band (llow), respectively. These bands represent dynamic levels of resistance and support. If the highest point in the previous Donchian period (hhigh) is above the upper band, the highColor is set to olive with 90% opacity, indicating a potential resistance level. On the other hand, if the lowest point in the previous Donchian period (llow) is below the lower band, the lowColor is set to red with 90% opacity, suggesting a potential support level. These colorations help traders quickly identify important price levels and assess their significance in relation to the bands.
By incorporating coloration, the Multi-Band Breakout Indicator provides visual cues to traders, making it easier to interpret the relationships between various components and assisting in identifying potential trend changes and breakout opportunities. Traders can use these color cues to quickly assess the prevailing market conditions and make informed trading decisions.
Adjusting Parameters:
The Multi-Band Breakout Indicator offers flexibility through parameter adjustments. Traders can customize the indicator based on their preferences and trading style. The length parameter controls the sensitivity to price changes, with higher values capturing longer-term trends, while lower values focus on shorter-term price movements. By adjusting the parameters, such as the ATR length, multiplier, Donchian length, and MA length, traders can customize the indicator to suit different timeframes and trading strategies. For shorter timeframes, smaller values for these parameters may be more suitable, while longer timeframes may require larger values.
Potential Applications:
The Multi-Band Breakout Indicator can be applied in various trading strategies. It helps identify potential breakout opportunities, allowing traders to enter trades in the direction of the breakout. Traders can use the indicator to initiate trades when the price moves above the upper band or below the lower band, confirming a potential breakout and providing a signal to enter a trade. Additionally, the indicator can be combined with other technical analysis tools, such as support and resistance levels, candlestick patterns, or trend indicators, to increase the probability of successful trades. By incorporating the Multi-Band Breakout Indicator into their trading approach, traders can gain a better understanding of market trends and capture potential profit opportunities.
Limitations:
While the Multi-Band Breakout Indicator is a useful tool, it has some limitations that traders should consider. The indicator performs best in trending markets where price movements are relatively strong and sustained. During ranging or choppy market conditions, the indicator may generate false signals, leading to potential losses. It is crucial to use the indicator in conjunction with other analysis techniques and risk management strategies to enhance its effectiveness. Additionally, traders should consider external factors such as market news, economic events, and overall market sentiment when interpreting the signals generated by the indicator.
By combining multiple bands and moving averages, this indicator offers valuable insights into the underlying trend and helps traders make informed trading decisions. With customization options and careful interpretation, this indicator can be a valuable addition to any trader's toolkit, assisting in identifying potential breakouts, capturing profitable trades, and enhancing overall trading performance.

Rev & Line - CoffeeKillerRev & Line - CoffeeKiller Indicator Guide
🔔 Warning: This Indicator Repaints 🔔 This indicator uses real-time calculations that may change based on future price action. As a result, signals (such as arrows, lines, or color changes) **can and will repaint** — meaning they may appear, disappear, or shift after a candle closes.
**Do not rely on this tool alone for live trading decisions.** Use with caution and always confirm with non-repainting tools or additional analysis.(This indicator is designed to show me the full length of the trend and because of this there can be a smaller movement inside of the trend movement)
Welcome traders! This guide will walk you through the Rev & Line indicator, a sophisticated technical analysis tool developed by CoffeeKiller that combines multiple methodologies to identify market pivots, trends, and potential reversal points.
Core Components
1. ZigZag Analysis
- Dynamic pivot detection using ATR (Average True Range)
- Customizable sensitivity through ATR Reversal Factor
- Color-coded trend lines (green for upward, red for downward)
- Optional vertical lines at pivot points
- Real-time pivot point analysis
2. Donchian Channel Integration
- Traditional upper, lower, and middle bands
- Customizable length and displacement
- Channel-based entry signals
- Dynamic market structure visualization
3. Marker Lines System
- Dynamic support/resistance level tracking
- Pivot-based reset mechanism
- Optional fill zones between markers
- Percentage position tracking within range
4. Signal Generation System
- Confluence between ZigZag pivots and Donchian channels
- Up/down arrow visualization
- Alert system
Main Features
ZigZag Settings
- ATR Reversal Factor: Controls pivot sensitivity (default 3.2)
- Customizable line appearance:
Width control (default: 3)
Color selection (green for uptrend, red for downtrend)
Vertical line options at pivot points
Maximum vertical lines display limit
- Hide repainted option for more reliable signals
Donchian Channel Configuration
- Optional channel visibility toggle
- Length parameter for lookback period (default: 20)
- Displace option for time offset
- Bubble offset for visual placement
Marker Lines System
- High/low/middle marker lines with step-line visualization
- Dotted line projections for future reference
- Pivot-based reset mechanism
- Color-coded percentage position display
Signal Generation
- Triangle markers for signals
- Combined ZigZag and Donchian confluence
- Alert system for notifications
Visual Elements
1. Pivot Lines
- Green: Upward price movements
- Red: Downward price movements
- Customizable line width
- Optional vertical pivot markers with style options:
Solid lines for confirmed pivots
Dashed lines for older pivots
Dotted lines for most recent pivots
2. Donchian Channels
- Upper band (red): Resistance level
- Lower band (green): Support level
- Middle band (yellow): Median price line
- Customizable display options
3. Marker Lines
- High marker line (magenta): Tracks highest open price
- Low marker line (cyan): Tracks lowest open price
- Middle marker line (blue): 50% level between high/low
- Dotted line extensions for future price projections
4. Position Tracking
- Percentage position display within marker range
- Real-time calculations from 0% to 100%
- Label system for visual reference
Trading Applications
1. Trend Following
- Enter on confirmed ZigZag pivot points
- Use Donchian channel boundaries as targets
- Trail stops using marker lines
- Monitor for confluence between systems
2. Counter-Trend Trading
- Trade bounces from marker lines
- Use pivot confirmation for entry timing
- Set stops based on recent pivot points
- Target the opposite marker line
3. Range Trading
- Use high/low marker lines to define range
- Trade bounces between upper and lower markers
- Consider middle marker for range midpoint
- Monitor percentage position within range
4. Breakout Trading
- Enter on breaks above/below marker lines
- Confirm with Donchian channel breakouts
- Use ZigZag pivot confirmations
- Wait for arrow signals for additional confirmation
Optimization Guide
1. ZigZag Parameters
- Higher ATR Factor: Less sensitive, major moves only
- Lower ATR Factor: More sensitive, catches minor moves
- Adjust line width for chart visibility
- Balance vertical line count for clarity
2. Donchian Channel Settings
- Longer length: Smoother channels, fewer false signals
- Shorter length: More responsive, but potentially noisier
- Displacement: Offset for historical reference
- Consider timeframe when setting parameters
3. Marker Line Configuration
- Enable/disable based on trading style
- Toggle middle line for additional reference
- Adjust colors for visual clarity
- Enable/disable labels as needed
4. Signal Generation
- Use "Hide repainted" option for more reliable signals
- Combine ZigZag and Donchian signals for confirmation
- Set alerts based on confirmed pivot points
- Balance sensitivity with reliability
Best Practices
1. Signal Confirmation
- Wait for confirmed pivot points
- Check for Donchian channel interactions
- Confirm with price action
- Look for arrow signals at pivot points
2. Risk Management
- Use recent pivot points for stop placement
- Consider marker line boundaries for targets
- Don't trade against strong trends
- Wait for clear confluence between systems
3. Setup Optimization
- Start with default settings
- Adjust based on timeframe
- Fine-tune ATR sensitivity
- Match settings to trading style
Advanced Features
1. Alert System
- Customizable arrow alerts
- Pivot point notifications
- Text message alerts with ticker information
- Once-per-bar frequency option
2. Pivot Detection Logic
The indicator uses a sophisticated state-based approach to detect pivots:
- State transitions between "uptrend," "downtrend," and "undefined"
- ATR-based reversal detection
- Minimum movement threshold for pivot confirmation
- Historical pivot tracking and labeling
3. Marker Line Reset Mechanism
- Marker lines reset based on pivot detection
- Dynamic support/resistance level adjustment
- Percentage position calculation within range
- Automatic updates as market structure changes
Remember:
- Combine multiple confirmation signals
- Use appropriate timeframe settings
- Monitor both ZigZag and Marker signals
- Pay attention to Donchian channel interactions
- Consider market volatility when trading
This indicator works best when:
- Used with proper risk management
- Combined with other technical tools
- Applied to appropriate timeframes
- Signals are confirmed by price action
**DISCLAIMER**: This indicator and its signals are intended solely for educational and informational purposes. They do not constitute financial advice. Trading involves significant risk of loss. Always conduct your own analysis and consult with financial professionals before making trading decisions.

ootaLibrary "oota"
Collection of all custom and enhanced TA indicators - Object oriented methods implementation
method tr(c, useTrueRange)
returns true range of the candle
Namespace types: Candle
Parameters:
c (Candle) : Candle object containing ohlc data
useTrueRange (bool) : Use true range for atr calculation instead of just high/low difference
method ma(maType, length, source)
returns custom moving averages
Namespace types: simple CustomSeries
Parameters:
maType (simple CustomSeries) : Custom series type
length (simple int) : Moving Average Length
source (float) : Moving Average Source
Returns: moving average for the given type and length
method atr(maType, length, useTrueRange, c)
returns ATR with custom moving average
Namespace types: simple CustomSeries
Parameters:
maType (simple CustomSeries) : Custom series type
length (simple int) : Moving Average Length
useTrueRange (bool) : Use true range for atr calculation instead of just high/low difference
c (Candle) : Candle object containing ohlc
Returns: ATR for the given moving average type and length
method atrpercent(maType, length, useTrueRange, c)
returns ATR as percentage of close price
Namespace types: simple CustomSeries
Parameters:
maType (simple CustomSeries) : Custom series type
length (simple int) : Moving Average Length
useTrueRange (bool) : Use true range for atr calculation instead of just high/low difference
c (Candle) : Candle object containing ohlc
Returns: ATR as percentage of close price for the given moving average type and length
method bb(maType, length, multiplier, sticky, c)
returns Bollinger band for custom moving average
Namespace types: simple CustomSeries
Parameters:
maType (simple CustomSeries) : Custom series type
length (simple int) : Moving Average Length
multiplier (float) : Standard Deviation multiplier
sticky (simple bool) : - sticky boundaries which will only change when value is outside boundary.
c (Candle) : Candle object containing ohlc
Returns: Bollinger band with custom moving average for given source, length and multiplier
method bbw(maType, length, multiplier, sticky, c)
returns Bollinger bandwidth for custom moving average
Namespace types: simple CustomSeries
Parameters:
maType (simple CustomSeries) : Custom series type
length (simple int) : Moving Average Length
multiplier (float) : Standard Deviation multiplier
sticky (simple bool) : sticky boundaries which will only change when value is outside boundary.
c (Candle) : Candle object containing ohlc
Returns: Bollinger Bandwidth for custom moving average for given source, length and multiplier
method bpercentb(maType, length, multiplier, sticky, c)
returns Bollinger Percent B for custom moving average
Namespace types: simple CustomSeries
Parameters:
maType (simple CustomSeries) : Custom series type
length (simple int) : Moving Average Length
multiplier (float) : Standard Deviation multiplier
sticky (simple bool) : - sticky boundaries which will only change when value is outside boundary.
c (Candle) : Candle object containing ohlc
Returns: Bollinger Percent B for custom moving average for given source, length and multiplier
method kc(maType, length, multiplier, useTrueRange, sticky, c)
returns Keltner Channel for custom moving average
Namespace types: simple CustomSeries
Parameters:
maType (simple CustomSeries) : Custom series type
length (simple int) : Moving Average Length
multiplier (float) : Standard Deviation multiplier
useTrueRange (simple bool) : - if set to false, uses high-low.
sticky (simple bool) : - sticky boundaries which will only change when value is outside boundary.
c (Candle) : Candle object containing ohlc
Returns: Keltner Channel for custom moving average for given souce, length and multiplier
method kcw(maType, length, multiplier, useTrueRange, sticky, c)
returns Keltner Channel Width with custom moving average
Namespace types: simple CustomSeries
Parameters:
maType (simple CustomSeries) : Custom series type
length (simple int) : Moving Average Length
multiplier (float) : Standard Deviation multiplier
useTrueRange (simple bool) : - if set to false, uses high-low.
sticky (simple bool) : - sticky boundaries which will only change when value is outside boundary.
c (Candle) : Candle object containing ohlc
Returns: Keltner Channel Width for custom moving average
method kpercentk(maType, length, multiplier, useTrueRange, sticky, c)
returns Keltner Channel Percent K Width with custom moving average
Namespace types: simple CustomSeries
Parameters:
maType (simple CustomSeries) : Custom series type
length (simple int) : Moving Average Length
multiplier (float) : Standard Deviation multiplier
useTrueRange (simple bool) : - if set to false, uses high-low.
sticky (simple bool) : - sticky boundaries which will only change when value is outside boundary.
c (Candle) : Candle object containing ohlc
Returns: Keltner Percent K for given moving average, source, length and multiplier
method dc(c, length, sticky)
returns Custom Donchian Channel
Namespace types: Candle
Parameters:
c (Candle) : Candle object containing ohlc
length (simple int) : - donchian channel length
sticky (simple bool) : - sticky boundaries which will only change when value is outside boundary.
Returns: Donchian channel
method dcw(c, length, sticky)
returns Donchian Channel Width
Namespace types: Candle
Parameters:
c (Candle) : Candle object containing ohlc
length (simple int) : - donchian channel length
sticky (simple bool) : - sticky boundaries which will only change when value is outside boundary.
Returns: Donchian channel width
method dpercentd(c, length, sticky)
returns Donchian Channel Percent of price
Namespace types: Candle
Parameters:
c (Candle) : Candle object containing ohlc
length (simple int) : - donchian channel length
sticky (simple bool) : - sticky boundaries which will only change when value is outside boundary.
Returns: Donchian channel Percent D
method supertrend(maType, length, multiplier, useTrueRange, waitForClose, delayed, c)
supertrend Simple supertrend based on atr but also takes into consideration of custom MA Type, sources
Namespace types: simple CustomSeries
Parameters:
maType (simple CustomSeries) : Custom Series
length (simple int) : ATR Length
multiplier (simple float) : ATR Multiplier
useTrueRange (simple bool) : - if set to false, uses high-low.
waitForClose (simple bool) : : Considers source for direction change crossover if checked. Else, uses highSource and lowSource.
delayed (simple bool) : : if set to true lags supertrend atr stop based on target levels.
c (Candle) : Candle object containing ohlc
Returns: dir : Supertrend direction
supertrend : BuyStop if direction is 1 else SellStop
method oscillatorRange(seriesType, source, highlowLength, rangeLength, sticky)
oscillatorRange - returns Custom overbought/oversold areas for an oscillator input
Namespace types: simple CustomSeries
Parameters:
seriesType (simple CustomSeries) : - Custom series type
source (float) : - Osillator source such as RSI, COG etc.
highlowLength (simple int) : - length on which highlow of the oscillator is calculated
rangeLength (simple int) : - length used for calculating oversold/overbought range - usually same as oscillator length
sticky (simple bool) : - overbought, oversold levels won't change unless crossed
Returns: Dynamic overbought and oversold range for oscillator input
method oscillator(oscillatorType, length, shortLength, longLength, c)
oscillator - returns Choice of oscillator with custom overbought/oversold range
Namespace types: simple OscillatorType
Parameters:
oscillatorType (simple OscillatorType) : OscillatorType object
length (simple int) : - Oscillator length - not used for TSI
shortLength (simple int) : - shortLength only used for TSI
longLength (simple int) : - longLength only used for TSI
c (Candle) : Candle object containing ohlc
Returns: Oscillator value
method oscillatorWithRange(oscillatorType, length, shortLength, longLength, seriesType, highlowLength, sticky, c)
oscillatorWithRange - returns Choice of oscillator with custom overbought/oversold range
Namespace types: simple OscillatorType
Parameters:
oscillatorType (simple OscillatorType) : OscillatorType object
length (simple int) : - Oscillator length - not used for TSI
shortLength (simple int) : - shortLength only used for TSI
longLength (simple int) : - longLength only used for TSI
seriesType (simple CustomSeries) : - CustomSeries enum type
highlowLength (simple int) : - length on which highlow of the oscillator is calculated
sticky (simple bool) : - overbought, oversold levels won't change unless crossed
c (Candle) : Candle object containing ohlc
Returns: Oscillator value along with dynamic overbought and oversold range for oscillator input
Candle
Custom candle object
Fields:
o (series float) : open
h (series float) : high
l (series float) : low
c (series float) : close
barindex (series int) : bar_index
bartime (series int) : time
bartimeclose (series int) : time_close
v (series float) : volume
taLibrary "ta"
Collection of all custom and enhanced TA indicators
ma(source, maType, length)
returns custom moving averages
Parameters:
source (float) : Moving Average Source
maType (simple string) : Moving Average Type : Can be sma, ema, hma, rma, wma, vwma, swma, highlow, linreg, median
length (simple int) : Moving Average Length
Returns: moving average for the given type and length
atr(maType, length)
returns ATR with custom moving average
Parameters:
maType (simple string) : Moving Average Type : Can be sma, ema, hma, rma, wma, vwma, swma, highlow, linreg, median
length (simple int) : Moving Average Length
Returns: ATR for the given moving average type and length
atrpercent(maType, length)
returns ATR as percentage of close price
Parameters:
maType (simple string) : Moving Average Type : Can be sma, ema, hma, rma, wma, vwma, swma, highlow, linreg, median
length (simple int) : Moving Average Length
Returns: ATR as percentage of close price for the given moving average type and length
bb(source, maType, length, multiplier, sticky)
returns Bollinger band for custom moving average
Parameters:
source (float) : Moving Average Source
maType (simple string) : Moving Average Type : Can be sma, ema, hma, rma, wma, vwma, swma, highlow, linreg, median
length (simple int) : Moving Average Length
multiplier (float) : Standard Deviation multiplier
sticky (simple bool) : - sticky boundaries which will only change when value is outside boundary.
Returns: Bollinger band with custom moving average for given source, length and multiplier
bbw(source, maType, length, multiplier, sticky)
returns Bollinger bandwidth for custom moving average
Parameters:
source (float) : Moving Average Source
maType (simple string) : Moving Average Type : Can be sma, ema, hma, rma, wma, vwma, swma, highlow, linreg, median
length (simple int) : Moving Average Length
multiplier (float) : Standard Deviation multiplier
sticky (simple bool) : - sticky boundaries which will only change when value is outside boundary.
Returns: Bollinger Bandwidth for custom moving average for given source, length and multiplier
bpercentb(source, maType, length, multiplier, sticky)
returns Bollinger Percent B for custom moving average
Parameters:
source (float) : Moving Average Source
maType (simple string) : Moving Average Type : Can be sma, ema, hma, rma, wma, vwma, swma, highlow, linreg, median
length (simple int) : Moving Average Length
multiplier (float) : Standard Deviation multiplier
sticky (simple bool) : - sticky boundaries which will only change when value is outside boundary.
Returns: Bollinger Percent B for custom moving average for given source, length and multiplier
kc(source, maType, length, multiplier, useTrueRange, sticky)
returns Keltner Channel for custom moving average
Parameters:
source (float) : Moving Average Source
maType (simple string) : Moving Average Type : Can be sma, ema, hma, rma, wma, vwma, swma, highlow, linreg, median
length (simple int) : Moving Average Length
multiplier (float) : Standard Deviation multiplier
useTrueRange (simple bool) : - if set to false, uses high-low.
sticky (simple bool) : - sticky boundaries which will only change when value is outside boundary.
Returns: Keltner Channel for custom moving average for given souce, length and multiplier
kcw(source, maType, length, multiplier, useTrueRange, sticky)
returns Keltner Channel Width with custom moving average
Parameters:
source (float) : Moving Average Source
maType (simple string) : Moving Average Type : Can be sma, ema, hma, rma, wma, vwma, swma, highlow, linreg, median
length (simple int) : Moving Average Length
multiplier (float) : Standard Deviation multiplier
useTrueRange (simple bool) : - if set to false, uses high-low.
sticky (simple bool) : - sticky boundaries which will only change when value is outside boundary.
Returns: Keltner Channel Width for custom moving average
kpercentk(source, maType, length, multiplier, useTrueRange, sticky)
returns Keltner Channel Percent K Width with custom moving average
Parameters:
source (float) : Moving Average Source
maType (simple string) : Moving Average Type : Can be sma, ema, hma, rma, wma, vwma, swma, highlow, linreg, median
length (simple int) : Moving Average Length
multiplier (float) : Standard Deviation multiplier
useTrueRange (simple bool) : - if set to false, uses high-low.
sticky (simple bool) : - sticky boundaries which will only change when value is outside boundary.
Returns: Keltner Percent K for given moving average, source, length and multiplier
dc(length, useAlternateSource, alternateSource, sticky)
returns Custom Donchian Channel
Parameters:
length (simple int) : - donchian channel length
useAlternateSource (simple bool) : - Custom source is used only if useAlternateSource is set to true
alternateSource (float) : - Custom source
sticky (simple bool) : - sticky boundaries which will only change when value is outside boundary.
Returns: Donchian channel
dcw(length, useAlternateSource, alternateSource, sticky)
returns Donchian Channel Width
Parameters:
length (simple int) : - donchian channel length
useAlternateSource (simple bool) : - Custom source is used only if useAlternateSource is set to true
alternateSource (float) : - Custom source
sticky (simple bool) : - sticky boundaries which will only change when value is outside boundary.
Returns: Donchian channel width
dpercentd(length, useAlternateSource, alternateSource, sticky)
returns Donchian Channel Percent of price
Parameters:
length (simple int) : - donchian channel length
useAlternateSource (simple bool) : - Custom source is used only if useAlternateSource is set to true
alternateSource (float) : - Custom source
sticky (simple bool) : - sticky boundaries which will only change when value is outside boundary.
Returns: Donchian channel Percent D
oscillatorRange(source, method, highlowLength, rangeLength, sticky)
oscillatorRange - returns Custom overbought/oversold areas for an oscillator input
Parameters:
source (float) : - Osillator source such as RSI, COG etc.
method (simple string) : - Valid values for method are : sma, ema, hma, rma, wma, vwma, swma, highlow, linreg, median
highlowLength (simple int) : - length on which highlow of the oscillator is calculated
rangeLength (simple int) : - length used for calculating oversold/overbought range - usually same as oscillator length
sticky (simple bool) : - overbought, oversold levels won't change unless crossed
Returns: Dynamic overbought and oversold range for oscillator input
oscillator(type, length, shortLength, longLength, source, highSource, lowSource, method, highlowLength, sticky)
oscillator - returns Choice of oscillator with custom overbought/oversold range
Parameters:
type (simple string) : - oscillator type. Valid values : cci, cmo, cog, mfi, roc, rsi, stoch, tsi, wpr
length (simple int) : - Oscillator length - not used for TSI
shortLength (simple int) : - shortLength only used for TSI
longLength (simple int) : - longLength only used for TSI
source (float) : - custom source if required
highSource (float) : - custom high source for stochastic oscillator
lowSource (float) : - custom low source for stochastic oscillator
method (simple string) : - Valid values for method are : sma, ema, hma, rma, wma, vwma, swma, highlow, linreg, median
highlowLength (simple int) : - length on which highlow of the oscillator is calculated
sticky (simple bool) : - overbought, oversold levels won't change unless crossed
Returns: Oscillator value along with dynamic overbought and oversold range for oscillator input

taLibrary "ta"
Collection of all custom and enhanced TA indicators. Same as enhanced_ta. But, removed all the displays to make it faster.
ma(source, maType, length)
returns custom moving averages
Parameters:
source : Moving Average Source
maType : Moving Average Type : Can be sma, ema, hma, rma, wma, vwma, swma, highlow, linreg, median
length : Moving Average Length
Returns: moving average for the given type and length
atr(maType, length)
returns ATR with custom moving average
Parameters:
maType : Moving Average Type : Can be sma, ema, hma, rma, wma, vwma, swma, highlow, linreg, median
length : Moving Average Length
Returns: ATR for the given moving average type and length
atrpercent(maType, length)
returns ATR as percentage of close price
Parameters:
maType : Moving Average Type : Can be sma, ema, hma, rma, wma, vwma, swma, highlow, linreg, median
length : Moving Average Length
Returns: ATR as percentage of close price for the given moving average type and length
bb(source, maType, length, multiplier, sticky)
returns Bollinger band for custom moving average
Parameters:
source : Moving Average Source
maType : Moving Average Type : Can be sma, ema, hma, rma, wma, vwma, swma, highlow, linreg, median
length : Moving Average Length
multiplier : Standard Deviation multiplier
sticky : - sticky boundaries which will only change when value is outside boundary.
Returns: Bollinger band with custom moving average for given source, length and multiplier
bbw(source, maType, length, multiplier, sticky)
returns Bollinger bandwidth for custom moving average
Parameters:
source : Moving Average Source
maType : Moving Average Type : Can be sma, ema, hma, rma, wma, vwma, swma, highlow, linreg, median
length : Moving Average Length
multiplier : Standard Deviation multiplier
sticky : - sticky boundaries which will only change when value is outside boundary.
Returns: Bollinger Bandwidth for custom moving average for given source, length and multiplier
bpercentb(source, maType, length, multiplier, sticky)
returns Bollinger Percent B for custom moving average
Parameters:
source : Moving Average Source
maType : Moving Average Type : Can be sma, ema, hma, rma, wma, vwma, swma, highlow, linreg, median
length : Moving Average Length
multiplier : Standard Deviation multiplier
sticky : - sticky boundaries which will only change when value is outside boundary.
Returns: Bollinger Percent B for custom moving average for given source, length and multiplier
kc(source, maType, length, multiplier, useTrueRange, sticky)
returns Keltner Channel for custom moving average
Parameters:
source : Moving Average Source
maType : Moving Average Type : Can be sma, ema, hma, rma, wma, vwma, swma, highlow, linreg, median
length : Moving Average Length
multiplier : Standard Deviation multiplier
useTrueRange : - if set to false, uses high-low.
sticky : - sticky boundaries which will only change when value is outside boundary.
Returns: Keltner Channel for custom moving average for given souce, length and multiplier
kcw(source, maType, length, multiplier, useTrueRange, sticky)
returns Keltner Channel Width with custom moving average
Parameters:
source : Moving Average Source
maType : Moving Average Type : Can be sma, ema, hma, rma, wma, vwma, swma, highlow, linreg, median
length : Moving Average Length
multiplier : Standard Deviation multiplier
useTrueRange : - if set to false, uses high-low.
sticky : - sticky boundaries which will only change when value is outside boundary.
Returns: Keltner Channel Width for custom moving average
kpercentk(source, maType, length, multiplier, useTrueRange, sticky)
returns Keltner Channel Percent K Width with custom moving average
Parameters:
source : Moving Average Source
maType : Moving Average Type : Can be sma, ema, hma, rma, wma, vwma, swma, highlow, linreg, median
length : Moving Average Length
multiplier : Standard Deviation multiplier
useTrueRange : - if set to false, uses high-low.
sticky : - sticky boundaries which will only change when value is outside boundary.
Returns: Keltner Percent K for given moving average, source, length and multiplier
dc(length, useAlternateSource, alternateSource, sticky)
returns Custom Donchian Channel
Parameters:
length : - donchian channel length
useAlternateSource : - Custom source is used only if useAlternateSource is set to true
alternateSource : - Custom source
sticky : - sticky boundaries which will only change when value is outside boundary.
Returns: Donchian channel
dcw(length, useAlternateSource, alternateSource, sticky)
returns Donchian Channel Width
Parameters:
length : - donchian channel length
useAlternateSource : - Custom source is used only if useAlternateSource is set to true
alternateSource : - Custom source
sticky : - sticky boundaries which will only change when value is outside boundary.
Returns: Donchian channel width
dpercentd(useAlternateSource, alternateSource, length, sticky)
returns Donchian Channel Percent of price
Parameters:
useAlternateSource : - Custom source is used only if useAlternateSource is set to true
alternateSource : - Custom source
length : - donchian channel length
sticky : - sticky boundaries which will only change when value is outside boundary.
Returns: Donchian channel Percent D
oscillatorRange(source, method, highlowLength, rangeLength, sticky)
oscillatorRange - returns Custom overbought/oversold areas for an oscillator input
Parameters:
source : - Osillator source such as RSI, COG etc.
method : - Valid values for method are : sma, ema, hma, rma, wma, vwma, swma, highlow, linreg, median
highlowLength : - length on which highlow of the oscillator is calculated
rangeLength : - length used for calculating oversold/overbought range - usually same as oscillator length
sticky : - overbought, oversold levels won't change unless crossed
Returns: Dynamic overbought and oversold range for oscillator input
oscillator(type, length, shortLength, longLength, source, highSource, lowSource, method, highlowLength, sticky)
oscillator - returns Choice of oscillator with custom overbought/oversold range
Parameters:
type : - oscillator type. Valid values : cci, cmo, cog, mfi, roc, rsi, stoch, tsi, wpr
length : - Oscillator length - not used for TSI
shortLength : - shortLength only used for TSI
longLength : - longLength only used for TSI
source : - custom source if required
highSource : - custom high source for stochastic oscillator
lowSource : - custom low source for stochastic oscillator
method : - Valid values for method are : sma, ema, hma, rma, wma, vwma, swma, highlow, linreg, median
highlowLength : - length on which highlow of the oscillator is calculated
sticky : - overbought, oversold levels won't change unless crossed
Returns: Oscillator value along with dynamic overbought and oversold range for oscillator input
multibands(bandType, source, maType, length, useTrueRange, sticky, numberOfBands, multiplierStart, multiplierStep)
multibands - returns Choice of oscillator with custom overbought/oversold range
Parameters:
bandType : - Band type - can be either bb or kc
source : - custom source if required
maType : Moving Average Type : Can be sma, ema, hma, rma, wma, vwma, swma, highlow, linreg, median
length : - Oscillator length - not used for TSI
useTrueRange : - if set to false, uses high-low.
sticky : - for sticky borders which only change upon source crossover/crossunder
numberOfBands : - Number of bands to generate
multiplierStart : - Starting ATR or Standard deviation multiplier for first band
multiplierStep : - Incremental value for multiplier for each band
Returns: array of band values sorted in ascending order
mbandoscillator(bandType, source, maType, length, useTrueRange, stickyBands, numberOfBands, multiplierStart, multiplierStep)
mbandoscillator - Multiband oscillator created on the basis of bands
Parameters:
bandType : - Band type - can be either bb or kc
source : - custom source if required
maType : Moving Average Type : Can be sma, ema, hma, rma, wma, vwma, swma, highlow, linreg, median
length : - Oscillator length - not used for TSI
useTrueRange : - if set to false, uses high-low.
stickyBands : - for sticky borders which only change upon source crossover/crossunder for band detection
numberOfBands : - Number of bands to generate
multiplierStart : - Starting ATR or Standard deviation multiplier for first band
multiplierStep : - Incremental value for multiplier for each band
Returns: oscillator currentStates - Array containing states for last n bars

Advanced Market Structure [OmegaTools]📌 Market Structure
Advanced Market Structure is a next–generation indicator designed to decode price structure in real time by combining classical swing–based analysis with modern quantitative confirmation techniques. Built for traders who demand both precision and adaptability, it provides a robust multi–layered framework to identify structural shifts, trend continuations, and potential reversals across any asset class or timeframe.
Unlike traditional structure indicators that rely solely on visual swing identification, Market Structure introduces an integrated methodology: pivot detection, Donchian trend modeling, statistical confirmation via Z–Score, and volume–based validation. Each element contributes to a comprehensive, systematic representation of the underlying market dynamics.
🔑 Core Features
1. Five Distinct Market Structure Modes
Standard Mode:
Captures structural breaks through classical swing high/low pivots. Ideal for discretionary traders looking for clarity in directional bias.
Confirmed Breakout Mode:
Requires validation beyond the initial pivot break, filtering out noise and reducing false positives.
Donchian Trend HL (High/Low):
Establishes structure based on absolute highs and lows over rolling lookback windows. This approach highlights broader momentum shifts and trend–defining extremes.
Donchian Trend CC (Close/Close):
Similar to HL mode, but calculated using closing prices, enabling more precise bias identification where close–to–close structure carries stronger statistical weight.
Average Mode:
A composite methodology that synthesizes the four models into a weighted signal, producing a balanced structural bias designed to minimize model–specific weaknesses.
2. Dynamic Pivot Recognition with Auto–Updating Levels
Swing highs and lows are automatically detected and plotted with adaptive horizontal levels. These dynamic support/resistance markers continuously extend into the future, ensuring that historically significant levels remain visible and actionable.
3. Color–Adaptive Candlesticks
Price bars are dynamically recolored to reflect the prevailing structural regime: bullish (default blue), bearish (default red), or neutral (gray). This enables instant visual recognition of regime changes without requiring external confirmation.
4. Statistical Reversal Triggers
The script integrates a 21–period Z–Score calculation applied to closing prices, combined with multi–layered volume confirmation (SMA and EMA convergence).
Bullish trigger: Z–Score < –2 with structural confirmation and volume support.
Bearish trigger: Z–Score > +2 with structural confirmation and volume support.
Signals are plotted as diamond markers above or below the bars, identifying potential high–probability reversal setups in real time.
5. Integrated Alpha Backtesting Engine
Each market structure mode is evaluated through a built–in backtesting routine, tracking hit ratios and consistency across the most recent ~2000 structural events.
Performance metrics (“Alpha”) are displayed directly on–chart via a dedicated Performance Dashboard Table, allowing side–by–side comparison of Standard, Confirmed Breakout, Donchian HL, Donchian CC, and Average models.
Traders can instantly evaluate which structural methodology best adapts to the current market conditions.
🎯 Practical Advantages
Systematic Clarity: Eliminates subjectivity in defining structural bias, offering a rules–based framework.
Statistical Transparency: Built–in performance metrics validate each mode in real time, allowing informed decision–making.
Noise Reduction: Confirmed Breakouts and Donchian modes filter out common traps in structural trading.
Multi–Asset Adaptability: Optimized for scalping, intraday, swing, and multi–day strategies across FX, equities, futures, commodities, and crypto.
Complementary Usage: Works as a stand–alone structure identifier or as a quantitative filter in larger algorithmic/trading frameworks.
⚙️ Ideal Users
Discretionary traders seeking an objective reference for structural bias.
Quantitative/systematic traders requiring on–chart statistical validation of structural regimes.
Technical analysts leveraging pivots, Donchian channels, and price action as part of broader frameworks.
Portfolio traders integrating structure into multi–factor models.
💡 Why This Tool?
Market Structure is not a static indicator — it is an adaptive framework. By merging classical pivot theory with Donchian–style momentum analysis, and reinforcing both with statistical backtesting and volume confirmation, it provides traders with a unique ability:
To see the structure,
To measure its reliability,
And to act with confidence on quantifiably validated signals.

Fuzzy SMA with DCTI Confirmation[FibonacciFlux]FibonacciFlux: Advanced Fuzzy Logic System with Donchian Trend Confirmation
Institutional-grade trend analysis combining adaptive Fuzzy Logic with Donchian Channel Trend Intensity for superior signal quality
Conceptual Framework & Research Foundation
FibonacciFlux represents a significant advancement in quantitative technical analysis, merging two powerful analytical methodologies: normalized fuzzy logic systems and Donchian Channel Trend Intensity (DCTI). This sophisticated indicator addresses a fundamental challenge in market analysis – the inherent imprecision of trend identification in dynamic, multi-dimensional market environments.
While traditional indicators often produce simplistic binary signals, markets exist in states of continuous, graduated transition. FibonacciFlux embraces this complexity through its implementation of fuzzy set theory, enhanced by DCTI's structural trend confirmation capabilities. The result is an indicator that provides nuanced, probabilistic trend assessment with institutional-grade signal quality.
Core Technological Components
1. Advanced Fuzzy Logic System with Percentile Normalization
At the foundation of FibonacciFlux lies a comprehensive fuzzy logic system that transforms conventional technical metrics into degrees of membership in linguistic variables:
// Fuzzy triangular membership function with robust error handling
fuzzy_triangle(val, left, center, right) =>
if na(val)
0.0
float denominator1 = math.max(1e-10, center - left)
float denominator2 = math.max(1e-10, right - center)
math.max(0.0, math.min(left == center ? val <= center ? 1.0 : 0.0 : (val - left) / denominator1,
center == right ? val >= center ? 1.0 : 0.0 : (right - val) / denominator2))
The system employs percentile-based normalization for SMA deviation – a critical innovation that enables self-calibration across different assets and market regimes:
// Percentile-based normalization for adaptive calibration
raw_diff = price_src - sma_val
diff_abs_percentile = ta.percentile_linear_interpolation(math.abs(raw_diff), normLookback, percRank) + 1e-10
normalized_diff_raw = raw_diff / diff_abs_percentile
normalized_diff = useClamping ? math.max(-clampValue, math.min(clampValue, normalized_diff_raw)) : normalized_diff_raw
This normalization approach represents a significant advancement over fixed-threshold systems, allowing the indicator to automatically adapt to varying volatility environments and maintain consistent signal quality across diverse market conditions.
2. Donchian Channel Trend Intensity (DCTI) Integration
FibonacciFlux significantly enhances fuzzy logic analysis through the integration of Donchian Channel Trend Intensity (DCTI) – a sophisticated measure of trend strength based on the relationship between short-term and long-term price extremes:
// DCTI calculation for structural trend confirmation
f_dcti(src, majorPer, minorPer, sigPer) =>
H = ta.highest(high, majorPer) // Major period high
L = ta.lowest(low, majorPer) // Major period low
h = ta.highest(high, minorPer) // Minor period high
l = ta.lowest(low, minorPer) // Minor period low
float pdiv = not na(L) ? l - L : 0 // Positive divergence (low vs major low)
float ndiv = not na(H) ? H - h : 0 // Negative divergence (major high vs high)
float divisor = pdiv + ndiv
dctiValue = divisor == 0 ? 0 : 100 * ((pdiv - ndiv) / divisor) // Normalized to -100 to +100 range
sigValue = ta.ema(dctiValue, sigPer)
DCTI provides a complementary structural perspective on market trends by quantifying the relationship between short-term and long-term price extremes. This creates a multi-dimensional analysis framework that combines adaptive deviation measurement (fuzzy SMA) with channel-based trend intensity confirmation (DCTI).
Multi-Dimensional Fuzzy Input Variables
FibonacciFlux processes four distinct technical dimensions through its fuzzy system:
Normalized SMA Deviation: Measures price displacement relative to historical volatility context
Rate of Change (ROC): Captures price momentum over configurable timeframes
Relative Strength Index (RSI): Evaluates cyclical overbought/oversold conditions
Donchian Channel Trend Intensity (DCTI): Provides structural trend confirmation through channel analysis
Each dimension is processed through comprehensive fuzzy sets that transform crisp numerical values into linguistic variables:
// Normalized SMA Deviation - Self-calibrating to volatility regimes
ndiff_LP := fuzzy_triangle(normalized_diff, norm_scale * 0.3, norm_scale * 0.7, norm_scale * 1.1)
ndiff_SP := fuzzy_triangle(normalized_diff, norm_scale * 0.05, norm_scale * 0.25, norm_scale * 0.5)
ndiff_NZ := fuzzy_triangle(normalized_diff, -norm_scale * 0.1, 0.0, norm_scale * 0.1)
ndiff_SN := fuzzy_triangle(normalized_diff, -norm_scale * 0.5, -norm_scale * 0.25, -norm_scale * 0.05)
ndiff_LN := fuzzy_triangle(normalized_diff, -norm_scale * 1.1, -norm_scale * 0.7, -norm_scale * 0.3)
// DCTI - Structural trend measurement
dcti_SP := fuzzy_triangle(dcti_val, 60.0, 85.0, 101.0) // Strong Positive Trend (> ~85)
dcti_WP := fuzzy_triangle(dcti_val, 20.0, 45.0, 70.0) // Weak Positive Trend (~30-60)
dcti_Z := fuzzy_triangle(dcti_val, -30.0, 0.0, 30.0) // Near Zero / Trendless (~+/- 20)
dcti_WN := fuzzy_triangle(dcti_val, -70.0, -45.0, -20.0) // Weak Negative Trend (~-30 - -60)
dcti_SN := fuzzy_triangle(dcti_val, -101.0, -85.0, -60.0) // Strong Negative Trend (< ~-85)
Advanced Fuzzy Rule System with DCTI Confirmation
The core intelligence of FibonacciFlux lies in its sophisticated fuzzy rule system – a structured knowledge representation that encodes expert understanding of market dynamics:
// Base Trend Rules with DCTI Confirmation
cond1 = math.min(ndiff_LP, roc_HP, rsi_M)
strength_SB := math.max(strength_SB, cond1 * (dcti_SP > 0.5 ? 1.2 : dcti_Z > 0.1 ? 0.5 : 1.0))
// DCTI Override Rules - Structural trend confirmation with momentum alignment
cond14 = math.min(ndiff_NZ, roc_HP, dcti_SP)
strength_SB := math.max(strength_SB, cond14 * 0.5)
The rule system implements 15 distinct fuzzy rules that evaluate various market conditions including:
Established Trends: Strong deviations with confirming momentum and DCTI alignment
Emerging Trends: Early deviation patterns with initial momentum and DCTI confirmation
Weakening Trends: Divergent signals between deviation, momentum, and DCTI
Reversal Conditions: Counter-trend signals with DCTI confirmation
Neutral Consolidations: Minimal deviation with low momentum and neutral DCTI
A key innovation is the weighted influence of DCTI on rule activation. When strong DCTI readings align with other indicators, rule strength is amplified (up to 1.2x). Conversely, when DCTI contradicts other indicators, rule impact is reduced (as low as 0.5x). This creates a dynamic, self-adjusting system that prioritizes high-conviction signals.
Defuzzification & Signal Generation
The final step transforms fuzzy outputs into a precise trend score through center-of-gravity defuzzification:
// Defuzzification with precise floating-point handling
denominator = strength_SB + strength_WB + strength_N + strength_WBe + strength_SBe
if denominator > 1e-10
fuzzyTrendScore := (strength_SB * STRONG_BULL + strength_WB * WEAK_BULL +
strength_N * NEUTRAL + strength_WBe * WEAK_BEAR +
strength_SBe * STRONG_BEAR) / denominator
The resulting FuzzyTrendScore ranges from -1.0 (Strong Bear) to +1.0 (Strong Bull), with critical threshold zones at ±0.3 (Weak trend) and ±0.7 (Strong trend). The histogram visualization employs intuitive color-coding for immediate trend assessment.
Strategic Applications for Institutional Trading
FibonacciFlux provides substantial advantages for sophisticated trading operations:
Multi-Timeframe Signal Confirmation: Institutional-grade signal validation across multiple technical dimensions
Trend Strength Quantification: Precise measurement of trend conviction with noise filtration
Early Trend Identification: Detection of emerging trends before traditional indicators through fuzzy pattern recognition
Adaptive Market Regime Analysis: Self-calibrating analysis across varying volatility environments
Algorithmic Strategy Integration: Well-defined numerical output suitable for systematic trading frameworks
Risk Management Enhancement: Superior signal fidelity for risk exposure optimization
Customization Parameters
FibonacciFlux offers extensive customization to align with specific trading mandates and market conditions:
Fuzzy SMA Settings: Configure baseline trend identification parameters including SMA, ROC, and RSI lengths
Normalization Settings: Fine-tune the self-calibration mechanism with adjustable lookback period, percentile rank, and optional clamping
DCTI Parameters: Optimize trend structure confirmation with adjustable major/minor periods and signal smoothing
Visualization Controls: Customize display transparency for optimal chart integration
These parameters enable precise calibration for different asset classes, timeframes, and market regimes while maintaining the core analytical framework.
Implementation Notes
For optimal implementation, consider the following guidance:
Higher timeframes (4H+) benefit from increased normalization lookback (800+) for stability
Volatile assets may require adjusted clamping values (2.5-4.0) for optimal signal sensitivity
DCTI parameters should be aligned with chart timeframe (higher timeframes require increased major/minor periods)
The indicator performs exceptionally well as a trend filter for systematic trading strategies
Acknowledgments
FibonacciFlux builds upon the pioneering work of Donovan Wall in Donchian Channel Trend Intensity analysis. The normalization approach draws inspiration from percentile-based statistical techniques in quantitative finance. This indicator is shared for educational and analytical purposes under Attribution-NonCommercial-ShareAlike 4.0 International (CC BY-NC-SA 4.0) license.
Past performance does not guarantee future results. All trading involves risk. This indicator should be used as one component of a comprehensive analysis framework.
Shout out @DonovanWall

20-34 Dual Dot Alerts OnlyPine Script that uses dual Donchian Channels (20-period and 34-period) and places tiny blue dots above candles when the highest price touches any upper Donchian Channel and below candles when the lowest price touches any lower Donchian Channel, without displaying the channels themselves, you can use the code.
### Explanation of the Code:
1. **Indicator Declaration**: The script is named "Dual Donchian Channels Dots Only" and overlays on the price chart.
2. **Input for Lengths**: Users can set lengths for two Donchian Channels (20 and 34 periods).
3. **Calculating Bands**: The upper and lower bands are calculated using `ta.highest` and `ta.lowest` functions over the specified periods.
4. **Touch Conditions**:
- `upperTouch`: Checks if the highest price of the current candle touches either of the upper bands.
- `lowerTouch`: Checks if the lowest price of the current candle touches either of the lower bands.
5. **Plotting Dots**:
- A tiny blue dot is plotted above bars where `upperTouch` is true.
- A tiny blue dot is plotted below bars where `lowerTouch` is true.
### How to Use:
1. Copy this script into TradingView’s Pine Script editor.
2. Save it and add it to your chart.
3. You will see tiny blue dots appear above or below candles based on whether they touch any of the upper or lower Donchian Bands.
This setup provides a clear visual indication of price interactions with both Donchian Channels while keeping the chart uncluttered by hiding the channel lines.
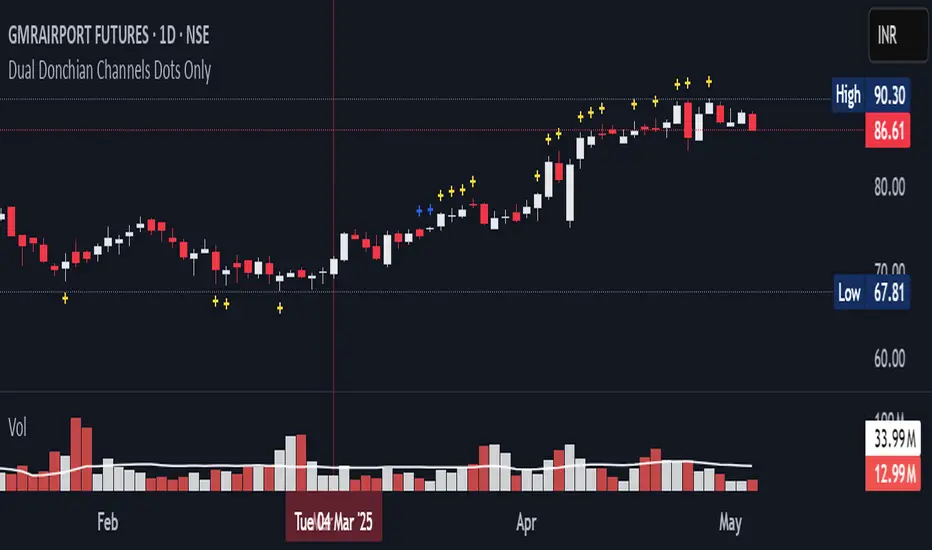
taLibrary "ta"
█ OVERVIEW
This library holds technical analysis functions calculating values for which no Pine built-in exists.
Look first. Then leap.
█ FUNCTIONS
cagr(entryTime, entryPrice, exitTime, exitPrice)
It calculates the "Compound Annual Growth Rate" between two points in time. The CAGR is a notional, annualized growth rate that assumes all profits are reinvested. It only takes into account the prices of the two end points — not drawdowns, so it does not calculate risk. It can be used as a yardstick to compare the performance of two instruments. Because it annualizes values, the function requires a minimum of one day between the two end points (annualizing returns over smaller periods of times doesn't produce very meaningful figures).
Parameters:
entryTime : The starting timestamp.
entryPrice : The starting point's price.
exitTime : The ending timestamp.
exitPrice : The ending point's price.
Returns: CAGR in % (50 is 50%). Returns `na` if there is not >=1D between `entryTime` and `exitTime`, or until the two time points have not been reached by the script.
█ v2, Mar. 8, 2022
Added functions `allTimeHigh()` and `allTimeLow()` to find the highest or lowest value of a source from the first historical bar to the current bar. These functions will not look ahead; they will only return new highs/lows on the bar where they occur.
allTimeHigh(src)
Tracks the highest value of `src` from the first historical bar to the current bar.
Parameters:
src : (series int/float) Series to track. Optional. The default is `high`.
Returns: (float) The highest value tracked.
allTimeLow(src)
Tracks the lowest value of `src` from the first historical bar to the current bar.
Parameters:
src : (series int/float) Series to track. Optional. The default is `low`.
Returns: (float) The lowest value tracked.
█ v3, Sept. 27, 2022
This version includes the following new functions:
aroon(length)
Calculates the values of the Aroon indicator.
Parameters:
length (simple int) : (simple int) Number of bars (length).
Returns: ( [float, float ]) A tuple of the Aroon-Up and Aroon-Down values.
coppock(source, longLength, shortLength, smoothLength)
Calculates the value of the Coppock Curve indicator.
Parameters:
source (float) : (series int/float) Series of values to process.
longLength (simple int) : (simple int) Number of bars for the fast ROC value (length).
shortLength (simple int) : (simple int) Number of bars for the slow ROC value (length).
smoothLength (simple int) : (simple int) Number of bars for the weigted moving average value (length).
Returns: (float) The oscillator value.
dema(source, length)
Calculates the value of the Double Exponential Moving Average (DEMA).
Parameters:
source (float) : (series int/float) Series of values to process.
length (simple int) : (simple int) Length for the smoothing parameter calculation.
Returns: (float) The double exponentially weighted moving average of the `source`.
dema2(src, length)
An alternate Double Exponential Moving Average (Dema) function to `dema()`, which allows a "series float" length argument.
Parameters:
src : (series int/float) Series of values to process.
length : (series int/float) Length for the smoothing parameter calculation.
Returns: (float) The double exponentially weighted moving average of the `src`.
dm(length)
Calculates the value of the "Demarker" indicator.
Parameters:
length (simple int) : (simple int) Number of bars (length).
Returns: (float) The oscillator value.
donchian(length)
Calculates the values of a Donchian Channel using `high` and `low` over a given `length`.
Parameters:
length (int) : (series int) Number of bars (length).
Returns: ( [float, float, float ]) A tuple containing the channel high, low, and median, respectively.
ema2(src, length)
An alternate ema function to the `ta.ema()` built-in, which allows a "series float" length argument.
Parameters:
src : (series int/float) Series of values to process.
length : (series int/float) Number of bars (length).
Returns: (float) The exponentially weighted moving average of the `src`.
eom(length, div)
Calculates the value of the Ease of Movement indicator.
Parameters:
length (simple int) : (simple int) Number of bars (length).
div (simple int) : (simple int) Divisor used for normalzing values. Optional. The default is 10000.
Returns: (float) The oscillator value.
frama(source, length)
The Fractal Adaptive Moving Average (FRAMA), developed by John Ehlers, is an adaptive moving average that dynamically adjusts its lookback period based on fractal geometry.
Parameters:
source (float) : (series int/float) Series of values to process.
length (int) : (series int) Number of bars (length).
Returns: (float) The fractal adaptive moving average of the `source`.
ft(source, length)
Calculates the value of the Fisher Transform indicator.
Parameters:
source (float) : (series int/float) Series of values to process.
length (simple int) : (simple int) Number of bars (length).
Returns: (float) The oscillator value.
ht(source)
Calculates the value of the Hilbert Transform indicator.
Parameters:
source (float) : (series int/float) Series of values to process.
Returns: (float) The oscillator value.
ichimoku(conLength, baseLength, senkouLength)
Calculates values of the Ichimoku Cloud indicator, including tenkan, kijun, senkouSpan1, senkouSpan2, and chikou. NOTE: offsets forward or backward can be done using the `offset` argument in `plot()`.
Parameters:
conLength (int) : (series int) Length for the Conversion Line (Tenkan). The default is 9 periods, which returns the mid-point of the 9 period Donchian Channel.
baseLength (int) : (series int) Length for the Base Line (Kijun-sen). The default is 26 periods, which returns the mid-point of the 26 period Donchian Channel.
senkouLength (int) : (series int) Length for the Senkou Span 2 (Leading Span B). The default is 52 periods, which returns the mid-point of the 52 period Donchian Channel.
Returns: ( [float, float, float, float, float ]) A tuple of the Tenkan, Kijun, Senkou Span 1, Senkou Span 2, and Chikou Span values. NOTE: by default, the senkouSpan1 and senkouSpan2 should be plotted 26 periods in the future, and the Chikou Span plotted 26 days in the past.
ift(source)
Calculates the value of the Inverse Fisher Transform indicator.
Parameters:
source (float) : (series int/float) Series of values to process.
Returns: (float) The oscillator value.
kvo(fastLen, slowLen, trigLen)
Calculates the values of the Klinger Volume Oscillator.
Parameters:
fastLen (simple int) : (simple int) Length for the fast moving average smoothing parameter calculation.
slowLen (simple int) : (simple int) Length for the slow moving average smoothing parameter calculation.
trigLen (simple int) : (simple int) Length for the trigger moving average smoothing parameter calculation.
Returns: ( [float, float ]) A tuple of the KVO value, and the trigger value.
pzo(length)
Calculates the value of the Price Zone Oscillator.
Parameters:
length (simple int) : (simple int) Length for the smoothing parameter calculation.
Returns: (float) The oscillator value.
rms(source, length)
Calculates the Root Mean Square of the `source` over the `length`.
Parameters:
source (float) : (series int/float) Series of values to process.
length (int) : (series int) Number of bars (length).
Returns: (float) The RMS value.
rwi(length)
Calculates the values of the Random Walk Index.
Parameters:
length (simple int) : (simple int) Lookback and ATR smoothing parameter length.
Returns: ( [float, float ]) A tuple of the `rwiHigh` and `rwiLow` values.
stc(source, fast, slow, cycle, d1, d2)
Calculates the value of the Schaff Trend Cycle indicator.
Parameters:
source (float) : (series int/float) Series of values to process.
fast (simple int) : (simple int) Length for the MACD fast smoothing parameter calculation.
slow (simple int) : (simple int) Length for the MACD slow smoothing parameter calculation.
cycle (simple int) : (simple int) Number of bars for the Stochastic values (length).
d1 (simple int) : (simple int) Length for the initial %D smoothing parameter calculation.
d2 (simple int) : (simple int) Length for the final %D smoothing parameter calculation.
Returns: (float) The oscillator value.
stochFull(periodK, smoothK, periodD)
Calculates the %K and %D values of the Full Stochastic indicator.
Parameters:
periodK (simple int) : (simple int) Number of bars for Stochastic calculation. (length).
smoothK (simple int) : (simple int) Number of bars for smoothing of the %K value (length).
periodD (simple int) : (simple int) Number of bars for smoothing of the %D value (length).
Returns: ( [float, float ]) A tuple of the slow %K and the %D moving average values.
stochRsi(lengthRsi, periodK, smoothK, periodD, source)
Calculates the %K and %D values of the Stochastic RSI indicator.
Parameters:
lengthRsi (simple int) : (simple int) Length for the RSI smoothing parameter calculation.
periodK (simple int) : (simple int) Number of bars for Stochastic calculation. (length).
smoothK (simple int) : (simple int) Number of bars for smoothing of the %K value (length).
periodD (simple int) : (simple int) Number of bars for smoothing of the %D value (length).
source (float) : (series int/float) Series of values to process. Optional. The default is `close`.
Returns: ( [float, float ]) A tuple of the slow %K and the %D moving average values.
supertrend(factor, atrLength, wicks)
Calculates the values of the SuperTrend indicator with the ability to take candle wicks into account, rather than only the closing price.
Parameters:
factor (float) : (series int/float) Multiplier for the ATR value.
atrLength (simple int) : (simple int) Length for the ATR smoothing parameter calculation.
wicks (simple bool) : (simple bool) Condition to determine whether to take candle wicks into account when reversing trend, or to use the close price. Optional. Default is false.
Returns: ( [float, int ]) A tuple of the superTrend value and trend direction.
szo(source, length)
Calculates the value of the Sentiment Zone Oscillator.
Parameters:
source (float) : (series int/float) Series of values to process.
length (simple int) : (simple int) Length for the smoothing parameter calculation.
Returns: (float) The oscillator value.
t3(source, length, vf)
Calculates the value of the Tilson Moving Average (T3).
Parameters:
source (float) : (series int/float) Series of values to process.
length (simple int) : (simple int) Length for the smoothing parameter calculation.
vf (simple float) : (simple float) Volume factor. Affects the responsiveness.
Returns: (float) The Tilson moving average of the `source`.
t3Alt(source, length, vf)
An alternate Tilson Moving Average (T3) function to `t3()`, which allows a "series float" `length` argument.
Parameters:
source (float) : (series int/float) Series of values to process.
length (float) : (series int/float) Length for the smoothing parameter calculation.
vf (simple float) : (simple float) Volume factor. Affects the responsiveness.
Returns: (float) The Tilson moving average of the `source`.
tema(source, length)
Calculates the value of the Triple Exponential Moving Average (TEMA).
Parameters:
source (float) : (series int/float) Series of values to process.
length (simple int) : (simple int) Length for the smoothing parameter calculation.
Returns: (float) The triple exponentially weighted moving average of the `source`.
tema2(source, length)
An alternate Triple Exponential Moving Average (TEMA) function to `tema()`, which allows a "series float" `length` argument.
Parameters:
source (float) : (series int/float) Series of values to process.
length (float) : (series int/float) Length for the smoothing parameter calculation.
Returns: (float) The triple exponentially weighted moving average of the `source`.
trima(source, length)
Calculates the value of the Triangular Moving Average (TRIMA).
Parameters:
source (float) : (series int/float) Series of values to process.
length (int) : (series int) Number of bars (length).
Returns: (float) The triangular moving average of the `source`.
trima2(src, length)
An alternate Triangular Moving Average (TRIMA) function to `trima()`, which allows a "series int" length argument.
Parameters:
src : (series int/float) Series of values to process.
length : (series int) Number of bars (length).
Returns: (float) The triangular moving average of the `src`.
trix(source, length, signalLength, exponential)
Calculates the values of the TRIX indicator.
Parameters:
source (float) : (series int/float) Series of values to process.
length (simple int) : (simple int) Length for the smoothing parameter calculation.
signalLength (simple int) : (simple int) Length for smoothing the signal line.
exponential (simple bool) : (simple bool) Condition to determine whether exponential or simple smoothing is used. Optional. The default is `true` (exponential smoothing).
Returns: ( [float, float, float ]) A tuple of the TRIX value, the signal value, and the histogram.
uo(fastLen, midLen, slowLen)
Calculates the value of the Ultimate Oscillator.
Parameters:
fastLen (simple int) : (series int) Number of bars for the fast smoothing average (length).
midLen (simple int) : (series int) Number of bars for the middle smoothing average (length).
slowLen (simple int) : (series int) Number of bars for the slow smoothing average (length).
Returns: (float) The oscillator value.
vhf(source, length)
Calculates the value of the Vertical Horizontal Filter.
Parameters:
source (float) : (series int/float) Series of values to process.
length (simple int) : (simple int) Number of bars (length).
Returns: (float) The oscillator value.
vi(length)
Calculates the values of the Vortex Indicator.
Parameters:
length (simple int) : (simple int) Number of bars (length).
Returns: ( [float, float ]) A tuple of the viPlus and viMinus values.
vzo(length)
Calculates the value of the Volume Zone Oscillator.
Parameters:
length (simple int) : (simple int) Length for the smoothing parameter calculation.
Returns: (float) The oscillator value.
williamsFractal(period)
Detects Williams Fractals.
Parameters:
period (int) : (series int) Number of bars (length).
Returns: ( [bool, bool ]) A tuple of an up fractal and down fractal. Variables are true when detected.
wpo(length)
Calculates the value of the Wave Period Oscillator.
Parameters:
length (simple int) : (simple int) Length for the smoothing parameter calculation.
Returns: (float) The oscillator value.
█ v7, Nov. 2, 2023
This version includes the following new and updated functions:
atr2(length)
An alternate ATR function to the `ta.atr()` built-in, which allows a "series float" `length` argument.
Parameters:
length (float) : (series int/float) Length for the smoothing parameter calculation.
Returns: (float) The ATR value.
changePercent(newValue, oldValue)
Calculates the percentage difference between two distinct values.
Parameters:
newValue (float) : (series int/float) The current value.
oldValue (float) : (series int/float) The previous value.
Returns: (float) The percentage change from the `oldValue` to the `newValue`.
donchian(length)
Calculates the values of a Donchian Channel using `high` and `low` over a given `length`.
Parameters:
length (int) : (series int) Number of bars (length).
Returns: ( [float, float, float ]) A tuple containing the channel high, low, and median, respectively.
highestSince(cond, source)
Tracks the highest value of a series since the last occurrence of a condition.
Parameters:
cond (bool) : (series bool) A condition which, when `true`, resets the tracking of the highest `source`.
source (float) : (series int/float) Series of values to process. Optional. The default is `high`.
Returns: (float) The highest `source` value since the last time the `cond` was `true`.
lowestSince(cond, source)
Tracks the lowest value of a series since the last occurrence of a condition.
Parameters:
cond (bool) : (series bool) A condition which, when `true`, resets the tracking of the lowest `source`.
source (float) : (series int/float) Series of values to process. Optional. The default is `low`.
Returns: (float) The lowest `source` value since the last time the `cond` was `true`.
relativeVolume(length, anchorTimeframe, isCumulative, adjustRealtime)
Calculates the volume since the last change in the time value from the `anchorTimeframe`, the historical average volume using bars from past periods that have the same relative time offset as the current bar from the start of its period, and the ratio of these volumes. The volume values are cumulative by default, but can be adjusted to non-accumulated with the `isCumulative` parameter.
Parameters:
length (simple int) : (simple int) The number of periods to use for the historical average calculation.
anchorTimeframe (simple string) : (simple string) The anchor timeframe used in the calculation. Optional. Default is "D".
isCumulative (simple bool) : (simple bool) If `true`, the volume values will be accumulated since the start of the last `anchorTimeframe`. If `false`, values will be used without accumulation. Optional. The default is `true`.
adjustRealtime (simple bool) : (simple bool) If `true`, estimates the cumulative value on unclosed bars based on the data since the last `anchor` condition. Optional. The default is `false`.
Returns: ( [float, float, float ]) A tuple of three float values. The first element is the current volume. The second is the average of volumes at equivalent time offsets from past anchors over the specified number of periods. The third is the ratio of the current volume to the historical average volume.
rma2(source, length)
An alternate RMA function to the `ta.rma()` built-in, which allows a "series float" `length` argument.
Parameters:
source (float) : (series int/float) Series of values to process.
length (float) : (series int/float) Length for the smoothing parameter calculation.
Returns: (float) The rolling moving average of the `source`.
supertrend2(factor, atrLength, wicks)
An alternate SuperTrend function to `supertrend()`, which allows a "series float" `atrLength` argument.
Parameters:
factor (float) : (series int/float) Multiplier for the ATR value.
atrLength (float) : (series int/float) Length for the ATR smoothing parameter calculation.
wicks (simple bool) : (simple bool) Condition to determine whether to take candle wicks into account when reversing trend, or to use the close price. Optional. Default is `false`.
Returns: ( [float, int ]) A tuple of the superTrend value and trend direction.
vStop(source, atrLength, atrFactor)
Calculates an ATR-based stop value that trails behind the `source`. Can serve as a possible stop-loss guide and trend identifier.
Parameters:
source (float) : (series int/float) Series of values that the stop trails behind.
atrLength (simple int) : (simple int) Length for the ATR smoothing parameter calculation.
atrFactor (float) : (series int/float) The multiplier of the ATR value. Affects the maximum distance between the stop and the `source` value. A value of 1 means the maximum distance is 100% of the ATR value. Optional. The default is 1.
Returns: ( [float, bool ]) A tuple of the volatility stop value and the trend direction as a "bool".
vStop2(source, atrLength, atrFactor)
An alternate Volatility Stop function to `vStop()`, which allows a "series float" `atrLength` argument.
Parameters:
source (float) : (series int/float) Series of values that the stop trails behind.
atrLength (float) : (series int/float) Length for the ATR smoothing parameter calculation.
atrFactor (float) : (series int/float) The multiplier of the ATR value. Affects the maximum distance between the stop and the `source` value. A value of 1 means the maximum distance is 100% of the ATR value. Optional. The default is 1.
Returns: ( [float, bool ]) A tuple of the volatility stop value and the trend direction as a "bool".
Removed Functions:
allTimeHigh(src)
Tracks the highest value of `src` from the first historical bar to the current bar.
allTimeLow(src)
Tracks the lowest value of `src` from the first historical bar to the current bar.
trima2(src, length)
An alternate Triangular Moving Average (TRIMA) function to `trima()`, which allows a
"series int" length argument.

True Range Trend StrengthThis script is designed to analyze trend strength using True Range calculations alongside Donchian Channels and smoothed moving averages. It provides a dynamic way to interpret market momentum, trend reversals, and anticipate potential entry points for trades.
Key Functionalities:
Trend Strength Oscillator:
Calculates trend strength based on the difference between long and short momentum derived from ATR (Average True Range) adjusted stop levels.
Smooths the trend strength using a simple moving average for better readability.
Donchian Channels on Trend Strength Oscillator:
Plots upper and lower Donchian Channels on the smoothed trend strength oscillator.
Traders can use these levels to anticipate breakout points and determine the strength of a trend.
Zero-Cross Shading:
Highlights bullish and bearish zones with shaded backgrounds:
Green for bullish zones where smoothed trend strength is above zero.
Red for bearish zones where smoothed trend strength is below zero.
Moving Averages for Oscillator:
Overlays fast and slow moving averages on the oscillator to provide crossover signals:
Fast MA Cross Above Slow MA: Indicates bullish momentum.
Fast MA Cross Below Slow MA: Indicates bearish momentum.
Alerts:
Alerts are available for MA crossovers, allowing traders to receive timely notifications about potential trend reversals or continuation signals.
Anticipating Entries with Donchian Channels:
The integration of Donchian Channels offers an edge in anticipating excellent trade entries.
Traders can use the oscillator's position relative to the channels to gauge oversold/overbought conditions or potential breakouts.
Use Case:
This script is particularly useful for traders looking to:
Identify the strength and direction of market trends.
Time entries and exits based on dynamic Donchian Channel levels and trend strength analysis.
Incorporate moving averages and visual cues for better decision-making.

[codapro] PressureBox Breakout Engine Full Breakdown PressureBox Breakout Engine is a revamped and expanded version of a prior post. This release includes a more educational breakdown and deeper configuration guidance, in response to user requests for clarity on how the system works and how to use it effectively.
This tool is a compression-detection and breakout-anticipation engine that blends Donchian channel logic, ATR filtering, and a proprietary “pressure” oscillator derived from volume-weighted momentum. It visually highlights real-time “compression zones” with dynamic shaded boxes and flags potential breakouts using configurable BUY/SELL markers.
It’s designed to help traders identify and analyze different market setups — including potential trend continuations, volatility breakouts, and range fade conditions — by surfacing key compression and pressure states visually on the chart.
Key Features
*Dynamic Compression Boxes: drawn when Donchian range < smoothed ATR threshold
*Breakout Flags: BUY/SELL alerts when price breaks outside compression range
*Custom Volume Pressure Score: MFI + CMF hybrid from -1 to +1
*Candle Overlap Filter: optional % overlap indicator for noise detection
*Adaptive Box Shading: transparency adjusts to pressure strength
*Clean Re-Anchoring Logic: boxes reset only when compression ends
*Full User Control: configure inputs for box length, blend logic, signal rules
How It Works
Compression Box Logic
A box is drawn when the Donchian range (e.g. high - low over N bars) falls below a moving ATR threshold.
The box dynamically extends and adjusts height/width until a breakout or timeout occurs.
Users can toggle whether Donchian uses highs/lows or closes and whether the box shows a midline.
Breakout Signal Logic
BUY signal: Close breaks above box high, with optional compression condition on the prior bar.
SELL signal: Close breaks below box low.
Signals use ATR-based offsets for clean separation on the chart.
Pressure Score Logic
Pressure is a weighted blend between:
MFI (Money Flow Index) — momentum-based
CMF (Chaikin Money Flow) — flow-based
The result is a smoothed -1 to +1 score that represents volume pressure.
This is used both for:
Box transparency (strong pressure = darker shading)
Optional overlay plot
Overlap Mode
Calculates smoothed % of how much recent candles overlap.
Useful for filtering non-directional chop and low-quality breakouts.
Can be toggled on/off as a separate overlay line.
⚙️ Default Optimized Settings
Setting Value
Donchian Length 8
ATR Length 13
ATR Multiplier 3.1
ATR SMA Length 21
Max Extend Bars 55
MFI Length 25
CMF Length 55
Blend Weight (MFI:CMF) 0.5
These are optimized for detecting tight consolidations and explosive breakout potential, especially on intraday 5m–15m charts across futures, forex, and crypto.
How to Use It
Watch for the compression box to form — this marks a squeeze zone.
Breakouts with BUY/SELL flags are most reliable after long compressions.
Adjust the Blend Weight to prioritize MFI (momentum) or CMF (flow).
Use Overlap % to filter sideways markets or low-quality signals.
Combine with support/resistance, VPA tools, or trend filters for layered setups.
Disclaimer
This tool was created using the CodaPro Pine Script architecture engine — designed to produce robust trading overlays, educational visuals, and automation-ready alerts.
It is provided strictly for educational purposes and does not constitute financial advice. Always backtest and demo before applying to real capital.

RSI Apex: Breakout & DivergenceRSI Apex: Breakout & Divergence System
RSI Apex:突破与背离交易系统
🇬🇧 English Description
RSI Apex is a comprehensive trading system designed to capture both Trend Breakouts and Market Reversals. Unlike traditional RSI indicators that rely solely on fixed levels (70/30), RSI Apex integrates Donchian Channels, Volatility Squeeze, and the Libertus Divergence Algorithm to provide high-probability signals.
🚀 Key Features
Trend Push System (Donchian Breakout):
Detects when RSI momentum is strong enough to push the upper/lower Donchian Channel bands.
Signal: Displays ▲ (Bull) or ▼ (Bear) at levels 20/80.
Libertus Divergence (No-Lag):
Uses a real-time pivot tracking algorithm to identify divergences between Price and RSI without the lag of traditional pivot points.
Signal: Displays "Div" labels at levels 30/70.
Smart Coloring (Extreme Highlight):
Green/Red: Normal Trend.
White (Extreme): When RSI breaches 70 (Overbought) or 30 (Oversold), the line turns bright White. This highlights the most volatile zones where reversals or strong continuations occur.
Volatility Squeeze Filter:
Monitors market volatility. When the Donchian Channel compresses significantly (below historical average), the background turns Purple.
Meaning: "Calm before the storm"—expect a major move soon.
🛠 How to Use
Trend Following: Enter when you see Green/Red RSI lines accompanied by ▲ / ▼ signals. This indicates a "Trend Push."
Reversal Trading: Look for "Div" signals when the RSI line is White (Extreme). This suggests momentum is fading despite price action.
Exit/Take Profit: Watch for the "Weak" label, which appears when RSI falls back into the neutral zone.
Dashboard: Monitor real-time RSI Value, Market State (Bullish/Bearish/Extreme), and Volatility (Squeeze/Expanding) in the bottom-right table.
🇨🇳 中文简介
RSI Apex 是一套旨在捕捉趋势爆发 (Breakout) 和 市场反转 (Reversal) 的综合交易系统。与仅依赖固定 70/30 线的传统 RSI 不同,本指标融合了 唐奇安通道 (Donchian Channels)、波动率挤压 (Squeeze) 以及 Libertus 无滞后背离算法,以提供高胜率的交易信号。
🚀 核心功能
强趋势推动系统 (唐奇安突破):
检测 RSI 动能是否强劲到足以推动唐奇安通道的上轨或下轨扩张。
信号: 在 20/80 轴位置显示 ▲ (多头推动) 或 ▼ (空头推动)。
Libertus 智能背离 (无滞后):
采用实时 Pivot 追踪算法,精准识别价格与 RSI 之间的背离,解决了传统背离指标的滞后问题。
信号: 在 30/70 轴位置显示 "Div" 标签。
智能变色 (极端行情高亮):
绿色/红色: 正常趋势状态。
白色 (White): 极端区域。当 RSI 突破 70 (超买) 或跌破 30 (超卖) 时,线条会强制变为醒目的亮白色,提示此处为变盘/背离高发区。
波动率挤压 (Squeeze) 过滤器:
实时监控市场波动率。当通道宽度显著收窄(低于历史平均水平)时,背景会填充为半透明紫色。
含义: “暴风雨前的宁静”——预示着大行情即将爆发,此时应空仓等待突破方向。
🛠 使用策略
顺势交易 (Trend): 当 RSI 呈现 绿色/红色 并伴随 ▲ / ▼ 信号时进场。这代表动能极强,处于主升/主跌浪。
左侧反转 (Reversal): 重点关注 RSI 线条变为 白色 (Extreme) 时出现的 "Div" 背离信号。这通常意味着价格虽创新高,但动能已耗尽。
止盈/离场: 留意 "Weak" (衰竭) 标签,它出现在 RSI 掉回中间震荡区时。
仪表盘: 右下角面板实时显示 RSI 数值、市场状态 (极值/背离/趋势) 以及波动率状态 (挤压/扩张)。

VB Sigma Smart Momentum IndicatorVB Sigma Smart Momentum Indicator (VBSSMI)
The VBSSMI provides a consolidated decision-support framework that surfaces market participation, trend integrity, and liquidity conditions in a single visual environment. The tool integrates four analytical modules: MCDX Flow Mapping, Donchian Regime Layers, Banker Flow Modeling, and Chop Zone Trend Classification. Together, these components convert raw price movement into an actionable interpretation of who is in control, whether momentum is durable, and what phase the instrument is currently cycling through.
How to Use the Indicator (Practical Workflow)
1. Start with Institutional / Banker Flow (Pink/Red/Yellow/Green Candles)
This is the primary signal layer. It tells you when high-capacity participants are increasing, reducing, or reversing risk.
Yellow Candle — Entry Bias
Indicates a potential institutional initiation when their trend metric crosses above their accumulation threshold.
Operational signal: instrument enters “monitor for entry” state.
Green Candle — Accumulation State
Fund-trend > bullbearline.
Operational signal: trend integrity improving; pullbacks are generally buyable.
White Candle — Distribution / Cooling
Fund-trend weakening but not broken.
Operational signal: tighten stops; momentum deteriorating.
Red Candle — Exit / Trend Failure
Fund-trend < bullbearline.
Operational signal: momentum regime invalidated; avoid long risk.
Blue Candle — Weak Rebound
A temporary uptick within broader weakness.
Operational signal: do not mistake this for a durable reversal.
2. Validate alignment with Flow Chips (Retail / Trader / Institutional)
These three flow columns (MCDX layers) answer: who is actually participating?
Retailer Flow (Locked Chips – Green)
High values imply retail conviction, often late-cycle.
Good for confirming trend strength, not timing entries.
Trader Zone Flow (Float Chips – Yellow)
When this spikes, volatility and tactical positioning increase.
Signal: strong short-term engagement, supports breakout/trend continuation.
Institutional Flow (Profitable Chips – Red/Pink)
This is the “true north” of momentum.
Rising values = institutions controlling price discovery.
Signal: long setups have statistical tailwind.
The operational guidance is straightforward:
Institutional Flow > Trader Flow > Retail Flow
is the healthiest configuration for sustainable upside momentum.
3. Confirm Breakout / Breakdown Conditions with Donchian Regime Columns
The vertical Donchian stack illustrates trend regime in a time-compressed format.
Bright Blue/Cyan
Structure expanding upward (breakout cluster).
Dark Purple/Red
Structure breaking downward (breakdown cluster).
Mixed Columns
Transitional or indecisive conditions.
Interpret it as a “momentum backdrop”:
If Donchian columns and Banker Flow candles disagree, avoid entries.
4. Consult the Chop Zone Strip Before Committing Capital
The Chop Zone uses EMA angle to determine whether the market is trending or congested.
Greens/Blues → Trend phase (favorable environment for continuation trades).
Yellows/Oranges/Reds → High noise probability; expect false signals.
Operationally:
Never enter breakout setups during yellow/orange/red chop.
5. Final Decision Framework (Checklist)
A long setup typically requires:
Green or Yellow Banker Flow Candle
Institutional Flow rising
Donchian columns in bullish regime colors
Chop Zone in a trend color (not red/yellow/orange)
A short setup is the exact inverse.
Recommended Use Cases
Momentum trading
Swing position building
Institutional-flow confirmation
Trend-filtering before deploying breakout systems
Screening for strong/weak symbols in multi-asset rotation strategies

FxAST Ichi ProSeries Enhanced Full Market Regime EngineFxAST Ichi ProSeries v1.x is a modernized Ichimoku engine that keeps the classic logic but adds a full market regime engine for any market and instrument.”
Multi-timeframe cloud overlay
Oracle long-term baseline
Trend regime classifier (Bull / Bear / Transition / Range)
Chikou & Cloud breakout signals
HTF + Oracle + Trend dashboard
Alert-ready structure for automation
No repainting: all HTF calls use lookahead_off.
1. Core Ichimoku Engine
Code sections:
Input group: Core Ichimoku
Function: ichiCalc()
Variables: tenkan, kijun, spanA, spanB, chikou
What it does
Calculates the classic Ichimoku components:
Tenkan (Conversion Line) – fast Donchian average (convLen)
Kijun (Base Line) – slower Donchian average (baseLen)
Senkou Span A (Span A / Lead1) – (Tenkan + Kijun)/2
Senkou Span B (Span B / Lead2) – Donchian over spanBLen
Chikou – current close shifted back in time (displace)
Everything else in the indicator builds on this engine.
How to use it (trading)
Tenkan vs Kijun = short-term vs medium-term balance.
Tenkan above Kijun = short-term bullish control; below = bearish control.
Span A / B defines the cloud, which represents equilibrium and support/resistance.
Price above cloud = bullish bias; price below cloud = bearish bias.
Graphic
2. Display & Cloud Styling
Code sections:
Input groups: Display Options, Cloud Styling, Lagging Span & Signals
Variables: showTenkan, showKijun, showChikou, showCloud, bullCloudColor, bearCloudColor, cloudLineWidth, laggingColor
Plots: plot(tenkan), plot(kijun), plot(chikou), p1, p2, fill(p1, p2, ...)
What it does
Lets you toggle individual components:
Show/hide Tenkan, Kijun, Chikou, and the cloud.
Customize cloud colors & opacity:
bullCloudColor when Span A > Span B
bearCloudColor when Span A < Span B
Adjust cloud line width for clarity.
How to use it
Turn off components you don’t use (e.g., hide Chikou if you only want cloud + Tenkan/Kijun).
For higher-timeframe or noisy charts, use thicker Kijun & cloud so structure is easier to see.
Graphic
Before
After
3. HTF Cloud Overlay (Multi-Timeframe)
Code sections:
Input group: HTF Cloud Overlay
Vars: showHTFCloud, htfTf, htfAlpha
Logic: request.security(..., ichiCalc(...)) → htfSpanA, htfSpanB
Plots: pHTF1, pHTF2, fill(pHTF1, pHTF2, ...)
What it does
Pulls higher-timeframe Ichimoku cloud (e.g., 1H, 4H, Daily) onto your current chart.
Uses the same Ichimoku settings but aggregates on htfTf.
Plots an extra, semi-transparent cloud ahead of price:
Greenish when HTF Span A > Span B
Reddish when HTF Span B > Span A
How to use it
Trade LTF (e.g., 5m/15m) only in alignment with HTF trend:
HTF cloud bullish + LTF Ichi bullish → look for longs
HTF cloud bearish + LTF Ichi bearish → look for shorts
Treat HTF cloud boundaries as major S/R zones.
Graphic
4. Oracle Module
Code sections:
Input group: Oracle Module
Vars: useOracle, oracleLen, oracleColor, oracleWidth, oracleSlopeLen
Logic: oracleLine = donchian(oracleLen); slope check vs oracleLine
Plot: plot(useOracle ? oracleLine : na, "Oracle", ...)
What it does
Creates a long-term Donchian baseline (default 208 bars).
Uses a simple slope check:
Current Oracle > Oracle oracleSlopeLen bars ago → Oracle Bull
Current Oracle < Oracle oracleSlopeLen bars ago → Oracle Bear
Slope state is also shown in the dashboard (“Bull / Bear / Flat”).
How to use it
Think of Oracle as your macro anchor :
Only take longs when Oracle is sloping up or flat.
Only take shorts when Oracle is sloping down or flat.
Works well combined with HTF cloud:
HTF cloud bullish + Oracle Bull = higher conviction long bias.
Ideal for Gold / Indices swing trades as a trend filter.
Graphic idea
5. Trend Regime Classifier
Code sections:
Input group: Trend Regime Logic
Vars: useTrendRegime, bgTrendOpacity, minTrendScore
Logic:
priceAboveCloud, priceBelowCloud, priceInsideCloud
Tenkan vs Kijun alignment
Cloud bullish/bearish
bullScore / bearScore (0–3)
regime + regimeLabel + regimeColor
Visuals: bgcolor(regimeColor) and optional barcolor() in priceColoring mode.
What it does
Scores the market in three dimensions :
Price vs Cloud
Tenkan vs Kijun
Cloud Direction (Span A vs Span B)
Each condition contributes +1 to either bullScore or bearScore .
Then:
Bull regime when:
bullScore >= minTrendScore and bullScore > bearScore
Price in cloud → “Range”
Everything else → “Transition”
These regimes are shown as:
Background colors:
Teal = Bull
Maroon = Bear
Orange = Range
Silver = Transition
Optional candle recoloring when priceColoring = true.
How to use it
Filters:
Only buy when regime = Bull or Transition and Oracle/HTF agree.
Only sell when regime = Bear or Transition and Oracle/HTF agree.
No trade zone:
When regime = Range (price inside cloud), avoid new entries; wait for break.
Aggressiveness:
Adjust minTrendScore to be stricter (3) or looser (1).
Graphic
6. Signals: Chikou & Cloud Breakout
Code sections :
Logic:
chikouBuySignal = ta.crossover(chikou, close)
chikouSellSignal = ta.crossunder(chikou, close)
cloudBreakUp = priceInsideCloud and priceAboveCloud
cloudBreakDown = priceInsideCloud and priceBelowCloud
What it does
1. Two key signal groups:
Chikou Cross Signals
Buy when Chikou crosses up through price.
Sell when Chikou crosses down through price.
Classic Ichi confirmation idea: Chikou breaking free of price cluster.
2. Cloud Breakout Signals
Long trigger: yesterday inside cloud → today price breaks above cloud.
Short trigger: yesterday inside cloud → today price breaks below cloud.
Captures “equilibrium → expansion” moves.
These are conditions only in this version (no chart shapes yet) but are fully wired for alerts. (Future Updates)
How to use it
Use Chikou signals as confirmation, not standalone entries:
Eg., Bull regime + Oracle Bull + cloud breakout + Chikou Buy.
Use Cloud Breakouts to catch the first impulsive leg after consolidation.
Graphic
7. Alerts (Automation Ready)
[
b]Code sections:
Input group: Alerts
Vars: useAlertTrend, useAlertChikou, useAlertCloudBO
Alert lines like: "FxAST Ichi Bull Trend", "FxAST Ichi Bull Trend", "FxAST Ichi Cloud Break Up"
What it does
Provides ready-made alert hooks for:
Trend regime (Bull / Bear)
Chikou cross buy/sell
Cloud breakout up/down
Each type can be globally toggled on/off via the inputs (helpful if a user only wants one kind).
How to use it
In TradingView: set alerts using “Any alert() function call” on this indicator.
Then filter which ones fire by:
Turning specific alert toggles on/off in input panel, or
Filtering text in your external bot / webhook side.
Example simple workflow ---> Indicator ---> TV Alert ---> Webhook ---> Bot/Broker
8. FxAST Dashboard
Code sections:
Input group: Dashboard
Vars: showDashboard, dashPos, dash, dashInit
Helper: getDashPos() → position.*
Table cells (updated on barstate.islast):
Row 0: Regime + label
Row 1: Oracle status (Bull / Bear / Flat / Off)
Row 2: HTF Cloud (On + TF / Off)
Row 3: Scores (BullScore / BearScore)
What it does
Displays a compact panel with the state of the whole system :
Current Trend Regime (Bull / Bear / Transition / Range)
Oracle slope state
Whether HTF Cloud is active + which timeframe
Raw Bull / Bear scores (0–3 each)
Position can be set: Top Right, Top Left, Bottom Right, Bottom Left.
How to use it
Treat it like a pilot instrument cluster :
Quick glance: “Are my trend, oracle and HTF all aligned?”
Great for streaming / screenshots: everything important is visible in one place without reading the code.
Graphic (lower right of chart )

Turtle Trading System IndicatorKey Features & Components
Donchian Channels
The core of the indicator is the Donchian Channel, represented by the upper and lower blue bands.
Upper Channel: The highest price over a user-defined period.
Lower Channel: The lowest price over the same period.
Middle Line: The midpoint between the upper and lower channels.
These channels are used to identify potential breakouts, which form the basis for trade entries.
Trading Signals
The script automatically generates clear, non-repainting signals for potential trades:
Long Entry (Green ▲): A green upward-facing triangle appears below the candle when the closing price breaks above the upper Donchian channel, signaling the start of a potential uptrend.
Short Entry (Red ▼): A red downward-facing triangle appears above the candle when the closing price breaks below the lower Donchian channel, signaling the start of a potential downtrend.
Long Exit (Green X): A green cross appears above the candle when the price crosses below the middle line, suggesting the uptrend is weakening.
Short Exit (Orange X): An orange cross appears below the candle when the price crosses above the middle line, suggesting the downtrend is losing momentum.
Integrated Risk Management
A crucial element of the Turtle strategy is disciplined risk management, which is built into this indicator.
Volatility-Based Position Sizing
You can enable position sizing that adapts to market volatility using the Average True Range (ATR). When an entry signal occurs, a label appears showing a calculated position size unit. The formula aims to normalize risk, meaning you would trade smaller sizes in volatile markets and larger sizes in calmer markets. The formula used is:
Volatility Unit=
100
Risk %
×
4×ATR
Close Price
Dynamic Stop Loss
Upon a long or short entry, a stop-loss level is plotted on the chart as red circles. This level is calculated based on the ATR, automatically adjusting to the market's current volatility to provide a data-driven exit point for managing losses. It is calculated as:
Long Stop: Close Price - 1.8 * ATR
Short Stop: Close Price + 1.8 * ATR
On-Chart Information Panel
A convenient table is displayed in the bottom-right corner of the chart, showing the current ATR value and the calculated Position Size unit for quick and easy reference.
Customizable Settings
You can tailor the indicator to your specific strategy and risk tolerance:
Donchian Channel Period: Sets the lookback period for the channels. The default is 20. Shorter periods will be more sensitive and generate more signals.
ATR Period: Sets the lookback period for the Average True Range calculation, affecting both position size and stop-loss levels. The default is 14.
Risk Percentage: The percentage of equity you wish to risk per trade. This directly influences the position size calculation.
Use Volatility Position Sizing: A simple checkbox to turn the ATR-based position sizing on or off.
