Gold Breakout Strategy - RR 4Strategy Name: Gold Breakout Strategy - RR 4
🧠 Main Objective
This strategy aims to capitalize on breakouts from the Donchian Channel on Gold (XAU/USD) by filtering trades with:
Volume confirmation,
A custom momentum indicator (LWTI - Linear Weighted Trend Index),
And a specific trading session (8 PM to 8 AM Quebec time — GMT-5).
It takes only one trade per day, either a buy or a sell, using a fixed stop-loss at the wick of the breakout candle and a 4:1 reward-to-risk (RR) ratio.
📊 Indicators Used
Donchian Channel
Length: 96
Detects breakouts of recent highs or lows.
Volume
Simple Moving Average (SMA) over 30 bars.
A breakout is only valid if the current volume is above the SMA.
LWTI (Linear Weighted Trend Index)
Measures momentum using price differences over 25 bars, smoothed over 5.
Used to confirm trend direction:
Buy when LWTI > its smoothed version (uptrend).
Sell when LWTI < its smoothed version (downtrend).
⏰ Time Filter
The strategy only allows entries between 8 PM and 8 AM (GMT-5 / Quebec time).
A timestamp-based filter ensures the system recognizes the correct trading session even across midnight.
📌 Entry Conditions
🟢 Buy (Long)
Price breaks above the previous Donchian Channel high.
The current channel high is higher than the previous one.
Volume is above its moving average.
LWTI confirms an uptrend.
The time is within the trading session (20:00 to 08:00).
No trade has been taken yet today.
🔴 Sell (Short)
Price breaks below the previous Donchian Channel low.
The current channel low is lower than the previous one.
Volume is above its moving average.
LWTI confirms a downtrend.
The time is within the trading session.
No trade has been taken yet today.
💸 Trade Management
Stop-Loss (SL):
For long entries: placed below the wick low of the breakout candle.
For short entries: placed above the wick high of the breakout candle.
Take-Profit (TP):
Set at a fixed 4:1 reward-to-risk ratio.
Calculated as 4x the distance between the entry price and stop-loss.
No trailing stop, no break-even, no scaling in/out.
🎨 Visuals
Green triangle appears below the candle on a buy signal.
Red triangle appears above the candle on a sell signal.
Donchian Channel lines are plotted on the chart.
The strategy is designed for the 5-minute timeframe.
🔄 One Trade Per Day Rule
Once a trade is taken (buy or sell), no more trades will be executed for the rest of the day. This prevents overtrading and limits exposure.
ابحث في النصوص البرمجية عن "donchian"

ian_Trado v15 Trend Entry Filter# 📈 ian_Trado v15 Trend Entry Filter (Pine Script v6)
The **ian_Trado v15** is a multi-factor **trend confirmation filter** for NASDAQ (NAS100), Dow Jones (DJ30), Gold (XAU), DAX, and USDJPY.
It combines **EMA structure**, **Donchian channel breakout**, **MACD histogram momentum**, **Volume confirmation**, and a **Range Compression Filter** to avoid entering during choppy or sideways markets.
✅ Designed for **bot deployment** (e.g., grid bots, long/short breakout bots) or **manual trading**.
---
## 🔍 How This Filter Works:
1. **EMA Trend Confirmation**
- Long Trend: EMA(1) > EMA(5) > EMA(60)
- Short Trend: EMA(1) < EMA(5) < EMA(60)
2. **Donchian Channel Width Expansion**
- Only allows trades when the **breakout width** exceeds a minimum threshold.
3. **MACD Histogram Slope Filter (Optional)**
- Confirms momentum building in the direction of the trend.
- Strict Mode: MACD histogram must consistently rise or fall over 3 bars.
4. **Volume Filter (Optional)**
- Ensures volume supports the move (filters out weak conditions).
5. **Range Compression Filter (Optional)**
- Avoids entries during sideways chop.
6. **Cooldown Control**
- Limits overtrading by requiring spacing between entries.
7. **Exit Conditions**
- Gray dot appears when trending conditions are no longer valid.
---
## ⚙️ Settings Explained:
| Setting | Description |
|:--------|:------------|
| **Cooldown Bars** | Minimum bars between consecutive entries |
| **Profit Target (%)** | Visual profit marker for exit tracking |
| **Donchian Channel Length** | Lookback period for detecting breakout width |
| **Minimum Donchian Width** | Threshold to confirm meaningful breakouts |
| **Volume Lookback Period** | Average volume validation window |
| **Box Range (Range Compression)** | Max allowed price range over lookback bars |
| **Range Compression Bars** | Number of bars to check for range compression |
| **Strict MACD Filter** | Use stricter MACD slope checks |
---
## 📊 Recommended Settings by Instrument (1H Chart):
| Asset | Min Donchian Width | Range Compression | Profit Target |
|:------|:-------------------|:------------------|:--------------|
| **NAS100** (Nasdaq) | 300–450 pts | 400 pts / 40 bars | 1.5% |
| **DJ30** (Dow Jones) | 400–600 pts | 500 pts / 40 bars | 1.0–1.5% |
| **XAU/USD** (Gold) | 10–15 pts | 8 pts / 30 bars | 0.8–1.2% |
| **DAX40** (Germany) | 200–300 pts | 250 pts / 40 bars | 1.0% |
| **USD/JPY** (Forex) | 0.5–0.8 pts | 0.4 pts / 40 bars | 0.5–0.8% |
---
## 🔔 Alerts Available:
- Long Entry
- Short Entry
- Exit Zone
> **Note:** Volume filter may be disabled if volume is unreliable (e.g., some forex pairs).
---
## 📅 Version:
- **ian_Trado v15** — April 2025
- Built with **Pine Script v6** for maximum stability
- Clean toggling and plotting logic (no `na` errors)

Ensemble Alerts█ OVERVIEW
This indicator creates highly customizable alert conditions and messages by combining several technical conditions into groups , which users can specify directly from the "Settings/Inputs" tab. It offers a flexible framework for building and testing complex alert conditions without requiring code modifications for each adjustment.
█ CONCEPTS
Ensemble analysis
Ensemble analysis is a form of data analysis that combines several "weaker" models to produce a potentially more robust model. In a trading context, one of the most prevalent forms of ensemble analysis is the aggregation (grouping) of several indicators to derive market insights and reinforce trading decisions. With this analysis, traders typically inspect multiple indicators, signaling trade actions when specific conditions or groups of conditions align.
Simplifying ensemble creation
Combining indicators into one or more ensembles can be challenging, especially for users without programming knowledge. It usually involves writing custom scripts to aggregate the indicators and trigger trading alerts based on the confluence of specific conditions. Making such scripts customizable via inputs poses an additional challenge, as it often involves complicated input menus and conditional logic.
This indicator addresses these challenges by providing a simple, flexible input menu where users can easily define alert criteria by listing groups of conditions from various technical indicators in simple text boxes . With this script, you can create complex alert conditions intuitively from the "Settings/Inputs" tab without ever writing or modifying a single line of code. This framework makes advanced alert setups more accessible to non-coders. Additionally, it can help Pine programmers save time and effort when testing various condition combinations.
█ FEATURES
Configurable alert direction
The "Direction" dropdown at the top of the "Settings/Inputs" tab specifies the allowed direction for the alert conditions. There are four possible options:
• Up only : The indicator only evaluates upward conditions.
• Down only : The indicator only evaluates downward conditions.
• Up and down (default): The indicator evaluates upward and downward conditions, creating alert triggers for both.
• Alternating : The indicator prevents alert triggers for consecutive conditions in the same direction. An upward condition must be the first occurrence after a downward condition to trigger an alert, and vice versa for downward conditions.
Flexible condition groups
This script features six text inputs where users can define distinct condition groups (ensembles) for their alerts. An alert trigger occurs if all the conditions in at least one group occur.
Each input accepts a comma-separated list of numbers with optional spaces (e.g., "1, 4, 8"). Each listed number, from 1 to 35, corresponds to a specific individual condition. Below are the conditions that the numbers represent:
1 — RSI above/below threshold
2 — RSI below/above threshold
3 — Stoch above/below threshold
4 — Stoch below/above threshold
5 — Stoch K over/under D
6 — Stoch K under/over D
7 — AO above/below threshold
8 — AO below/above threshold
9 — AO rising/falling
10 — AO falling/rising
11 — Supertrend up/down
12 — Supertrend down/up
13 — Close above/below MA
14 — Close below/above MA
15 — Close above/below open
16 — Close below/above open
17 — Close increase/decrease
18 — Close decrease/increase
19 — Close near Donchian top/bottom (Close > (Mid + HH) / 2)
20 — Close near Donchian bottom/top (Close < (Mid + LL) / 2)
21 — New Donchian high/low
22 — New Donchian low/high
23 — Rising volume
24 — Falling volume
25 — Volume above average (Volume > SMA(Volume, 20))
26 — Volume below average (Volume < SMA(Volume, 20))
27 — High body to range ratio (Abs(Close - Open) / (High - Low) > 0.5)
28 — Low body to range ratio (Abs(Close - Open) / (High - Low) < 0.5)
29 — High relative volatility (ATR(7) > ATR(40))
30 — Low relative volatility (ATR(7) < ATR(40))
31 — External condition 1
32 — External condition 2
33 — External condition 3
34 — External condition 4
35 — External condition 5
These constituent conditions fall into three distinct categories:
• Directional pairs : The numbers 1-22 correspond to pairs of opposing upward and downward conditions. For example, if one of the inputs includes "1" in the comma-separated list, that group uses the "RSI above/below threshold" condition pair. In this case, the RSI must be above a high threshold for the group to trigger an upward alert, and the RSI must be below a defined low threshold to trigger a downward alert.
• Non-directional filters : The numbers 23-30 correspond to conditions that do not represent directional information. These conditions act as filters for both upward and downward alerts. Traders often use non-directional conditions to refine trending or mean reversion signals. For instance, if one of the input lists includes "30", that group uses the "Low relative volatility" condition. The group can trigger an upward or downward alert only if the 7-period Average True Range (ATR) is below the 40-period ATR.
• External conditions : The numbers 31-35 correspond to external conditions based on the plots from other indicators on the chart. To set these conditions, use the source inputs in the "External conditions" section near the bottom of the "Settings/Inputs" tab. The external value can represent an upward, downward, or non-directional condition based on the following logic:
▫ Any value above 0 represents an upward condition.
▫ Any value below 0 represents a downward condition.
▫ If the checkbox next to the source input is selected, the condition becomes non-directional . Any group that uses the condition can trigger upward or downward alerts only if the source value is not 0.
To learn more about using plotted values from other indicators, see this article in our Help Center and the Source input section of our Pine Script™ User Manual.
Group markers
Each comma-separated list represents a distinct group , where all the listed conditions must occur to trigger an alert. This script assigns preset markers (names) to each condition group to make the active ensembles easily identifiable in the generated alert messages and labels. The markers assigned to each group use the format "M", where "M" is short for "Marker" and "x" is the group number. The titles of the inputs at the top of the "Settings/Inputs" tab show these markers for convenience.
For upward conditions, the labels and alert messages show group markers with upward triangles (e.g., "M1▲"). For downward conditions, they show markers with downward triangles (e.g., "M1▼").
NOTE: By default, this script populates the "M1" field with a pre-configured list for a mean reversion group ("2,18,24,28"). The other fields are empty. If any "M*" input does not contain a value, the indicator ignores it in the alert calculations.
Custom alert messages
By default, the indicator's alert message text contains the activated markers and their direction as a comma-separated list. Users can override this message for upward or downward alerts with the two text fields at the bottom of the "Settings/Inputs" tab. When the fields are not empty , the alerts use that text instead of the default marker list.
NOTE: This script generates alert triggers, not the alerts themselves. To set up an alert based on this script's conditions, open the "Create Alert" dialog box, then select the "Ensemble Alerts" and "Any alert() function call" options in the "Condition" tabs. See the Alerts FAQ in our Pine Script™ User Manual for more information.
Condition visualization
This script offers organized visualizations of its conditions, allowing users to inspect the behaviors of each condition alongside the specified groups. The key visual features include:
1) Conditional plots
• The indicator plots the history of each individual condition, excluding the external conditions, as circles at different levels. Opposite conditions appear at positive and negative levels with the same absolute value. The plots for each condition show values only on the bars where they occur.
• Each condition's plot is color-coded based on its type. Aqua and orange plots represent opposing directional conditions, and purple plots represent non-directional conditions. The titles of the plots also contain the condition numbers to which they apply.
• The plots in the separate pane can be turned on or off with the "Show plots in pane" checkbox near the top of the "Settings/Inputs" tab. This input only toggles the color-coded circles, which reduces the graphical load. If you deactivate these visuals, you can still inspect each condition from the script's status line and the Data Window.
• As a bonus, the indicator includes "Up alert" and "Down alert" plots in the Data Window, representing the combined upward and downward ensemble alert conditions. These plots are also usable in additional indicator-on-indicator calculations.
2) Dynamic labels
• The indicator draws a label on the main chart pane displaying the activated group markers (e.g., "M1▲") each time an alert condition occurs.
• The labels for upward alerts appear below chart bars. The labels for downward alerts appear above the bars.
NOTE: This indicator can display up to 500 labels because that is the maximum allowed for a single Pine script.
3) Background highlighting
• The indicator can highlight the main chart's background on bars where upward or downward condition groups activate. Use the "Highlight background" inputs in the "Settings/Inputs" tab to enable these highlights and customize their colors.
• Unlike the dynamic labels, these background highlights are available for all chart bars, irrespective of the number of condition occurrences.
█ NOTES
• This script uses Pine Script™ v6, the latest version of TradingView's programming language. See the Release notes and Migration guide to learn what's new in v6 and how to convert your scripts to this version.
• This script imports our new Alerts library, which features functions that provide high-level simplicity for working with complex compound conditions and alerts. We used the library's `compoundAlertMessage()` function in this indicator. It evaluates items from "bool" arrays in groups specified by an array of strings containing comma-separated index lists , returning a tuple of "string" values containing the marker of each activated group.
• The script imports the latest version of the ta library to calculate several technical indicators not included in the built-in `ta.*` namespace, including Double Exponential Moving Average (DEMA), Triple Exponential Moving Average (TEMA), Fractal Adaptive Moving Average (FRAMA), Tilson T3, Awesome Oscillator (AO), Full Stochastic (%K and %D), SuperTrend, and Donchian Channels.
• The script uses the `force_overlay` parameter in the label.new() and bgcolor() calls to display the drawings and background colors in the main chart pane.
• The plots and hlines use the available `display.*` constants to determine whether the visuals appear in the separate pane.
Look first. Then leap.

RiverFlow ADX ScreenerRiverFlow ADX Screener, Scans ADX and Donchian Trend values across various Timeframes. This screener provides support to the Riverflow indicator. Riverflow concept is based on Two indicators. Donchian Channel and ADX or DMI.
How to implement?
1.Donchian Channel with period 20
2. ADX / DMI 14,14 threshold 20
Entry / Exit:
1. Buy/Sell Signal from ADX Crossovers.
2. Trend Confirmation Donchian Channel.
3. Major Trend EMA 200
Buy/Sell:
After a buy/sell is generated by ADX Crossover, Check for Donchian Trend. it has to be in same direction as trend. for FTT trades take 2x limit. for Forex and Stocks take 1:1.5, SL must be placed below recent swing. One can use Riverflow indicator for better results.
ADX Indicator is plotted with
Plus: Green line
Minus: Red Line
ADX strength: plotted as Background area.
TREND: Trend is represented by Green and Red Area around Threshold line
Table:
red indicates down trend
green indicates up trend
grey indicates sideways
Weak ADX levels are treated sideways and a channel is plotted on ADX and PLUS and MINUS lines . NO TRADES are to be TAKEN on within the SIDEWAYS region.
Settings are not required as it purely works on Default settings. However Donchian Length can be changed from settings.
Timeframes below 1Day are screened. Riverflow strategy works on timeframe 5M and above timeframe. so option is not provided for lower timeframes.
Best suits for INTRADAY and LONG TERM Trading

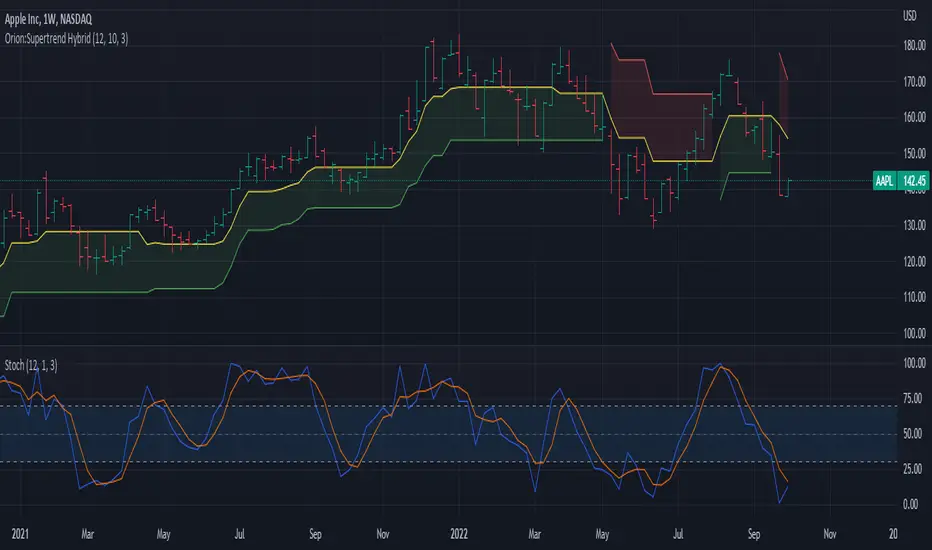
Orion:Supertrend HybridSupertrend Hybrid
This indicator is a combination of the Supertrend and Donchian Channels.
The original Supertrend indicator shades the area from the mean (hl2) of the bar/candle to the Supertrend line.
This Hybrid uses the mid section of the Donchian channel to the Supertrend line as the area to be shaded.
This provides a visual of when prices are getting close to potentially reversing the trend.
Values:
Length = Length of the Donchian Channels (Default: 12)
ATR Length = Lookback length of the ATR calculation (Default: 10)
Factor = Multiply the ATR by this value to get a trend reversal value (Default: 3.0)
Prices cross above the red line indicating a bullish trend is in play
Prices cross below the green line indicating a bearish trend is in play
Yellow line represents the mid-section of the Donchian Channel.
Suggested usage:
Add a Stochastic and set the Stochastic %K Length to the same value as the Donchian Length.
When below trend (red line dominate) and prices cross into the shaded area, if stochastic crosses above 70, prices may challenge/cross the red trend line.
When above trend (green line dominate) and prices cross into the shaded area, if stochastic crosses below 30, prices may challenge/cross the green trend line.
IF in an up trend (green line dominate) and stochastic crosses/remains above 70, potential higher price movement exists.
IF in an down trend (red line dominate) and stochastic crosses/remains below 30, potential lower price movement exists.
ERD: Effort-Result Diagnostic [Darwinian]ERD: Effort–Result Diagnostic
This indicator conceptually inspired by Donchian Channel logic, repurposed to visualize the relationship between effort (participation) and result (price movement) using signed volume as the primary constraint.
Core Concept
Markets move for two fundamentally different reasons:
- Effort — active participation, commitment, urgency
- Entropy / Vacuum — absence of participation
Price alone cannot distinguish between the two. ERD answers one question only:
Is the current price movement supported by participation, or is it moving beyond effort?
How It Works
Volume is treated as directional effort (positive / negative).
Donchian-style logic defines contextual effort boundaries for each direction.
These boundaries are overlaid with price to visualize effort containment.
Interpretation:
Price inside the effort zone
→ Effort still contains price
→ Auction is active and engaged
Price pressing into the effort boundary (tension zone)
→ Effort is being tested
→ Outcome uncertain
Price escaping beyond the effort zone
→ Result exceeds effort
→ Movement is fragile, vacuum-driven, or entropy-based
Upside and downside are evaluated independently.
Intended Use
Diagnose breakout / breakdown quality
Identify entropy drift, especially in illiquid assets
Distinguish absence of effort from failed effort
Improve trade selection and patience
Train effort-aware price action reading across timeframes
ERD is designed to reduce bad trades, not increase activity.
Attribution
Conceptually inspired by Donchian Channels (Richard Donchian),
adapted for effort–result diagnostics using signed volume.
Designed by Darwinian

Detrended Price Oscillator [NexusSignals]Detrended Price Oscillator (DPO) is a detrended price oscillator, used in technical analysis, strips out price trends in an effort to estimate the length of price cycles from peak to peak or trough to trough.
DPO is not a momentum indicator, instead highlights peaks and troughs in price, which are used to estimate buy and sell points in line with the historical cycle. (cf. to investopedia)
DPO indicator made by NexusSignals components :
a filled area that allow users to see easy the trend of an asset;
a sma moving average on chart (default length is 20)
a 20 sma on oscillator, both ma's are color coded to show uptrend / downtrend
a donchian channel applied to the dpo to show breakouts, breakdowns and resistances/support, reversals
few alerts for price crossing above ma, cross above the 0 dpo line, and for cross above and below the donchian channels top and bottom
How you can use DPO indicator ?
The detrended price oscillator (DPO) can be used for measuring the distance between peaks and troughs in the indicator that may help traders to make future decisions as they can locate the most recent trough and determine when the next one may occur in the meassured distance on oscillator between peaks and troughs.
You can use the indicator to find the potential price reversals, for example when the price of an asset is in a bearish trend and the dpo is bouncing from the donchian channel bottom, that may be a potential swing low for that asset, same thing in a bullish trend when the dpo rejecting at top of donchian channel may be a trend reversal, a pullback or swing high.
When DPO is above the 0 trend is in an uptrend and when dpo is below the zero the asset is possible to move into a downtrend.
Also crosses of DPO above and below the DPO moving average may signalising a trend change.

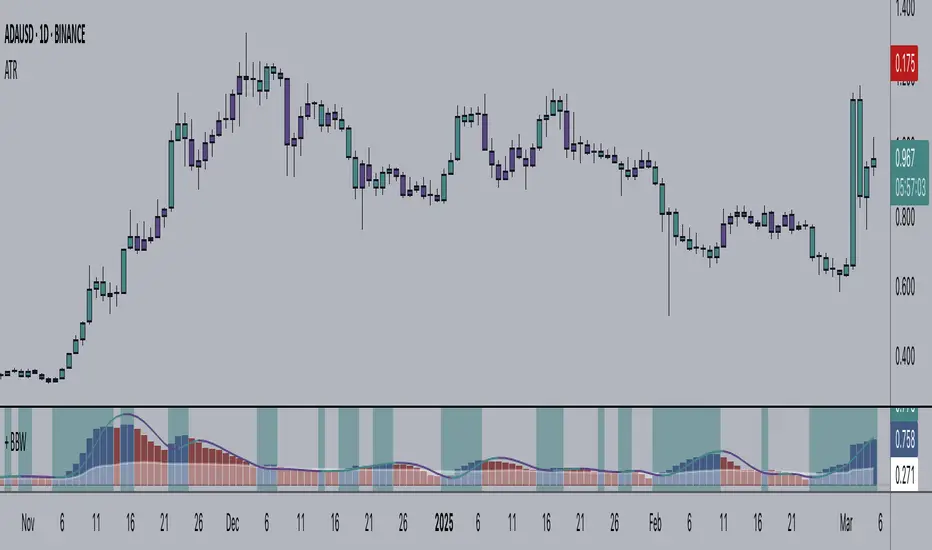
+ Bollinger Bands WidthHere is my rendition of Bollinger Bands Width. If you are unfamiliar, Bollinger Bands Width is a measure of the distance between the top and bottom bands of Bollinger Bands. Bollinger Bands themselves being a measure of market volatility, BB Width is a simpler, cleaner way of determining the amount of volatility in the market. Myself, I found the original, basic version of BB Width a bit too basic, and I thought that by adding to it it might make for an improvement for traders over the original.
Simple things that I've done are adding a signal line; adding a 'baseline' using Donchian Channels (such as that which is in my Average Candle Bodies Range indicator); adding bar and background coloring; and adding alerts for increasing volatility, and baseline and signal line crosses. It really ends up making for a much improved version of the basic indicator.
A note on how I created the baseline:
First, what do I mean by 'baseline?' I think of it as an area of the indicator where if the BB Width is below you will not want to enter into any trades, and if the BB Width is above then you are free to enter trades based on your system. It's basically a volatility measure of the volatility indicator. Waddah Attar Explosion is a popular indicator that implements something similar. The baseline is calculated thus: make a Donchian Channel of the BB Width, and then use the basis as the baseline while not plotting the actual highs and lows of the Donchian Channel. Now, the basis of a Donchian Channel is the average of the highs and the lows. If we did that here we would have a baseline much too high, however, by making the basis adjustable with a divisor input it no longer must be plotted in the center of the channel, but may be moved much lower (unless you set the divisor to 2, but you wouldn't do that). This divisor is essentially a sensitivity adjustment for the indicator. Of course you don't have to use the baseline. You could ignore it and only use the signal line, or just use the rising and falling of the BB Width by itself as your volatility measure.
I should make note: the main image above at default settings is an 8 period lookback (so, yes, that is quite fast), and the signal line is a Hull MA set to 13. The background and bar coloring are simply set to the rising and falling of the BB Width. Images below will show some different settings, but definitely play with it yourself to determine if it might be a good fit for your system.
Above, settings are background and bar coloring tuned to BB Width being above the baseline, and also requiring that the BB Width be rising. Background coloring only highlights increasing volatility or volatility above a certain threshold. Grey candles are because the BB Width is above the baseline but falling. We'll see an example without the requirement of BB Width rising, below.
Here, we see that background highlights and aqua candles are more prevalent because I've checked off the requirement that BB Width be rising. The idea is that BB Width is above the baseline therefor there is sufficient volatility to enter trades if our indicators give us the go-ahead.
This here is set to BB Width being above the signal line and also requiring a rising BB Width. Keep in mind the signal line is a Hull MA.
And this fourth and final image uses a volume-weighted MA as the signal line. Bar coloring is turned off, and instead the checkboxes for volatility advancing and declining are turned on under the signal line options. BB Width crosses up the signal line is advancing volatility, while falling below it is declining volatility. Background highlights are set to baseline and not requiring a rising BB Width. This way, with a quick glance you can see if the rising volatility is legitimate, i.e., is the cross up of the signal line coupled with it being above the baseline.
Please enjoy.
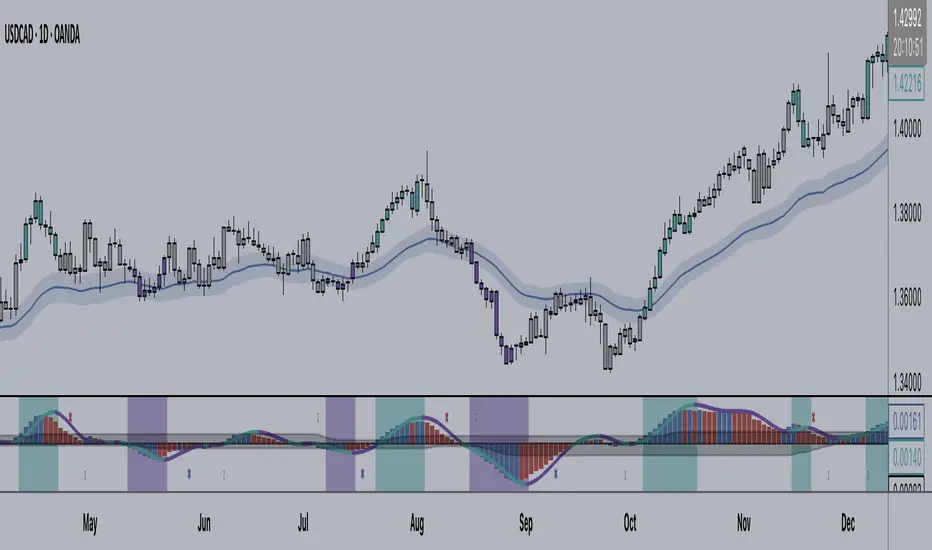
+ Average Candle Bodies RangeACBR, or, Average Candle Bodies Range is a volatility and momentum indicator designed to indicate periods of increasing volatility and/or momentum. The genesis of the idea formed from my pondering what a trend trader is really looking for in terms of a volatility indicator. Most indicators I've come across haven't, in my opinion, done a satisfactory job of highlighting this. I kept thinking about the ATR (I use it for stops and targets) but I realized I didn't care about highs or lows in regards to a candle's volatility or momentum, nor do I care about their relation to a previous close. What really matters to me is candle body expansion. That is all. So, I created this.
ACBR is extremely simple at its heart. I made it more complicated of course, because why would I want anything for myself to be simple? Originally it was envisaged to be a simple volatility indicator highlighting areas of increasing and decreasing volatility. Then I decided some folks might want an indicator that could show this in a directional manner, i.e., an oscillator, so I spent some more hours tackling that
To start, the original version of the indicator simply subtracts opening price from closing price if the candle closes above the open, and subtracts the close from the open if the candle closes below the open. This way we get a positive number that simply measures candle expansion. We then apply a moving average to these values in order to smooth them (if you want). To get an oscillator we always subtract the close from the open, thus when a candle closes below its open we get a negative number.
I've naturally added an optional signal line as a helpful way of gauging volatility because obviously the values themselves may not tell you much. But I've also added something that I call a baseline. You can use this in a few ways, but first let me explain the two options for how the baseline can be calculated. And what do I mean by 'baseline?' I think of it as an area of the indicator where if the ACBR is below you will not want to enter into any trades, and if the ACBR is above then you are free to enter trades based on your system (or you might want to enter in areas of low volatility if your system calls for that). Waddah Attar Explosion is another indicator that implements something similar. The baseline is calculated in two different ways: one of which is making a Donchian Channel of the ACBR, and then using the basis as the baseline, while the other is applying an RMA to the cb_dif, which is the base unit that makes up the ACBR. Now, the basis of a Donchian Channel typically is the average of the highs and the lows. If we did that here we would have a baseline much too high (but maybe not...), however, I've made the divisor user adjustable. In this way you can adjust the height (or I guess you might say 'width' if it's an oscillator) however you like, thus making the indicator more or less sensitive. In the case of using the ACBR as the baseline we apply a multiplier to the values in order to adjust the height. Apologies if I'm being overly verbose. If you want to skip all of this I have tooltips in the settings for all of the inputs that I think need an explanation.
When using the indicator as an oscillator there are baselines above and below the zero line. One funny thing: if using the ACBR as calculation type for the baselines in oscillator mode, the baselines themselves will oscillate around the zero line. There is no way to fix this due to the calculation. That isn't necessarily bad (based on my eyeball test), but I probably wouldn't use it in such a way. But experiment! They could actually be a very fine entry or confirmation indicator. And while I'm on the topic of confirmation indicators, using this indicator as an oscillator naturally makes it a confirmation indicator. It just happens to have a volatility measurement baked into it. It may also be used as an exit and continuation indicator. And speaking of these things, there are optional shapes for indicating when you might want to exit or take a continuation trade. I've added alerts for these things too.
Lastly, oscillator mode is good for identifying divergences.
Above we have the indicator set to directional, or oscillator, mode. Baselines are Donchian Channels. I changed the default EMA length from 4 to 24 in this case, otherwise all the settings are default, as in the main image for the indicator (which is clearly set to non-directional). The indicator is set to requiring an advancing signal line for background and bar colors. Background color is not on by default. Candle colors, as you can see are aqua when above the top baseline (and only when the signal line is advancing, as per the settings), magenta when below the bottom baseline, and grey for anything else. The red and blue X's are exit signals. There are two types: one, when the signal line weakens and, two, when the ACBR crosses above or below the signal line. There are also arrows. These are continuation signals (ACBR crossing signal line).
Same image as above, but the baselines are set to ACBR rather than Donchian Channels.
Again, the same image, but with everything but the ACBR Baseline turned off. You can see how this might make for an excellent confirmation indicator, but for the areas of chap. Maybe run a second instance of the indicator on your chart as a volatility indicator, as you would not be using it in that way in this instance.
Here I have bar coloring turned off except for signal line crosses NOT requiring the signal line to be advancing. Background coloring is also turned on. You can see that these all line up with continuation signals, or exits for purple candles.
Same image as above but requiring the signal line to be advancing. You can see that continuation signals are not contingent upon the signal line to be advancing. I had it setup that way at first, but of course it still gave false signals, so I thought more signals (not that there are many) is better than fewer. To be sure, just because the indicator shows a continuation signal does not mean you should always take it.
Ichimoku Kinko Hyo1) Plot up to 8 moving averages or donchian channels.
2) Moving average types include SMA, EMA, Double EMA, Triple EMA, Quadruple EMA, Pentuple EMA, Zero-Lag EMA, Tillson's T3, Hull's MA, Smoothed MA, Weighted MA, Volume-Weighted MA.
3) Donchian channels can be plotted for a user specified period with upper and lower lines based on either A) highest and lowest prices or B) highest candle body (open/close) and lowest candle body (open/close) over a specified period.
4) Plot 2 arithmetic means averaging any 2 to 8 of the previously mentioned moving averages or donchian median lines.
5) Display 2 fills/clouds between any of the previously mentioned plots.
6) Enough flexibility in the script to utilize Ichimoku Kinko Hyo with correctly adjusted offsets.
7) Ichimoku Kinko Hyo is the default settings. Display additional moving averages or donchian channels for comparison.
"One Half" color scheme by Son A. Pham

Multi-ZigZag Multi-Oscillator Trend DetectorThis table is intended to give you snapshot of how price and oscillators are moving along with zigzag pivots.
This is done in the same lines of Zigzag-Trend-Divergence-Detector
But, here are the differences
Table shows multiple oscillator movements at a same time instead of one selected oscillator
Divergence is not calculated and also supertrend based trend. Trend can be calculated based on zigzag movements. However, lets keep this for future enhancements.
This system also uses multiple zigzags instead of just one.
⬜ Process
▶ Derive multiple zigzags - Code is taken from Multi-ZigZag
▶ Along with zigzags - also calculate different oscillators and attach it to zigzag pivot.
▶ Calculate directions of zigzag pivots and corresponding oscillators.
▶ Plot everything in the table on last bar.
⬜ Table components
Table contains following data:
Directional legends are:
⇈ - Higher High (Green)
⇊ - Lower Low (Red)
⭡- Lower High (Orange)
⭣ - Higher Low (Lime)
⬜ Input Parameters
▶ Source : Default is close. If Unchecked - uses high/low data for calculating pivots. Can also use external input such as OBV
▶ Stats : Gives option to select the depth of output (History) and also lets you chose text size and table position.
▶ Oscillators : Oscillator length is derived by multiplying multiplier to zigzag length. For example, for zigzag 5, with 4 as multiplier, all oscillators are calculated with length 20. But, same for zigzag 8 will be 32 and so on.
▶ Available oscillators :
CCI - Commodity Channel Index
CMO - Chande Momentum Oscillator
COG - Center Of Gravity
MFI - Money Flow Index (Shows only if volume is present)
MOM - Momentum oscillator
ROC - Rate Of Change
RSI - Relative Strength Index
TSI - Total Strength Index
WPR - William Percent R
BB - Bollinger Percent B
KC - Keltner Channel Percent K
DC - Donchian Channel Percent D
ADC - Adoptive Donchian Channel Percent D ( Adoptive-Donchian-Channel )
⬜ Challenges
There are 12 oscillators and each zigzag has different length. Which means, there are 48 combinations of the ocillators.
First challenge was generating these values without creating lots of static initialization. Also, note, if the functions are not called on each bar, then they will not yield correct result. This is achieved through initializer function which runs on every bar and stores the oscillator values in an array which emulates multi dimensional array oscillator X zigzag length.
Next challenge was getting these values within function when we need it. While doing so I realized that values stored in array also have historical series and calling array.get will actully get you the entire series and not just the value. This is an important takeaway for me and this can be used for further complex implementations.
Thanks to @LonesomeTheBlue and @LucF for some timely suggestions and interesting technical discussions :)

Zigzag Trend/Divergence DetectorPullbacks are always hardest part of the trade and when it happen, we struggle to make decision on whether to continue the trade and wait for recovery or cut losses. Similarly, when an instrument is trending well, it is often difficult decision to make if we want to take some profit off the table. This indicator is aimed to make these decisions easier by providing a combined opinion of sentiment based on trend and possible divergence.
⬜ Process
▶ Use any indicator to find trend bias. Here we are using simple supertrend
▶ Use any oscillator. I have added few inbuilt oscillators as option. Default used is RSI.
▶ Find divergence by using zigzag to detect pivot high/low of price and observing indicator movement difference between subsequent pivots in the same direction.
▶ Combine divregence type, divergence bias and trend bias to derive overall sentiment.
Complete details of all the possible combinations are present here along with table legend
⬜Chart Legend
C - Continuation
D - Divergence
H - Hidden Divergence
I - Indeterminate
⬜ Settings
▶ Zigzag parameters : These let you chose zigzag properties. If you check "Use confirmed pivots", then unconfirmed pivot will be ignored in the table and in the chart
▶ Oscillator parameters : Lets you select different oscillators and settings. Available oscillators involve
CCI - Commodity Channel Index
CMO - Chande Momentum Oscillator
COG - Center Of Gravity
DMI - Directional Movement Index (Only ADX is used here)
MACD - Moving average convergence divergence (Can chose either histogram or MACD line)
MFI - Money Flow Index
MOM - Momentum oscillator
ROC - Rate Of Change
RSI - Relative Strength Index
TSI - Total Strength Index
WPR - William Percent R
BB - Bollinger Percent B
KC - Keltner Channel Percent K
DC - Donchian Channel Percent D
ADC - Adoptive Donchian Channel Percent D ( Adoptive-Donchian-Channel )
▶ Trend bias : Supertrend is used for trend bias. Coloring option color candles in the direction of supertrend. More option for trend bias can be added in future.
▶ Stats : Enables you to display history in tabular format.
Overview of settings present here:
⬜ Notes
Trend detection is done only with respect to previous pivot in the same direction. Hence, if chart has too many zigzags in short period, try increasing the zigzag length or chart timeframe. Similarly, if there is a steep trend, use lower timeframe charts to dig further.
Oscillators does not always make pivots at same bar as price. Due to this some the divergence calculation may not be correct. Hence visual inspection is always recommended.
⬜ Possible future enhancements
More options for trend bias
Enhance divergence calculation. Possible options include using oscillator based zigzag as primary or using close prices based zigzag instead of high/low.
Multi level zigzag option - Can be messy to include more than one zigzag. Option can be added to chose either Level1 or Level2 zigzags.
Alerts - Alerts can only be added for confirmed pivots - otherwise it will generate too many unwanted alerts. Will think about it :)
If I get time, I will try to make a video.

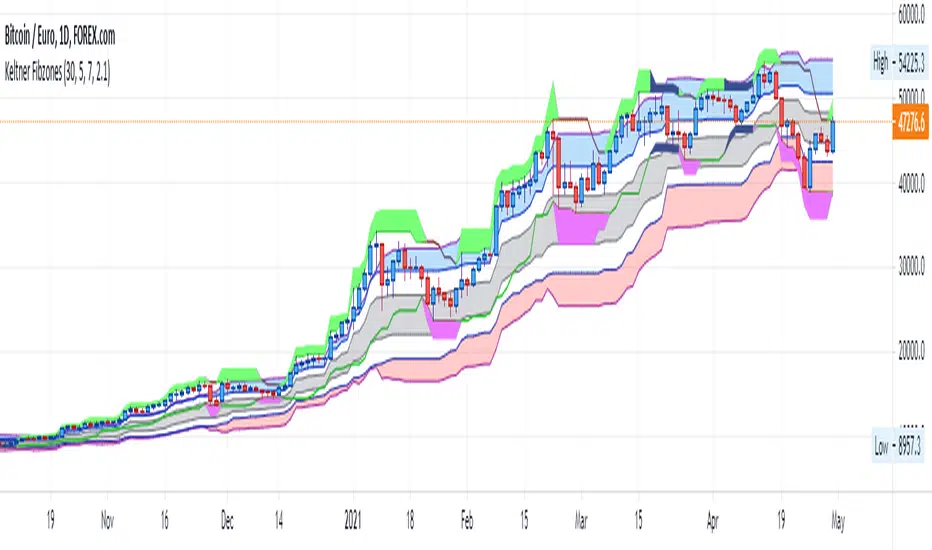
Keltner FibzonesKeltner Channel with Fibonacci Zones which uses properties of a Donchian Channel.
This script is a variation of the Fibonacci Zone script and the Donchian Fibonacci Trading Tool which I published earlier. A Keltner Channel gives more useful information to the trader than a Donchian Channel, because it provides a depiction of “normal range” and shows “outside normalcy” situations. Fibonacci lines provide a way to see if the market is trending up or down, while moving inside the channel, because in cases where the Fibonacci lines function as resistance, the trend is down, whereas when these turn out to be supports the trend is up.
Example of use:
If after a rally up - in which candles moves outside the channel - these return into the channel, this means a “new normal”. If the fibs turn out to give support, one may assume that this is a temporary sideways movement in which a flag is formed, after which following rally up may happen. With rally down the opposite is true. Top and bottom situations show a change in the way the market uses the fiblines.
The middle line of the Donchian Channel is used as the middle line of the Keltner channel, in stead of the sma in the classic channel. Default for calculation is 2 x Average True Range above and below this line. Default for the periods of the channel is 20 periods, because this allows the candles to go outside the channel. If you shorten this, all happens inside the channel.
Ichimoku Cloud Laboratory [DAFE]Ichimoku Cloud Laboratory : The Ultimate All-In-One Trend & Equilibrium Engine
50+ Cloud Engines. Multi-Cloud Architecture. Advanced Signal Filtering. This is Not Just Ichimoku. This is the Evolution of Market Equilibrium.
█ PHILOSOPHY: BEYOND THE CLOUD, INTO THE LABORATORY
The Ichimoku Kinko Hyo is more than an indicator; it is a complete trading philosophy, a masterpiece of market analysis that provides an "at-a-glance" view of trend, momentum, and equilibrium. However, its core calculation—the simple midpoint of the high and low—was conceived in a pre-computer era. While brilliant, it is blind to the modern market's most critical force: the nuanced character of volume, volatility, and microstructure.
The Ichimoku Cloud Laboratory was not created to be another Ichimoku clone. It was engineered to be the definitive evolution of Goichi Hosoda's original vision. This is not just an indicator; it is a powerful, interactive research environment. It is a laboratory where you, the trader, can move beyond the static "one-size-fits-all" approach and forge an Ichimoku system that is perfectly synchronized with the unique physics of your market, timeframe, and analytical style.
We have deconstructed the very DNA of the Cloud, replacing its rigid 1930s-era calculation with a library of over 50 distinct, mathematically diverse calculation engines . From classical moving averages and advanced DSP filters to proprietary DAFE quantum models, this suite provides an unparalleled arsenal for visualizing the true, underlying architecture of market equilibrium.
█ WHAT MAKES THIS A "LABORATORY"? THE CORE INNOVATIONS
This tool stands in a class of its own. It is a collection of what could be 50 separate indicators, all seamlessly integrated into one powerful, unified engine.
The 50+ Algorithm Engine: This is the heart of the Laboratory. You are no longer bound by the simple Donchian midpoint. You can now swap the core calculation engine of the Tenkan-sen, Kijun-sen, and Senkou Span B with any of over 50 algorithms. Want a zero-lag, Hull MA-based cloud? A volume-weighted cloud that gravitates towards liquidity? A cloud that adapts its speed based on market entropy? You now have the power to construct it.
Multi-Cloud Architecture: This revolutionary feature allows you to stack up to three layers of the Ichimoku cloud on your chart, each calculated with a progressively longer timeframe multiplier. This transforms the flat, two-dimensional cloud into a rich, three-dimensional "heatmap" of support and resistance. You can instantly see the alignment (or conflict) between the short-term, medium-term, and long-term trends.
Advanced Signal Logic & Filtering: Go beyond the simple TK Cross. The Laboratory includes eight distinct, built-in signal strategies, from the classic "Kumo Breakout" to the high-conviction "Perfect Order." Crucially, you can then fortify these signals with a professional-grade filter module, requiring confirmation from Volume, ATR (volatility), or ADX (trend strength) before a signal is even considered valid.
Proprietary DAFE Engines: The crown jewels of the Laboratory. These are custom-built, proprietary algorithms you will not find anywhere else, designed to infuse the cloud with modern quantitative analysis:
DAFE Flux Reactor: A cloud that breathes with volatility, automatically tightening in squeezes and expanding in trends.
DAFE Tensor Cloud: Uses a 4-dimensional average (OHLC) to create a cloud that tracks the "true" center of price action.
DAFE Quantum Step: A noise-canceling cloud that only moves when price exceeds a volatility-based threshold.
DAFE Gravity Well: A volume-weighted cloud that is magnetically pulled towards high-liquidity zones.
Integrated Performance Engine & Dashboard: How do you know which of the 50+ engines is best? You test it. The built-in Performance Dashboard tracks every trade generated by your chosen configuration, while the main dashboard provides a comprehensive, at-a-glance summary of the entire Ichimoku system's current state.
█ A GUIDED TOUR OF THE ALGORITHMIC CORE
This is your library of mathematical DNA. The 50+ engines are your tools to build the perfect cloud.
THE ENGINE FAMILIES
The Classics (Hull MA, ZLEMA, KAMA, VIDYA): Replace the choppy Donchian midpoint with smooth, low-lag, or adaptive moving averages to create a more responsive and readable cloud.
The DSP & Quantitative Masters (SuperSmoother, Kalman, Gaussian, Laguerre): Employ advanced digital signal processing and statistical filtering to construct a cloud that is surgically precise in its separation of trend "signal" from market "noise."
The Volume-Based (VWMA, VWAP, Money Flow Weighted): Build a cloud that is not just based on price, but is weighted by participation. This creates a cloud that automatically respects high-liquidity zones as stronger levels of support and resistance.
The Adaptive Geniuses (ATR-Scaled, Volatility-Modulated, Efficiency Ratio, Entropy): These are "smart" engines that analyze the market's character—its volatility, trendiness, or disorder—and adapt the cloud's calculation in real-time. The result is a cloud that is stable in chop and dynamic in trends.
The DAFE Proprietary Engines: The pinnacle of cloud engineering. These exclusive algorithms allow you to build clouds based on principles of physics, institutional analysis, and quantum mechanics, creating a truly next-generation analytical tool.
█ STRATEGIC APPLICATION: FROM SIGNALS TO STRUCTURE
The Laboratory transforms Ichimoku from a simple signal generator into a complete market structure framework.
The Signal Logic: You are not limited to one strategy.
TK Cross: For classic momentum signals.
Kumo Breakout: For pure price action breakout strategies.
Perfect Order: The ultimate filter. By requiring Price > Cloud > Tenkan > Kijun, you filter for only the strongest, most established trends, eliminating the majority of false signals.
Cloud Twist: A forward-looking, predictive signal. The twist of the future cloud often pinpoints the exact timing of a potential trend reversal.
The Multi-Cloud Strategy: This is the professional's view. By enabling 3 Cloud Layers, you can see the market's fractal nature.
Layer 1 (Standard): Your short-term operational trend.
Layer 2 (e.g., 2x Periods): Your medium-term structural trend.
Layer 3 (e.g., 3x Periods): Your long-term macro trend.
The Strategy: Wait for price to pull back into the space between the 2nd and 3rd cloud layers—the "macro support/resistance zone"—and then take a signal from the 1st layer in the direction of the overall trend. This is a high-probability institutional setup.
█ THE MASTER DASHBOARD: YOUR "AT-A-GLANCE" COMMAND CENTER
The dashboard provides a comprehensive, real-time summary of the entire Ichimoku system's state.
Engine & Periods: Instantly confirm which of the 50+ engines and period settings are active.
Status Readout: Get an immediate, color-coded verdict on the three core Ichimoku components: Price vs. Cloud, the TK Cross, and the Future Cloud bias.
Momentum & Strength Gauge: A proprietary score that quantifies the overall bullish or bearish momentum of the system, and a "Strength" bar that visualizes the conviction of the current alignment.
Performance Data: If enabled, the dashboard will display your strategy's key performance metrics, including Win Rate, Profit Factor, and Net P&L.
█ DEVELOPMENT PHILOSOPHY
The Ichimoku Cloud Laboratory was born from a deep respect for Goichi Hosoda's original work and a relentless desire to push it into the 21st century. We believe that in modern markets, static tools are obsolete. The future of trading lies in adaptation, customization, and multi-dimensional analysis. This tool is for the serious trader, the systems thinker, the architect—the individual who is not content with a black box, but who seeks to understand, test, and refine their edge with surgical precision.
The Ichimoku Laboratory is designed to be the ultimate tool for that reaction, providing a crystal-clear, multi-layered view of what the market is telling you—not just through price, but through the very fabric of its equilibrium.
█ DISCLAIMER AND BEST PRACTICES
THIS IS AN ADVANCED ANALYTICAL TOOL: This indicator provides a sophisticated market structure and signal framework. It must be integrated into a complete trading plan that includes your own analysis and risk management.
RISK MANAGEMENT IS PARAMOUNT: All trading involves substantial risk. Never risk more capital than you are prepared to lose.
START WITH A ROBUST BASE: Begin with the "Traditional" preset and the "Standard Donchian" engine to master the classic feel. Then, experiment with a low-lag engine like the "Hull Moving Average" to see the immediate benefit of a smoother, more responsive cloud.
USE CONFLUENCE: The highest probability signals come from confluence. A "TK Cross" buy signal that occurs above a bullish "Multi-Cloud" structure, confirmed by a "Perfect Order" and high volume, is an A++ setup.
"The essence of success in the market is not forecasting, but reacting to what the market is telling you right now."
— J. Welles Wilder Jr.
Taking you to school. - Dskyz, Trade with Anticipation. Trade with Strength. Trade with RSI: Evolved

Weekly Breakout Confirm + RS vs BTC + VolumePurpose
The Weekly Breakout Confirmation indicator validates whether price has structurally exited a prior weekly range and whether that breakout is supported by volume expansion and relative strength vs BTC.
It is a regime confirmation tool, designed to separate real breakouts from false ones.
________________________________________
Core Components
1. Weekly Donchian Channel
• Upper band (green): prior weekly range high
• Lower band (red): prior weekly range low
• Calculated on weekly data with no repainting
These levels define the structural range the market must escape to enter a new regime.
________________________________________
2. Weekly Breakout (W BO)
Triggered when:
• Weekly close breaks above the upper Donchian band
• Volume confirms expansion
• Optional filter: relative strength vs BTC is rising
Displayed as:
• Bullish breakout marker
• Green structure line remains on chart as reference
________________________________________
3. Weekly Breakdown (W BD)
Triggered when:
• Weekly close breaks below the lower Donchian band
• Volume confirms expansion
• Optional filter: relative strength vs BTC is weakening
Displayed as:
• Bearish breakdown marker
• Red structure line remains on chart as reference
________________________________________
4. Relative Strength vs BTC
• Measures asset performance relative to BTC on a weekly basis
• Helps identify:
o True altcoin leadership
o False breakouts driven only by BTC beta
• Optional requirement for breakout validation
________________________________________
5. Volume Confirmation
• Weekly volume must exceed a moving average threshold
• Filters out low-participation breakouts
• Ensures institutional-grade participation
________________________________________
What the Indicator Is Signaling
• Confirmed regime transitions
• Entry into:
o Sustained trends
o Distribution phases
o Structural breakdowns
Once a breakout is confirmed:
• The prior range is invalidated
• The green/red line becomes support/resistance reference, not a trigger
________________________________________
How to Use It
Best used for:
• Determining whether the market is trending or ranging
• Confirming whether weekly EMA squeezes are actionable
• Managing exposure duration and risk tolerance
Interpretation framework:
• W BO + rising RS + volume → trend acceptance
• W BO without RS → BTC-driven move (lower confidence)
• No recent W BO / W BD → consolidation regime
• W BD → risk-off, defensive posture

Squeeze Momentum Early In and Out CandlesJohn Carter presented some candles called "Early In and Out Candles". Although I couldn't imitate the exact candles and warnings I create better indications and bars in my opinion.
When the Candles are above Donchian MA then we have a bullish Momentum.
When the Candles are bellow Donchian MA then we have bearish momentum.
This indicator works best to get an WARNING to enter and close EARLY positions.
Bullish:
When the candles are Light Blue then we have early warning to enter.
When the candles are Dark Blue then we have early warning to close the position.
Bearish:
When the candles are Red then we have early warning to enter.
When the candles are Yellow then we have early warning to close the position.
IMPORTANT NOTES:
Always combine it with the Squeeze Pro indicator.
Suggested Donchian MA: 5 (You can adjust it).
Don't let candles only to be your closing indication once again there are EARLY WARNINGS therefore can move your stop loses to maximize your profits when you are exiting.
I tested my self and I found that is the best strategy when we get Dark Blue candle in the Bullish move I move my stop loss little bit bellow the candle.
Therefore here we go we have early warnings for In and Out.
Thank you and Good Luck.

Ichimoku Average with Margin█ OVERVIEW
“Ichimoku Average with Margin” is a technical analysis indicator based on an average of selected Ichimoku system lines, enhanced with a dynamic safety margin (tolerance). Designed for traders seeking a simple yet effective tool for trend identification with breakout confirmation. The indicator offers flexible settings, line and label coloring, visual fills, and alerts for trend changes.
█ CONCEPT
The Ichimoku Cloud (Ichimoku Kinko Hyo) is an excellent, comprehensive technical analysis system, but for many traders—especially beginners—it remains difficult to interpret due to multiple overlapping lines and time displacements.
Experimentally, I decided to create a simplified version based on its foundations: combining selected lines into a single readable average (avgLine) and introducing a dynamic safety margin that acts as a buffer against market noise.
This is not the full Ichimoku system—it’s merely a clear method for determining trend, accessible even to beginners. The trend changes only after the price closes beyond the margin, eliminating false signals.
█ FEATURES
Ichimoku Lines:
- Tenkan-sen (Conversion Line) – Donchian average over 9 periods
- Kijun-sen (Base Line) – Donchian average over 26 periods
- Senkou Span A – average of Tenkan and Kijun
- Senkou Span B – Donchian average over 52 periods
- Chikou Span – close price (no offset)
Dynamic Average (avgLine):
- Arithmetic mean of only the enabled Ichimoku lines – full component selection flexibility.
Safety Margin (tolerance):
Calculated as:
- tolerance = multiplier × SMA(|open - close|, periods)
- Default: multiplier 1.8, period 100.
Trend Detection:
- Uptrend → when price > avgLine + tolerance
- Downtrend → when price < avgLine - tolerance
- Trend changes only after full margin breakout.
- Margin can be set to 0 – then signals trigger on avgLine crossover.
Signal Labels:
- “Buy” (green, upward arrow) – on shift to uptrend
- “Sell” (red, downward arrow) – on shift to downtrend
Visual Fills:
- Between avgLine and marginLine
- Between avgLine and price (with transparency)
- Colors: green (uptrend), red (downtrend)
Alerts:
- Trend Change Up – price crosses above margin
- Trend Change Down – price crosses below margin
█ HOW TO USE
Add to Chart: Paste code in Pine Editor or find in the indicator library.
Settings:
Ichimoku Parameters:
- Conversion Line Length → default 9
- Base Line Length → default 26
- Leading Span B Length → default 52
- Average Body Periods → default 100
- Tolerance Multiplier → default 1.8
Line Selection:
- Enable/disable: Tenkan, Kijun, Span A, Span B, Chikou
Visual Settings:
- Uptrend Color → default green
- Downtrend Color → default red
- Fill Between Price & Avg → enables shadow fill
Signal Interpretation:
- Average Line (avgLine): Primary trend reference level.
- Margin (marginLine): Buffer – price must break it to change trend. Set to 0 for signals on avgLine crossover.
- Buy/Sell Labels: Appear only on confirmed trend change.
- Fills: Visualize distance between price, average, and margin.
- Alerts: Set in TradingView → notifications on trend change.
█ APPLICATIONS
The indicator works well in:
- Trend-following: Enter on Buy/Sell, exit on reversal.
- Breakout confirmation: Ideal for breakout strategies with false signal protection.
- Noise filtering: Margin eliminates consolidation fluctuations.
Adjusting margin to trading style:
- Short-term trading (scalping, daytrading): Reduce or set margin to 0 → more and faster signals (but more false ones).
- Long-term strategies (swing, position): Increase margin (e.g. 2.0–3.0) → fewer signals, higher quality.
Entry signals are not limited to Buy/Sell labels – use like moving averages:
- Test and bounce off avgLine as support/resistance
- avgLine breakout as momentum signal
- Pullback to margin as trend continuation entry
Combine with:
- Support/resistance levels
- Fair Value Gaps (FVG)
- Volume or other momentum indicators
█ NOTES
- Works on all markets and timeframes.
- Adjust multiplier and periods to instrument volatility.
- Higher multiplier → fewer signals, higher quality.
- Disable unused Ichimoku lines to simplify the average.

SuperBandsI've been seeing a lot of volatility band indicators pop up recently, and after watching this trend for a while, I figured it was time to throw my two chips in. The original spark for this idea came years ago from RicardoSantos's Vector Flow Channel script, which used decay channels with timed events in an interesting way. That concept stuck with me, and I kept thinking about how to build something that captured the same kind of dynamic envelope behavior but with a different mathematical foundation. What I ended up with is a hybrid that takes the core logic of supertrend trailing stops, smooths them heavily with exponential moving averages, and wraps them in Donchian-style filled bands with momentum-based color gradients.
The basic mechanism here is pretty straightforward. Standard supertrend calculates a trailing stop based on ATR offset from price, then flips direction when price crosses the trail. This implementation does the same thing but adds EMA smoothing to the trail calculation itself, which removes a lot of the choppiness you get from raw supertrend during sideways periods. The smoothing period is adjustable, so you can tune how reactive versus stable you want the bands to be. Lower smoothing values make the bands track price more aggressively, higher values create wider, slower-moving envelopes that only respond to sustained directional moves.
Where this diverges from typical supertrend implementations is in the visual presentation and the separate treatment of bullish and bearish conditions. Instead of a single flipping line, you get persistent upper and lower bands that each track their own trailing stops independently. The bullish band trails below price and stays active as long as price doesn't break below it. The bearish band trails above price and remains active until price breaks above. Both bands can be visible simultaneously, which gives you a dynamic channel that adapts to volatility on both sides of price action. When price is trending strongly, one band will dominate and the other will disappear. During consolidation, both bands tend to compress toward price.
The color gradients are calculated by measuring the rate of change in each band's position and converting that delta into an angle using arctangent scaling. Steeper angles, which correspond to the band moving quickly to catch up with accelerating price, get brighter colors. Flatter angles, where the band is moving slowly or staying relatively stable, fade toward more muted tones. This gives you a visual sense of momentum within the bands themselves, not just from price movement. A rapidly brightening band often precedes expansion or breakout conditions, while fading colors suggest the trend is losing steam or entering consolidation.
The filled regions between price and each band serve a similar function to Donchian channels or Keltner bands, creating clearly defined zones that represent normal price behavior relative to recent volatility. When price hugs one band and the fill area compresses, you're in a strong directional regime. When price bounces between both bands and the fills expand, you're in a ranging environment. The transparency gradients in the fills make it easier to see when price is near the edge of the envelope versus safely inside it.
Configuration is split between bullish and bearish settings, which lets you asymmetrically tune the indicator if you find that your market or timeframe has different characteristics in uptrends versus downtrends. You can adjust ATR period, ATR multiplier, and smoothing independently for each direction. This flexibility is useful for instruments that exhibit different volatility profiles during bull and bear phases, or for strategies that want tighter trailing on longs than shorts, or vice versa.
The ATR period controls the lookback window for volatility measurement. Shorter periods make the bands react quickly to recent volatility spikes, which can be beneficial in fast-moving markets but also leads to more frequent whipsaws. Longer periods smooth out volatility estimates and create more stable bands at the cost of slower adaptation. The multiplier scales the ATR offset, directly controlling how far the bands sit from price. Smaller multipliers keep the bands tight, triggering more frequent direction changes. Larger multipliers create wider envelopes that give price more room to move without breaking the trail.
One thing to note is that this indicator doesn't generate explicit buy or sell signals in the traditional sense. It's a regime filter and envelope tool. You can use band breaks as directional cues if you want, but the primary value comes from understanding the current volatility environment and whether price is respecting or violating its recent behavioral boundaries. Pairing this with momentum oscillators or volume analysis tends to work better than treating band breaks as standalone entries.
From an implementation perspective, the supertrend state machine tracks whether each direction's trail is active, handles resets when price breaks through, and manages the EMA smoothing on the trail points themselves rather than just post-processing the supertrend output. This means the smoothing is baked into the trailing logic, which creates a different response curve than if you just applied an EMA to a standard supertrend line. The angle calculations use RMS estimation for the delta normalization range, which adapts to changing volatility and keeps the color gradients responsive across different market conditions.
What this really demonstrates is that there are endless ways to combine basic technical concepts into something that feels fresh without reinventing mathematics. ATR offsets, trailing stops, EMA smoothing, and Donchian fills are all standard building blocks, but arranging them in a particular way produces behavior that's distinct from each component alone. Whether this particular arrangement works better than other volatility band systems depends entirely on your market, timeframe, and what you're trying to accomplish. For me, it scratched the itch I had from seeing Vector Flow years ago and wanting to build something in that same conceptual space using tools I'm more comfortable with.

VPT-style Close-to-Close Indicator📈Cumulative momentum (close-to-close × rel. volume) | MA & Donchian optional | ⚡ Alerts
Key Features:
- Tracks cumulative price momentum using close-to-close changes weighted by relative volume.
- Optional smoothed line (SMA/EMA) to identify trend direction.
- Optional Donchian channels to detect potential breakouts and breakdowns.
- Includes alerts for:
- Moving average crosses (bullish/bearish)
- Local maxima/minima in cumulative momentum
- Donchian upper/lower channel breakouts
- Customizable inputs: smoothing length, channel lengths, scaling factor, and visibility toggles.
- Visual cues: line colors indicate momentum direction (green = up, red = down).
- Use Case: Quickly spot momentum shifts, trend direction, and breakout opportunities with clear alerts and visual cues.

TZtraderTZtrader
This is a TrendZones version with features to set stoploss and targets in short and long positions meant for use in intraday charts. It aims to provide signals for opening and closing long and short positions. In the comments under the TrendZones publication several people expressed a need for features for a short position similar to those for a long position as implemented in TrendZones, some want to use it for scalping, some asked for alerts. When I proposed to create a version for day trading with target lines based on ATR, several people liked the idea.
Full disclosure: I don’t do day trading, because, after I lost a lot of money, I had to promise my wife to stay away from it. I restrict myself to long term investing in stocks which are in uptrend. However I understand what a day trader needs. I gather from my experience that day trading or scalping is an attempt to earn something by opening a position in the morning and close, reopen and close it again during the day with a profit. It is usually done with leveraged instruments like CFD’s, futures, options, and what have you. Opening and closing positions is done within minutes, so the trader needs a quick and efficient way to set proper stoploss and target. TZtrader supports this by showing only three or four numbers on the price bar: The price of the instrument, The logical stop level (gray or green or maroon dots), and the target level (navy). All other numbers are suppressed to prevent mistakes. Also a clear feedback for current settings at the top-center of the pane and an alert feedback at bottom that flashes alerts during the development of the current bar and gives suppression status.
The script
First I made a bare bones version of TrendZones to which I added code for long and short trading setups and a bare setup for no position. The code for the logical stops in long setup had to be reviewed, after which this became the basis for stops in short setup.
Then I added code for 10 alert messages, which was a hassle, because this is the first time I coded alerts and the first time I used an array as a stack to avoid a complicated if-then construction. During testing the array caused a runtime error which I solved by adding ‘array.clear’ to the code, also I discovered that in TradingView separate alerts have to be created for all three setups - short, long and bare. Flipping setups is done in the inputs with a dropdown menu because Pine Script has no function for a clickable button.
One visual with three setups.
The visual has the TrendZones structure: Three near parallel very smooth curves, which border the moderate uptrend (green) and downtrend (orange) zone over and under the curve in the middle, the COG (Center Of Gravity). Where the price breaks out of these curves, strong trend zones show up over and under the curves, respectively strong uptrend (blue) and strong downtrend (red).
Three setups were made clearly different to avoid confusion and to provide oversight in case of multiple trades going on simultaneously which I imagine are monitored in one screen. You have to see which one is long, which short and which have no position. The long setup should not trigger short signals, nor should the short trigger long signals nor the bare setup exclusive long or short signals.
The Long setup is default, shown on the example chart. In this setup the Stoploss suggestions (green, gray and maroon dots) are under the price bars and the target line (navy) at a set distance above the High Border. A zone with a width of 1 ATR is drawn under the Low Border. In this setup 5 specific alerts are provided
The Short setup has the Stoploss suggestions over the price bars, the target line at a set distance under the Low Border. A zone with a width of 1 ATR is drawn above the High Border. This setup also has 5 specific alerts.
The Bare setup has no Stoploss suggestions, no target line and supports 4 alerts, 2 in common with the Long setup and 2 with Short.
The table below gives a summary of scripted alerts:
Setup = Where = When = Purpose
Long, Bare = Green Zone = Bars come from lower zones = Uptrend starts
Long, Bare = Green Zone = Sideways ends in uptrend = Uptrend resumes
Long = COG = First crossing = Uptrend might end warning
Long = Orange Zone = Bars come from higher zones = Uptrend ended take care
Long = Red Zone = Bars come from higher zones = Strong downtrend->close Long
Short, Bare = Orange Zone = Bars come from higher zones = Downtrend starts
Short, Bare = Orange Zone = Sideways ends in downtrend = Downtrend resumes
Short = COG = First crossing = Downtrend might end warning
Short = Green Zone = Bars come from lower zones = Downtrend ended take care
Short = Blue Zone = Bars come from lower zones = Strong uptrend -> close short
You can use script alerts in TradingView by clicking the clock in the sidebar, then ‘create alert’ or plus, as condition you choose ‘Tztrader’ in the dialog box, then the “Any alert() function call” option (the first item in the list). The script lets the valid alert trigger by TradingView after the bar is completed, this can differ from the flashed messages during its formation.
When you create alerts in Tradingview, I advice to do that for each setup, then to make only the alert active which matches the current setup, pause the other ones.
Suppressing false and annoying signals
The script has two ways to suppress such signals, which have to do with the numbers in the alert feedback. The numbers left and right of the message with a colored background, depict the zones in which the previous (left) and current (right) bar move. 1 is the strong downtrend zone (red), 2 the moderate downtrend zone (orange), 3 the sideways zones (gray), 4 the COG (gray), 5 the moderate uptrend zone (green), 6 the strong uptrend zone (blue), 7 something went wrong with assigning a zone (black). In extensive testing the number 7 never occurs, because I catch that error in the code. The idea is that an alert is only triggered if the previous bar was in a different zone. When the bars are in the same zone, no alert is possible. This way all annoying signals are suppressed and long, short and bare get the appropriate alerts.
The third number is a counter. It counts how often the COG is crossed without touching the outer curves. The counter will reset to zero when the upper or lower curve is touched. When the count is 1 you have zone situation 4 and appropriate alerts are flashed. When the count is 2 or higher, a sideways situation (3) is called and while the recrossings are going on, no alerts can be flashed. This suppresses false signals. The ATR zone and curves are brownish-gray where sideways happens(ed). When the channel is narrowed down to just the three curves, some false signals still might occur.
Inputs
“Setup”, default is long, drop down menu provides long, short and bare.
“Target ATR”, default is 2, sets the amount of ATR for the target line. In 1 minute charts 4 seems an appropriate setting, you have to learn by experience which setting works.
“show feedback …” default is on, This creates two feedback labels, a Setup feedback on top of the pane, which shows charted instrument, Setup type, Trend and timeframe of the chart. Background color of Trend feedback is green when it matches the setup, red when mismatches and gray when no match. The alert feedback at the bottom of the pane shows a number, a message and two numbers. The numbers will be explained in the chapter about false and annoying signals below. During formation of the bar, valid alerts are flashed with a blue background, otherwise the message ‘alerts for current bar suppressed’.
Logical Stops
The curves are the logical place to put stops, because, as these are averages of the high and low border of a Donchian channel, they signify the ‘natural’ current highest, lowest and main level in the lookback period that fit the monitored trend setup. A downtrend turns into an uptrend when a breakout of the upper curve occurs. If you are short, that is where you want to close position, so the logical place for the stoploss is the upper curve. Vice versa, when you are long, the logical stop is on the lower curve. The stops show up as green or gray dots on the curves, the green dots signify a nice entry level, the gray stops are there to suggest levels where unrealized profits might be secured, the maroon dots indicate that the trend mismatches the setup.
COG versus other lines
Any line used to identify a trend, be it some MA or some other line, is interpreted the same way: When the bars move above the line there is an uptrend and when below, a downtrend. COG is not different in that sense. If you put such a line in the same chart as TZtrader, you can see situations in which the other line shows uptrend or downtrend earlier than COG, also some other lines, e.g. Hull MA, are very good at showing tops and bottoms, while COG ignores these. On the other hand the other lines are usually a little nervous and let you shake out of position too soon. Just like the other lines, COG gives false signals when it is near horizontal. The advantage of the placement COG is the tolerance for pull backs. This way TZtrader keeps you longer in the trend. Such pull backs are often ‘flags’ which are interpreted in TA as confirming the trend. Tztrader aims to get you in position reasonably soon when a trend begins and out of position as soon as the trend turns against you. The placement of COG is done with a fundamentally different algorithm than other lines as it is not an average of prices, but the middle of two averages of borders of a Donchian channel. This gives the two zones between the curves the same quality as the two zones above and below the middle line of a standard Donchian Channel.
A multi timeframe application.
In this scenario you put a 5 minutes and 1 minute chart with Tztrader side by side. If the 5 minutes shows uptrend, set the 1 minute on long trading and open positions when the trend matches uptrend en close when it mismatches. Don’t open short positions. Once the 5 minute changes to downtrend, set Tztrader in the 1 minute to short trading and open positions when the trend matches downtrend and close when it mismatches.
The idea is that in a long ‘context’, provided by the 5 minutes, the uptrends in the 1 minute will last longer and go further, vice versa for the short ‘context’. This way you do swing trading in the 5 minute in a smart way, maximizing profits.
You can do this with any timeframe pairs with a proportion of around 5:1, 4:1, 6:1, like e.g. 60 minutes and 15 minutes or weeks and days (5 trading days in a week).
Dear day-traders, may this tool be helpful and may your days be blessed.
Take care

Enhanced Ichimoku Cloud Strategy V1 [Quant Trading]Overview
This strategy combines the powerful Ichimoku Kinko Hyo system with a 171-period Exponential Moving Average (EMA) filter to create a robust trend-following approach. The strategy is designed for traders seeking to capitalize on strong momentum moves while using the Ichimoku cloud structure to identify optimal entry and exit points.
This is a patient, low-frequency trading system that prioritizes quality over quantity. In backtesting on Solana, the strategy achieved impressive results with approximately 3600% profit over just 29 trades, demonstrating its effectiveness at capturing major trend movements rather than attempting to profit from every market fluctuation. The extended parameters and strict entry criteria are specifically optimized for Solana's price action characteristics, making it well-suited for traders who prefer fewer, higher-conviction positions over high-frequency trading approaches.
What Makes This Strategy Original
This implementation enhances the traditional Ichimoku system by:
Custom Ichimoku Parameters: Uses non-standard periods (Conversion: 7, Base: 211, Lagging Span 2: 120, Displacement: 41) optimized for different market conditions
EMA Confirmation Filter: Incorporates a 171-period EMA as an additional trend confirmation layer
State Memory System: Implements a sophisticated memory system to track buy/sell states and prevent false signals
Dual Trade Modes: Offers both traditional Ichimoku signals ("Ichi") and cloud-based signals ("Cloud")
Breakout Confirmation: Requires price to break above the 25-period high for long entries
How It Works
Core Components
Ichimoku Elements:
-Conversion Line (Tenkan-sen): 7-period Donchian midpoint
-Base Line (Kijun-sen): 211-period Donchian midpoint
-Span A (Senkou Span A): Average of Conversion and Base lines, plotted 41 periods ahead
-Span B (Senkou Span B): 120-period Donchian midpoint, plotted 41 periods ahead
-Lagging Span (Chikou Span): Current close plotted 41 periods back
EMA Filter: 171-period EMA acts as a long-term trend filter
Entry Logic (Ichi Mode - Default)
A long position is triggered when ALL conditions are met:
Cloud Bullish: Span A > Span B (41 periods ago)
Breakout Confirmation: Current close > 25-period high
Ichimoku Bullish: Conversion Line > Base Line
Trend Alignment: Current close > 171-period EMA
State Memory: No previous buy signal is still active
Exit Logic
Positions are closed when:
Ichimoku Bearish: Conversion Line < Base Line
Alternative Cloud Mode
When "Cloud" mode is selected, the strategy uses:
Entry: Span A crosses above Span B with additional cloud and EMA confirmations
Exit: Span A crosses below Span B with cloud and EMA confirmations
Default Settings Explained
Strategy Properties
Initial Capital: $1,000 (realistic for average traders)
Position Size: 100% of equity (appropriate for backtesting single-asset strategies)
Commission: 0.1% (realistic for most brokers)
Slippage: 3 ticks (accounts for realistic execution costs)
Date Range: January 1, 2018 to December 31, 2069
Key Parameters
Conversion Periods: 7 (faster than traditional 9, more responsive to price changes)
Base Periods: 211 (much longer than traditional 26, provides stronger trend confirmation)
Lagging Span 2 Periods: 120 (custom period for stronger support/resistance levels)
Displacement: 41 (projects cloud further into future than standard 26)
EMA Period: 171 (long-term trend filter, approximately 8.5 months of daily data)
How to Use This Strategy
Best Market Conditions
Trending Markets: Works best in clearly trending markets where the cloud provides strong directional bias
Medium to Long-term Timeframes: Optimized for daily charts and higher timeframes
Volatile Assets: The breakout confirmation helps filter out weak signals in choppy markets
Risk Management
The strategy uses 100% equity allocation, suitable for backtesting single strategies
Consider reducing position size when implementing with real capital
Monitor the 25-period high breakout requirement as it may delay entries in fast-moving markets
Visual Elements
Green/Red Cloud: Shows bullish/bearish cloud conditions
Yellow Line: Conversion Line (Tenkan-sen)
Blue Line: Base Line (Kijun-sen)
Orange Line: 171-period EMA trend filter
Gray Line: Lagging Span (Chikou Span)
Important Considerations
Limitations
Lagging Nature: Like all Ichimoku strategies, signals may lag significant price moves
Whipsaw Risk: Extended periods of consolidation may generate false signals
Parameter Sensitivity: Custom parameters may not work equally well across all market conditions
Backtesting Notes
Results are based on historical data and past performance does not guarantee future results
The strategy includes realistic slippage and commission costs
Default settings are optimized for backtesting and may need adjustment for live trading
Risk Disclaimer
This strategy is for educational purposes only and should not be considered financial advice. Always conduct your own analysis and risk management before implementing any trading strategy. The unique parameter combinations used may not be suitable for all market conditions or trading styles.
Customization Options
Trade Mode: Switch between "Ichi" and "Cloud" signal generation
Short Trading: Option to enable short positions (disabled by default)
Date Range: Customize backtesting period
All Ichimoku Parameters: Fully customizable for different market conditions
This enhanced Ichimoku implementation provides a structured approach to trend following while maintaining the flexibility to adapt to different trading styles and market conditions.

SuperTrade Ichimoku Cloud StrategyUnlike SuperTrade's Super Trend the Ichimoku Cloud Strategy is a trend-following system derived from the Ichimoku Kinko Hyo indicator. It helps identify market direction, momentum, and potential support/resistance zones. This strategy uses key components of the Ichimoku Cloud to determine bullish or bearish trends and executes trades accordingly.
🔍 Key Components Used
Conversion Line (Tenkan-sen) – short-term average (9-period Donchian midpoint by default)
Base Line (Kijun-sen) – medium-term average (26-period Donchian midpoint)
Leading Span A (Senkou Span A) – average of Conversion Line and Base Line, plotted forward by 26 periods.
Leading Span B (Senkou Span B) – 52-period Donchian midpoint, plotted forward by 26 periods.
Lagging Span (Chikou Span) – current close price, plotted backward by 26 periods (for visual reference only in this version).
The cloud (Kumo) is the area between Leading Span A and B, representing trend direction and potential support/resistance.
📈 Entry Rules (Buy Condition)
A long trade is entered when:
LeadLine1 > LeadLine2 → This implies a bullish cloud.
Close > LeadLine1 and Close > LeadLine2 → The price is trading above the cloud, confirming upward momentum.
This combination indicates a strong bullish trend, so the strategy enters a long position.
📉 Exit Rules (Sell Condition / Close Position)
The long trade is closed when:
LeadLine1 < LeadLine2 → This implies a bearish cloud.
Close < LeadLine1 and Close < LeadLine2 → The price has fallen below the cloud, signaling trend weakness or reversal.
This confirms a bearish trend, prompting the strategy to exit the long position.
✅ Must-Have Elements in This Strategy
Entry Logic – based on price position relative to the cloud and cloud direction.
Exit Logic – closes the position when price shifts to a bearish trend.
Overlay Enabled – plotted over price for visual confirmation of signals.
Dynamic Parameters – inputs for conversion/base/cloud lengths and displacement.
Visualization – plots all Ichimoku components including cloud fill for clarity.
No Shorting Logic Yet – this version only handles long trades; shorting can be added optionally.
No Stop-Loss or Take-Profit – trades are closed purely based on Ichimoku trend reversal.

Three Bar Reversal Pattern [LuxAlgo]The Three Bar Reversal Pattern indicator identifies and highlights three bar reversal patterns on the user price chart.
The script also provides an option for incorporating various trend indicators used to filter out detected signals, allowing them to enhance their accuracy and help obtain a more comprehensive analysis.
🔶 USAGE
The script automates the detection of three-bar reversal patterns and provides a clear, visually identifiable signal for potential trend reversals.
When a reversal chart pattern is confirmed and price action aligns with the pattern, the pattern's boundaries are extended, forming levels, with the upper boundary often acting as a resistance and the lower boundary as a support.
The script allows users to filter patterns based on a specific trend direction detected by multiple trend indicators. Users can choose to view patterns that are either aligned with the detected trend or opposite to it.
Included trend indicators are: Moving Average Cloud, Supertrend, and Donchian Channels.
🔶 DETAILS
The three-bar reversal pattern is a technical analysis pattern that signals a potential reversal in the prevailing trend. The pattern consists of three consecutive bar formations:
First Bar and Second Bar: 2 consecutive of the same sentiment, representing the prevailing trend in the market.
Third Bar: Confirms the reversal by closing beyond the high or low of the first bar, signaling a potential change in market sentiment.
Various types of three-bar reversal patterns are documented. The script supports two main types:
Normal Pattern: Detects three-bar reversal patterns without requiring the third bar closing price to surpass the high (bullish pattern) or low (bearish pattern) of the first bar. It identifies basic formations signaling potential trend reversals.
Enhanced Pattern: Specifically identifies three-bar reversal patterns where the third bar closing price surpasses the high (bullish pattern) or low (bearish pattern) of the first bar. This type provides a more selective signal for stronger trend reversals.
🔶 SETTINGS
Pattern Type: Users can choose the type of 3-bar reversal patterns to detect: Normal, Enhanced, or All. "Normal" detects patterns that do not necessarily surpass the high/low of the first bar. "Enhanced" detects patterns where the third bar surpasses the high/low of the first bar. "All" detects both Normal and Enhanced patterns.
Derived Support and Resistance: Toggles the visibility of the support and resistance levels/zones.
🔹 Trend Filtering
Filtering: Allows users to filter patterns based on the trend indicators: Moving Average Cloud, Supertrend, and Donchian Channels. The "Aligned" option only detects patterns that align with the trend and conversely, the "Opposite" option detects patterns that go against the trend.
🔹 Trend Indicator Settings
Moving Average Cloud: Allows traders to choose the type of moving averages (SMA, EMA, HMA, etc.) and set the lengths for fast and slow-moving averages.
Supertrend: Options to set the ATR length and factor for Supertrend.
Donchian Channels: Option to set the length for the channel calculation.
🔶 RELATED SCRIPTS
Reversal-Candlestick-Structure .
Reversal-Signals .
