Multi-EMA Strategy (Low Source)this strategy use the ema low for its functionality 8 9 110 355 and 480
ابحث في النصوص البرمجية عن "ema strategy"

Jimb0ws Strategy Trending Info PanelsJimb0ws Strategy — Golden Candles + Bubble Zones
A price-action/EMA strategy built for FX scalping and intraday swings. It colors Golden Candles when strong bodies touch/skim EMA20/50 in trend (“bubble”) and optionally highlights Robin Candles (break of the prior golden body). Signals are throttled per bubble and filtered by multiple higher-timeframe conditions.
How it trades
Trend bubbles: Uses EMA20/50/100/200 alignment on the chart timeframe; also reads 1H & 4H bubbles for context.
Entries: BUY/SELL labels appear only when a golden setup aligns with fractal/structure checks and all active filters pass.
Stops/Targets (strategy mode):
• Longs: SL = EMA100 if EMA200 > EMA100, else SL = EMA200.
• Shorts: SL = EMA100 if EMA200 < EMA100, else SL = EMA200.
• TP = RR × risk (default 2R).
An on-chart SL/TP info label prints the exact prices at each signal.
Risk filter options: disable beyond 1H EMA50, proximity band around 1H EMA50, wick overdrive veto, session filter (toggle on/off), max signals per bubble.
Visuals & tools
Colored EMAs (20/50/100/200), bubble zone background.
4H info panel (state, start time, duration); Prev-Day ATR panel sits above it.
Optional 1H info panel and consolidation warning.
Fractal markers (size selectable).
Alerts
1H bubble state change (Long/Short/Consolidation).
BUY/SELL signals.
Inputs worth checking
Session & timezone, min body size, pip tolerances, proximity/WOD filters, max signals per bubble, RR, SL/TP label offset.
Notes
Best on FX pairs; pip = mintick × 10. Backtest and adjust to your instrument and session. This is not financial advice.

EMA-SMA & RSI Strategyusing RSI and EMA strategy, it works on RSI based rules as well as indicator based rules

Enhanced Trading Alerts# Enhanced Multi-Symbol EMA Trading System with Smart Alerts
## 📊 Overview
A powerful multi-symbol trading system that monitors up to 6 symbols simultaneously for high-probability trading setups using advanced EMA crossover strategies, enhanced with volume confirmation and RSI filters. Perfect for swing traders and position traders focusing on quality tech stocks.
## 🎯 Key Features
- **Multi-Symbol Monitoring**: Simultaneously tracks 6 different symbols
- **Advanced EMA Strategy**: Uses dual EMA system (320 & 820 periods) for trend confirmation
- **Volume Validation**: Confirms signals with volume surge analysis
- **RSI Filter**: Adds momentum confirmation to avoid false signals
- **Smart Risk Management**: Automatic stop-loss and take-profit calculations
- **Detailed Alerts**: Comprehensive alert messages with key price levels
## 📈 Trading Signals
### Buy Signals Generated When:
- Price crosses above the slow EMA (820)
- Fast EMA (320) confirms the trend
- RSI is in optimal range (not overbought)
- Volume surge confirms the movement
- Risk levels automatically calculated
### Sell Signals Generated When:
- Price crosses below the slow EMA (820)
- Fast EMA (320) confirms the downtrend
- RSI confirms momentum shift
- Volume surge validates the movement
## ⚙️ Customizable Parameters
- **EMA Lengths**: Adjust fast and slow EMA periods
- **Volume Threshold**: Set minimum volume surge multiplier
- **RSI Settings**: Customize overbought/oversold levels
- **Risk Management**: Adjustable stop-loss and take-profit percentages
- **Symbol Selection**: Choose any 6 symbols to monitor
## 🎨 Visual Elements
- Blue line: Fast EMA (320)
- Red line: Slow EMA (820)
- Purple line: RSI indicator
- Clear visual representation of trend changes
## 📱 Smart Alerts
Detailed alert messages include:
- Symbol name and signal type
- Current price level
- RSI value
- Stop-loss price
- Take-profit target
- Volume surge multiplier
## 💡 Best Practices
1. **Timeframe Selection**:
- Best suited for 1H, 4H, or Daily timeframes
- Can be adapted for swing or position trading
2. **Risk Management**:
- Use suggested stop-loss levels
- Follow take-profit targets
- Consider volume confirmation strength
3. **Multiple Chart Setup**:
- Create multiple instances for more symbols
- Group correlated assets together
- Use different alert sounds for different setups
## 🎓 Usage Tips
- Monitor strongest tech stocks for best results
- Combine with market sentiment analysis
- Use volume surge as quality filter
- Wait for all conditions to align before trading
- Consider overall market conditions
## ⚠️ Risk Warning
This indicator is for informational purposes only. Always conduct your own analysis and consider your risk tolerance before trading. Past performance does not guarantee future results.
## 📌 Version History
- v1.0: Initial release with multi-symbol support
- v1.1: Added volume surge confirmation
- v1.2: Enhanced alert system with risk levels
- v1.3: Added RSI filter and improved signal quality
## 🔄 Regular Updates
Subscribe to this script for regular updates and improvements. Feel free to suggest features in the comments section.
## 📗 Default Symbols
- TSLA (Tesla)
- NVDA (NVIDIA)
- AVGO (Broadcom)
- TSM (Taiwan Semiconductor)
- META (Meta Platforms)
- AMZN (Amazon)
You can customize these symbols to match your trading preferences.
Good luck trading! 🍀

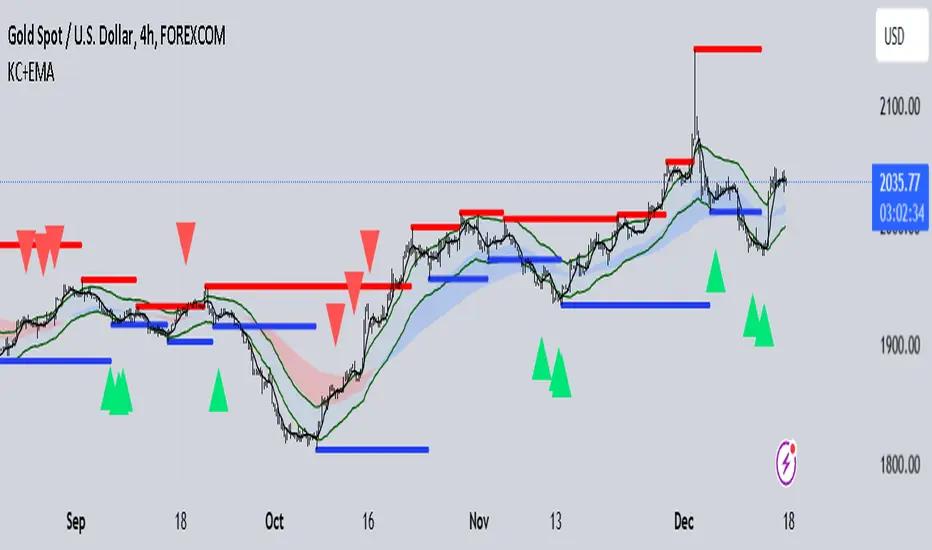
DUCANH - KELTNER CHANNELS + EMA STRATEGY This is a strategy/combination of warning indicators using 3EMA and Keltner Channels.
I set up this strategy with the aim of reducing analytical labor in the market. When this strategy warns signals, then buy or sell.
This strategy setup works for timeframes, however it can still work for different timeframes.
It works well with Gold in various timeframes. If you want to apply it to other currency pairs, you must fine-tune the parameters for maximum efficiency.
The strategy details are as follows:
Ingredient:
EMA50 + EMA120 + SMA
Keltner Channels
Long position Alert:
EMA50 is above EMA120
The candlestick touches the lower KC band
Long position alert will trigger when the candlestick reaches the above conditions and the candlestick starts crossing up to the SMA
Short position Alert:
EMA50 is below EMA120
The candlestick touches the upper KC band
A short position alert will trigger when the candlestick reaches the above conditions and starts crossing down to SMA
Recommended RR: 1:3
If you have any questions please let me know !
10 EMA StrategyThis indicator shows you:
- The first bullish candle to close below EMA 10
- The first bearish candle to close above EMA 10.
Optional:
You can enable the exit signals in the setting. This will show you:
- If you are long (bullish), it will signal when the first bullish candle closes below EMA 10
- If you are short (bearish), it will signal when the first bearish candle closes above EMA 10
You can also change the EMA 10, to another length, if you want to try something else.

CCI & EMA strategy by TradeswithashishThis strategy is extremely useful for positional traders or traders using timeframe 15-minute of higher. It uses following combo of values:
VWAP, CCI, Volume and Moving average (simple and exponential)
Caution:
Avoid taking trade if candle size is greater than twice the average candle size. for that wait for the retracement to near trailing stoploss

RSI Cross [xaurr]This is simple but profitable rsi cross strategy, to find optimal values you can change rsi and ema periods.
Good Luck!

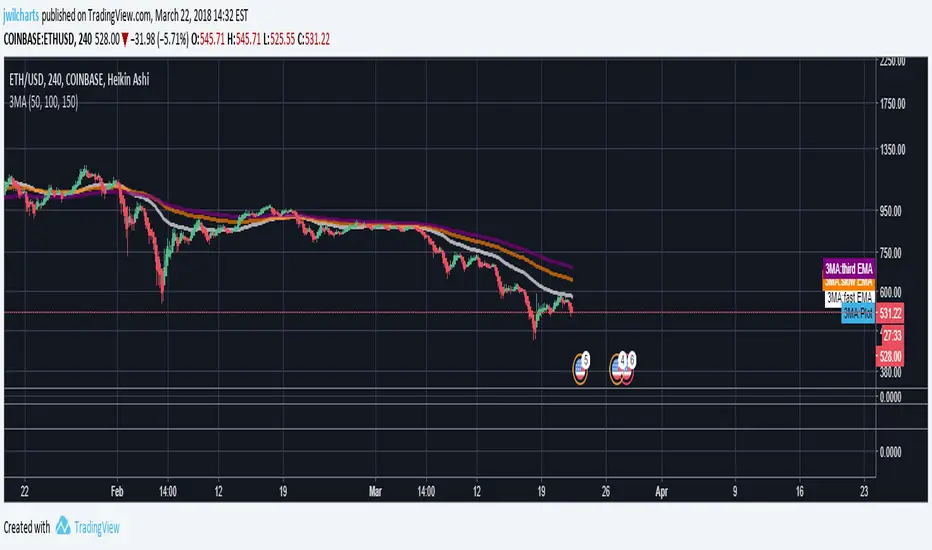
Bjorgum Triple EMA Strat-This script uses a triple EMA strategy to establish trend direction and reversal points
-Inputs are smoothed with Heiken Ashi values to reduce whipsaws, while providing timely execution
-Buy and sell indications are dictated by bar color
-Bar color is dictated by the candle close value in relation to the EMAs, specifically the faster of the 3
(If candle closes above or below the fast and intermediate averages, a buy or sell signal is indicated by bar color change)
-If the close falls between the two a cautionary signal is given. The viewer can hold, or take profit, or evaluate other indicators for clues
-Best results are obtained when coupled with Bjorgum TSI and Bjorgum RSI for confirmation of signals (see TradingView profile)
@Bjorgum on Stocktwits

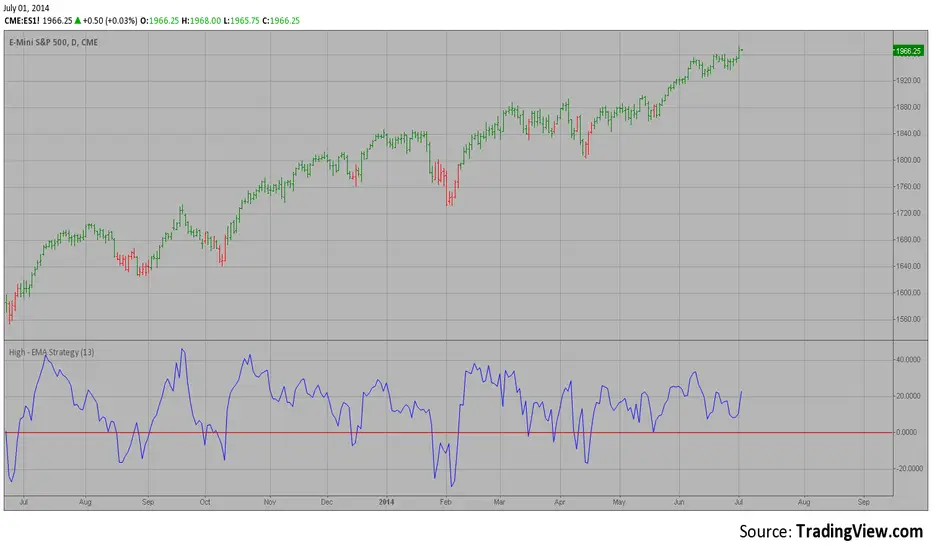
Combo Backtest 123 Reversal & High - EMA Strategy This is combo strategies for get a cumulative signal.
First strategy
This System was created from the Book "How I Tripled My Money In The
Futures Market" by Ulf Jensen, Page 183. This is reverse type of strategies.
The strategy buys at market, if close price is higher than the previous close
during 2 days and the meaning of 9-days Stochastic Slow Oscillator is lower than 50.
The strategy sells at market, if close price is lower than the previous close price
during 2 days and the meaning of 9-days Stochastic Fast Oscillator is higher than 50.
Second strategy
This indicator plots the difference between the High (of the previous period)
and an exponential moving average (13 period) of the Close (of the previous period).
You can use in the xPrice any series: Open, High, Low, Close, HL2, HLC3, OHLC4 and ect...
It buy if indicator above 0 and sell if below.
WARNING:
- For purpose educate only
- This script to change bars colors.
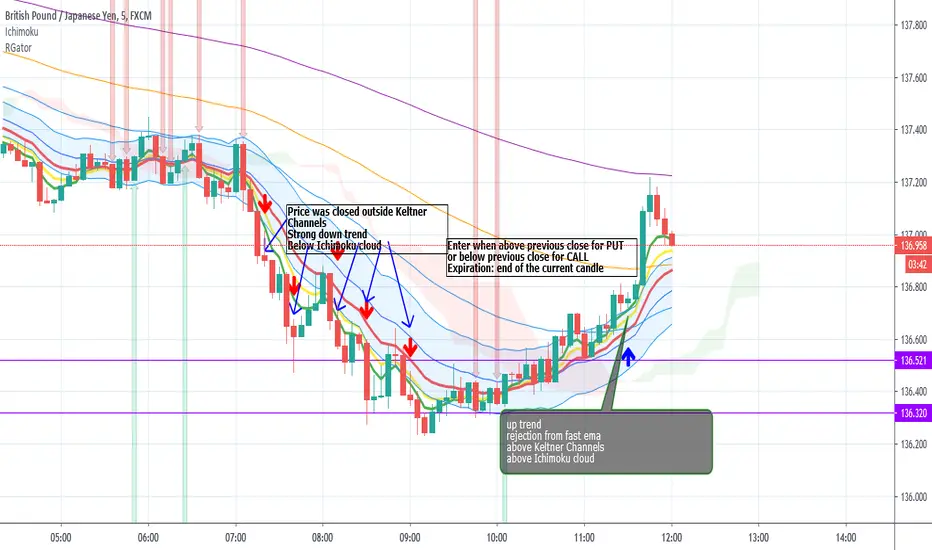
Rainbow Gator - EMAs strategy for Binary OptionThis is an EMAs indicator for Binary Option or Scalping Alert designed for lower Time Frame Trend (2-5minutes).
Although you will find it a useful tool for higher time frames as well.
The Alerts are generated when the fast EMA cross over/under other slower EMAs, you then have the chance to wait for the pullback during the new trend then enter for trend momentum (follow the trend).
Beware when the trend is close to EMA200.
You must draw your SRT (Support-Resistance-Trendline) before looking for setups.
Good luck.
RSI EMA CrossOver RameshThe RSI is one of the most popular technical indicators. The RSI measures the internal strength of the security. The RSI indicator oscillates between oversold and over bought levels, where a trader is advised to look for buying opportunities when the stock is in over sold region and selling opportunities when the stock is in over bought region.
The RSI with EMA strategy signals a trade when EMA of 7 period RSI crosses over the EMA of a 14 period RSI.
Buy: when 10 EMA of 7 period RSI crossing up 10 EMA of a 14 period RSI
Sell: when 10 EMA of 7 period RSI crossing down 10 EMA of a 14 period RSI
EMA = Exponential Moving Average
Crossover = Simple crossover between current RSI values and its 10 day EMA

3 EMAS strategy to define trendsBasic script that allows you to have 3 scripts all in one EMA (exponential moving averages). They are useful to know the general trends of your chart: current long-term trend, short-term (or immediately) and general.
1 ° EMA 36 serves to define or mark action of the market trend price.
At the moment of crossing EMA 36 with EMA 200 upwards it indicates continuation to level 2 ...
2 ° EMA 200 serves as support or resistance according to the case, confirms continuation of trend in medium or long term when crossing with EMA 500, upward trend probability level 3 confirmed. As the case may be, cross up or down.
3 ° EMA 500 serves as support or resistance of the price action.
EMAS 200 and 500 give you a probability of Starting Area ...
Confirming with support or resistance.
Complementation with Stochastics ..
MACD
Note: Remember that "exponential" means that these indicators give more weight to the most recent data, making them more reactive to price changes (react faster to changes in recent prices than simple moving averages)
GROWINGS CRYPTOTRADERS

Triple EMAA simple script for displaying 3 EMA's. Commonly referred to as the "Triple EMA" strategy.
Swing Hull/rsi/EMA StrategyA Swing trading strategy that use a combination of indicators, Hull average to get the trend direction, ema and rsi do the rest, use it are your own risk expecially at the end of any hull trend
Past Performance Does Not Guarantee Future Results

High - EMA Strategy This indicator plots the difference between the High (of the previous period)
and an exponential moving average (13 period) of the Close (of the previous period).
You can use in the xPrice any series: Open, High, Low, Close, HL2, HLC3, OHLC4 and ect...
It buy if indicator above 0 and sell if below.
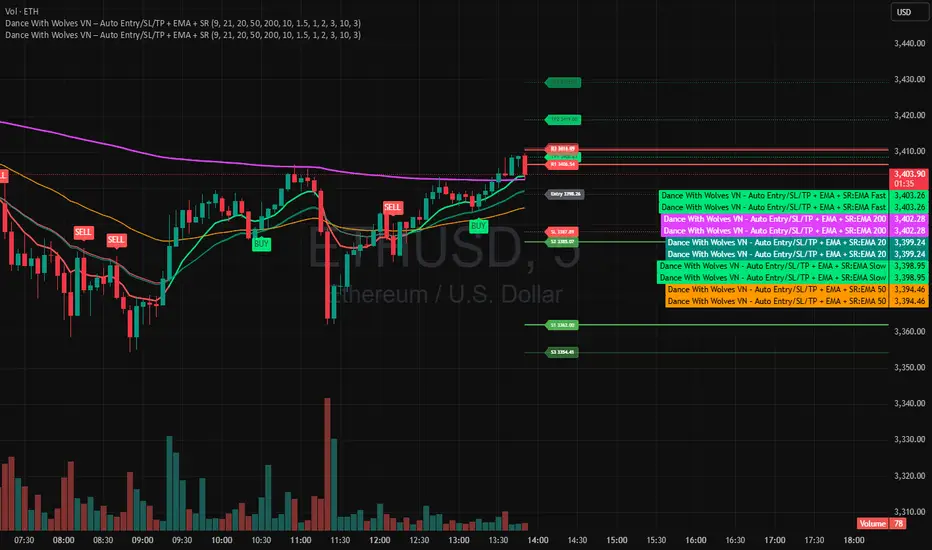
Dance With Wolves VN PublicDance With Wolves VN
Indicator kết hợp EMA 9/21 để vào lệnh nhanh, thêm EMA 20/50/200 để xem trend lớn.
Tự tạo Entry, SL, TP1, TP2, TP3 theo ATR.
Vẽ luôn 3 mức kháng cự (R1–R3) và 3 mức hỗ trợ (S1–S3) từ pivot gần nhất.
Dùng tốt cho khung 1m–15m với crypto, stock, futures.
Dance With Wolves VN — Smart EMA Strategy
This indicator combines EMA 20/50/200 trend tracking, automatic Buy/Sell signals, Take Profit & Stop Loss levels, and Support/Resistance zones.
It helps traders identify clean entries, manage risk with visual TP/SL targets, and follow market trends with clarity.
Created by Dance With Wolves VN — a community project for traders who value discipline, teamwork, and precision.
Trading TimesThis script is based on the 9 and 20 EMA Strategy and combines Fibonacci Levels for added confluence.
When the price retests after breaking the EMAs, we take the trade in the same direction. That is on breakup, we take a long and on a breakdown we take a short.
VWAP can be enabled from settings for more data. institutions use it to average out their trades for both buy and sell orders.

Simple Ema_ATR Strategy HulkTradingSimple EMA strategy, based on ema55+ema21 and ATR(Average True Range) and it enters a deal from ema55 when the other entry conditions are met
Basically long and short conditions
If long:
1) close must be less than open (because we are searching for a pullback)
2) emaFast(21) must be bigger than emaSlow(55) - for a trend detection
3) Difference between emaFast and emaSlow must be greater than ATR(14) - for excluding flat
For short conditions are opposite
Stop levels and take profits, based on ATR multiplier.
You can change it in input field.
I recommended values between 1 and 4, not more.
This strategy was tested on pairs BTCUSDT and ETHUSDT and have a nice results.

Full CRYPTO pack macd, rsi, obv, ema strategyThis is a simple, yet very efficient crypto strategy, adapted to 4h time frame, on big coins like ETH and BTC. However it can be adapted to other markets, timeframes etc
For this strategy I use a combination of a trend line, an oscillator, price action and volume.
This strategy has both the opportunity to go long and short.
As well, it has a leverage simulator .
The rules are the next ones:
Long : we check that current candle is ascending and above the moving average, the macd is in positive range, rsi is below overbought level and volume is bigger than the moving avg of volume.
For short, we have the opposite long rules.
If you have any questions, please let me know !

Cuathro EMA StrategyIt's a long term script based on multiples EMA, crossover and crossunder.
Based on two good scripts CM Sling and OCC.
Always adjust resolution at least twice than chart.
Enjoy it! BTCUSD
