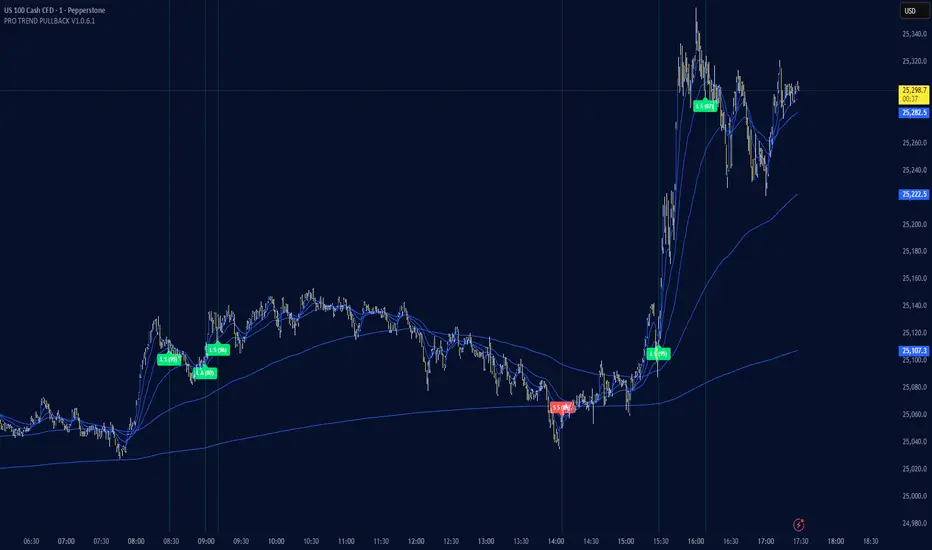
PRO TREND PULLBACK
PRO TREND PULLBACK – trend-following pullback strategy (NAS100 / US30 focus, 1m)
What is this?
- EMA-based trend + pullback entry logic, with optional VWAP and EMA-order filters.
- Built-in preset system for NAS100/US30 on the 1-minute timeframe (Safe / Balanced / Turbo), plus a fully manual “Custom” mode.
Core logic (quick overview)
1) Trend filter:
- Above EMA TREND: long bias, below: short bias
- Optional: VWAP filter, EMA order filter, HTF EMA TREND filter, Multi-EMA direction filter
2) Pullback trigger:
- Pullback level selectable: FAST / MID / SLOW EMA
- Long: touch + bullish confirmation, Short: touch + bearish confirmation (toggleable)
3) Quality filters:
- RSI zone filter (separate for long/short)
- Candle filters: doji / oversized candle / wick (pin-zone) / low-volatility block
- ADX trend-strength filter (via ta.dmi), entry cooldown (bar-based)
- Sideways/range handling: Filter / Penalty / Edge-only mode (ADX + slope + “chop” cross counter)
Risk management / trade management (backtest & automation)
- ATR-based SL/TP: SL, TP1, TP2 (TP1 partial close optional)
- Break-even trigger based on ATR (optional)
- “Max bars in trade” time-based exit (optional)
- Volatility-regime scaling: dynamic SL/TP scaling in high-volatility regimes (optional)
Signal grading (Grade / Score)
- Radar-style scoring + grade: S / A / B / C
- Structural penalties (e.g., lower low / higher high, EMA50 touch, proximity to swing high)
- Trend “fatigue” penalty (down-weights repeated same-direction signals)
- Optional “Lux SMC-lite” score layer (BOS/CHoCH + OB + EQH/EQL + Premium/Discount)
- Optional “ABC-lite (Elliott A-B-C)” score layer (pivot-based)
Alerts / Robot JSON (for webhook)
- Built-in JSON alerts via alert() with watchlist-friendly fields:
secret, strategy, signal, signal_type, symbol, timeframe, time (UTC), price, + optional grade/score
- TradingView alert setup: Condition = “Any alert() function call”
(Webhook URL + your own secret is recommended)
Important notes
- This is a STRATEGY (strategy) intended for backtesting and signal logic. Before live use, test thoroughly and account for slippage/spread differences.
- Pivot-based components (SMC-lite / ABC-lite) are naturally confirmation-based (delayed), so “structure/ABC” values do not print instantly.
- Not financial advice. Use at your own risk.
Suggested starting setup
- Presets: Auto + Balanced (NAS100/US30 1m), then fine-tune with Safe/Turbo.
- For robot mode: turn useRobotAlert=ON and change payloadSecret to a unique value.
ابحث في النصوص البرمجية عن "ema"
BTC EMA 5-9 Flip Strategy AutobotThis strategy is designed for fast and accurate trend-following trades on Bitcoin.
It uses a crossover between EMA 5 and EMA 9 to detect instant trend reversals and automatically flips between Long and Short positions.
How the strategy works
EMA 5 crossing above EMA 9 → Long
EMA 5 crossing below EMA 9 → Short
Automatically closes the opposite trade during a flip
Executes trades only on candle close
Prevents double entries with internal position-state logic
Fully compatible with automated trading via webhooks (Delta Exchange)
Why this strategy works
EMA 5–9 is extremely responsive for BTC’s volatility
Captures trend reversals early
Works best on 15-minute timeframe
Clean, simple logic without over-filtering reduces missed opportunities
Performs well in both uptrends and downtrends
Automation Ready
This strategy includes alert conditions and webhook-ready JSON for automated execution.
This is a fast-reacting BTC bot designed for intraday and swing crypto trend trading.

COT + ema + aux tickerPurpose: Create a script for backtesting the idea that COT can steer weekly Bias on Forex Market.
How does it works: the script use Commercials Delta Conctract, EMA of the selected ticker, EMA of 2 auxiliary tickers (e.g. correlated ticker) to generates buy and sell signals, it allows to include or not each of these.
If you use all the indicator, The buy or sell signals are generated following that rules:
(Example for buy signals on GBPCAD)
1) Commercials add net contract to GBP futures + remove net contract to CAD
2) EMA of GBPCAD is rising
3) EMA of 1st aux ticker is rising (or decline if select inv option)
4) EMA of 2nd aux ticker is rising (or decline if select inv option)
The scripts set the stop at low of the week for long orders and high of the week for shorts.
The exit strategy is to exit at first week of profit
How could you use it:
1) Choose your FX Ticker e.g. GBPCAD and set 1W TimeFrame
2) Select ticker in the strategy setting, remember to select the currency in right order, if you want to study GBP CAD 1st currency is GBP and 2nd CAD
3) Choose if you want to use EMA (and its period of calculation)
4) Choose if you want to use a aux ticker, the direction, and the relative ema period
What could be better;
1) you can just buy on begin of the week.
2) the exit strategy isn't best you can do
3) No level of delta contract is consider, its generate a buy signial also for 1 contract in the right direction
For any question, suggestion of improvemet, ideas, insult:) write to me
It all started from a script i find here on tradingview that extract COT data. Don't remember the name of that guy but Thanks a lot.
My English isn't perfect but i hope you can understand as well.

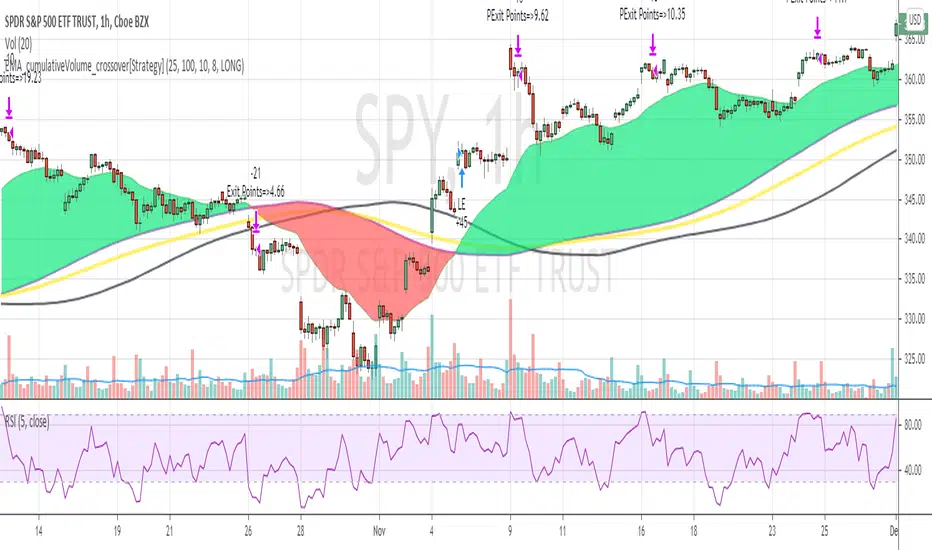
EMA_cumulativeVolume_crossover[Strategy V2]This is variation of EMA_cumulativeVolume_crossover strategy.
instead of cumulative volume crossover, I have added the EMA to cumulative volume of same EMA length.
when EMA crossover EMACumulativeVolume , BUY
when already in LONG position and price crossing over EMACumulativeVolume*2 (orange line in the chart) , Add more
Partial Exit , when RSI 5 crossdown 90
Close All when EMA cross down EMACumulativeVolume
Note
Black Line on the chart is the historical value of EMACumulativeVolume . when EMA area is green and price touch this line closes above it , you can consider consider BUY
I have tested it on SPY , QQQ and UDOW on hourly chart.
EMA setting 25 is working for all of these.
but SPY produces better results on EMA 35 setting
warning
This strategy is published educational purposes only.
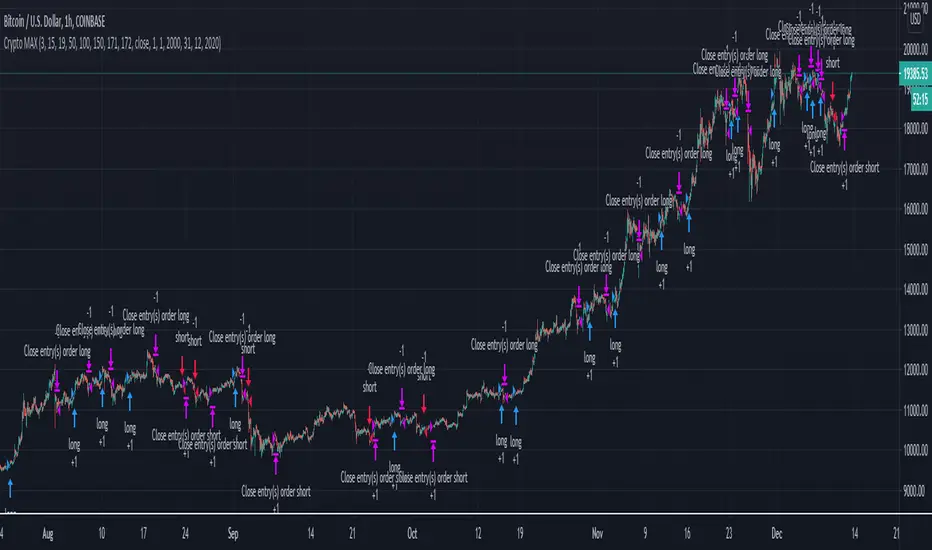
Crypto MultiTrend multi timeframesHello, today I bring you another crypto strategy which can work with multiple timeframes and most of crypto currencies
Its made entirelly of multiple EMA , of different lengths : like super fast, fast, normal, slow and very slow
We also combine a little bit of price action together with the trend direction both for entry and for exits, to have a more precise control.
The rules for long close is above all EMA's, they are in ascending order and the at same time close is bigger than the previous high, and previous high > second previous high, close > 3rd previous high , close > 4th previous high, close > 5th previous high, 5th high > 6th high.
For short we have the same, but instead of high, we use lows, and instead of > we use < .
As exit we have 2 conditions for long and 2 for short
To exit long we have : super fast ema < fast ema and fast ema < normal and normal < slow ema. For short, they would be the opposite, using > sign.
The second exit for long is when our current low crosses below 4 of ours EMA during the same candle. For short, is when the high crosses above 4 of ours EMA during the same candle.
CAUTIOUS : Currently it uses not risk management system, so in this current condition is extremely risky . Be careful
If you have any questions lets me know
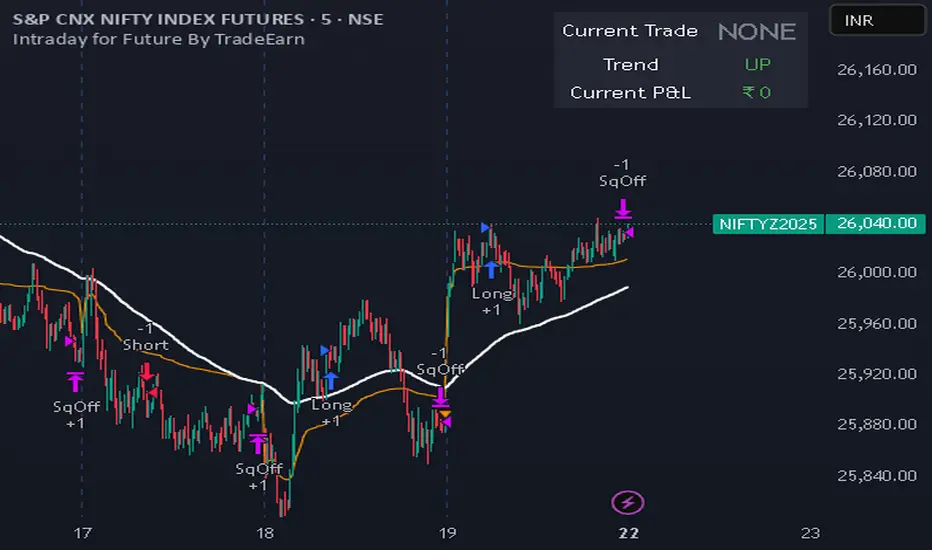
Intraday for Future By TradeEarnIntraday Strategy (StochRSI + VWAP + EMA)
Overview The Intraday Pullback Scalper is a specialized trend-following strategy designed for futures and equity traders who prefer to enter existing trends on pullbacks rather than chasing breakouts. By combining volume-weighted data (VWAP) with exponential moving averages (EMA) and momentum oscillators (Stochastic RSI), this script identifies high-probability entry points during intraday sessions. It includes built-in automation hooks (Alerts) compatible with bridge services for seamless execution.
How It Works
The strategy relies on a three-step confirmation process to filter noise and precision-time entries:
Trend Definition (The Filter):
VWAP (Volume Weighted Average Price): Acts as the primary regime filter. Longs are only permitted if price > VWAP; Shorts only if price < VWAP.
EMA (Exponential Moving Average): A secondary trend filter (default 100 periods) ensures alignment with the broader trend.
Time Range Breakout (Optional): Users can enable an "Initial Balance" filter where trades are only taken if the price breaks out of a specific time range (e.g., first hour High/Low).
Entry Trigger (The Signal):
Long Entry: The market must be in an Uptrend (Price > VWAP & EMA). The script waits for a "dip" where the Stochastic RSI drops below the Oversold level (default 20) and then crosses back up.
Short Entry: The market must be in a Downtrend (Price < VWAP & EMA). The script waits for a "rally" where the Stochastic RSI rises above the Overbought level (default 80) and then crosses back down.
Risk Management:
The strategy uses fixed Target Profit and Stop Loss values defined in currency (₹) relative to the trade quantity.
It features visual SL and TP lines on the chart for the duration of the trade to assist with manual monitoring.
Key Features
Universal Compatibility: Works on the "Current Chart" (Nifty, Bank Nifty, Stocks, Commodities) without needing complex dropdown selection.
Visual Dashboard: An on-screen table displays the Current Trade Status (Long/Short), Trend Direction, and Running P&L in real-time.
Algobaba Bridge Ready: Pre-formatted alert messages are included for users utilizing the Algobaba bridge for automation (supports MIS/NRML product types).
Customizable Trend Filters: Users can toggle the Time Range filter or adjust the VWAP Anchor (Session, Week, Month).
Settings & Configuration
Trade Quantity: Set your default lot size (e.g., 50 for Nifty).
Risk Settings: Define Target and Stop Loss in Rupees (₹) per trade setup.
Indicators: Adjustable lengths for EMA, RSI, and Stochastic.
Trading Window: Restrict entries to specific session hours (e.g., 09:15 - 15:10).
⚠️ IMPORTANT DISCLAIMER & RISK WARNING ⚠️
1. Educational Purpose Only This strategy script is provided solely for educational, informational, and research purposes. It does not constitute financial advice, investment recommendations, or a solicitation to buy or sell any securities, futures, or derivatives. The author is not a SEBI registered Research Analyst or Investment Advisor.
2. No Guarantee of Profit The "P&L" and performance metrics displayed on the chart are hypothetical and based on historical data. Past performance is not indicative of future results. Market conditions change, and a strategy that worked in the past may fail in the future.
3. Limitations of Backtesting
Slippage & Commission: The script results may not fully account for real-world execution costs such as broker commissions, taxes (STT/GST), slippage, or liquidity issues.
Repainting/Data Lag: While every effort is made to ensure code stability, real-time data feeds may vary from historical data due to internet latency or data provider differences.
4. High Risk in Derivatives Trading Futures and Options (F&O) involves a substantial risk of loss and is not suitable for every investor. You can lose more than your initial capital. Please assess your risk tolerance and financial situation before trading.
5. Automation & Third-Party Tools This script includes alert messages formatted for third-party bridge services (e.g., Algobaba). The author assumes no responsibility for:
Technical failures, API errors, or connectivity issues with your broker or bridge provider.
Incorrect order execution resulting from automation.
Users are solely responsible for monitoring their trades and verifying order execution.
Usage Agreement By using this script, you acknowledge that you are trading at your own risk and hold the author harmless from any losses incurred. Always test on a paper trading account before deploying real capital.
Supertrend + EMA + RSI Algo (Low Risk High Accuracy)This is a trend-following + momentum confirmation strategy designed to reduce false signals and control loss.
Supertrend (10,3) → Identifies overall market direction (Buy in uptrend, Sell in downtrend)
EMA 50 & EMA 200 → Confirms strong trend and avoids sideways market
Buy only when EMA 50 is above EMA 200
Sell only when EMA 50 is below EMA 200
RSI (14) → Confirms momentum
Buy when RSI > 55 (strong bullish momentum)
Sell when RSI < 45 (strong bearish momentum)
---
🔹 Entry Logic
BUY: Market is in uptrend + strong momentum
SELL: Market is in downtrend + strong bearish pressure
---
🔹 Risk Management (Most Important)
Stop Loss: Based on ATR (adapts to volatility)
Target: Fixed Risk-Reward ratio (example: 1 : 2.5)
This keeps loss small and profits larger
---
🔹 Best Use Case
Works best in trending markets
Ideal timeframes: 15m, 1h, 4h
Suitable for crypto futures & swing trading
Beginner-friendly if used with low leverage

TrendSight📌 TrendSight — The All-in-One Multi-Timeframe Trend Engine
Key Features & Logic
Multi-Timeframe Trend Confirmation:
Entries are filtered by confirming bullish/bearish alignment across three distinct Supertrend timeframes (e.g., 5-min, 15-min, 45-min, etc.), combined with an EMA and volatility filter, to ensure high-conviction trades that's a powerful combination! Designing the entire strategy around the 15-minute timeframe (M15) and focusing on high-volatility coins maximizes the strategy's effectiveness .
Guaranteed Single-Entry per Signal:
The strategy uses a powerful manual flag and counter system to ensure trades fire only once when a new signal begins. It absolutely prevents immediate re-entry if the signal remains true, waiting instead for the entire trend condition to reset to false.
Dynamic Trailing Stop Loss:
The Stop Loss is set to a moving Supertrend line (current_supertrend), ensuring tight risk management that trails the price as the trade moves into profit.Guaranteed Take Profit (4% Run-up): Uses a precise Limit Order via strategy.exit() to capture profits instantly at a 4% run-up. This ensures accurate profit capture, even on sudden spikes (wicks).
Automated Risk Management:
Position size is dynamically calculated based on a fixed risk percentage (default 2% of equity) relative to the distance to the trailing stop.
🔥 Core Components
1. Adaptive Multi-Timeframe SuperTrend Dashboard
The backbone of mTrendSight is a fully customizable SuperTrend system, enhanced with a multi-timeframe confirmation table displaying ST direction & value.
This compact “Trend Dashboard” provides instant clarity on higher-timeframe direction, trend strength, and market bias.
2. Dynamic Support & Resistance Channels
Automatically detects the strongest support/resistance zones using pivot clustering.
Key Features:
Clustered S/R Channels instead of thin lines
Adaptive width based on recent swings
Breakout markers (optional) for continuation signals
Helps identify structural zones, retest areas, and liquidity pockets
3. Multi-Timeframe Color-Coded EMAs
Plot up to three EMAs, each optionally pulled from a higher timeframe.
Benefits:
Instant visual trend alignment
Bullish/Bearish dynamic color shifts
Precision EMA value table for trade planning
Works perfectly with ST & RSI for multi-layer confirmation
4. Linear Regression Trend Channel
A statistically driven trend channel that measures the most probable path of price action.
Highlights:
Uses Pearson’s R to determine trend reliability
Provides a Confidence Level to judge whether trend slope is credible
Ideal for determining over-extension and mean-reversion zones
5. ATR Volatility Analyzer
A lightweight but powerful volatility classifier using ATR.
Features:
Detects High, Low, or Normal volatility
Clean table display
Helps filter entries during low-energy markets
Strengthens trend-following filters when volatility expands
6. RSI Momentum & Trend Classifier
A significantly improved RSI with multi-layer smoothing and structure-based classification.
Provides:
Bullish / Bearish / Neutral momentum states
Short-term momentum vs long-term RSI trend
Perfect for early trend shifts, pullback entries, and momentum confirmation
⚙️ How the Strategy Works (Execution Logic)
📌 Multi-Timeframe Supertrend + EMA + Volatility Confirmation
Entries are only triggered when:
Multiple Supertrend timeframes align (e.g., 5m + 15m + 45m)
EMA direction aligns with the trend
Volatility conditions (ATR filter) is not Low allow high-probability moves
This ensures strong directional confluence before every trade.
📌 Guaranteed Single-Entry Logic
The strategy uses a flag + counter system to ensure:
Only one entry is allowed per trend signal
Re-entries do not happen until the entire trend condition resets
The Strategy Tester remains clean, without duplicate overlapping trades
This eliminates revenge trades, repeated fills, and choppy overtrading.
📌 Dynamic Supertrend Trailing Stop
Stop Loss is anchored to current Supertrend value, creating:
Automatic trailing
Tight downside control
Protection against deep pullbacks
High responsiveness during volatility expansions
📌 Precision Take-Profit (4% Run-Up Capture)
A dedicated global exit block ensures:
Take Profit triggers exactly at 4% price run-up
Uses strategy.exit() with limit orders to catch spikes (wicks)
Works consistently on all timeframes & assets
📌 Automated Position Sizing (2% Risk Default)
Position size is dynamically calculated based on:
Account Equity
Distance to trailing stop
Configured risk %
This enforces proper risk management without manual adjustments.
📈 How to Interpret Results
Reliable Exits: All exits are globally managed, so stops and take profits trigger accurately on every bar.
Clean Trade History: Because of single-entry logic, backtests show one trade per valid signal.
Consistency: Multi-timeframe logic ensures only high-quality, structured trades.

Zero Lag Trend Signals (MTF) [Quant Trading] V7Overview
The Zero Lag Trend Signals (MTF) V7 is a comprehensive trend-following strategy that combines Zero Lag Exponential Moving Average (ZLEMA) with volatility-based bands to identify high-probability trade entries and exits. This strategy is designed to reduce lag inherent in traditional moving averages while incorporating dynamic risk management through ATR-based stops and multiple exit mechanisms.
This is a longer term horizon strategy that takes limited trades. It is not a high frequency trading and therefore will also have limited data and not > 100 trades.
How It Works
Core Signal Generation:
The strategy uses a Zero Lag EMA (ZLEMA) calculated by applying an EMA to price data that has been adjusted for lag:
Calculate lag period: floor((length - 1) / 2)
Apply lag correction: src + (src - src )
Calculate ZLEMA: EMA of lag-corrected price
Volatility bands are created using the highest ATR over a lookback period multiplied by a band multiplier. These bands are added to and subtracted from the ZLEMA line to create upper and lower boundaries.
Trend Detection:
The strategy maintains a trend variable that switches between bullish (1) and bearish (-1):
Long Signal: Triggers when price crosses above ZLEMA + volatility band
Short Signal: Triggers when price crosses below ZLEMA - volatility band
Optional ZLEMA Trend Confirmation:
When enabled, this filter requires ZLEMA to show directional momentum before entry:
Bullish Confirmation: ZLEMA must increase for 4 consecutive bars
Bearish Confirmation: ZLEMA must decrease for 4 consecutive bars
This additional filter helps avoid false signals in choppy or ranging markets.
Risk Management Features:
The strategy includes multiple stop-loss and take-profit mechanisms:
Volatility-Based Stops: Default stop-loss is placed at ZLEMA ± volatility band
ATR-Based Stops: Dynamic stop-loss calculated as entry price ± (ATR × multiplier)
ATR Trailing Stop: Ratcheting stop-loss that follows price but never moves against position
Risk-Reward Profit Target: Take-profit level set as a multiple of stop distance
Break-Even Stop: Moves stop to entry price after reaching specified R:R ratio
Trend-Based Exit: Closes position when price crosses EMA in opposite direction
Performance Tracking:
The strategy includes optional features for monitoring and analyzing trades:
Floating Statistics Table: Displays key metrics including win rate, GOA (Gain on Account), net P&L, and max drawdown
Trade Log Labels: Shows entry/exit prices, P&L, bars held, and exit reason for each closed trade
CSV Export Fields: Outputs trade data for external analysis
Default Strategy Settings
Commission & Slippage:
Commission: 0.1% per trade
Slippage: 3 ticks
Initial Capital: $1,000
Position Size: 100% of equity per trade
Main Calculation Parameters:
Length: 70 (range: 70-7000) - Controls ZLEMA calculation period
Band Multiplier: 1.2 - Adjusts width of volatility bands
Entry Conditions (All Disabled by Default):
Use ZLEMA Trend Confirmation: OFF - Requires ZLEMA directional momentum
Re-Enter on Long Trend: OFF - Allows multiple entries during sustained trends
Short Trades:
Allow Short Trades: OFF - Strategy is long-only by default
Performance Settings (All Disabled by Default):
Use Profit Target: OFF
Profit Target Risk-Reward Ratio: 2.0 (when enabled)
Dynamic TP/SL (All Disabled by Default):
Use ATR-Based Stop-Loss & Take-Profit: OFF
ATR Length: 14
Stop-Loss ATR Multiplier: 1.5
Profit Target ATR Multiplier: 2.5
Use ATR Trailing Stop: OFF
Trailing Stop ATR Multiplier: 1.5
Use Break-Even Stop-Loss: OFF
Move SL to Break-Even After RR: 1.5
Use Trend-Based Take Profit: OFF
EMA Exit Length: 9
Trade Data Display (All Disabled by Default):
Show Floating Stats Table: OFF
Show Trade Log Labels: OFF
Enable CSV Export: OFF
Trade Label Vertical Offset: 0.5
Backtesting Date Range:
Start Date: January 1, 2018
End Date: December 31, 2069
Important Usage Notes
Default Configuration: The strategy operates in its most basic form with default settings - using only ZLEMA crossovers with volatility bands and volatility-based stop-losses. All advanced features must be manually enabled.
Stop-Loss Priority: If multiple stop-loss methods are enabled simultaneously, the strategy will use whichever condition is hit first. ATR-based stops override volatility-based stops when enabled.
Long-Only by Default: Short trading is disabled by default. Enable "Allow Short Trades" to trade both directions.
Performance Monitoring: Enable the floating stats table and trade log labels to visualize strategy performance during backtesting.
Exit Mechanisms: The strategy can exit trades through multiple methods: stop-loss hit, take-profit reached, trend reversal, or trailing stop activation. The trade log identifies which exit method was used.
Re-Entry Logic: When "Re-Enter on Long Trend" is enabled with ZLEMA trend confirmation, the strategy can take multiple long positions during extended uptrends as long as all entry conditions remain valid.
Capital Efficiency: Default setting uses 100% of equity per trade. Adjust "default_qty_value" to manage position sizing based on risk tolerance.
Realistic Backtesting: Strategy includes commission (0.1%) and slippage (3 ticks) to provide realistic performance expectations. These values should be adjusted based on your broker and market conditions.
Recommended Use Cases
Trending Markets: Best suited for markets with clear directional moves where trend-following strategies excel
Medium to Long-Term Trading: The default length of 70 makes this strategy more appropriate for swing trading rather than scalping
Risk-Conscious Traders: Multiple stop-loss options allow traders to customize risk management to their comfort level
Backtesting & Optimization: Comprehensive performance tracking features make this strategy ideal for testing different parameter combinations
Limitations & Considerations
Like all trend-following strategies, performance may suffer in choppy or ranging markets
Default 100% position sizing means full capital exposure per trade - consider reducing for conservative risk management
Higher length values (70+) reduce signal frequency but may improve signal quality
Multiple simultaneous risk management features may create conflicting exit signals
Past performance shown in backtests does not guarantee future results
Customization Tips
For more aggressive trading:
Reduce length parameter (minimum 70)
Decrease band multiplier for tighter bands
Enable short trades
Use lower profit target R:R ratios
For more conservative trading:
Increase length parameter
Enable ZLEMA trend confirmation
Use wider ATR stop-loss multipliers
Enable break-even stop-loss
Reduce position size from 100% default
For optimal choppy market performance:
Enable ZLEMA trend confirmation
Increase band multiplier
Use tighter profit targets
Avoid re-entry on trend continuation
Visual Elements
The strategy plots several elements on the chart:
ZLEMA line (color-coded by trend direction)
Upper and lower volatility bands
Long entry markers (green triangles)
Short entry markers (red triangles, when enabled)
Stop-loss levels (when positions are open)
Take-profit levels (when enabled and positions are open)
Trailing stop lines (when enabled and positions are open)
Optional ZLEMA trend markers (triangles at highs/lows)
Optional trade log labels showing complete trade information
Exit Reason Codes (for CSV Export)
When CSV export is enabled, exit reasons are coded as:
0 = Manual/Other
1 = Trailing Stop-Loss
2 = Profit Target
3 = ATR Stop-Loss
4 = Trend Change
Conclusion
Zero Lag Trend Signals V7 provides a robust framework for trend-following with extensive customization options. The strategy balances simplicity in its core logic with sophisticated risk management features, making it suitable for both beginner and advanced traders. By reducing moving average lag while incorporating volatility-based signals, it aims to capture trends earlier while managing risk through multiple configurable exit mechanisms.
The modular design allows traders to start with basic trend-following and progressively add complexity through ZLEMA confirmation, multiple stop-loss methods, and advanced exit strategies. Comprehensive performance tracking and export capabilities make this strategy an excellent tool for systematic testing and optimization.
Note: This strategy is provided for educational and backtesting purposes. All trading involves risk. Past performance does not guarantee future results. Always test thoroughly with paper trading before risking real capital, and adjust position sizing and risk parameters according to your risk tolerance and account size.
================================================================================
TAGS:
================================================================================
trend following, ZLEMA, zero lag, volatility bands, ATR stops, risk management, swing trading, momentum, trend confirmation, backtesting
================================================================================
CATEGORY:
================================================================================
Strategies
================================================================================
CHART SETUP RECOMMENDATIONS:
================================================================================
For optimal visualization when publishing:
Use a clean chart with no other indicators overlaid
Select a timeframe that shows multiple trade signals (4H or Daily recommended)
Choose a trending asset (crypto, forex major pairs, or trending stocks work well)
Show at least 6-12 months of data to demonstrate strategy across different market conditions
Enable the floating stats table to display key performance metrics
Ensure all indicator lines (ZLEMA, bands, stops) are clearly visible
Use the default chart type (candlesticks) - avoid Heikin Ashi, Renko, etc.
Make sure symbol information and timeframe are clearly visible
================================================================================
COMPLIANCE NOTES:
================================================================================
✅ Open-source publication with complete code visibility
✅ English-only title and description
✅ Detailed explanation of methodology and calculations
✅ Realistic commission (0.1%) and slippage (3 ticks) included
✅ All default parameters clearly documented
✅ Performance limitations and risks disclosed
✅ No unrealistic claims about performance
✅ No guaranteed results promised
✅ Appropriate for public library (original trend-following implementation with ZLEMA)
✅ Educational disclaimers included
✅ All features explained in detail
================================================================================

Camarilla Pivots + 20 EMA StrategyThis is an intraday volatility and trend-following system for commodities like Natural Gas, combining dynamic pivot levels (Camarilla) with a trend filter (20-period EMA) to improve risk-reward and reduce false breakouts.
Core Components
1. Camarilla Pivots:
These are special support and resistance levels (H3, H4, L3, L4) calculated each day based on the previous day's high, low, and close.
The pivots adapt to daily volatility, giving more relevant breakout and bounce zones than static lines.
H4: Aggressive resistance (used for breakout LONG entry)
H3: Moderate resistance/support (used for bounce or stoploss)
L4: Aggressive support (used for breakout SHORT entry)
L3: Moderate support/resistance (used for bounce or stoploss)
2. 20 EMA (Exponential Moving Average):
Plotted on the 30-minute chart, this acts as a trend filter.
If the price is above 20 EMA: Only look for long trades (bullish bias).
If below 20 EMA: Only look for short trades (bearish bias).
How the Strategy Works
Setup (30-Min Chart):
Camarilla pivots for the day are drawn on the chart.
20 EMA is also plotted.
Trade Filter:
Bullish: Trade ONLY if price is above 20 EMA.
Bearish: Trade ONLY if price is below 20 EMA.
Entry:
LONG: Enter when price breaks and closes above the H4 pivot AND is above 20 EMA.
SHORT: Enter when price breaks and closes below the L4 pivot AND is below 20 EMA.
Stop Loss:
LONG: Place stoploss at H3 (the next lower Camarilla resistance).
SHORT: Place stoploss at L3 (the next higher Camarilla support).
Target:
Always set a profit target at 2x the distance (risk) between entry and stoploss (strict R:R 2).
For example, if your entry is at H4 and stoploss at H3, your target is entry + 2*(entry - stoploss).
Alerts & Visuals:
The strategy plots entry arrows, stoploss and target lines for immediate visual reference.
Alerts trigger on breakout signals so you never miss a trade.
Why This Works Well for Natural Gas
Adapts to volatility: The pivots change daily, handling wide-ranging and choppy price moves better than fixed breakouts.
Trend filter: EMA prevents counter-trend whipsaws, only trades with market momentum.
Risk control: Every trade must meet strict risk-reward criteria, so losses are contained and winners can outweigh losers.

Dubic EMA StrategyThe Dubic EMA Strategy is a trend-following and volatility-aware strategy that combines dual EMA filters with intelligent range and noise detection to provide clean, actionable entries. It's designed to avoid choppy markets, enhance trade precision, and adapt to different market conditions.
✅ Key Features:
Dual EMA Filter: Enters long when price is above both EMA High & EMA Low, and short when below both.
Range Filter: Avoids entries during tight consolidations or sideways markets.
Volatility Filter: Prevents trading in low-ATR conditions.
Dynamic Risk Management:
ATR-based or fixed % Stop Loss and Take Profit.
Optional Parabolic SAR trailing stop.
One Trade per Trend: Prevents re-entry until trend direction changes.
Unbroken Range Visualization: Detects and displays consolidation zones that can lead to breakouts.
Alerts & Labels: Clean BUY/SELL signals with alerts and chart labels.
🧩 Customization Options:
Adjustable EMA length
Toggle between ATR or % based SL/TP
Volatility threshold
Range detection sensitivity
Enable/disable SAR trailing stop
This strategy works best on trending assets and timeframes with volatility (e.g., crypto, forex, indices). Suitable for both manual trading and automation.
🛠️ Built for clarity, control, and precision.
📈 Backtest, optimize, and deploy with confidence.

NIFTY 50 5mint StrategyThis is an intraday strategy for NIFTY50 Based First candle High and Low breakout.
The strategy takes user inputs for the start and end dates, start and end months, and start and end years, which define the time range to trade. The user can also specify the maximum number of trades to take during the time range and the length of the Exponential Moving Average ( EMA ) used in the strategy
In this strategy, the First candle's high and low are calculated and used as entry and exit points for trades. If the close price breaks above the First candle's high, a buy signal is generated. Conversely, if the close price breaks below the First candle's low, a sell signal is generated.
The strategy uses the Exponential Moving Average ( EMA ) as a filter to close entered positions either long or short, EMA also acts Target. If the close price falls below the EMA, a long position is closed, and if the close price rises above the EMA, a short position is closed or the PreviousCandleClose is above the First candle's high a short position is closed, When the PreviousCandleClose is below the First candle's low a long position is closed, First candle's high act as Stoploss
The strategy limits the number of trades taken within the specified time range, and if the time range is exceeded, all positions are closed.
Finally, the strategy plots the First candle's high and low, EMAs on the chart for visual reference.
Default settings work best with the 5mint candle, you may tweak settings according to your needs.
backtesting helps in interpreting how the trading strategy would have behaved in the past, and forward testing (paper trading) informs the traders how it would perform now.

rt maax EMA cross strategythis just sample of our strategies we published with open source, to learning our investor the way of trading and analysis, this strategy just for study and learning
in this strategy we use expontial moving avarage 20 , 50 , 200 and the we build this strategy when the price move up ema 200 and ema 20,50 cross up the 200 ema in this conditions the strargey will open long postion
and the oppisit it is true for short postion in this sitation the price should be under ema 200 and the ema 20 , 50 should cross under 200 ema then the strategy will open the short postion
we try this strategy on forex ,crypto and futures and it give us very good result ,, also we try this postion on multi time frame we find the stragey give us good result on 1 hour time frame .
in the end our advice for you before you use any stratgy you should have the knowledg of the indecators how it is work and also you should have information about the market you trade and the last news for this market beacuse it effect so much on the price moving .
so we hope this strategy give you brefing of the way we work and build our strategy

ComiCo - Joel on Crypto - MACD ScalpingThis is a modified (hopefully improved) version of the "Joel on Crypto - MACD Scalping" indicator. It got turned into a strategy, and added some extra filters, like number of trades after EMA cross, minimal EMA distance (EMA 50's distance from the EMA 200). It is just an experiment to see how good this scalping strategy can get.
Play around with it and let me know if you found good settings, or just have a comment on it.
I could get fairly good results on BTCUSDT 5m with these settings (all others left on default values):
Ticks Avg. Multiplier = 1.4
Max trades after EMA cross = 16
Limit Price Difference = 0
Take Profit = 0.0065
Stop Loss = 0.0085
Min EMA difference = 110
Pyramiding = 3

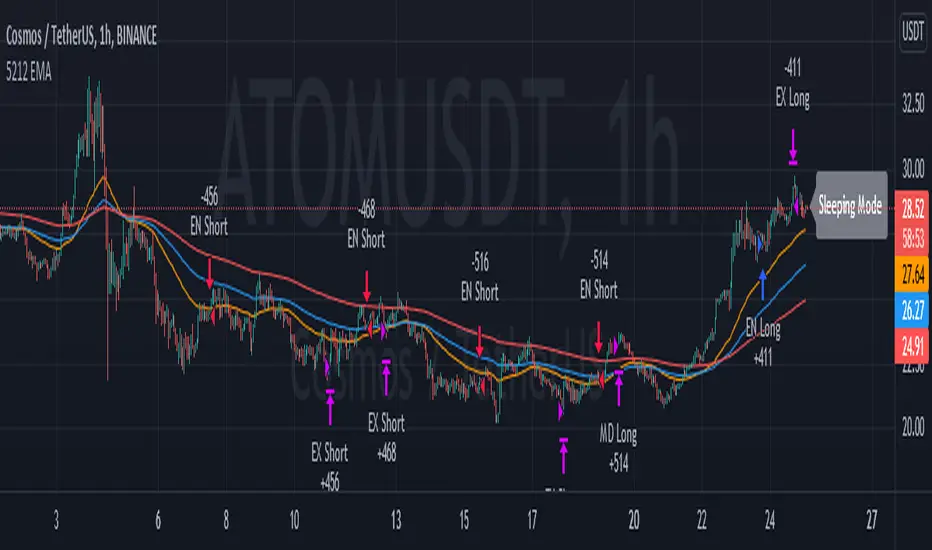
5212 EMA Strategyver 01
23 December 2021
This strategy using :
- 3 EMA period 50, 100, 200
- stochastic RSI slow
Long Cond :
- Stochastic RSI cross below 20
- EMA 50 > 100 > 200
Short Cond :
- Stochastic RSI cross above 80
- EMA 50 < 100 < 200
Sleeping Mode
- EMA 50 between EMA 100 & EMA 200
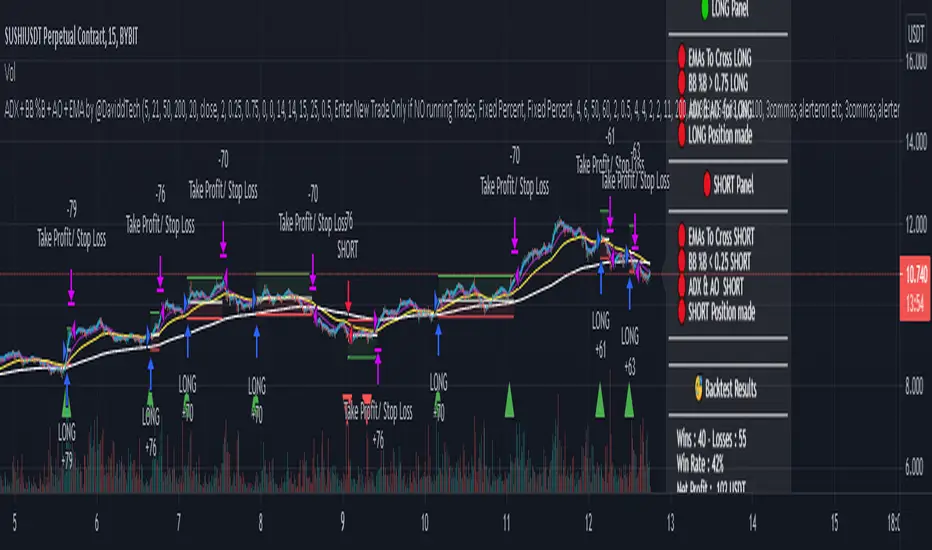
ADX + BB %B + AO + EMA by @DaviddTechThis trading strategy combines different indicators:
1) ADX , Average Directional Movement to make sure we are in a trend.
2) BB %B Bollinger Band %B: to spots relative price position to Bollinger Bands
3) AO Awesome Oscillator for momentum - you will need to configure this to fit the pair.
4) EMA 5, EMA 21, EMA 50, EMA 200: crossovers to get our entry short or long & trend direction
This script was inspired by TraderPro - Crazy 78% Win Rate Proven Trading Strategy Revealed - ADX + BB %B + AO + EMA
My settings are pretty much as default.
- I have added a 10,000 USD default
- 7% of portfolio is used to create the results.
You can of course optimize all of this in the settings.
WARNING:
- For purpose educate only
- Plots EMAs and other values on chart.
- This script to change bars colors.
4X EMA and volume strategyThis is a strategy made from multiple types of EMA and volume(EOM).
This is a long only strategy.
EMA 1 = 13
EMA 2 = 21
EMA 3 = 50
EMA 4 = 180
In this case we have 2 options for entry:
1.We check that are candles are in ascending order and EOM is above 0 - > long, descending and eom<0 -> exit long
2.We check if we have a crossover between the first ema with the second and the third. Cross up -> long, crossdown -> exit long
If you have any questions let me know!

MACD/EMA/SMA/Ichimoku Confluence StrategyThis strategy uses a number of chart indicators to provide a Bullish/Bearish signal. Using a combination of the 200 SMA, the 20 EMA, the MACD and the Ichimoku cloud, the strategy logic will adjust the amount of confluence required between the indicators depending on how bullish or bearish the chart is looking. The logic looks for the following:
- Are we above or below the 200 SMA?
- Are we above or below the 20 EMA?
- Have we had a bullish MACD cross?
- Where are we in relation to the Ichimoku cloud?
If the coin is below the 200 SMA, then the strategy will only give a buy signal if the coin closes a candle above the 20 EMA AND the MACD is bullish and either the Ichimoku cloud is green, or the coin is above the Ichimoku cloud (regardless of colour).
If the coin is above the 200 SMA, Then the strategy will give a buy signal if the coin closes a candle above the 20 EMA AND the MACD is bullish and the coin is either IN the cloud (not necessarily above it) or the cloud is green.
The reverse is true for a sell signal, i.e. when the coin is above the 200 SMA it must close a candle below the Ichimoku cloud and be bearish in relation to the 20 EMA and MACD. If it is below the 200 SMA, then the strategy will give a sell signal if the the EMA/MACD conditions are true and the coin enters the cloud.
This strategy gives a fairly conservative signal for entry and exit points, but is fairly successful across a number of time frames, both short term and long term. As with all my strategies, I only include LONG entries and closes, not SHORT entries (as I find they make for inaccurate backtesting).
Please feel free to like, share, critique and suggest any improvements to this strategy. All feedback, positive and negative, is appreciated.

3-forcesThis strategy has three components.
Philakones EMAs are a sequence of five fibonacci EMAs. They range from 55 candles (green) to 8 candles (red) in length. A strong trend or breakout is marked by the emas appearing in sequence of their length from 8 to 55 or vice versa.
These EMAs are also used to signal an exit. Only two EMAs are used for exit signals - when the 13 EMA crosses over/under the 55 EMA .
RSI gives a bullish signal when 40 > rsi > 70. Exit signals are oversold (30) or overbought (70)
Stochastics give a bullish signal when stoch < 80 and an exit signal when > 95.
Results include 3 ticks of slippage and taker fees of .002. Provides a pretty smooth equity curve with a 73% win rate and beats buy and hold by than 10x (returns about 60x overall) since start of 2017.

Titan EMA Liquidity [Stansbooth]
🔥 Precision EMA + FVG Liquidity Sweep System
Advanced Buy/Sell Signal Engine for High-Probability Trade Entries
Unlock a new level of precision with this all-in-one market structure indicator built for traders who demand accuracy, clarity, and confidence.
This tool combines EMA trend filtration , Fair Value Gap (FVG) detection , and liquidity sweep analysis to deliver powerful buy and sell signals that align with institutional price behavior.
✅ Key Features
Dynamic EMA Trend Filter:
Identifies true trend direction and filters out low-quality trades. Signals only trigger when momentum aligns with higher-timeframe directional bias.
Smart FVG Detection:
Automatically highlights bullish and bearish Fair Value Gaps, helping you spot premium/discount zones where institutional traders seek entries.
Liquidity Sweep Identification:
Detects equal highs/lows, stop hunts, and engineered liquidity grabs—then confirms reversals when price sweeps liquidity and returns inside structure.
High-Accuracy Signal Engine:
Buy/Sell alerts trigger only when three layers agree:
1. EMA trend alignment
2. FVG confirmation
3. Liquidity sweep completion
This results in cleaner signals , fewer false entries, and strong trend continuation setups.
Optimized for All Market Conditions:
Works for scalping, day trading, and swing trading across Forex, Crypto, Indices, and Stocks.
What This Indicator Helps You Achieve
Capture smart-money style entries with reduced drawdown
Enter after liquidity grabs instead of before them
Avoid chop with EMA-filtered market direction
Spot precision premium/discount zones using automatic FVG mapping
Obtain high-confidence Buy/Sell signals based on institutional concept
Why Traders Love It
This system isn’t just another signal generator—it’s a market-structure aware model that reads the chart the same way professional traders do.
Every signal is based on probability stacking , giving you the clarity and confidence to take the best setups while ignoring noise.

5-min Strat Strategy V2 (With Stop Loss)README: 5-min Strat Strategy V2 – $7,500 Stop Loss Version
✅ Description
This is a rules-based intraday trading strategy developed for use on futures contracts like MNQ (Micro Nasdaq) or MES (Micro S&P). It focuses on momentum-based breakout entries above pre-market highs, during regular trading hours, and uses EMAs to define trend alignment.
⚙️ Strategy Components
✅ Trade Type
Long-Only strategy
Entry and exit based on EMAs, price position, and time windows
✅ Time Frame
Built for 5-minute charts
✅ Symbols
Optimized for MNQ (Micro Nasdaq Futures)
Works on MES or other U.S. index futures with similar structure
📅 Time Windows
Pre-Market Hours (PMH/PML): 04:00 – 09:30 AM EST
Regular Trading Hours (RTH): 09:30 AM – 4:00 PM EST
Auto Exit Time: 4:59 PM EST (to comply with prop firm rules)
📌 Entry Conditions (Long)
48 EMA > 200 EMA (Bullish alignment)
Price > Locked Pre-Market High
Green Candle (close > open)
During RTH (9:30–16:00 EST)
Cooldown: Must wait 4 candles after last entry
Max Trades per Day: 3
💥 Exit Conditions
Primary Exit: Close below the 48 EMA
Max Loss Exit: Stop loss set to $7,500 per trade
EOD Exit: All positions are closed at 4:59 PM EST
💰 Risk Management
Contracts: 6 Micro contracts per trade
Stop Loss: Dynamic point-based SL calculated based on:
MNQ point value = $20/point per contract
30 contracts = $120/point
Max SL points = $7,500 / $120 = 62.5 points
📊 Key Variables for Logging
Parameter Value
Max Stop Loss $7,500
Position Size 30 Micro Contracts - ***Varies depending on account size***
Cooldown Bars 4 (20 min)
Max Daily Trades 3
Strategy Version V2 – $7.5K SL

Optimized ADX DI CCI Strategy### Key Features:
- Combines ADX, DI+/-, CCI, and RSI for signal generation.
- Supports customizable timeframes for indicators.
- Offers multiple exit conditions (Moving Average cross, ADX change, performance-based stop-loss).
- Tracks and displays trade statistics (e.g., win rate, capital growth, profit factor).
- Visualizes trades with labels and optional background coloring.
- Allows countertrading (opening an opposite trade after closing one).
1. **Indicator Calculation**:
- **ADX and DI+/-**: Calculated using the `ta.dmi` function with user-defined lengths for DI and ADX smoothing.
- **CCI**: Computed using the `ta.cci` function with a configurable source (default: `hlc3`) and length.
- **RSI (optional)**: Calculated using the `ta.rsi` function to filter overbought/oversold conditions.
- **Moving Averages**: Used for CCI signal smoothing and trade exits, with support for SMA, EMA, SMMA (RMA), WMA, and VWMA.
2. **Signal Generation**:
- **Buy Signal**: Triggered when DI+ > DI- (or DI+ crosses over DI-), CCI > MA (or CCI crosses over MA), and optional ADX/RSI filters are satisfied.
- **Sell Signal**: Triggered when DI+ < DI- (or DI- crosses over DI+), CCI < MA (or CCI crosses under MA), and optional ADX/RSI filters are satisfied.
3. **Trade Execution**:
- **Entry**: Long or short trades are opened using `strategy.entry` when signals are detected, provided trading is allowed (`allow_long`/`allow_short`) and equity is positive.
- **Exit**: Trades can be closed based on:
- Opposite signal (if no other exit conditions are used).
- MA cross (price crossing below/above the exit MA for long/short trades).
- ADX percentage change exceeding a threshold.
- Performance-based stop-loss (trade loss exceeding a percentage).
- **Countertrading**: If enabled, closing a trade triggers an opposite trade (e.g., closing a long opens a short).
4. **Visualization**:
- Labels are plotted at trade entries/exits (e.g., "BUY," "SELL," arrows).
- Optional background coloring highlights open trades (green for long, red for short).
- A statistics table displays real-time metrics (e.g., capital, win rates).
5. **Trade Tracking**:
- Tracks the number of long/short trades, wins, and overall performance.
- Monitors equity to prevent trading if it falls to zero.
### 2.3 Key Components
- **Indicator Calculations**: Uses `request.security` to fetch indicator data for the specified timeframe.
- **MA Function**: A custom `ma_func` handles different MA types for CCI and exit conditions.
- **Signal Logic**: Combines crossover/under checks with recent bar windows for flexibility.
- **Exit Conditions**: Multiple configurable exit strategies for risk management.
- **Statistics Table**: Updates dynamically with trade and capital metrics.
## 3. Configuration Options
The script provides extensive customization through input parameters, grouped for clarity in the TradingView settings panel. Below is a detailed breakdown of each setting and its impact.
### 3.1 Strategy Settings (Global)
- **Initial Capital**: Default `10000`. Sets the starting capital for backtesting.
- **Effect**: Determines the base equity for calculating position sizes and performance metrics.
- **Default Quantity Type**: `strategy.percent_of_equity` (50% of equity).
- **Effect**: Controls the size of each trade as a percentage of available equity.
- **Pyramiding**: Default `2`. Allows up to 2 simultaneous trades in the same direction.
- **Effect**: Enables multiple entries if conditions are met, increasing exposure.
- **Commission**: 0.2% per trade.
- **Effect**: Simulates trading fees, reducing net profit in backtesting.
- **Margin**: 100% for long and short trades.
- **Effect**: Assumes no leverage; adjust for margin trading simulations.
- **Calc on Every Tick**: `true`.
- **Effect**: Ensures real-time signal updates for precise execution.
### 3.2 Indicator Settings
- **Indicator Timeframe** (`indicator_timeframe`):
- **Options**: `""` (chart timeframe), `1`, `5`, `15`, `30`, `60`, `240`, `D`, `W`.
- **Default**: `""` (uses chart timeframe).
- **Effect**: Determines the timeframe for ADX, DI, CCI, and RSI calculations. A higher timeframe reduces noise but may delay signals.
### 3.3 ADX & DI Settings
- **DI Length** (`adx_di_len`):
- **Default**: `30`.
- **Range**: Minimum `1`.
- **Effect**: Sets the period for calculating DI+ and DI-. Longer periods smooth trends but reduce sensitivity.
- **ADX Smoothing Length** (`adx_smooth_len`):
- **Default**: `14`.
- **Range**: Minimum `1`.
- **Effect**: Smooths the ADX calculation. Longer periods produce smoother ADX values.
- **Use ADX Filter** (`use_adx_filter`):
- **Default**: `false`.
- **Effect**: If `true`, requires ADX to exceed the threshold for signals to be valid, filtering out weak trends.
- **ADX Threshold** (`adx_threshold`):
- **Default**: `25`.
- **Range**: Minimum `0`.
- **Effect**: Sets the minimum ADX value for valid signals when the filter is enabled. Higher values restrict trades to stronger trends.
### 3.4 CCI Settings
- **CCI Length** (`cci_length`):
- **Default**: `20`.
- **Range**: Minimum `1`.
- **Effect**: Sets the period for CCI calculation. Longer periods reduce noise but may lag.
- **CCI Source** (`cci_src`):
- **Default**: `hlc3` (average of high, low, close).
- **Effect**: Defines the price data for CCI. `hlc3` is standard, but users can choose other sources (e.g., `close`).
- **CCI MA Type** (`ma_type`):
- **Options**: `SMA`, `EMA`, `SMMA (RMA)`, `WMA`, `VWMA`.
- **Default**: `SMA`.
- **Effect**: Determines the moving average type for CCI signal smoothing. EMA is more responsive; VWMA weights by volume.
- **CCI MA Length** (`ma_length`):
- **Default**: `14`.
- **Range**: Minimum `1`.
- **Effect**: Sets the period for the CCI MA. Longer periods smooth the MA but may delay signals.
### 3.5 RSI Filter Settings
- **Use RSI Filter** (`use_rsi_filter`):
- **Default**: `false`.
- **Effect**: If `true`, applies RSI-based overbought/oversold filters to signals.
- **RSI Length** (`rsi_length`):
- **Default**: `14`.
- **Range**: Minimum `1`.
- **Effect**: Sets the period for RSI calculation. Longer periods reduce sensitivity.
- **RSI Lower Limit** (`rsi_lower_limit`):
- **Default**: `30`.
- **Range**: `0` to `100`.
- **Effect**: Defines the oversold threshold for buy signals. Lower values allow trades in more extreme conditions.
- **RSI Upper Limit** (`rsi_upper_limit`):
- **Default**: `70`.
- **Range**: `0` to `100`.
- **Effect**: Defines the overbought threshold for sell signals. Higher values allow trades in more extreme conditions.
### 3.6 Signal Settings
- **Cross Window** (`cross_window`):
- **Default**: `0`.
- **Range**: `0` to `5` bars.
- **Effect**: Specifies the lookback period for detecting DI+/- or CCI crosses. `0` requires crosses on the current bar; higher values allow recent crosses, increasing signal frequency.
- **Allow Long Trades** (`allow_long`):
- **Default**: `true`.
- **Effect**: Enables/disables new long trades. If `false`, only closing existing longs is allowed.
- **Allow Short Trades** (`allow_short`):
- **Default**: `true`.
- **Effect**: Enables/disables new short trades. If `false`, only closing existing shorts is allowed.
- **Require DI+/DI- Cross for Buy** (`buy_di_cross`):
- **Default**: `true`.
- **Effect**: If `true`, requires a DI+ crossover DI- for buy signals; if `false`, DI+ > DI- is sufficient.
- **Require CCI Cross for Buy** (`buy_cci_cross`):
- **Default**: `true`.
- **Effect**: If `true`, requires a CCI crossover MA for buy signals; if `false`, CCI > MA is sufficient.
- **Require DI+/DI- Cross for Sell** (`sell_di_cross`):
- **Default**: `true`.
- **Effect**: If `true`, requires a DI- crossover DI+ for sell signals; if `false`, DI+ < DI- is sufficient.
- **Require CCI Cross for Sell** (`sell_cci_cross`):
- **Default**: `true`.
- **Effect**: If `true`, requires a CCI crossunder MA for sell signals; if `false`, CCI < MA is sufficient.
- **Countertrade** (`countertrade`):
- **Default**: `true`.
- **Effect**: If `true`, closing a trade triggers an opposite trade (e.g., close long, open short) if allowed.
- **Color Background for Open Trades** (`color_background`):
- **Default**: `true`.
- **Effect**: If `true`, colors the chart background green for long trades and red for short trades.
### 3.7 Exit Settings
- **Use MA Cross for Exit** (`use_ma_exit`):
- **Default**: `true`.
- **Effect**: If `true`, closes trades when the price crosses the exit MA (below for long, above for short).
- **MA Length for Exit** (`ma_exit_length`):
- **Default**: `20`.
- **Range**: Minimum `1`.
- **Effect**: Sets the period for the exit MA. Longer periods delay exits.
- **MA Type for Exit** (`ma_exit_type`):
- **Options**: `SMA`, `EMA`, `SMMA (RMA)`, `WMA`, `VWMA`.
- **Default**: `SMA`.
- **Effect**: Determines the MA type for exit signals. EMA is more responsive; VWMA weights by volume.
- **Use ADX Change Stop-Loss** (`use_adx_stop`):
- **Default**: `false`.
- **Effect**: If `true`, closes trades when the ADX changes by a specified percentage.
- **ADX % Change for Stop-Loss** (`adx_change_percent`):
- **Default**: `5.0`.
- **Range**: Minimum `0.0`, step `0.1`.
- **Effect**: Specifies the percentage change in ADX (vs. previous bar) that triggers a stop-loss. Higher values reduce premature exits.
- **Use Performance Stop-Loss** (`use_perf_stop`):
- **Default**: `false`.
- **Effect**: If `true`, closes trades when the loss exceeds a percentage threshold.
- **Performance Stop-Loss (%)** (`perf_stop_percent`):
- **Default**: `-10.0`.
- **Range**: `-100.0` to `0.0`, step `0.1`.
- **Effect**: Specifies the loss percentage that triggers a stop-loss. More negative values allow larger losses before exiting.
## 4. Visual and Statistical Output
- **Labels**: Displayed at trade entries/exits with arrows (↑ for buy, ↓ for sell) and text ("BUY," "SELL"). A "No Equity" label appears if equity is zero.
- **Background Coloring**: Optionally colors the chart background (green for long, red for short) to indicate open trades.
- **Statistics Table**: Displayed at the top center of the chart, updated on timeframe changes or trade events. Includes:
- **Capital Metrics**: Initial capital, current capital, capital growth (%).
- **Trade Metrics**: Total trades, long/short trades, win rate, long/short win rates, profit factor.
- **Open Trade Status**: Indicates if a long, short, or no trade is open.
## 5. Alerts
- **Buy Signal Alert**: Triggered when `buy_signal` is true ("Cross Buy Signal").
- **Sell Signal Alert**: Triggered when `sell_signal` is true ("Cross Sell Signal").
- **Usage**: Users can set up TradingView alerts to receive notifications for trade signals.

SuperTrade ST1 StrategyOverview
The SuperTrade ST1 Strategy is a long-only trend-following strategy that combines a Supertrend indicator with a 200-period EMA filter to isolate high-probability bullish trade setups. It is designed to operate in trending markets, using volatility-based exits with a strict 1:4 Risk-to-Reward (R:R) ratio, meaning that each trade targets a profit 4× the size of its predefined risk.
This strategy is ideal for traders looking to align with medium- to long-term trends, while maintaining disciplined risk control and minimal trade frequency.
How It Works
This strategy leverages three key components:
Supertrend Indicator
A trend-following indicator based on Average True Range (ATR).
Identifies bullish/bearish trend direction by plotting a trailing stop line that moves with price volatility.
200-period Exponential Moving Average (EMA) Filter
Trades are only taken when the price is above the EMA, ensuring participation only during confirmed uptrends.
Helps filter out counter-trend entries during market pullbacks or ranges.
ATR-Based Stop Loss and Take Profit
Each trade uses the ATR to calculate volatility-adjusted exit levels.
Stop Loss: 1× ATR below entry.
Take Profit: 4× ATR above entry (1:4 R:R).
This asymmetry ensures that even with a lower win rate, the strategy can remain profitable.
Entry Conditions
A long trade is triggered when:
Supertrend flips from bearish to bullish (trend reversal).
Price closes above the Supertrend line.
Price is above the 200 EMA (bullish market bias).
Exit Logic
Once a long position is entered:
Stop loss is set 1 ATR below entry.
Take profit is set 4 ATR above entry.
The strategy automatically exits the position on either target.
Backtest Settings
This strategy is configured for realistic backtesting, including:
$10,000 account size
2% equity risk per trade
0.1% commission
1 tick slippage
These settings aim to simulate real-world conditions and avoid overly optimistic results.
How to Use
Apply the script to any timeframe, though higher timeframes (1H, 4H, Daily) often yield more reliable signals.
Works best in clearly trending markets (especially in crypto, stocks, indices).
Can be paired with alerts for live trading or analysis.
Important Notes
This version is long-only by design. No short positions are executed.
Ideal for swing traders or position traders seeking asymmetric returns.
Users can modify the ATR period, Supertrend factor, or EMA filter length based on asset behavior.
