4-Way EMA Trend4 separate EMAs that are used to determine trend, colored appropriately to reflect the trend to make it easy to tell what the trend is. All 4 EMAs are not needed, you can turn each one on and off individually and the indicator will adjust itself accordingly. Having a single EMA will use the closing price to determine the trend. There are 2 different types of trend detection; EMA Flip and EMA Confluence. EMA Flip is dependent on all active EMAs rising or falling in the correct hierarchical order. The EMA Confluence option is if all EMAs are moving in the same direction. I've found that this second option, EMA Confluence, is more accurate in getting in early before strong movements because the EMAs will more often move in the same direction before they "flip".
ابحث في النصوص البرمجية عن "ema"

Double EMA CROSS
Double EMA CROSS (DEC)
Useful for identifying and receiving alerts about uptrends and downtrends.
This script uses two Exponential Moving Averages (EMAs) to find price uptrends and downtrends.
An Exponential Moving Average ( EMA ) is a type of moving average that places a greater weight and significance on the most recent data points.
The script produces uptrend and downtrend signals based on crossovers and divergences between the two EMAs,
the user will be able to spot a trend change (when the EMAs crossover) and to determine the strength of the current trend (when the EMAs diverge).
It is also posible to get alerts for uptrends and downtrends on the web and mobile app with sound and pop-ups as well as via email.
The optimal time to enter and exit the market can be concluded from this trend changes.
The user can set their own EMAs, by default they are set to 25 and 75 periods for medium and long term respectively.
When the medium term EMA crosses below the long term EMA the asset is in a downtrend and the price will decline, and when the
medium term EMA crosses above the long term EMA the asset is in an uptrend and price will increase.
This scripts plots the following indicators and signals on the chart to help the user to identify trends:
1.- Medium and long term EMAs as lines overlaid on the price chart.
2.- Up green triangles above bars when the price is on an uptrend and down red triangles below bars when the price is on a downtrend.
3.- Arrows with text to indicate the start of an uptrend or downtrend.
The user can enable and disable the indicators and signals as well as set colors and shapes to their liking.
This script also lets the user create alerts for uptrends and downtrends. To create a new alert using this script follow this instructions:
1.- Once you added this script to your chart, go to the alerts panel (right on web or bottom tool bar on the mobile app) and add a new alert (alarm clock icon with a plus sign).
2.- A modal window will open. On the “Condition” dropdown menu select “DEC”.
3.- On the next dropdown menu (right below the “Condition” one) you can select.
4.- Lastly you can set all the normal alert options and create the alert.

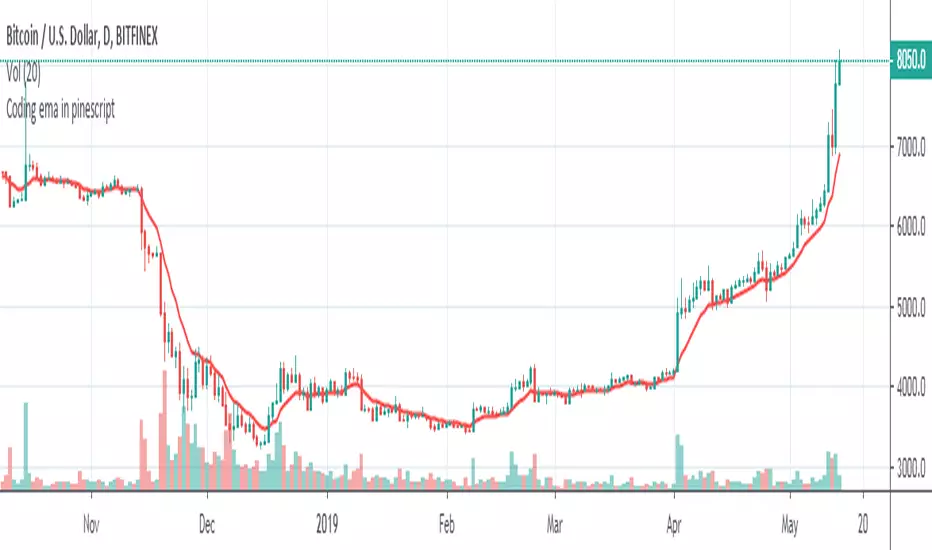
Coding ema in pinescriptWhat is EMA ?
Ema is known as exponential moving average, it comes from the class of weighted moving average. It gives more weightage to the recent price changes, thus making it much more relevant to the current market analysis. Also it provides a dynamic way of calculating support and resistances in a trend following setup.
The most common way to mint profit out from the market is to use trend following setups which can be easily achieved by using a group of EMA’s
So how’s this EMA calculated ?
Before understanding the calculation of EMA let’s look into a much wider topic:
“The Law of Averages”
It states : If you do something often enough a ratio will appear, simply put, any time series data, tend to deviate from its average.
EMA provides a way to statistically calculate the exponential moving average for a provided time series data giving much more emphasis on the most recent data in the series.
So in the 17th century, when the people were playing with numbers in their free time, they came up with a statistical strategy to envelop any time series data to detect the direction of the data flow , they called it exponential moving average.
Later in 1940’s with the increase in signal processing requirements in the field of electronic devices scientists started using Exponential moving average onto the electronic signal followers, just to classify the signals as above or below a moving/dynamic threshold.
So EMA is a smoothed time-series data.
The simplest form of EMA Smoothing can be given by the formula:
S(t) = alpha * X(t) + (1 - alpha) * X(t - 1).
The value of alpha must lie between 0 and 1
Where
alpha , is the smoothing factor
X(t) , is the current observation data point
X(t - 1), is the past observational data point.
t , is the current time
Generally,
In current day trading setups for EMA the alpha is calculated by
alpha = 2 / (time period window + 1)
Things to note here is that the alpha calculated above is the most generally used factor calculation method for EMA ,
You can tweak the alpha function above until it gives value between 0 and 1 for example alpha can also be written as
alpha = ln ( current price / past price )
Note it’s just a weighing scheme,
But for Our Case of EMA
We will be using
alpha = 2 / (time period window + 1)
Please refer to the script code below
Alper-EMAAlper-EMA
Description:
This indicator allows you to display 5 customizable EMAs (Exponential Moving Averages) on a single chart. Each EMA can be configured independently with length, color, visibility, and calculation timeframe.
Features:
5 fully customizable EMAs
Set individual length and color for each EMA
Toggle visibility for each EMA
Multi-timeframe calculation: e.g., display EMA300 calculated on a 30-minute timeframe while viewing a 1-minute chart
Labels display EMA period and timeframe for clarity
Adjustable label size: tiny / small / normal / large
Clear and readable plot lines
Use Cases:
Monitor multiple timeframe EMAs simultaneously
Analyze trend and support/resistance levels
Track EMA crossovers for strategy development
Note:
This indicator is suitable for both short-term (scalping) and medium-to-long term analysis. The multi-timeframe feature allows you to see different EMA perspectives on a single chart quickly.

Daily 12/21 EMA OverlayDaily 12/21 EMA Overlay
This indicator projects the daily 12 and 21 EMAs onto any timeframe as a soft, semi-transparent band. It is designed to give a constant higher-timeframe bias and dynamic support/resistance reference while you execute your systems on lower timeframes (4H, 1H, 15m, etc.).
The script uses request.security() to calculate the 12/21 EMAs on the daily chart only, then overlays those values on your current timeframe without recalculating them locally. This means the band always represents the true daily 12/21 EMAs, regardless of the chart you are viewing.
Key Features:
Fixed daily 12/21 EMA band, visible on all timeframes
Faded lines and fill to keep focus on your active intraday tools
Simple, minimal inputs (fast length, slow length, colors, band visibility)
Ideal as a higher-timeframe “backdrop” for systems built around EMA trend, rejections, or liquidity sweeps
How to Use
Add the indicator on any symbol and timeframe
Keep your normal intraday EMAs (e.g., EMA 12/21) for execution
Note: You can change the bands to not just be 12 or 21, you can change them if needed for your own systems or emas that you use.
This tool is intentionally lightweight: it does one job—showing the true daily EMA structure across all timeframes—and leaves trade execution logic to your primary system.

Smoothed EMA LinesThe "Smoothed EMA Lines" script is a technical analysis tool designed to help traders identify trends and potential support/resistance levels in financial markets. The script plots exponential moving averages (EMAs) of the closing price for five commonly used time periods: 8, 13, 21, 55, and 200.
Key features of the script include:
Overlay: The EMAs are plotted directly on the price chart, making it easy to analyze the relationship between the moving averages and price action.
Smoothing: The script applies an additional smoothing function to each EMA, using a simple moving average (SMA) of a user-defined length. This helps to reduce noise and provide a clearer picture of the trend.
Customizable lengths: Users can easily adjust the length of each EMA and the smoothing period through the script's input parameters.
Color-coded plots: Each EMA is assigned a unique color (8: blue, 13: green, 21: orange, 55: red, 200: purple) for easy identification on the chart.
Traders can use the "Smoothed EMA Lines" script to:
Identify the overall trend direction (bullish, bearish, or neutral) based on the arrangement of the EMAs.
Spot potential support and resistance levels where the price may interact with the EMAs.
Look for crossovers between EMAs as potential entry or exit signals.
Combine the EMA analysis with other technical indicators and price action patterns for a more comprehensive trading strategy.
The "Smoothed EMA Lines" script provides a clear, customizable, and easy-to-interpret visualization of key exponential moving averages, helping traders make informed decisions based on trend analysis.

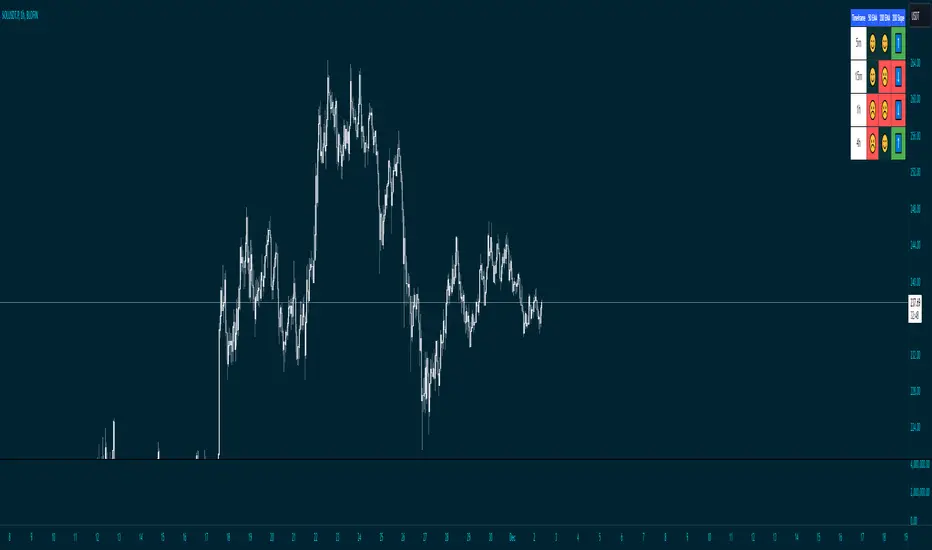
Price Above 50 and 200 EMA with Smiley faces and 200 ema slope
Overview
This advanced indicator provides a comprehensive multi-timeframe analysis of price positioning relative to 50 and 200 Exponential Moving Averages (EMAs), offering traders a quick and intuitive view of market trends across different timeframes.
Key Features
Multi-Timeframe Analysis: Simultaneously evaluates price behavior across 5m, 15m, and other selected timeframes
EMA Trend Visualization: Instantly shows whether price is above or below 50 and 200 EMAs
Slope Direction Indicator: Tracks the directional momentum of the 200 EMA
Customizable Distance Metrics: Option to display distances as absolute values or percentages
Emoji-Based Indicators: Quick visual representation of price positioning
Functionality
The indicator uses color-coded and emoji-based signals to represent:
😊 (Blue): Price is above the EMA
☹️ (Red): Price is below the EMA
⬆️ (Blue): EMA slope is positive
⬇️ (Red): EMA slope is negative
Customization Options
Adjustable EMA periods
Togglable distance display
Distance representation (percentage or absolute value)
Best Used For
Trend identification
Multi-timeframe analysis
Quick market sentiment assessment
Supplementing other technical analysis tools
Recommended Timeframes
Intraday trading
Swing trading
Trend following strategies
Risk Disclaimer
This indicator is a tool for analysis and should not be used in isolation for trading decisions. Always combine with other technical and fundamental analysis, and proper risk management.
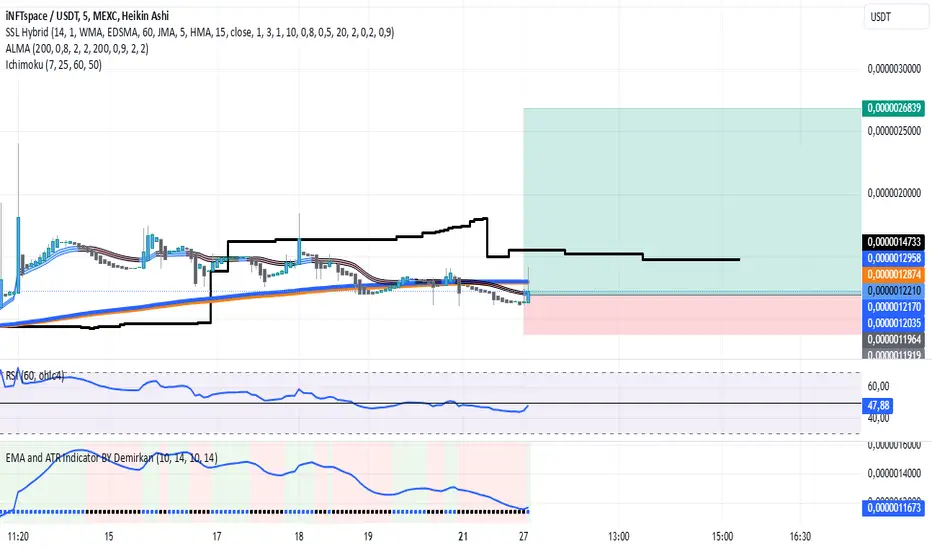
EMA and ATR Indicator BY DemirkanEMA 10 and ATR Indicator BY Demirkan
The EMA 10 and ATR Indicator combines two powerful technical indicators used to analyze trends and identify potential trading opportunities.
Indicator Components:
Exponential Moving Average (EMA):
EMA 10: Calculates the weighted average of the last 10 closing prices. This indicator is effective in tracking short-term price movements. When the price is above the EMA, it is considered that the trend is upward; when it is below, it is assessed as a downward trend.
Average True Range (ATR):
ATR: A measure of market volatility. When the ATR value falls within a specified range (between 10 and 14 in this indicator), the price movement is considered significant. This helps you base your trading decisions on more solid grounds.
Usage Recommendations:
Buy Signal: When the price is above the EMA and the ATR is within the specified range, this can be interpreted as a potential buy signal.
Sell Signal: When the price is below the EMA, this can be interpreted as a potential sell signal.
Chart Displays:
EMA Line: Displayed as a blue line, allowing you to see how the EMA relates to current price levels.
Price Status: Circles are used to indicate whether the price is above or below the EMA. A green circle indicates the price is above the EMA, while a red circle indicates it is below.
Background Colors: The chart background changes to green or red to highlight buy and sell conditions.
Aesthetic Presentation:
Using the "Flag" and "Below" parameters for the Price vs EMA indicator provides an aesthetically pleasing appearance on the chart. This type of visual presentation helps users quickly and easily grasp trading signals. Additionally, this aesthetic touch makes investors' charts look more professional and appealing.
This indicator is a useful tool for traders looking to develop short-term trading strategies. However, it should always be used in conjunction with additional analysis and other indicators.
Note: This indicator is for educational purposes only and should not be taken as investment advice.
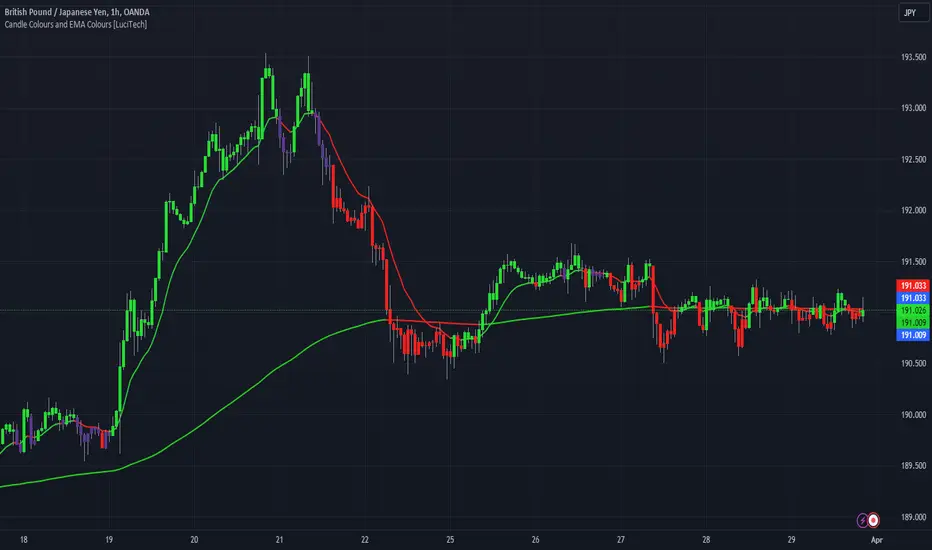
Candle Colours and EMA Colours [LuciTech]this indicator assigns a colour to each candle based on the relationship between the price and the EMAs, The indicator first checks whether the close price is above or below the first EMA, If the close price is above the first EMA the candle is coloured green. If the close price inbetween both EMAs the candle is colored gray. If the close price is below the second EMA, the candle is coloured red.
the indicator also colours the EMAs based on the closed price, if closed price is above the EMAs its coloured green and if price is closed below the EMA is coloured red.
The colours of the candles and EMAs can be changed in "style" and the periods of the EMAs can be changed in inputs.
[FC] Multi EMA Cross Alerts Fltered with RSI and StochThis script prints Green Dots and Red Dots on candle close using Faster EMA ( 5 ) and Slower EMA (10 ) filtering with RSI (50)+ Stochastic %K ( 20 to 80 ) Smoothning(3).
The idea behind is to you use dots for scalping on smaller timeframe(5) ,(10) etc but you can modify all values to better fit your needs.
Explaination for Green Dots and Red Dots:
---> Green dot : 5 Ema crosses above 10 Ema ( i.e faster EMA crosses above slower EMA which signals price is trying to move up
RSI value > 50 (filtering for quick move)
stoch %k value between 20 and 80 ( filtering to know there is leg left in the move and all movement is already not done)
---> Red dot : 5 Ema crosses below 10 Ema ( i.e faster EMA crosses above slower EMA which signals price is trying to move down
RSI value < 50 (filtering for quick move)
stoch %k value between 20 and 80 ( filtering to know there is leg left in the move and all movement is already not done)

Triple EMA Scalper low lag stratHi all,
This strategy is based on the Amazing scalper for majors with risk management by SoftKill21
The change is in lines 11-20 where the sma's are replaced with Triple ema's to
lower the lag.
The original author is SoftKill21. His explanation is repeated below:
Best suited for 1M time frame and majors currency pairs.
Note that I tried it at 3M time frame.
Its made of :
Ema ( exponential moving average ) , long period 25
Ema ( exponential moving average ) Predictive, long period 50,
Ema ( exponential moving average ) Predictive, long period 100
Risk management , risking % of equity per trade using stop loss and take profits levels.
Long Entry:
When the Ema 25 cross up through the 50 Ema and 100 EMA . and we are in london or new york session( very important the session, imagine if we have only american or european currencies, its best to test it)
Short Entry:
When the Ema 25 cross down through the 50 Ema and 100 EMA , and we are in london or new york session( very important the session, imagine if we have only american or european currencies, its best to test it)
Exit:
TargetPrice: 5-10 pips
Stop loss: 9-12 pips

Price Action and 3 EMAs Momentum plus Sessions FilterThis indicator plots on the chart the parameters and signals of the Price Action and 3 EMAs Momentum plus Sessions Filter Algorithmic Strategy. The strategy trades based on time-series (absolute) and relative momentum of price close, highs, lows and 3 EMAs.
I am still learning PS and therefore I have only been able to write the indicator up to the Signal generation. I plan to expand the indicator to Entry Signals as well as the full Strategy.
The strategy works best on EURUSD in the 15 minutes TF during London and New York sessions with 1 to 1 TP and SL of 30 pips with lots resulting in 3% risk of the account per trade. I have already written the full strategy in another language and platform and back tested it for ten years and it was profitable for 7 of the 10 years with average profit of 15% p.a which can be easily increased by increasing risk per trade. I have been trading it live in that platform for over two years and it is profitable.
Contributions from experienced PS coders in completing the Indicator as well as writing the Strategy and back testing it on Trading View will be appreciated.
STRATEGY AND INDICATOR PARAMETERS
Three periods of 12, 48 and 96 in the 15 min TF which are equivalent to 3, 12 and 24 hours i.e (15 min * period / 60 min) are the foundational inputs for all the parameters of the PA & 3 EMAs Momentum + SF Algo Strategy and its Indicator.
3 EMAs momentum parameters and conditions
• FastEMA = ema of 12 periods
• MedEMA = ema of 48 periods
• SlowEMA = ema of 96 periods
• All the EMAs analyse price close for up to 96 (15 min periods) equivalent to 24 hours
• There’s Upward EMA momentum if price close > FastEMA and FastEMA > MedEMA and MedEMA > SlowEMA
• There’s Downward EMA momentum if price close < FastEMA and FastEMA < MedEMA and MedEMA < SlowEMA
PA momentum parameters and conditions
• HH = Highest High of 48 periods from 1st closed bar before current bar
• LL = Lowest Low of 48 periods from 1st closed bar from current bar
• Previous HH = Highest High of 84 periods from 12th closed bar before current bar
• Previous LL = Lowest Low of 84 periods from 12th closed bar before current bar
• All the HH & LL and prevHH & prevLL are within the 96 periods from the 1st closed bar before current bar and therefore indicative of momentum during the past 24 hours
• There’s Upward PA momentum if price close > HH and HH > prevHH and LL > prevLL
• There’s Downward PA momentum if price close < LL and LL < prevLL and HH < prevHH
Signal conditions and Status (BuySignal, SellSignal or Neutral)
• The strategy generates Buy or Sell Signals if both 3 EMAs and PA momentum conditions are met for each direction and these occur during the London and New York sessions
• BuySignal if price close > FastEMA and FastEMA > MedEMA and MedEMA > SlowEMA and price close > HH and HH > prevHH and LL > prevLL and timeinrange (LDN&NY) else Neutral
• SellSignal if price close < FastEMA and FastEMA < MedEMA and MedEMA < SlowEMA and price close < LL and LL < prevLL and HH < prevHH and timeinrange (LDN&NY) else Neutral
Entry conditions and Status (EnterBuy, EnterSell or Neutral)(NOT CODED YET)
• ENTRY IS NOT AT THE SIGNAL BAR but at the current bar tick price retracement to FastEMA after the signal
• EnterBuy if current bar tick price <= FastEMA and current bar tick price > prevHH at the time of the Buy Signal
• EnterSell if current bar tick price >= FastEMA and current bar tick price > prevLL at the time of the Sell Signal

ALMA & EMA Ribbon by zdmreThis indicator combines a unique trend-following signal with a classic EMA ribbon to provide a clear view of the market trend.
The main signal line is not based on a typical ATR. Instead, it uses an Arnaud Legoux Moving Average (ALMA) as its baseline and calculates support/resistance bands using Standard Deviation. This creates a responsive trend line that adapts well to volatility. This is paired with a simple EMA Ribbon to help confirm momentum.
What It Does
ALMA + SD Trend Line: This is the core of the indicator. It uses an ALMA as the baseline (instead of a simple MA) and Standard Deviation for the bands. This tends to be more responsive than many traditional trend-following indicators.
Buy/Sell Signals: Simple "B" and "S" labels appear on your chart when the trend is calculated to have changed direction.
EMA Ribbon: A standard Fast/Slow EMA ribbon is plotted to give you a secondary confirmation of momentum. The fill between the EMAs changes color (green for bull, red for bear).
On-Screen Dashboard: A clean info panel in the corner shows you the current status of all components at a glance:
Current Signal (Long/Short)
Price vs. Trend Line (Above/Below)
Trend Strength (%)
EMA Trend (Bullish/Bearish)
Momentum
Fully Customizable: You can toggle every visual element on or off (the signals, the ribbon, the bar coloring, the dashboard) to keep your chart clean.
Settings
Trend Settings:
Factor: This is the main setting. It's the Standard Deviation multiplier. A higher value makes the line less sensitive (fewer signals). A lower value makes it more sensitive (more signals).
SD Length: The lookback for the Standard Deviation.
ALMA Settings:
ALMA Length, Sigma, Offset: Standard controls for the ALMA's smoothness and responsiveness.
EMA Ribbon:
Fast EMA & Slow EMA: Set the lengths for your ribbon.
Visual Settings:
Checkboxes to toggle all visual components (signals, ribbon, dashboard, etc.).
You can set up alerts in TradingView for the following events:
🟢 Long Signal: Triggers on a new "B" (Buy) signal.
🔴 Short Signal: Triggers on a new "S" (Sell) signal.
⚠️ Price Crossed Trend: Triggers any time the price closes across the main trend line.
#DYOR

EMA Regime (9/20/50/100/200) — Stacked with 200 FilterEMA Regime (9/20/50/100/200) — Stacked Long/Short Box
Plots the 9, 20, 50, 100, and 200 EMAs on the chart.
Checks if price is above or below each EMA and whether the EMAs are stacked in order.
LONG signal: price above all selected EMAs and EMAs stacked 9 > 20 > 50 > 100 >(> 200 if strict mode on).
SHORT signal: price below all selected EMAs and EMAs stacked 9 < 20 < 50 < 100 (< 200 if strict mode on).
Shows a two-row table (LONGS / SHORTS) so you can quickly see which EMAs are aligned.
Optionally colors candles green/red when a full long/short regime is active.
Can show labels when a new LONG or SHORT condition appears.
Has alerts you can use for automated notifications when the regime flips.
“Use 200 EMA in the stack” lets you choose ultra-strict mode (9>20>50>100>200) or lighter mode (9>20>50>100 but price & 9 above 200).

EMA ± ATR Channel (True Range)EMA ± ATR Channel (True Range)
Tagline: Adaptive EMA channel with ATR-based volatility bands — perfect for swing trading, intraday setups, and managing risk on high-volatility stocks.
This script plots a dynamic price channel around a configurable EMA using the Average True Range (ATR, Wilder’s True Range) as a volatility buffer.
Upper band = EMA + (ATR × multiplier)
Lower band = EMA – (ATR × multiplier)
📊 Features:
Adjustable EMA length, ATR length, and ATR multiplier
Visual channel fill between upper and lower bands
Optional on-chart help panel with practical combos
⚡ Practical Combos for Volatile Stocks:
EMA 20 + ATR 14 × 2.0 → most common swing trading setup
EMA 10 + ATR 14 × 1.5 → very responsive, good for intraday/high-beta names
EMA 20 + ATR 20 × 2.5 → smoother, wider channel, avoids whipsaws in chaotic stocks
✅ Use cases:
Identify dynamic support/resistance zones
Volatility-based stop-loss & take-profit placement
Spot overextensions from the trend midline
🔖 Tags:
ema, atr, channel, volatility, trend, support resistance, stop loss, swing trading, intraday, risk management, indicator

EMA 9 vs 21 Spread VarianceEMA 9 vs 21 Spread Variance
What it does
Tracks the distance between EMA 9 and EMA 21, then measures how volatile that distance has been over your chosen lookback. The indicator plots the EMA spread around zero and a rolling variance of that spread. Rising variance signals expanding dispersion between the fast and slow EMAs, which often precedes momentum bursts or regime shifts. Falling variance points to compression and mean-reversion conditions.
How it is calculated
Fast EMA and slow EMA are computed on the selected source.
Spread = EMA9 minus EMA21, plotted around zero.
Variance = rolling variance of the spread over Variance Lookback. Variance is always non-negative.
For readability you can show the variance either on its raw scale, or fitted to the spread’s recent range so both lines are comparable in one pane.
How to read it
Spread near zero with variance rising suggests an impending expansion from balance.
Large positive spread with elevated variance confirms a strong up-trend that is still dynamic.
Large negative spread with elevated variance confirms a strong down-trend that is still dynamic.
Variance rolling over after a run warns that momentum dispersion is cooling and that a consolidation or pullback is likely.
The horizontal zero line applies to the spread only. Variance does not cross zero.
Inputs
Source: price series for EMAs.
Fast EMA Length and Slow EMA Length: defaults 9 and 21.
Variance Lookback: window for the spread variance, common ranges 20 to 100 on intraday charts and 50 to 200 on higher timeframes.
Show spread line and Fit variance to spread scale: display controls.
Suggested use
Combine with your breakout logic. Look for variance expansion from low levels as a filter before taking continuation entries.
Use as a volatility context for EMA cross systems. Crosses that occur with rising variance tend to travel farther than crosses that occur during compression.
Caveats
Variance reacts to spikes in the spread, so it can jump around news bars. Smoothing reduces noise but adds lag. Consider pairing with ATR or session filters if you only want signals during liquid hours.
Weekly and Daily EMA levelsThis Pine Script indicator provides important weekly and daily levels for lower time frame traders, whom trades based on reaction of these levels.
Dedicated to Prof Michael G
Key Features:
Multi-timeframe EMAs: Shows 12, 21, 50, 100, and 200 period EMAs from both Weekly and Daily timeframes
Horizontal dotted lines: Uses plot.style_linebr to create the dotted/dashed line effect
Works on all timeframes: The lines will appear on any chart timeframe you're viewing
Customizable: Individual toggles for each EMA period and timeframe
Settings Available:
Toggle Weekly/Daily EMAs on/off
Enable/disable individual EMA periods (12, 21, 50, 100, 200)
Customize colors for each EMA line
Adjust line width
Optional labels showing current EMA values
How to Use:
Copy the code into TradingView's Pine Editor
Click "Add to Chart"
Adjust settings in the indicator's Style tab as needed
The weekly EMAs appear with slightly more opacity (30%) while daily EMAs have higher transparency (60%) to help distinguish between timeframes. The lines will automatically update as new bars form and will be visible regardless of what timeframe you're currently viewing on your chart.

Trend Finding by EMAsINTRO
This indicator is a price action based tool used to visualize trends using Exponential Moving Averages (EMAs).
CONCEPTS
It's created with two EMAs with different lengths (9 and 15) based on user-defined parameters. The script calculates the EMAs for the given lengths using the closing prices of the asset.
The EMAs are plotted on the chart, and their colors are dynamically determined by a conditional statement. If slower EMA is crossing above the faster EMA than the color will be change, And vise-versa for the opposite.
USES:-
The visualization of EMAs in different colors assists in identifying potential trends:
a bullish trend when EMAs color is Blue
and a bearish trend when EMAs color are Red.
Purpose
This script provides a quick visual representation of potential trend changes based on the relationship between these two EMAs.

Short Selling EMA Cross (By Coinrule)BINANCE:AVAXUSDT
This short selling script works best in periods of downtrends and general bearish market conditions, with the ultimate goal to sell as the the price decreases further and buy back before a rebound.
This script can work well on coins you are planning to hodl for long-term and works especially well whilst using an automated bot that can execute your trades for you. It allows you to hedge your investment by allocating a % of your coins to trade with, whilst not risking your entire holding. This mitigates unrealised losses from hodling as it provides additional cash from the profits made. You can then choose to to hodl this cash, or use it to reinvest when the market reaches attractive buying levels.
Entry
The exponential moving average ( EMA ) 20 and EMA 50 have been used for the variables determining the entry to the short. EMAs can operate better than simple moving averages due to the additional weighting placed on the most recent data points, whereas simple moving averages weight all the data the same. This means that price is tracked more closely and the most recent volatile moves can be captured and exploited more efficiently using EMAs.
Our backtesting data revealed that the most profitable timeframe was the 30-minute timeframe, this also enabled a good frequency of trades and high profitability.
A fast (shorter term) exponential moving average , in this strategy the EMA 20, crossing under a slow (longer term) moving average, in this example the EMA 50, signals the price of an asset has started to trend to the downside, as the most recent data signals price is declining compared to earlier data. The entry acts on this principle and executes when the EMA 20 crosses under the EMA 50.
Enter Short: EMA 20 crosses under EMA 50.
Exit
This script utilises a take profit and stop loss for the exit. The take profit is set at -8% and the stop loss is set at +16% from the entry price. This would normally be a poor trade due to the risk:reward equalling 0.5. However, when looking at the backtesting data, the high profitability of the strategy (93.33%) leads to increased confidence and showcases the high probability of success according to historical data.
The take profit (-8%) and the stop loss (+16%) of the strategy are widely placed to ensure the move is captured without being stopped out due to relief rallies. The stop loss also plays a role of mitigating losses and minimising risk of being stuck in a short position once there has been a fundamental trend reversal and the market has become bullish .
Exit Short: -8% price decrease from entry price.
OR
Exit Short: +16% price increase from entry price.
Tip: Research what coins have consistent and large token unlocks / highly inflationary tokenomics, and target these during bear markets to short as they will most likely have substantial selling pressure that outweighs demand - leading to declining prices.
The strategy assumes each order is using 30% of the available coins to make the results more realistic and to simulate you only ran this strategy on 30% of your holdings. A trading fee of 0.1% is also taken into account and is aligned to the base fee applied on Binance.
The backtesting data was recorded from December 1st 2021, just as the market was beginning its downtrend. We therefore recommend analysing the market conditions prior to utilising this strategy as it operates best on weak coins during downtrends and bearish conditions.

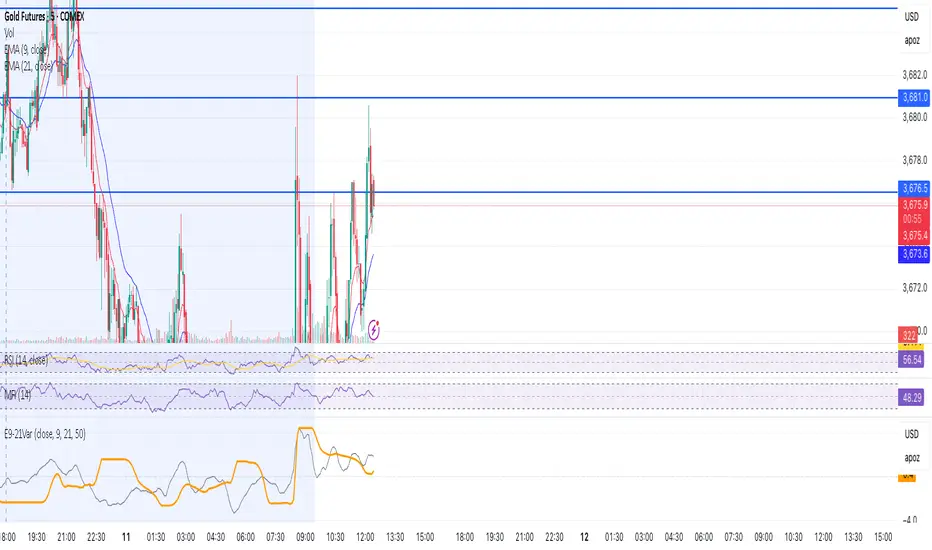
Ema Change speed specialEMA değişim hızını rakamsal olarak gösterir ve grafiğini çizer.
Yeşil = Mevcut fiyat seçili EMA nın üzerinde. EMA yukarı çıkıyor.
Kırmızı = Mevcut fiyat seçili EMA nın altında. EMA düşüyor.
-----------------------------------------
This is showing EMA change speed, as numerical and on the graph.
Green = Current price is above the selected ema . EMA going up.
Red = Current price is below the selected ema . EMA going down.
By Werrasd508
SAR+RSI+EMAs SignalsNOTE:
Indicator based strategies may expire and begin to work again. There are various ways to check the expiration of these strategies but I suggest equity curve trading (EC trading) as the best one.
Please check every single indicator based strategy to see if it’s still profitable or it has been expired to avoid losses.
Principles:
I personally believe every profitable indicator-based setup need 3 factors. Actually I analyze indicator-based set up in this way!
1- Trend detector: a tool that detect the “trend”.
2- Oscillators (Discount finder): a tool that detects “discounts” in the direction of the trend.
3- Stimulus: A tool that indicates the Initiation of a movement.
There may be profitable strategies that do not use all three, because other factors are strong enough to lead us to profit, but they are rare and sometimes they hide the other forgotten factor in the main two ones.
Elements:
(Since most of traders here, are familiar with these famous indicators I will not take your time to write about their uses and formula)
SAR: As a Trend detector, regarding position of close and SAR
EMA 7 and EMA 21: As trend detectors, regarding position of EMA 7 as fast “moving average” and EMA 21 as slow one. Also we need another confirmation for trend regarding EMA 7 and closing price of the signal candle.
RSI: In this strategy RSI is used both as a discount finder and a stimulus.
For RSI being over/under 50, regarding the trend, a possible discount may have been occurred. Imagine these conditions: close>EMA7, EMA7>EMA21, close>SAR and simultaneously RSI being under 50 is really a sign of powerful uptrend which it’s RSI decreasing might be a sign of corrective move, which will be following a bullish impulsive move.
The other use of RSI is to stimulate a buy signal by “crossing” over 50 or 30 (50 as balanced point of momentum and 30 as a sign of ending an oversold) or stimulate a sell signal by “crossing” under 50 or 70 (50 as balanced point of momentum and 70 as a sign of ending an overbought).
Entry point: you can use one of the followings.
1- Open of the next candle
2- EMA 7
3- Open of the signal candle
(Totally optional but “open of the next candle” is suggested by me.)
SL: Use one of the followings.
1- SAR or some pips (regarding ATR Or your experience of this trading instrument’s fluctuations in this time frame) below the SAR
2- Fixed amount (regarding ATR Or your experience of this trading instrument’s fluctuations in this time frame)
3- Use EMA21 as dynamic SL (if a candle far enough from the initiative candle close over (for sell) below ( for buy)
Again number 1 is suggested by me.
TP: Use one of the followings.
1- Use static levels or zones of support and resistance as TP.
2- Use dynamic levels for instance band of BB or moving averages (Moving the SL is possible).
3- Use fixed R to R
And I believe static zones of support and resistance work better.
Examples:
I indicate a buy signal on the chart!
Using local level as TP worked just good.
Using EMA was better in this case.
And using a riskier level or a fixed R to R is obvious in the chart!
Since in the range markets, this strategy may not work well and at the same time, TP to SL might be too small to be worth the risk, I prefer to use levels to filter range market conditions!
I convert all those circumstances to a simple buy and sell signs on the chart!
EMA21 and SAR are still visible because it is possible that traders use them for their TP and SL.
This is how it look without EMA21 and SAR!
Another screenshot of this strategy!
I also add a check box to filter signals by another trend detector. MATD created by me to help traders detect trend!
As it’s visible, some profitable signals filtered too, but using a longer-term trend detector as an additional one, alongside the double EMAs is very useful for this strategy.
The other box “use high&low instead of close for fast EMA” makes the “EMA7 and close” trend detector an easygoing one!
Almost everything is editable here!
*** I did not invent this strategy, you can find it for free on net ***
I'll change it to a "strategy" instead of an indicator if reader like to!

EMA RSI Premium CleanEMA + RSI • Premium Clean is a minimalist trend-following and momentum confirmation tool designed for traders who prefer clarity over clutter.
This indicator combines:
Exponential Moving Averages (EMA) to define the dominant market trend
Relative Strength Index (RSI) to time pullbacks and momentum exhaustion
The goal is not to predict the market, but to trade in harmony with the trend and avoid low-probability entries.
🔍 How It Works
🔹 Trend Identification (EMA)
The Fast EMA reacts quickly to price changes
The Slow EMA represents the broader trend
When the fast EMA is above the slow EMA, bullish market bias is present
When the fast EMA is below the slow EMA, bearish market bias is present
🔹 Entry Context (RSI)
RSI helps identify healthy pullbacks within a trend
In bullish trends, RSI pullbacks indicate potential continuation zones
In bearish trends, RSI rebounds highlight possible continuation to the downside
Signals appear only when trend and momentum align, reducing random trades.
🎯 Best Use Case
Trend-following strategies
Pullback entries
Avoiding counter-trend trades
Intraday & swing trading
⏱ Recommended Markets & Timeframes
Markets: Gold (XAUUSD), Forex, Crypto
Timeframes: M15, M30, H1, H4
⚠️ Important Notes
This indicator does not repaint
Signals are context-based, not guaranteed trades
Best results are achieved when combined with:
Market structure
Support & resistance
Proper risk management
✨ Visual Design
Clean and modern color palette
Minimal arrows to avoid chart clutter
RSI displayed separately for clear momentum analysis
Optimized for both dark and light chart themes
🧠 Trading Philosophy
Trade the trend.
Use momentum for timing.
Keep the chart clean.

EMA 21 Pullback - Swing Break (Single Signal)EMA 21 Pullback Swing Break – Single Entry Indicator
This indicator is designed for traders who prefer clean, structure-based entries
instead of frequent signals.
LOGIC:
1. EMA 21 defines the trend direction.
2. Price must pull back to EMA 21 (mandatory).
3. After pullback, an internal swing is formed.
4. Entry signal is generated only when that swing is broken.
5. Only ONE signal is allowed per EMA pullback.
6. Next signal appears only after price touches EMA again.
BUY CONDITIONS:
- Price above EMA 21
- Pullback to EMA 21
- Internal swing high formed after pullback
- Candle closes above that swing high
SELL CONDITIONS:
- Price below EMA 21
- Pullback to EMA 21
- Internal swing low formed after pullback
- Candle closes below that swing low
FEATURES:
✔ No repaint
✔ Structure-based entries
✔ Single signal per pullback
✔ Works best in trending markets
✔ Avoids sideways noise
BEST USE:
- Index trading (NIFTY, BANKNIFTY, SENSEX)
- Timeframes: 3m, 5m, 15m
- Combine with price action or higher timeframe trend
DISCLAIMER:
This indicator is for educational purposes only.
Always use proper risk management.
