EMAGAIN Strategy FREE - CryptoProToolsSet Buy and Sell triggers based on the EMAGain indicator.
Strategy version for backtesting
ابحث في النصوص البرمجية عن "ema"
Best SuperTrend LTCUSDIf you want get access for super Trend with the best and optimum values for:
LTCUSD profit +%120
ETHUSD profit +%80 aka Best SuperTrend ETHUSD chart 30m
OMGUSD profit +%115
BCHUSD profit +%80
LTCUSD profit +%125
(XRP,DASH coming soon, these profits include trading fee %0.2)
Fee 0.015BTC per week
Contact me by chat for a free demo
LTCUSD

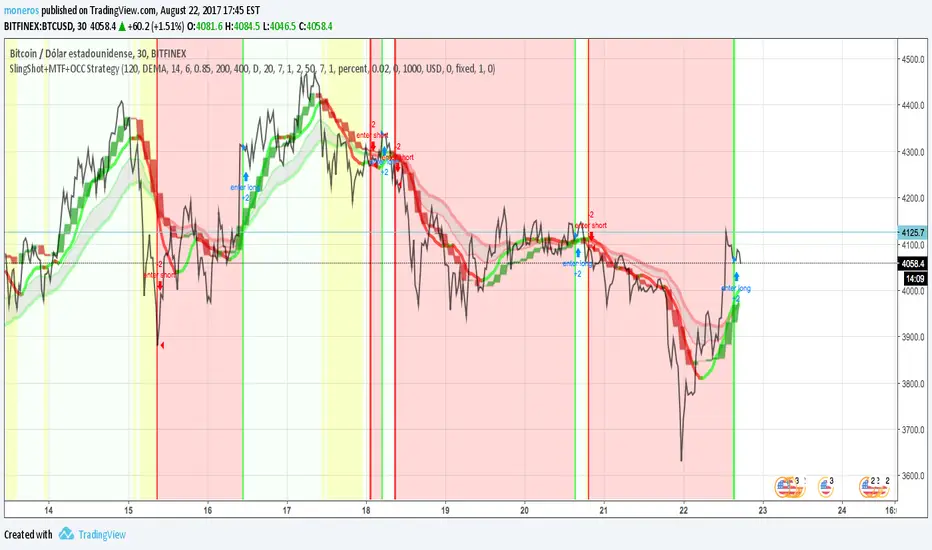
SlingShot + MTF + Open Close Cross StrategyIt's a merge of three really good scripts CM sling shot, CM MTC and Open Close Cross
Indicates open and close with Sling shot and shots after peaks by MTC and OCC.
Yellow zones before drop prices, green bar, red bar for open and close.
imgur.com
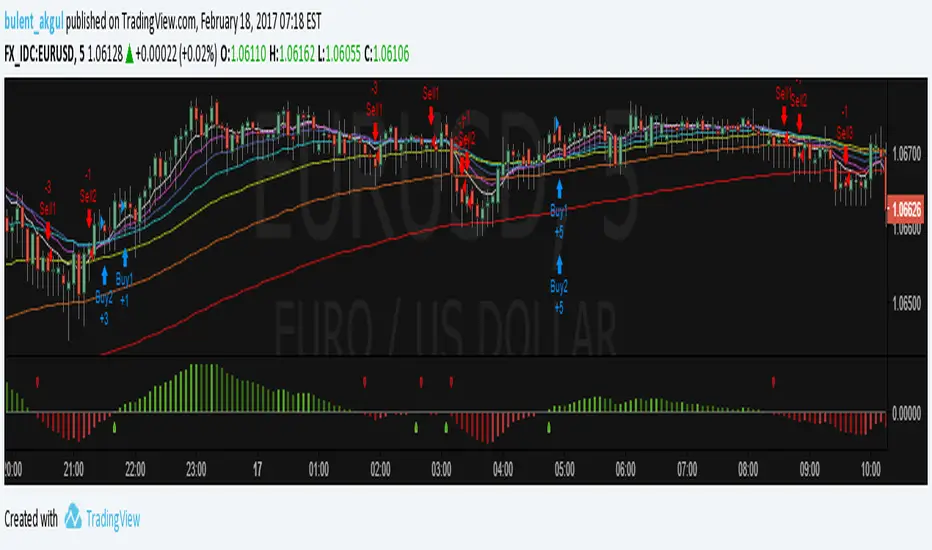

MA Cross - ***Programmers*** Please help with alertcondition() Hello Traders and coders,
Here is a fundamental version of a moving average cross trading strategy that works on 1H and 4H timeframes.
It's very simple and would be well paired with proper technical analysis and risk management.
I am looking to use this to alert me of potential setups. I could not get the alertcondition function to work properly. If anyone can help me with that please comment or message me.
Quantum Reversal Engine [ApexLegion]Quantum Reversal Engine
STRATEGY OVERVIEW
This strategy is constructed using 5 custom analytical filters that analyze different market dimensions - trend structure, momentum expansion, volume confirmation, price action patterns, and reversal detection - with results processed through a multi-component scoring calculation that determines signal generation and position management decisions.
Why These Custom Filters Were Independently Developed:
This strategy employs five custom-developed analytical filters:
1. Apex Momentum Core (AMC) - Custom oscillator with volatility-scaled deviation calculation
Standard oscillators lag momentum shifts by 2-3 bars. Custom calculation designed for momentum analysis
2. Apex Wick Trap (AWT) - Wick dominance analysis for trap detection
Existing wick analysis tools don't quantify trap conditions. Uses specific ratios for wick dominance detection
3. Apex Volume Pulse (AVP) - Volume surge validation with participation confirmation
Volume indicators typically use simple averages. Uses surge multipliers with participation validation
4. Apex TrendGuard (ATG) - Angle-based trend detection with volatility band integration
EMA slope calculations often produce false signals. Uses angle analysis with volatility bands for confirmation
5. Quantum Composite Filter (QCF) - Multi-component scoring and signal generation system
Composite scoring designed to filter noise by requiring multiple confirmations before signal activation.
Each filter represents mathematical calculations designed to address specific analytical requirements.
Framework Operation: The strategy functions as a scoring framework where each filter contributes weighted points based on market conditions. Entry signals are generated when minimum threshold scores are met. Exit management operates through a three-tier system with continued signal strength evaluation determining position holds versus closures at each TP level.
Integration Challenge: The core difficulty was creating a scoring system where five independent filters could work together without generating conflicting signals. This required backtesting to determine effective weight distributions.
Custom Filter Development:
Each of the five filters represents analytical approaches developed through testing and validation:
Integration Validation: Each filter underwent individual testing before integration. The composite scoring system required validation to verify that filters complement rather than conflict with each other, resulting in a cohesive analytical framework that was tested during the development period.
These filters represent custom-developed components created specifically for this strategy, with each component addressing different analytical requirements through testing and parameter adjustment.
Programming Features:
Multi-timeframe data handling with backup systems
Performance optimization techniques
Error handling for live trading scenarios
Parameter adaptation based on market conditions
Strategy Features:
Uses multi-filter confirmation approach
Adapts position holding based on continued signal strength
Includes analysis tools for trade review and optimization
Ongoing Development: The strategy was developed through testing and validation processes during the creation period.
COMPONENT EXPLANATION
EMA System
Uses 8 exponential moving averages (7, 14, 21, 30, 50, 90, 120, 200 periods) for trend identification. Primary signals come from 8/21 EMA crossovers, while longer EMAs provide structural context. EMA 1-4 determine short-term structure, EMA 5-8 provide long-term trend confirmation.
Apex Momentum Core (AMC)
Built custom oscillator mathematics after testing dozens of momentum calculation methods. Final algorithm uses price deviation from EMA baseline with volatility scaling to reduce lag while maintaining accuracy across different market conditions.
Custom momentum oscillator using price deviation from EMA baseline:
apxCI = 100 * (source - emaBase) / (sensitivity * sqrt(deviation + 1))
fastLine = EMA(apxCI, smoothing)
signalLine = SMA(fastLine, 4)
Signals generate when fastLine crosses signalLine at +50/-50 thresholds.
This identifies momentum expansion before traditional oscillators.
Apex Volume Pulse (AVP)
Created volume surge analysis that goes beyond simple averages. Extensive testing determined 1.3x multiplier with participation validation provides reliable confirmation while filtering false volume spikes.
Compares current volume to 21-period moving average.
Requires 1.3x average volume for signal confirmation. This filters out low-volume moves during quiet periods and confirms breakouts with actual participation.
Apex Wick Trap (AWT)
Developed proprietary wick trap detection through analysis of failed breakout patterns. Tested various ratio combinations before settling on 60% wick dominance + 20% body limit as effective trap identification parameters.
Analyzes candle structure to identify failed breakouts:
candleRange = math.max(high - low, 0.00001)
candleBody = math.abs(close - open)
bodyRatio = candleBody / candleRange
upperWick = high - math.max(open, close)
lowerWick = math.min(open, close) - low
upperWickRatio = upperWick / candleRange
lowerWickRatio = lowerWick / candleRange
trapWickLong = showAWT and lowerWickRatio > minWickDom and bodyRatio < bodyToRangeLimit and close > open
trapWickShort = showAWT and upperWickRatio > minWickDom and bodyRatio < bodyToRangeLimit and close < open This catches reversals after fake breakouts.
Apex TrendGuard (ATG)
Built angle-based trend detection after standard EMA crossovers proved insufficient. Combined slope analysis with volatility bands through iterative testing to eliminate false trend signals.
EMA slope analysis with volatility bands:
Fast EMA (21) vs Slow EMA (55) for trend direction
Angle calculation: atan(fast - slow) * 180 / π
ATR bands (1.75x multiplier) for breakout confirmation
Minimum 25° angle for strong trend classification
Core Algorithm Framework
1. Composite Signal Generation
calculateCompositeSignals() =>
// Component Conditions
structSignalLong = trapWickLong
structSignalShort = trapWickShort
momentumLong = amcBuySignal
momentumShort = amcSellSignal
volumeSpike = volume > volAvg_AVP * volMult_AVP
priceStrength_Long = close > open and close > close
priceStrength_Short = close < open and close < close
rsiMfiComboValue = (ta.rsi(close, 14) + ta.mfi(close, 14)) / 2
reversalTrigger_Long = ta.crossover(rsiMfiComboValue, 50)
reversalTrigger_Short = ta.crossunder(rsiMfiComboValue, 50)
isEMACrossUp = ta.crossover(emaFast_ATG, emaSlow_ATG)
isEMACrossDown = ta.crossunder(emaFast_ATG, emaSlow_ATG)
// Enhanced Composite Score Calculation
scoreBuy = 0.0
scoreBuy += structSignalLong ? scoreStruct : 0.0
scoreBuy += momentumLong ? scoreMomentum : 0.0
scoreBuy += flashSignal ? weightFlash : 0.0
scoreBuy += blinkSignal ? weightBlink : 0.0
scoreBuy += volumeSpike_AVP ? scoreVolume : 0.0
scoreBuy += priceStrength_Long ? scorePriceAction : 0.0
scoreBuy += reversalTrigger_Long ? scoreReversal : 0.0
scoreBuy += emaAlignment_Bull ? weightTrendAlign : 0.0
scoreBuy += strongUpTrend ? weightTrendAlign : 0.0
scoreBuy += highRisk_Long ? -1.2 : 0.0
scoreBuy += signalGreenDot ? 1.0 : 0.0
scoreBuy += isAMCUp ? 0.8 : 0.0
scoreBuy += isVssBuy ? 1.5 : 0.0
scoreBuy += isEMACrossUp ? 1.0 : 0.0
scoreBuy += signalRedX ? -1.0 : 0.0
scoreSell = 0.0
scoreSell += structSignalShort ? scoreStruct : 0.0
scoreSell += momentumShort ? scoreMomentum : 0.0
scoreSell += flashSignal ? weightFlash : 0.0
scoreSell += blinkSignal ? weightBlink : 0.0
scoreSell += volumeSpike_AVP ? scoreVolume : 0.0
scoreSell += priceStrength_Short ? scorePriceAction : 0.0
scoreSell += reversalTrigger_Short ? scoreReversal : 0.0
scoreSell += emaAlignment_Bear ? weightTrendAlign : 0.0
scoreSell += strongDownTrend ? weightTrendAlign : 0.0
scoreSell += highRisk_Short ? -1.2 : 0.0
scoreSell += signalRedX ? 1.0 : 0.0
scoreSell += isAMCDown ? 0.8 : 0.0
scoreSell += isVssSell ? 1.5 : 0.0
scoreSell += isEMACrossDown ? 1.0 : 0.0
scoreSell += signalGreenDot ? -1.0 : 0.0
compositeBuySignal = enableComposite and scoreBuy >= thresholdCompositeBuy
compositeSellSignal = enableComposite and scoreSell >= thresholdCompositeSell
if compositeBuySignal and compositeSellSignal
compositeBuySignal := false
compositeSellSignal := false
= calculateCompositeSignals()
// Final Entry Signals
entryCompositeBuySignal = compositeBuySignal and ta.rising(emaFast_ATG, 2)
entryCompositeSellSignal = compositeSellSignal and ta.falling(emaFast_ATG, 2)
Calculates weighted scores from independent modules and activates signals only when threshold requirements are met.
2. Smart Exit Hold Evaluation System
evaluateSmartHold() =>
compositeBuyRecentCount = 0
compositeSellRecentCount = 0
for i = 0 to signalLookbackBars - 1
compositeBuyRecentCount += compositeBuySignal ? 1 : 0
compositeSellRecentCount += compositeSellSignal ? 1 : 0
avgVolume = ta.sma(volume, 20)
volumeSpike = volume > avgVolume * volMultiplier
// MTF Bull/Bear conditions
mtf_bull = mtf_emaFast_final > mtf_emaSlow_final
mtf_bear = mtf_emaFast_final < mtf_emaSlow_final
emaBackupDivergence = math.abs(mtf_emaFast_backup - mtf_emaSlow_backup) / mtf_emaSlow_backup
emaBackupStrong = emaBackupDivergence > 0.008
mtfConflict_Long = inLong and mtf_bear and emaBackupStrong
mtfConflict_Short = inShort and mtf_bull and emaBackupStrong
// Layer 1: ATR-Based Dynamic Threshold (Market Volatility Intelligence)
atr_raw = ta.atr(atrLen)
atrValue = na(atr_raw) ? close * 0.02 : atr_raw
atrRatio = atrValue / close
dynamicThreshold = atrRatio > 0.02 ? 1.0 : (atrRatio > 0.01 ? 1.5 : 2.8)
// Layer 2: ROI-Conditional Time Intelligence (Selective Pressure)
timeMultiplier_Long = realROI >= 0 ? 1.0 : // Profitable positions: No time pressure
holdTimer_Long <= signalLookbackBars ? 1.0 : // Loss positions 1-8 bars: Base
holdTimer_Long <= signalLookbackBars * 2 ? 1.1 : // Loss positions 9-16 bars: +10% stricter
1.3 // Loss positions 17+ bars: +30% stricter
timeMultiplier_Short = realROI >= 0 ? 1.0 : // Profitable positions: No time pressure
holdTimer_Short <= signalLookbackBars ? 1.0 : // Loss positions 1-8 bars: Base
holdTimer_Short <= signalLookbackBars * 2 ? 1.1 : // Loss positions 9-16 bars: +10% stricter
1.3 // Loss positions 17+ bars: +30% stricter
// Dual-Layer Threshold Calculation
baseThreshold_Long = mtfConflict_Long ? dynamicThreshold + 1.0 : dynamicThreshold
baseThreshold_Short = mtfConflict_Short ? dynamicThreshold + 1.0 : dynamicThreshold
timeAdjustedThreshold_Long = baseThreshold_Long * timeMultiplier_Long
timeAdjustedThreshold_Short = baseThreshold_Short * timeMultiplier_Short
// Final Smart Hold Decision with Dual-Layer Intelligence
smartHold_Long = not mtfConflict_Long and smartScoreLong >= timeAdjustedThreshold_Long and compositeBuyRecentCount >= signalMinCount
smartHold_Short = not mtfConflict_Short and smartScoreShort >= timeAdjustedThreshold_Short and compositeSellRecentCount >= signalMinCount
= evaluateSmartHold()
Evaluates whether to hold positions past TP1/TP2/TP3 levels based on continued signal strength, volume confirmation, and multi-timeframe trend alignment
HOW TO USE THE STRATEGY
Step 1: Initial Setup
Apply strategy to your preferred timeframe (backtested on 15M)
Enable "Use Heikin-Ashi Base" for smoother signals in volatile markets
"Show EMA Lines" and "Show Ichimoku Cloud" are enabled for visual context
Set default quantities to match your risk management (5% equity default)
Step 2: Signal Recognition
Visual Signal Guide:
Visual Signal Guide - Complete Reference:
🔶 Red Diamond: Bearish momentum breakdown - short reversal signal
🔷 Blue Diamond: Strong bullish momentum - long reversal signal
🔵 Blue Dot: Volume-confirmed directional move - trend continuation
🟢 Green Dot: Bullish EMA crossover - trend reversal confirmation
🟠 Orange X: Oversold reversal setup - counter-trend opportunity
❌ Red X: Bearish EMA breakdown - trend reversal warning
✡ Star Uprising: Strong bullish convergence
💥 Ultra Entry: Ultra-rapid downward momentum acceleration
▲ VSS Long: Velocity-based bullish momentum confirmation
▼ VSS Short: Velocity-based bearish momentum confirmation
Step 3: Entry Execution
For Long Positions:
1. ✅ EMA1 crossed above EMA2 exactly 3 bars ago [ta.crossover(ema1,ema2) ]
2. ✅ Current EMA structure: EMA1 > EMA2 (maintained)
3. ✅ Composite score ≥ 5.0 points (6.5+ for 5-minute timeframes)
4. ✅ Cooldown period completed (no recent stop losses)
5. ✅ Volume spike confirmation (green dot/blue dot signals)
6. ✅ Bullish candle closes above EMA structure
For Short Positions:
1. ✅ EMA1 crossed below EMA2 exactly 3 bars ago [ta.crossunder(ema1,ema2) ]
2. ✅ Current EMA structure: EMA1 < EMA2 (maintained)
3. ✅ Composite score ≥ 5.4 points (7.0+ for 5-minute timeframes)
4. ✅ Cooldown period completed (no recent stop losses)
5. ✅ Momentum breakdown (red diamond/red X signals)
6. ✅ Bearish candle closes below EMA structure
🎯 Critical Timing Note: The strategy requires EMA crossover to have occurred 3 bars prior to entry, not at the current bar. This attempts to avoid premature entries and may improve signal reliability.
Step 4: Reading Market Context
EMA Ribbon Interpretation:
All EMAs ascending = Strong uptrend context
EMAs 1-3 above EMAs 4-8 = Bullish structure
Tight EMA spacing = Low volatility/consolidation
Wide EMA spacing = High volatility/trending
Ichimoku Cloud Context:
Price above cloud = Bullish environment
Price below cloud = Bearish environment
Cloud color intensity = Momentum strength
Thick cloud = Strong support/resistance
THE SMART EXIT GRID SYSTEM
Smart Exit Grid Approach:
The Smart Exit Grid uses dynamic hold evaluation that continuously analyzes market conditions after position entry. This differs from traditional fixed profit targets by adapting exit timing based on real-time signal strength.
How Smart Exit Grid System Works
The system operates through three evaluation phases:
Smart Score Calculation:
The smart score calculation aggregates 22 signal components in real-time, combining reversal warnings, continuation signals, trend alignment indicators, EMA structural analysis, and risk penalties into a numerical representation of market conditions. MTF analysis provides additional confirmation as a separate validation layer.
Signal Stack Management:
The per-tick signal accumulation system monitors 22 active signal types with MTF providing trend validation and conflict detection as a separate confirmation layer.
Take Profit Progression:
Smart Exit Activation:
The QRE system activates Smart Exit Grid immediately upon position entry. When strategy.entry() executes, the system initializes monitoring systems designed to track position progress.
Upon position opening, holdTimer begins counting, establishing the foundation for subsequent decisions. The Smart Exit Grid starts accumulating signals from entry, with all 22 signal components beginning real-time tracking when the trade opens.
The system operates on continuous evaluation where smartScoreLong and smartScoreShort calculate from the first tick after entry. QRE's approach is designed to capture market structure changes, trend deteriorations, or signal pattern shifts that can trigger protective exits even before the first take profit level is reached.
This activation creates a proactive position management framework. The 8-candle sliding window starts from entry, meaning that if market conditions change rapidly after entry - due to news events, liquidity shifts, or technical changes - the system can respond within the configured lookback period.
TP Markers as Reference Points:
The TP1, TP2, and TP3 levels function as reference points rather than mandatory exit triggers. When longTP1Hit or shortTP1Hit conditions activate, they serve as profit confirmation markers that inform the Smart Exit algorithm about achieved reward levels, but don't automatically initiate position closure.
These TP markers enhance the Smart Exit decision matrix by providing profit context to ongoing signal evaluation. The system recognizes when positions have achieved target returns, but the actual exit decision remains governed by continuous smart score evaluation and signal stack analysis.
TP2 Reached: Enhanced Monitoring
TP2 represents significant profit capture with additional monitoring features:
This approach is designed to help avoid premature profit-taking during trending conditions. If TP2 is reached but smartScoreLong remains above the dynamic threshold and the 8-candle sliding window shows persistent signals, the position continues holding. If market structure deteriorates before reaching TP2, the Smart Exit can trigger closure based on signal analysis.
The visual TP circles that appear when levels are reached serve as performance tracking tools, allowing users to see how frequently entries achieve various profit levels while understanding that actual exit timing depends on market structure analysis.
Risk Management Systems:
Operating independently from the Smart Exit Grid are two risk management systems: the Trap Wick Detection Protocol and the Stop Loss Mechanism. These systems maintain override authority over other exit logic.
The Trap Wick System monitors for conditionBearTrapExit during long positions and conditionBullTrapExit during short positions. When detected, these conditions trigger position closure with state reset, bypassing Smart Exit evaluations. This system recognizes that certain candlestick patterns may indicate reversal risk.
Volatility Exit Monitoring: The strategy monitors for isStrongBearCandle combined with conditionBearTrapExit, recognizing when market structure may be shifting.
Volume Validation: Before exiting on volatility, the strategy requires volume confirmation: volume > ta.sma(volume, 20) * 1.8. This is designed to filter exits on weak, low-volume movements.
The Stop Loss Mechanism operates through multiple triggers including traditional price-based stops (longSLHit, shortSLHit) and early exit conditions based on smart score deterioration combined with negative ROI. The early exit logic activates when smartScoreLong < 1.0 or smartScoreShort < 1.0 while realROI < -0.9%.
These risk management systems are designed so that risk scenarios can trigger protective closure with state reset across all 22 signal counters, TP tracking variables, and smart exit states.
This architecture - Smart Exit activation, TP markers as navigation tools, and independent risk management - creates a position management system that adapts to market conditions while maintaining risk discipline through dedicated protection protocols.
TP3 Reached: Enhanced Protection
Once TP3 is hit, the strategy shifts into enhanced monitoring:
EMA Structure Monitoring: isEMAStructureDown becomes a primary exit trigger
MTF Alignment: The higher timeframe receives increased consideration
Wick Trap Priority: conditionBearTrapExit becomes an immediate exit signal
Approach Differences:
Traditional Fixed Exits:
Exit at predetermined levels regardless of market conditions
May exit during trend continuation
May exit before trend completion
Limited adaptation to changing volatility
Smart Exit Grid Approach:
Adaptive timing based on signal conditions
Exits when supporting signals weaken
Multi-timeframe validation for trend confirmation
Volume confirmation requirements for holds
Structural monitoring for trend analysis
Dynamic ATR-Based Smart Score Threshold System
Market Volatility Adaptive Scoring
// Real-time ATR Analysis
atr_raw = ta.atr(atrLen)
atrValue = na(atr_raw) ? close * 0.02 : atr_raw
atrRatio = atrValue / close
// Three-Tier Dynamic Threshold Matrix
dynamicThreshold = atrRatio > 0.02 ? 1.0 : // High volatility: Lower threshold
(atrRatio > 0.01 ? 1.5 : // Medium volatility: Standard
2.8) // Low volatility: Higher threshold
The market volatility adaptive scoring calculates real-time ATR with a 2% fallback for new markets. The atrRatio represents the relationship between current volatility and price, creating a foundation for threshold adjustment.
The three-tier dynamic threshold matrix responds to market conditions by adjusting requirements based on volatility levels: lowering thresholds during high volatility periods above 2% ATR ratio to 1.0 points, maintaining standard requirements at 1.5 points for medium volatility between 1-2%, and raising standards to 2.8 points during low volatility periods below 1%.
Profit-Loss Adaptive Management:
The system applies different evaluation criteria based on position performance:
Winning Positions (realROI ≥ 0%):
→ timeMultiplier = 1.0 (No additional pressure)
→ Maintains base threshold requirements
→ Allows natural progression to TP2/TP3 levels
Losing Positions (realROI < 0%):
→ Progressive time pressure activated
→ Increasingly strict requirements over time
→ Faster decision-making on underperforming trades
ROI-Adaptive Smart Hold Decision Process:
The strategy uses a profit-loss adaptive system:
Winning Position Management (ROI ≥ 0%):
✅ Standard threshold requirements maintained
✅ No additional time-based pressure applied
✅ Allows positions to progress toward TP2/TP3 levels
✅ timeMultiplier remains at 1.0 regardless of hold duration
Losing Position Management (ROI < 0%):
⚠️ Time-based threshold adjustments activated
⚠️ Progressive increase in required signal strength over time
⚠️ Earlier exit evaluation on underperforming positions
⚠️ timeMultiplier increases from 1.0 → 1.1 → 1.3 based on hold duration
Real-Time Monitoring:
Monitor Analysis Table → "Smart" filter → "Score" vs "Dynamic Threshold"
Winning positions: Evaluation based on signal strength deterioration only
Losing positions: Evaluation considers both signal strength and progressive time adjustments
Breakeven positions (0% ROI): Treated as winning positions - no time adjustments
This approach differentiates between winning and losing positions in the hold evaluation process, requiring higher signal thresholds for extended holding of losing positions while maintaining standard requirements for winning ones.
ROI-Conditional Decision Matrix Examples:
Scenario 1 - Winning Position in Any Market:
Position ROI: +0.8% → timeMultiplier = 1.0 (regardless of hold time)
ATR Medium (1.2%) → dynamicThreshold = 1.5
Final Threshold = 1.5 × 1.0 = 1.5 points ✅ Position continues
Scenario 2 - Losing Position, Extended Hold:
Position ROI: -0.5% → Time pressure activated
Hold Time: 20 bars → timeMultiplier = 1.3
ATR Low (0.8%) → dynamicThreshold = 2.8
Final Threshold = 2.8 × 1.3 = 3.64 points ⚡ Enhanced requirements
Scenario 3 - Fresh Losing Position:
Position ROI: -0.3% → Time pressure activated
Hold Time: 5 bars → timeMultiplier = 1.0 (still early)
ATR High (2.1%) → dynamicThreshold = 1.0
Final Threshold = 1.0 × 1.0 = 1.0 points 📊 Recovery opportunity
Scenario 4 - Breakeven Position:
Position ROI: 0.0% → timeMultiplier = 1.0 (no pressure)
Hold Time: 15 bars → No time penalty applied
Final Threshold = dynamicThreshold only ⚖️ Neutral treatment
🔄8-Candle Sliding Window Signal Rotation System
Composite Signal Counting Mechanism
// Dynamic Lookback Window (configurable: default 8)
signalLookbackBars = input.int(8, "Composite Lookback Bars", minval=1, maxval=50)
// Rolling Signal Analysis
compositeBuyRecentCount = 0
compositeSellRecentCount = 0
for i = 0 to signalLookbackBars - 1
compositeBuyRecentCount += compositeBuySignal ? 1 : 0
compositeSellRecentCount += compositeSellSignal ? 1 : 0
Candle Flow Example (8-bar window):
→
✓ ✓ ✗ ✓ ✗ ✓ ✗ ✓ 🗑️
New Signal Count = 5/8 signals in window
Threshold Check: 5 ≥ signalMinCount (2) = HOLD CONFIRMED
Signal Decay & Refresh Mechanism
// Signal Persistence Tracking
if compositeBuyRecentCount >= signalMinCount
smartHold_Long = true
else
smartHold_Long = false
The composite signal counting operates through a configurable sliding window. The system maintains rolling counters that scan backward through the specified number of candles.
During each evaluation cycle, the algorithm iterates through historical bars, incrementing counters when composite signals are detected. This creates a dynamic signal persistence measurement where recent signal density determines holding decisions.
The sliding window rotation functions like a moving conveyor belt where new signals enter while the oldest signals drop off. For example, in an 8-bar window, if 5 out of 8 recent candles showed composite buy signals, and the minimum required count is 2, the system confirms the hold condition. As new bars form, the window slides forward, potentially changing the signal count and triggering exit conditions when signal density falls below the threshold.
Signal decay and refresh occur continuously where smartHold_Long remains true only when compositeBuyRecentCount exceeds signalMinCount. When recent signal density drops below the minimum requirement, the system switches to exit mode.
Advanced Signal Stack Management - 22-Signal Real-Time Evaluation
// Long Position Signal Stacking (calc_on_every_tick=true)
if inLong
// Primary Reversal Signals
if signalRedDiamond: signalCountRedDiamond += 1 // -0.5 points
if signalStarUprising: signalCountStarUprising += 1 // +1.5 points
if entryUltraShort: signalCountUltra += 1 // -1.0 points
// Trend Confirmation Signals
if strongUpTrend: trendUpCount_Long += 1 // +1.5 points
if emaAlignment_Bull: bullAlignCount_Long += 1 // +1.0 points
// Risk Assessment Signals
if highRisk_Long: riskCount_Long += 1 // -1.5 points
if topZone: tzoneCount_Long += 1 // -0.5 points
The per-tick signal accumulation system operates with calc_on_every_tick=true for real-time responsiveness. During long positions, the system monitors primary reversal signals where Red Diamond signals subtract 0.5 points as reversal warnings, Star Uprising adds 1.5 points for continuation signals, and Ultra Short signals deduct 1.0 points as counter-trend warnings.
Trend confirmation signals provide weighted scoring where strongUpTrend adds 1.5 points for aligned momentum, emaAlignment_Bull contributes 1.0 point for structural support, and various EMA-based confirmations contribute to the overall score. Risk assessment signals apply negative weighting where highRisk_Long situations subtract 1.5 points, topZone conditions deduct 0.5 points, and other risk factors create defensive scoring adjustments.
The smart score calculation aggregates all 22 components in real-time, combining reversal warnings, continuation signals, trend alignment indicators, EMA structural analysis, and risk penalties into a numerical representation of market conditions. This score updates continuously, providing the foundation for hold-or-exit decisions.
MULTI-TIMEFRAME (MTF) SYSTEM
MTF Data Collection
The strategy requests higher timeframe data (default 30-minute) for trend confirmation:
= request.security(syminfo.tickerid, mtfTimeframe, , lookahead=barmerge.lookahead_off, gaps=barmerge.gaps_off)
MTF Watchtower System - Implementation Logic
The system employs a timeframe discrimination protocol where currentTFInMinutes is compared against a 30-minute threshold. This creates different operational behavior between timeframes:
📊 Timeframe Testing Results:
30M+ charts: Full MTF confirmation → Tested with full features
15M charts: Local EMA + adjusted parameters → Standard testing baseline
5M charts: Local EMA only → Requires parameter adjustment
1M charts: High noise → Limited testing conducted
When the chart timeframe is 30 minutes or above, the strategy activates useMTF = true and requests external MTF data through request.security(). For timeframes below 30 minutes, including your 5-minute setup, the system deliberately uses local EMA calculations to avoid MTF lag and data inconsistencies.
The triple-layer data sourcing architecture works as follows: timeframes from 1 minute to 29 minutes rely on chart-based EMA calculations for immediate responsiveness. Timeframes of 30 minutes and above utilize MTF data through the security function, with a backup system that doubles the EMA length (emaLen * 2) if MTF data fails. When MTF data is unavailable or invalid, the system falls back to local EMA as the final safety net.
Data validation occurs through a pipeline where mtf_dataValid checks not only for non-null values but also verifies that EMA values are positive above zero. The system tracks data sources through mtf_dataSource which displays "MTF Data" for successful external requests, "Backup EMA" for failed MTF with backup system active, or "Chart EMA" for local calculations.
🔄 MTF Smart Score Caching & Recheck System
// Cache Update Decision Logic
mtfSmartIntervalSec = input.int(300, "Smart Grid Recheck Interval (sec)") // 5-minute cache
canRecheckSmartScore = na(timenow) ? false :
(na(lastCheckTime) or (timenow - lastCheckTime) > mtfSmartIntervalSec * 1000)
// Cache Management
if canRecheckSmartScore
lastCheckTime := timenow
cachedSmartScoreLong := smartScoreLong // Store current calculation
cachedSmartScoreShort := smartScoreShort
The performance-optimized caching system addresses the computational intensity of continuous MTF analysis through intelligent interval management. The mtfSmartIntervalSec parameter, defaulting to 300 seconds (5 minutes), determines cache refresh frequency. The system evaluates canRecheckSmartScore by comparing current time against lastCheckTime plus the configured interval.
When cache updates trigger, the system stores current calculations in cachedSmartScoreLong and cachedSmartScoreShort, creating stable reference points that reduce excessive MTF requests. This cache management balances computational efficiency with analytical accuracy.
The cache versus real-time hybrid system creates a multi-layered decision matrix where immediate signals update every tick for responsive market reaction, cached MTF scores refresh every 5 minutes for stability filtering, dynamic thresholds recalculate every bar for volatility adaptation, and sliding window analysis updates every bar for trend persistence validation.
This architecture balances real-time signal detection with multi-timeframe strategic validation, creating adaptive trading intelligence that responds immediately to market changes while maintaining strategic stability through cached analysis and volatility-adjusted decision thresholds.
⚡The Execution Section Deep Dive
The execution section represents the culmination of all previous systems – where analysis transforms into action.
🚪 Entry Execution: The Gateway Protocol
Primary Entry Validation:
Entry isn't just about seeing a signal – it's about passing through multiple security checkpoints, each designed to filter out low-quality opportunities.
Stage 1: Signal Confirmation
entryCompositeBuySignal must be TRUE for longs
entryCompositeSellSignal must be TRUE for shorts
Stage 2: Enhanced Entry Validation
The strategy employs an "OR" logic system that recognizes different types of market opportunities:
Path A - Trend Reversal Entry:
When emaTrendReversal_Long triggers, it indicates the market structure is shifting in favor of the trade direction. This isn't just about a single EMA crossing – it represents a change in market momentum that experienced traders recognize as potential high-probability setups.
Path B - Momentum Breakout Entry:
The strongBullMomentum condition is where QRE identifies accelerating market conditions:
Criteria:
EMA1 rising for 3+ candles AND
EMA2 rising for 2+ candles AND
Close > 10-period high
This combination captures those explosive moves where the market doesn't just trend – it accelerates, creating momentum-driven opportunities.
Path C - Recovery Entry:
When previous exit states are clean (no recent stop losses), the strategy permits entry based purely on signal strength. This pathway is designed to help avoid the strategy becoming overly cautious after successful trades.
🛡️ The Priority Exit Matrix: When Rules Collide
Not all exit signals are created equal. QRE uses a strict hierarchy that is designed to avoid conflicting signals from causing hesitation:
Priority Level 1 - Exception Exits (Immediate Action):
Condition: TP3 reached AND Wick Trap detected
Action: Immediate exit regardless of other signals
Rationale: Historical analysis suggests wick traps at TP3 may indicate potential reversals
Priority Level 2 - Structural Breakdown:
Condition: TP3 active AND EMA structure deteriorating AND Smart Score insufficient
Logic: isEMAStructureDown AND NOT smartHold_Long
This represents the strategy recognizing that the underlying market structure that justified the trade is failing. It's like a building inspector identifying structural issues – you don't wait for additional confirmation.
Priority Level 3 - Enhanced Volatility Exits:
Conditions: TP2 active AND Strong counter-candle AND Wick trap AND Volume spike
Logic: Multiple confirmation required to reduce false exits
Priority Level 4 - Standard Smart Score Exits:
Condition: Any TP level active AND smartHold evaluates to FALSE
This is the bread-and-butter exit logic where signal deterioration triggers exit
⚖️ Stop Loss Management: Risk Control Protocol
Dual Stop Loss System:
QRE provides two stop loss modes that users can select based on their preference:
Fixed Mode (Default - useAdaptiveSL = false):
Uses predetermined percentage levels regardless of market volatility:
- Long SL = entryPrice × (1 - fixedRiskP - slipBuffer)
- Short SL = entryPrice × (1 + fixedRiskP + slipBuffer)
- Default: 0.6% risk + 0.3% slippage buffer = 0.9% total stop
- Consistent and predictable stop loss levels
- Recommended for users who prefer stable risk parameters
Adaptive Mode (Optional - useAdaptiveSL = true):
Dynamic system that adjusts stop loss based on market volatility:
- Base Calculation uses ATR (Average True Range)
- Long SL = entryPrice × (1 - (ATR × atrMultSL) / entryPrice - slipBuffer)
- Short SL = entryPrice × (1 + (ATR × atrMultSL) / entryPrice + slipBuffer)
- Automatically widens stops during high volatility periods
- Tightens stops during low volatility periods
- Advanced users can enable for volatility-adaptive risk management
Trend Multiplier Enhancement (Both Modes):
When strongUpTrend is detected for long positions, the stop loss receives 1.5x breathing room. Strong trends often have deeper retracements before continuing. This is designed to help avoid the strategy being shaken out of active trades by normal market noise.
Mode Selection Guidance:
- New Users: Start with Fixed Mode for predictable risk levels
- Experienced Users: Consider Adaptive Mode for volatility-responsive stops
- Volatile Markets: Adaptive Mode may provide better stop placement
- Stable Markets: Fixed Mode often sufficient for consistent risk management
Early Exit Conditions:
Beyond traditional stop losses, QRE implements "smart stops" that trigger before price-based stops:
Early Long Exit: (smartScoreLong < 1.0 OR prev5BearCandles) AND realROI < -0.9%
🔄 State Management: The Memory System
Complete State Reset Protocol:
When a position closes, QRE doesn't just wipe the slate clean – it performs a methodical reset:
TP State Cleanup:
All Boolean flags: tp1/tp2/tp3HitBefore → FALSE
All Reached flags: tp1/tp2/tp3Reached → FALSE
All Active flags: tp1/tp2/tp3HoldActive → FALSE
Signal Counter Reset:
Every one of the 22 signal counters returns to zero.
This is designed to avoid signal "ghosting" where old signals influence new trades.
Memory Preservation:
While operational states reset, certain information is preserved for learning:
killReasonLong/Short: Why did this trade end?
lastExitWasTP1/TP2/TP3: What was the exit quality?
reEntryCount: How many consecutive re-entries have occurred?
🔄 Re-Entry Logic: The Comeback System
Re-Entry Conditions Matrix:
QRE implements a re-entry system that recognizes not all exits are created equal:
TP-Based Re-Entry (Enabled):
Criteria: Previous exit was TP1, TP2, or TP3
Cooldown: Minimal or bypassed entirely
Logic: Target-based exits indicate potentially viable market conditions
EMA-Based Re-Entry (Conditional):
Criteria: Previous exit was EMA-based (structural change)
Requirements: Must wait for EMA confirmation in new direction
Minimum Wait: 5 candles
Advanced Re-Entry Features:
When adjustReEntryTargets is enabled, the strategy becomes more aggressive with re-entries:
Target Adjustment: TP1 multiplied by reEntryTP1Mult (default 2.0)
Stop Adjustment: SL multiplied by reEntrySLMult (default 1.5)
Logic: If we're confident enough to re-enter, we should be confident enough to hold for bigger moves
Performance Tracking: Strategy tracks re-entry win rate, average ROI, and total performance separately from initial entries for optimization analysis.
📊 Exit Reason Analytics: Learning from Every Trade
Kill Reason Tracking:
Every exit is categorized and stored:
"TP3 Exit–Wick Trap": Exit at target level with wick pattern detection
"Smart Exit–EMA Down": Structural breakdown exit
"Smart Exit–Volatility": Volatility-based protection exit
"Exit Post-TP1/TP2/TP3": Standard smart exit progression
"Long SL Exit" / "Short SL Exit": Stop loss exits
Performance Differentiation:
The strategy tracks performance by exit type, allowing for continuous analysis:
TP-based exits: Achieved target levels, analyze for pattern improvement
EMA-based exits: Mixed results, analyze for pattern improvement
SL-based exits: Learning opportunities, adjust entry criteria
Volatility exits: Protective measures, monitor performance
🎛️ Trailing Stop Implementation:
Conditional Trailing Activation:
Activation Criteria: Position profitable beyond trailingStartPct AND
(TP hold active OR re-entry trade)
Dynamic Trailing Logic:
Unlike simple trailing stops, QRE's implementation considers market context:
Trending Markets: Wider trail offsets to avoid whipsaws
Volatile Markets: Tighter offsets to protect gains
Re-Entry Trades: Enhanced trailing to maximize second-chance opportunities
Return-to-Entry Protection:
When deactivateOnReturn is enabled, the strategy will close positions that return to entry level after being profitable. This is designed to help avoid the frustration of watching profitable trades turn into losers.
🧠 How It All Works Together
The beauty of QRE lies not in any single component, but in how everything integrates:
The Entry Decision: Multiple pathways are designed to help identify opportunities while maintaining filtering standards.
The Progression System: Each TP level unlocks new protection features, like achieving ranks in a video game.
The Exit Matrix: Prioritized decision-making aims to reduce analysis paralysis while providing appropriate responses to different market conditions.
The Memory System: Learning from each trade while preventing contamination between separate opportunities.
The Re-Entry Logic: Re-entry system that balances opportunity with risk management.
This creates a trading system where entry conditions filter for quality, progression systems adapt to changing market conditions, exit priorities handle conflicting signals intelligently, memory systems learn from each trade cycle, and re-entry logic maximizes opportunities while managing risk exposure.
📊 ANALYSIS TABLE INTERPRETATION -
⚙️ Enabling Analysis Mode
Navigate to strategy settings → "Testing & Analysis" → Enable "Show Analysis Table". The Analysis Table displays different information based on the selected test filter and provides real-time insight into all strategy components, helping users understand current market conditions, position status, and system decision-making processes.
📋 Filter Mode Interpretations
"All" Mode (Default View):
Composite Section:
Buy Score: Aggregated strength from all 22 bullish signals (threshold 5.0+ triggers entry consideration)
Sell Score: Aggregated strength from all 22 bearish signals (threshold 5.4+ triggers entry consideration)
APEX Filters:
ATG Trend: Shows current trend direction analysis
Indicates whether momentum filters are aligned for directional bias
ReEntry Section:
Most Recent Exit: Displays exit type and timeframe since last position closure
Status: Shows if ReEntry system is Ready/Waiting/Disabled
Count: Current re-entry attempts versus maximum allowed attempts
Position Section (When Active):
Status: Current position state (LONG/SHORT/FLAT)
ROI: Dual calculation showing Custom vs Real ROI percentages
Entry Price: Original position entry level
Current Price: Live market price for comparison
TP Tracking: Progress toward profit targets
"Smart" Filter (Critical for Active Positions):
Smart Exit Section:
Hold Timer: Time elapsed since position opened (bar-based counting)
Status: Whether Smart Exit Grid is Enabled/Disabled
Score: Current smart score calculation from 22-component matrix
Dynamic Threshold: ATR-based minimum score required for holding
Final Threshold: Time and ROI-adjusted threshold actually used for decisions
Score Check: Pass/Fail based on Score vs Final Threshold comparison
Smart Hold: Current hold decision status
Final Hold: Final recommendation based on all factors
🎯 Advanced Smart Exit Debugging - ROI & Time-Based Threshold System
Understanding the Multi-Layer Threshold System:
Layer 1: Dynamic Threshold (ATR-Based)
atrRatio = ATR / close
dynamicThreshold = atrRatio > 0.02 ? 1.0 : // High volatility: Lower threshold
(atrRatio > 0.01 ? 1.5 : // Medium volatility: Standard
2.8) // Low volatility: Higher threshold
Layer 2: Time Multiplier (ROI & Duration-Based)
Winning Positions (ROI ≥ 0%):
→ timeMultiplier = 1.0 (No time pressure, regardless of hold duration)
Losing Positions (ROI < 0%):
→ holdTimer ≤ 8 bars: timeMultiplier = 1.0 (Early stage, standard requirements)
→ holdTimer 9-16 bars: timeMultiplier = 1.1 (10% stricter requirements)
→ holdTimer 17+ bars: timeMultiplier = 1.3 (30% stricter requirements)
Layer 3: Final Threshold Calculation
finalThreshold = dynamicThreshold × timeMultiplier
Examples:
- Winning Position: 2.8 × 1.0 = 2.8 (Always standard)
- Losing Position (Early): 2.8 × 1.0 = 2.8 (Same as winning initially)
- Losing Position (Extended): 2.8 × 1.3 = 3.64 (Much stricter)
Real-Time Debugging Display:
Smart Exit Section shows:
Score: 3.5 → Current smartScoreLong/Short value
Dynamic Threshold: 2.8 → Base ATR-calculated threshold
Final Threshold: 3.64 (ATR×1.3) → Actual threshold used for decisions
Score Check: FAIL (3.5 vs 3.64) → Pass/Fail based on final comparison
Final Hold: NO HOLD → Actual system decision
Position Status Indicators:
Winner + Early: ATR×1.0 (No pressure)
Winner + Extended: ATR×1.0 (No pressure - winners can run indefinitely)
Loser + Early: ATR×1.0 (Recovery opportunity)
Loser + Extended: ATR×1.1 or ATR×1.3 (Increasing pressure to exit)
MTF Section:
Data Source: Shows whether using MTF Data/EMA Backup/Local EMA
Timeframe: Configured watchtower timeframe setting
Data Valid: Confirms successful MTF data retrieval status
Trend Signal: Higher timeframe directional bias analysis
Close Price: MTF price data availability confirmation
"Composite" Filter:
Composite Section:
Buy Score: Real-time weighted scoring from multiple indicators
Sell Score: Opposing directional signal strength
Threshold: Minimum scores required for signal activation
Components:
Flash/Blink: Momentum acceleration indicators (F = Flash active, B = Blink active)
Individual filter contributions showing which specific signals are firing
"ReEntry" Filter:
ReEntry System:
System: Shows if re-entry feature is Enabled/Disabled
Eligibility: Conditions for new entries in each direction
Performance: Success metrics of re-entry attempts when enabled
🎯 Key Status Indicators
Status Column Symbols:
✓ = Condition met / System active / Signal valid
✗ = Condition not met / System inactive / No signal
⏳ = Cooldown active (waiting period)
✅ = Ready state / Good condition
🔄 = Processing / Transitioning state
🔍 Critical Reading Guidelines
For Active Positions - Smart Exit Priority Reading:
1. First Check Position Type:
ROI ≥ 0% = Winning Position (Standard requirements)
ROI < 0% = Losing Position (Progressive requirements)
2. Check Hold Duration:
Early Stage (≤8 bars): Standard multiplier regardless of ROI
Extended Stage (9-16 bars): Slight pressure on losing positions
Long Stage (17+ bars): Strong pressure on losing positions
3. Score vs Final Threshold Analysis:
Score ≥ Final Threshold = HOLD (Continue position)
Score < Final Threshold = EXIT (Close position)
Watch for timeMultiplier changes as position duration increases
4. Understanding "Why No Hold?"
Common scenarios when Score Check shows FAIL:
Losing position held too long (timeMultiplier increased to 1.1 or 1.3)
Low volatility period (dynamic threshold raised to 2.8)
Signal deterioration (smart score dropped below required level)
MTF conflict (higher timeframe opposing position direction)
For Entry Signal Analysis:
Composite Score Reading: Signal strength relative to threshold requirements
Component Analysis: Individual filter contributions to overall score
EMA Structure: Confirm 3-bar crossover requirement met
Cooldown Status: Ensure sufficient time passed since last exit
For ReEntry Opportunities (when enabled):
System Status: Availability and eligibility for re-engagement
Exit Type Analysis: TP-based exits enable immediate re-entry, SL-based exits require cooldown
Condition Monitoring: Requirements for potential re-entry signals
Debugging Common Issues:
Issue: "Score is high but no hold?"
→ Check Final Threshold vs Score (not Dynamic Threshold)
→ Losing position may have increased timeMultiplier
→ Extended hold duration applying pressure
Issue: "Why different thresholds for same score?"
→ Position ROI status affects multiplier
→ Time elapsed since entry affects multiplier
→ Market volatility affects base threshold
Issue: "MTF conflicts with local signals?"
→ Higher timeframe trend opposing position
→ System designed to exit on MTF conflicts
→ Check MTF Data Valid status
⚡ Performance Optimization Notes
For Better Performance:
Analysis table updates may impact performance on some devices
Use specific filters rather than "All" mode for focused monitoring
Consider disabling during live trading for optimal chart performance
Enable only when needed for debugging or analysis
Strategic Usage:
Monitor "Smart" filter when positions are active for exit timing decisions
Use "Composite" filter during setup phases for signal strength analysis
Reference "ReEntry" filter after position closures for re-engagement opportunities
Track Final Threshold changes to understand exit pressure evolution
Advanced Debugging Workflow:
Position Entry Analysis:
Check Composite score vs threshold
Verify EMA crossover timing (3 bars prior)
Confirm cooldown completion
Hold Decision Monitoring:
Track Score vs Final Threshold progression
Monitor timeMultiplier changes over time
Watch for MTF conflicts
Exit Timing Analysis:
Identify which threshold layer caused exit
Track performance by exit type
Analyze re-entry eligibility
This analysis system provides transparency into strategy decision-making processes, allowing users to understand how signals are generated and positions are managed according to the programmed logic during various market conditions and position states.
SIGNAL TYPES AND CHARACTERISTICS
🔥 Core Momentum Signals
Flash Signal
Calculation: ta.rma(math.abs(close - close ), 5) > ta.sma(math.abs(close - close ), 7)
Purpose: Detects sudden price acceleration using smoothed momentum comparison
Characteristics: Triggers when recent price movement exceeds historical average movement
Usage: Primary momentum confirmation across multiple composite calculations
Weight: 1.3 points in composite scoring
Blink Signal
Calculation: math.abs(ta.change(close, 1)) > ta.sma(math.abs(ta.change(close, 1)), 5)
Purpose: Identifies immediate price velocity spikes
Characteristics: More sensitive than Flash, captures single-bar momentum bursts
Usage: Secondary momentum confirmation, often paired with Flash
Weight: 1.3 points in composite scoring
⚡ Advanced Composite Signals
Apex Pulse Signal
Calculation: apexAngleValue > 30 or apexAngleValue < -30
Purpose: Detects extreme EMA angle momentum
Characteristics: Identifies when trend angle exceeds ±30 degrees
Usage: Confirms directional momentum strength in trend-following scenarios
Pressure Surge Signal
Calculation: volSpike_AVP and strongTrendUp_ATG
Purpose: Combines volume expansion with trend confirmation
Characteristics: Requires both volume spike and strong uptrend simultaneously
Usage: bullish signal for trend continuation
Shift Wick Signal
Calculation: ta.crossunder(ema1, ema2) and isWickTrapDetected and directionFlip
Purpose: Detects bearish reversal with wick trap confirmation
Characteristics: Combines EMA crossunder with upper wick dominance and directional flip
Usage: Reversal signal for trend change identification
🛡️ Trap Exit Protection Signals
Bear Trap Exit
Calculation: isUpperWickTrap and isBearEngulfNow
Conditions: Previous bullish candle with 80%+ upper wick, followed by current bearish engulfing
Purpose: Emergency exit signal for long positions
Priority: Highest - overrides all other hold conditions
Action: Immediate position closure with full state reset
Bull Trap Exit
Calculation: isLowerWickTrap and isBullEngulfNow
Conditions: Previous bearish candle with 80%+ lower wick, followed by current bullish engulfing
Purpose: Emergency exit signal for short positions
Priority: Highest - overrides all other hold conditions
Action: Immediate position closure with full state reset
📊 Technical Analysis Foundation Signals
RSI-MFI Hybrid System
Base Calculation: (ta.rsi(close, 14) + ta.mfi(close, 14)) / 2
Oversold Threshold: < 35
Overbought Threshold: > 65
Weak Condition: < 35 and declining
Strong Condition: > 65 and rising
Usage: Momentum confirmation and reversal identification
ADX-DMI Trend Classification
Strong Up Trend: (adx > 25 and diplus > diminus and (diplus - diminus) > 5) or (ema1 > ema2 and ema2 > ema3 and ta.rising(ema2, 3))
Strong Down Trend: (adx > 20 and diminus > diplus - 5) or (ema1 < ema2 and ta.falling(ema1, 3))
Trend Weakening: adx < adx and adx < adx
Usage: Primary trend direction confirmation
Bollinger Band Squeeze Detection
Calculation: bbWidth < ta.lowest(bbWidth, 20) * 1.2
Purpose: Identifies low volatility periods before breakouts
Usage: Entry filter - avoids trades during consolidation
🎨 Visual Signal Indicators
Red X Signal
Calculation: isBearCandle and ta.crossunder(ema1, ema2)
Visual: Red X above price
Purpose: Bearish EMA crossunder with confirming candle
Composite Weight: +1.0 for short positions, -1.0 for long positions
Characteristics: Simple but effective trend change indicator
Green Dot Signal
Calculation: isBullCandle and ta.crossover(ema1, ema2)
Visual: Green dot below price
Purpose: Bullish EMA crossover with confirming candle
Composite Weight: +1.0 for long positions, -1.0 for short positions
Characteristics: Entry confirmation for trend-following strategies
Blue Diamond Signal
Trigger Conditions: amcBuySignal and score >= 4
Scoring Components: 11 different technical conditions
Key Requirements: AMC bullish + momentum rise + EMA expansion + volume confirmation
Visual: Blue diamond below price
Purpose: Bullish reversal or continuation signal
Characteristics: Multi-factor confirmation requiring 4+ technical alignments
Red Diamond Signal
Trigger Conditions: amcSellSignal and score >= 5
Scoring Components: 11 different technical conditions (stricter than Blue Diamond)
Key Requirements: AMC bearish + momentum crash + EMA compression + volume decline
Visual: Red diamond above price
Purpose: Potential bearish reversal or continuation signal
Characteristics: Requires higher threshold (5 vs 4) for more selective triggering
🔵 Specialized Detection Signals
Blue Dot Signal
Calculation: volumePulse and isCandleStrong and volIsHigh
Requirements: Volume > 2.0x MA, strong candle body > 35% of range, volume MA > 55
Purpose: Volume-confirmed momentum signal
Visual: Blue dot above price
Characteristics: Volume-centric signal for high-liquidity environments
Orange X Signal
Calculation: Complex multi-factor oversold reversal detection
Requirements: AMC oversold + wick trap + flash/blink + RSI-MFI oversold + bullish flip
Purpose: Oversold bounce signal with multiple confirmations
Visual: Orange X below price
Characteristics: Reversal signal requiring 5+ simultaneous conditions
VSS (Velocity Signal System)
Components: Volume spike + EMA angle + trend direction
Buy Signal: vssTrigger and vssTrendDir == 1
Sell Signal: vssTrigger and vssTrendDir == -1
Visual: Green/Red triangles
Purpose: Velocity-based momentum detection
Characteristics: Fast-response signal for momentum trading
⭐ Elite Composite Signals
Star Uprising Signal
Base Requirements: entryCompositeBuySignal and echoBodyLong and strongUpTrend and isAMCUp
Additional Confirmations: RSI hybrid strong + not high risk
Special Conditions: At bottom zone OR RSI bottom bounce OR strong volume bounce
Visual: Star symbol below price
Purpose: Bullish reversal signal from oversold conditions
Characteristics: Most selective bullish signal requiring multiple confirmations
Ultra Short Signal
Scoring System: 7-component scoring requiring 4+ points
Key Components: EMA trap + volume decline + RSI weakness + composite confirmation
Additional Requirements: Falling EMA structure + volume spike + flash confirmation
Visual: Explosion emoji above price
Purpose: Aggressive short entry for trend reversal or continuation
Characteristics: Complex multi-layered signal for experienced short selling
🎯 Composite Signal Architecture
Enhanced Composite Scoring
Long Composite: 15+ weighted components including structure, momentum, flash/blink, volume, price action, reversal triggers, trend alignment
Short Composite: Mirror structure with bearish bias
Threshold: 5.0 points required for signal activation
Conflict Resolution: If both long and short signals trigger simultaneously, both are disabled
Final Validation: Requires EMA momentum confirmation (ta.rising(emaFast_ATG, 2) for longs, ta.falling(emaFast_ATG, 2) for shorts)
Risk Assessment Integration
High Risk Long: RSI > 70 OR close > upper Bollinger Band 80%
High Risk Short: RSI < 30 OR close < lower Bollinger Band 80%
Zone Analysis: Top zone (95% of 50-bar high) vs Bottom zone (105% of 50-bar low)
Risk Penalty: High risk conditions subtract 1.5 points from composite scores
This signal architecture creates a multi-layered detection system where simple momentum signals provide foundation, technical analysis adds structure, visual indicators offer clarity, specialized detectors capture different market conditions, and composite signals identify potential opportunities while integrated risk assessment is designed to filter risky entries.
VISUAL FEATURES SHOWCASE
Ichimoku Cloud Visualization
Dynamic Color Intensity: Cloud transparency adapts to momentum strength - darker colors indicate stronger directional moves, while lighter transparency shows weakening momentum phases.
Gradient Color Mapping: Bullish momentum renders blue-purple spectrum with increasing opacity, while bearish momentum displays corresponding color gradients with intensity-based transparency.
Real-time Momentum Feedback: Color saturation provides immediate visual feedback on market structure strength, allowing traders to assess levels at a glance without additional indicators.
EMA Ribbon Bands
The 8-level exponential moving average system creates a comprehensive trend structure map with gradient color coding.
Signal Type Visualization
STRATEGY PROPERTIES & BACKTESTING DISCLOSURE
📊 Default Strategy Configuration:
✅ Initial Capital: 100,000 USD (realistic for average traders)
✅ Commission: 0.075% per trade (realistic exchange fees)
✅ Slippage: 3 ticks (market impact consideration)
✅ Position Size: 5% equity per trade (sustainable risk level)
✅ Pyramiding: Disabled (single position management)
✅ Sample Size: 185 trades over 12-month backtesting period
✅ Risk Management: Adaptive stop loss with maximum 1% risk per trade
COMPREHENSIVE BACKTESTING RESULTS
Testing Period & Market Conditions:
Backtesting Period: June 25, 2024 - June 25, 2025 (12 months)
Timeframe: 15-minute charts (MTF system active)
Market: BTCUSDT (Bitcoin/Tether)
Market Conditions: Full market cycle including volatility periods
Deep Backtesting: Enabled for maximum accuracy
📈 Performance Summary:
Total Return: +2.19% (+2,193.59 USDT)
Total Trades Executed: 185 trades
Win Rate: 34.05% (63 winning trades out of 185)
Profit Factor: 1.295 (gross profit ÷ gross loss)
Maximum Drawdown: 0.65% (653.17 USDT)
Risk-Adjusted Returns: Consistent with conservative risk management approach
📊 Detailed Trade Analysis:
Position Distribution:
Long Positions: 109 trades (58.9%) | Win Rate: 36.70%
Short Positions: 76 trades (41.1%) | Win Rate: 30.26%
Average Trade Duration: Optimized for 15-minute timeframe efficiency
Profitability Metrics:
Average Profit per Trade: 11.74 USDT (0.23%)
Average Winning Trade: 151.17 USDT (3.00%)
Average Losing Trade: 60.27 USDT (1.20%)
Win/Loss Ratio: 2.508 (winners are 2.5x larger than losses)
Largest Single Win: 436.02 USDT (8.69%)
Largest Single Loss: 107.41 USDT (controlled risk management)
💰 Financial Performance Breakdown:
Gross Profit: 9,523.93 USDT (9.52% of capital)
Gross Loss: 7,352.48 USDT (7.35% of capital)
Net Profit After Costs: 2,171.44 USDT (2.17%)
Commission Costs: 1,402.47 USDT (realistic trading expenses)
Maximum Equity Run-up: 2,431.66 USDT (2.38%)
⚖️ Risk Management Validation:
Maximum Drawdown: 0.65% showing controlled risk management
Drawdown Recovery: Consistent equity curve progression
Risk per Trade: Successfully maintained below 1.5% per position
Position Sizing: 5% equity allocation proved sustainable throughout testing period
📋 Strategy Performance Characteristics:
✅ Strengths Demonstrated:
Controlled Risk: Maximum drawdown well below industry standards (< 1%)
Positive Expectancy: Win/loss ratio of 2.5+ creates profitable edge
Consistent Performance: Steady equity curve without extreme volatility
Realistic Costs: Includes actual commission and slippage impacts
Sample Size: 185 trades during testing period
⚠️ Performance Considerations:
Win Rate: 34% win rate requires discipline to follow system signals
Market Dependency: Performance may vary significantly in different market conditions
Timeframe Sensitivity: Optimized for 15-minute charts; other timeframes may show different results
Slippage Impact: Real trading conditions may affect actual performance
📊 Benchmark Comparison:
Strategy Return: +2.19% over 12 months
Buy & Hold Bitcoin: +71.12% over same period
Strategy Advantage: Significantly lower drawdown and volatility
Risk-Adjusted Performance: Different risk profile compared to holding cryptocurrency
🎯 Real-World Application Insights:
Expected Trading Frequency:
Average: 15.4 trades per month (185 trades ÷ 12 months)
Weekly Frequency: Approximately 3-4 trades per week
Active Management: Requires regular monitoring during market hours
Capital Requirements:
Minimum Used in Testing: $10,000 for sustainable position sizing
Tested Range: $50,000-$100,000 for comfortable risk management
Commission Impact: 0.075% per trade totaled 1.4% of capital over 12 months
⚠️ IMPORTANT BACKTESTING DISCLAIMERS:
📈 Performance Reality:
Past performance does not guarantee future results. Backtesting results represent hypothetical performance and may not reflect actual trading outcomes due to market changes, execution differences, and emotional factors.
🔄 Market Condition Dependency:
This strategy's performance during the tested period may not be representative of performance in different market conditions, volatility regimes, or trending vs. sideways markets.
💸 Cost Considerations:
Actual trading costs may vary based on broker selection, market conditions, and trade size. Commission rates and slippage assumptions may differ from real-world execution.
🎯 Realistic Expectations:
The 34% win rate requires psychological discipline to continue following signals during losing streaks. Risk management and position sizing are critical for replicating these results.
⚡ Technology Dependencies:
Strategy performance assumes reliable internet connection, platform stability, and timely signal execution. Technical failures may impact actual results.
CONFIGURATION OPTIMIZATION
5-Minute Timeframe Optimization (Advanced Users Only)
⚠️ Important Warning: 5-minute timeframes operate without MTF confirmation, resulting in reduced signal quality and higher false signal rates.
Example 5-Minute Parameters:
Composite Thresholds: Long 6.5, Short 7.0 (vs 15M default 5.0/5.4)
Signal Lookback Bars: 12 (vs 15M default 8)
Volume Multiplier: 2.2 (vs 15M default 1.8)
MTF Timeframe: Disabled (automatic below 30M)
Risk Management Adjustments:
Position Size: Reduce to 3% (vs 5% default)
TP1: 0.8%, TP2: 1.2%, TP3: 2.0% (tighter targets)
SL: 0.8% (tighter stop loss)
Cooldown Minutes: 8 (vs 5 default)
Usage Notes for 5-Minute Trading:
- Wait for higher composite scores before entry
- Require stronger volume confirmation
- Monitor EMA structure more closely
15-Minute Scalping Setup:
TP1: 1.0%, TP2: 1.5%, TP3: 2.5%
Composite Threshold: 5.0 (higher filtering)
TP ATR Multiplier: 7.0
SL ATR Multiplier: 2.5
Volume Multiplier: 1.8 (requires stronger confirmation)
Hold Time: 2 bars minimum
3-Hour Swing Setup:
TP1: 2.0%, TP2: 4.0%, TP3: 8.0%
Composite Threshold: 4.5 (more signals)
TP ATR Multiplier: 8.0
SL ATR Multiplier: 3.2
Volume Multiplier: 1.2
Hold Time: 6 bars minimum
Market-Specific Adjustments
High Volatility Periods:
Increase ATR multipliers (TP: 2.0x, SL: 1.2x)
Raise composite thresholds (+0.5 points)
Reduce position size
Enable cooldown periods
Low Volatility Periods:
Decrease ATR multipliers (TP: 1.2x, SL: 0.8x)
Lower composite thresholds (-0.3 points)
Standard position sizing
Disable extended cooldowns
News Events:
Temporarily disable strategy 30 minutes before major releases
Increase volume requirements (2.0x multiplier)
Reduce position sizes by 50%
Monitor for unusual price action
RISK MANAGEMENT
Dual ROI System: Adaptive vs Fixed Mode
Adaptive RR Mode:
Uses ATR (Average True Range) for automatic adjustment
TP1: 1.0x ATR from entry price
TP2: 1.5x ATR from entry price
TP3: 2.0x ATR from entry price
Stop Loss: 1.0x ATR from entry price
Automatically adjusts to market volatility
Fixed Percentage Mode:
Uses predetermined percentage levels
TP1: 1.0% (default)
TP2: 1.5% (default)
TP3: 2.5% (default)
Stop Loss: 0.9% total (0.6% risk tolerance + 0.3% slippage buffer)(default)
Consistent levels regardless of volatility
Mode Selection: Enable "Use Adaptive RR" for ATR-based targets, disable for fixed percentages. Adaptive mode works better in varying volatility conditions, while fixed mode provides predictable risk/reward ratios.
Stop Loss Management
In Adaptive SL Mode:
Automatically scales with market volatility
Tight stops during low volatility (smaller ATR)
Wider stops during high volatility (larger ATR)
Include 0.3% slippage buffer in both modes
In Fixed Mode:
Consistent percentage-based stops
2% for crypto, 1.5% for forex, 1% for stocks
Manual adjustment needed for different market conditions
Trailing Stop System
Configuration:
Enable Trailing: Activates dynamic stop loss adjustment
Start Trailing %: Profit level to begin trailing (default 1.0%)
Trailing Offset %: Distance from current price (default 0.5%)
Close if Return to Entry: Optional immediate exit if price returns to entry level
Operation: Once position reaches trailing start level, stop loss automatically adjusts upward (longs) or downward (shorts) maintaining the offset distance from favorable price movement.
Timeframe-Specific Risk Considerations
15-Minute and Above (Tested):
✅ Full MTF system active
✅ Standard risk parameters apply
✅ Backtested performance metrics valid
✅ Standard position sizing (5%)
5-Minute Timeframes (Advanced Only):
⚠️ MTF system inactive - local signals only
⚠️ Higher false signal rate expected
⚠️ Reduced position sizing preferred (3%)
⚠️ Tighter stop losses required (0.8% vs 1.2%)
⚠️ Requires parameter optimization
⚠️ Monitor performance closely
1-Minute Timeframes (Limited Testing):
❌ Excessive noise levels
❌ Strategy not optimized for this frequency
Risk Management Practices
Allocate no more than 5% of your total investment portfolio to high-risk trading
Never trade with funds you cannot afford to lose
Thoroughly backtest and validate the strategy with small amounts before full implementation
Always maintain proper risk management and stop-loss settings
IMPORTANT DISCLAIMERS
Performance Disclaimer
Past performance does not guarantee future results. All trading involves substantial risk of loss. This strategy is provided for informational purposes and does not constitute financial advice.
Market Risk
Cryptocurrency and forex markets are highly volatile. Prices can move rapidly against positions, resulting in significant losses. Users should never risk more than they can afford to lose.
Strategy Limitations
This strategy relies on technical analysis and may not perform well during fundamental market shifts, news events, or unprecedented market conditions. No trading strategy can guarantee 100% success or eliminate the risk of loss.
Legal Compliance
You are responsible for compliance with all applicable regulations and laws in your jurisdiction. Consult with licensed financial professionals when necessary.
User Responsibility
Users are responsible for their own trading decisions, risk management, and compliance with applicable regulations in their jurisdiction.

Dskyz (DAFE) Quantum Sentiment Flux - Beginners Dskyz (DAFE) Quantum Sentiment Flux - Beginners:
Welcome to the Dskyz (DAFE) Quantum Sentiment Flux - Beginners , a strategy and concept that’s your ultimate wingman for trading futures like MNQ, NQ, MES, and ES. This gem combines lightning-fast momentum signals, market sentiment smarts, and bulletproof risk management into a system so intuitive, even newbies can trade like pros. With clean DAFE visuals, preset modes for every vibe, and a revamped dashboard that’s basically a market GPS, this strategy makes futures trading feel like a high-octane sci-fi mission.
Built on the Dskyz (DAFE) legacy of Aurora Divergence, the Quantum Sentiment Flux is designed to empower beginners while giving seasoned traders a lean, sentiment-driven edge. It uses fast/slow EMA crossovers for entries, filters trades with VIX, SPX trends, and sector breadth, and keeps your account safe with adaptive stops and cooldowns. Tuned for more action with faster signals and a slick bottom-left dashboard, this updated version is ready to light up your charts and outsmart institutional traps. Let’s dive into why this strat’s a must-have and break down its brilliance.
Why Traders Need This Strategy
Futures markets are a wild ride—fast moves, volatility spikes (like the April 28, 2025 NQ 1k-point drop), and institutional games that can wreck unprepared traders. Beginners often get lost in complex systems or burned by impulsive trades. The Quantum Sentiment Flux is the antidote, offering:
Dead-Simple Setup: Preset modes (Aggressive, Balanced, Conservative) auto-tune signals, risk, and sizing, so you can trade without a quant degree.
Sentiment Superpower: VIX filter, SPX trend, and sector breadth visuals keep you aligned with market health, dodging chop and riding trends.
Ironclad Safety: Tighter ATR-based stops, 2:1 take-profits, and preset cooldowns protect your capital, even in chaotic sessions.
Next-Level Visuals: Green/red entry triangles, vibrant EMAs, a sector breadth background, and a beefed-up dashboard make signals and context pop.
DAFE Swagger: The clean aesthetics, sleek dashboard—ties it to Dskyz’s elite brand, making your charts a work of art.
Traders need this because it’s a plug-and-play system that blends beginner-friendly simplicity with pro-level market awareness. Whether you’re just starting or scalping 5min MNQ, this strat’s your key to trading with confidence and style.
Strategy Components
1. Core Signal Logic (High-Speed Momentum)
The strategy’s engine is a momentum-based system using fast and slow Exponential Moving Averages (EMAs), now tuned for faster, more frequent trades.
How It Works:
Fast/Slow EMAs: Fast EMA (Aggressive: 5, Balanced: 7, Conservative: 9 bars) and slow EMA (12/14/18 bars) track short-term vs. longer-term momentum.
Crossover Signals:
Buy: Fast EMA crosses above slow EMA, and trend_dir = 1 (fast EMA > slow EMA + ATR * strength threshold).
Sell: Fast EMA crosses below slow EMA, and trend_dir = -1 (fast EMA < slow EMA - ATR * strength threshold).
Strength Filter: ma_strength = fast EMA - slow EMA must exceed an ATR-scaled threshold (Aggressive: 0.15, Balanced: 0.18, Conservative: 0.25) for robust signals.
Trend Direction: trend_dir confirms momentum, filtering out weak crossovers in choppy markets.
Evolution:
Faster EMAs (down from 7–10/21–50) catch short-term trends, perfect for active futures markets.
Lower strength thresholds (0.15–0.25 vs. 0.3–0.5) make signals more sensitive, boosting trade frequency without sacrificing quality.
Preset tuning ensures beginners get optimized settings, while pros can tweak via mode selection.
2. Market Sentiment Filters
The strategy leans hard into market sentiment with a VIX filter, SPX trend analysis, and sector breadth visuals, keeping trades aligned with the big picture.
VIX Filter:
Logic: Blocks long entries if VIX > threshold (default: 20, can_long = vix_close < vix_limit). Shorts are always allowed (can_short = true).
Impact: Prevents longs during high-fear markets (e.g., VIX spikes in crashes), while allowing shorts to capitalize on downturns.
SPX Trend Filter:
Logic: Compares S&P 500 (SPX) close to its SMA (Aggressive: 5, Balanced: 8, Conservative: 12 bars). spx_trend = 1 (UP) if close > SMA, -1 (DOWN) if < SMA, 0 (FLAT) if neutral.
Impact: Provides dashboard context, encouraging trades that align with market direction (e.g., longs in UP trend).
Sector Breadth (Visual):
Logic: Tracks 10 sector ETFs (XLK, XLF, XLE, etc.) vs. their SMAs (same lengths as SPX). Each sector scores +1 (bullish), -1 (bearish), or 0 (neutral), summed as breadth (-10 to +10).
Display: Green background if breadth > 4, red if breadth < -4, else neutral. Dashboard shows sector trends (↑/↓/-).
Impact: Faster SMA lengths make breadth more responsive, reflecting sector rotations (e.g., tech surging, energy lagging).
Why It’s Brilliant:
- VIX filter adds pro-level volatility awareness, saving beginners from panic-driven losses.
- SPX and sector breadth give a 360° view of market health, boosting signal confidence (e.g., green BG + buy signal = high-probability trade).
- Shorter SMAs make sentiment visuals react faster, perfect for 5min charts.
3. Risk Management
The risk controls are a fortress, now tighter and more dynamic to support frequent trading while keeping accounts safe.
Preset-Based Risk:
Aggressive: Fast EMAs (5/12), tight stops (1.1x ATR), 1-bar cooldown. High trade frequency, higher risk.
Balanced: EMAs (7/14), 1.2x ATR stops, 1-bar cooldown. Versatile for most traders.
Conservative: EMAs (9/18), 1.3x ATR stops, 2-bar cooldown. Safer, fewer trades.
Impact: Auto-scales risk to match style, making it foolproof for beginners.
Adaptive Stops and Take-Profits:
Logic: Stops = entry ± ATR * atr_mult (1.1–1.3x, down from 1.2–2.0x). Take-profits = entry ± ATR * take_mult (2x stop distance, 2:1 reward/risk). Longs: stop below entry, TP above; shorts: vice versa.
Impact: Tighter stops increase trade turnover while maintaining solid risk/reward, adapting to volatility.
Trade Cooldown:
Logic: Preset-driven (Aggressive/Balanced: 1 bar, Conservative: 2 bars vs. old user-input 2). Ensures bar_index - last_trade_bar >= cooldown.
Impact: Faster cooldowns (especially Aggressive/Balanced) allow more trades, balanced by VIX and strength filters.
Contract Sizing:
Logic: User sets contracts (default: 1, max: 10), no preset cap (unlike old 7/5/3 suggestion).
Impact: Flexible but risks over-leverage; beginners should stick to low contracts.
Built To Be Reliable and Consistent:
- Tighter stops and faster cooldowns make it a high-octane system without blowing up accounts.
- Preset-driven risk removes guesswork, letting newbies trade confidently.
- 2:1 TPs ensure profitable trades outweigh losses, even in volatile sessions like April 27, 2025 ES slippage.
4. Trade Entry and Exit Logic
The entry/exit rules are simple yet razor-sharp, now with VIX filtering and faster signals:
Entry Conditions:
Long Entry: buy_signal (fast EMA crosses above slow EMA, trend_dir = 1), no position (strategy.position_size = 0), cooldown passed (can_trade), and VIX < 20 (can_long). Enters with user-defined contracts.
Short Entry: sell_signal (fast EMA crosses below slow EMA, trend_dir = -1), no position, cooldown passed, can_short (always true).
Logic: Tracks last_entry_bar for visuals, last_trade_bar for cooldowns.
Exit Conditions:
Stop-Loss/Take-Profit: ATR-based stops (1.1–1.3x) and TPs (2x stop distance). Longs exit if price hits stop (below) or TP (above); shorts vice versa.
No Other Exits: Keeps it straightforward, relying on stops/TPs.
5. DAFE Visuals
The visuals are pure DAFE magic, blending clean function with informative metrics utilized by professionals, now enhanced by faster signals and a responsive breadth background:
EMA Plots:
Display: Fast EMA (blue, 2px), slow EMA (orange, 2px), using faster lengths (5–9/12–18).
Purpose: Highlights momentum shifts, with crossovers signaling entries.
Sector Breadth Background:
Display: Green (90% transparent) if breadth > 4, red (90%) if breadth < -4, else neutral.
Purpose: Faster breadth_sma_len (5–12 vs. 10–50) reflects sector shifts in real-time, reinforcing signal strength.
- Visuals are intuitive, turning complex signals into clear buy/sell cues.
- Faster breadth background reacts to market rotations (e.g., tech vs. energy), giving a pro-level edge.
6. Sector Breadth Dashboard
The new bottom-left dashboard is a game-changer, a 3x16 table (black/gray theme) that’s your market command center:
Metrics:
VIX: Current VIX (red if > 20, gray if not).
SPX: Trend as “UP” (green), “DOWN” (red), or “FLAT” (gray).
Trade Longs: “OK” (green) if VIX < 20, “BLOCK” (red) if not.
Sector Breadth: 10 sectors (Tech, Financial, etc.) with trend arrows (↑ green, ↓ red, - gray).
Placeholder Row: Empty for future metrics (e.g., ATR, breadth score).
Purpose: Consolidates regime, volatility, market trend, and sector data, making decisions a breeze.
- VIX and SPX metrics add context, helping beginners avoid bad trades (e.g., no longs if “BLOCK”).
Sector arrows show market health at a glance, like a cheat code for sentiment.
Key Features
Beginner-Ready: Preset modes and clear visuals make futures trading a breeze.
Sentiment-Driven: VIX filter, SPX trend, and sector breadth keep you in sync with the market.
High-Frequency: Faster EMAs, tighter stops, and short cooldowns boost trade volume.
Safe and Smart: Adaptive stops/TPs and cooldowns protect capital while maximizing wins.
Visual Mastery: DAFE’s clean flair, EMAs, dashboard—makes trading fun and clear.
Backtestable: Lean code and fixed qty ensure accurate historical testing.
How to Use
Add to Chart: Load on a 5min MNQ/ES chart in TradingView.
Pick Preset: Aggressive (scalping), Balanced (versatile), or Conservative (safe). Balanced is default.
Set Contracts: Default 1, max 10. Stick low for safety.
Check Dashboard: Bottom-left shows preset, VIX, SPX, and sectors. “OK” + green breadth = strong buy.
Backtest: Run in strategy tester to compare modes.
Live Trade: Connect to Tradovate or similar. Watch for slippage (e.g., April 27, 2025 ES issues).
Replay Test: Try April 28, 2025 NQ drop to see VIX filter and stops in action.
Why It’s Brilliant
The Dskyz (DAFE) Quantum Sentiment Flux - Beginners is a masterpiece of simplicity and power. It takes pro-level tools—momentum, VIX, sector breadth—and wraps them in a system anyone can run. Faster signals and tighter stops make it a trading machine, while the VIX filter and dashboard keep you ahead of market chaos. The DAFE visuals and bottom-left command center turn your chart into a futuristic cockpit, guiding you through every trade. For beginners, it’s a safe entry to futures; for pros, it’s a scalping beast with sentiment smarts. This strat doesn’t just trade—it transforms how you see the market.
Final Notes
This is more than a strategy—it’s your launchpad to mastering futures with Dskyz (DAFE) flair. The Quantum Sentiment Flux blends accessibility, speed, and market savvy to help you outsmart the game. Load it, watch those triangles glow, and let’s make the markets your canvas!
Official Statement from Pine Script Team
(see TradingView help docs and forums):
"This warning may appear when you call functions such as ta.sma inside a request.security in a loop. There is no runtime impact. If you need to loop through a dynamic list of tickers, this cannot be avoided in the present version... Values will still be correct. Ignore this warning in such contexts."
(This publishing will most likely be taken down do to some miscellaneous rule about properly displaying charting symbols, or whatever. Once I've identified what part of the publishing they want to pick on, I'll adjust and repost.)
Use it with discipline. Use it with clarity. Trade smarter.
**I will continue to release incredible strategies and indicators until I turn this into a brand or until someone offers me a contract.
Created by Dskyz, powered by DAFE Trading Systems. Trade fast, trade bold.

NUTJP CDC ActionZone 20241. Core Components of the Strategy
• Fast EMA and Slow EMA:
• The Fast EMA (shorter period) is more reactive to recent price changes.
• The Slow EMA (longer period) reacts slower and provides a smoother view of the overall trend.
• Relationship Between Fast EMA and Slow EMA:
• When the Fast EMA is above the Slow EMA, the market is considered Bullish.
• When the Fast EMA is below the Slow EMA, the market is considered Bearish.
2. Zones Based on Price and EMAs
The strategy defines six zones based on the position of the price, Fast EMA, and Slow EMA:
1. Green Zone (Buy):
• Bullish trend (Fast EMA > Slow EMA)
• Price is above the Fast EMA.
• Indicates a strong uptrend and suggests buying.
2. Blue and Light Blue Zones (Pre-Buy):
• Price is above the Fast EMA but below or near the Slow EMA.
• Represents potential bullish signals but not strong enough to trigger a buy.
3. Red Zone (Sell):
• Bearish trend (Fast EMA < Slow EMA)
• Price is below the Fast EMA.
• Indicates a strong downtrend and suggests selling or avoiding long trades.
4. Orange and Yellow Zones (Pre-Sell):
• Price is below the Fast EMA but above or near the Slow EMA.
• Represents potential bearish signals but not strong enough to trigger a sell.
These zones help traders visualize the market conditions and determine whether to buy, hold, or sell.
3. Buy and Sell Conditions
• Buy Condition:
A buy signal is triggered when:
• The price enters the Green Zone (Bullish trend and price > Fast EMA).
• It’s the first green candle after a non-green candle.
• Sell Condition:
A sell signal is triggered when:
• The price enters the Red Zone (Bearish trend and price < Fast EMA).
• It’s the first red candle after a non-red candle.
4. Trade Execution Logic
• Buy:
The strategy enters a long position (buy) when the above buy condition is met.
• Sell:
The strategy exits the long position when the sell condition is met.
Note: It doesn’t support short trades, meaning it doesn’t enter sell positions.
5. Momentum-Based Signals (Optional)
The indicator also includes momentum signals using Stochastic RSI to provide additional buy/sell signals:
• These are based on oversold and overbought levels of the Stochastic RSI.
• It filters signals depending on whether the trend is Bullish or Bearish.
6. Visual Features
The indicator is designed to make the trading zones and signals visually intuitive:
• Bar Colors:
Candlesticks are colored based on the current zone (e.g., Green for Buy, Red for Sell).
• EMA Lines:
The Fast EMA and Slow EMA are plotted, making it easy to see crossover points.
• Buy/Sell Signals:
Marked with shapes (e.g., circles) below/above bars for clarity.
7. Strategy Assumptions
• Trend-Following Nature:
This strategy assumes that trends persist. It works best in trending markets but might give false signals in ranging markets.
• Lagging Nature of EMAs:
As EMAs are lagging indicators, buy and sell signals may occur after significant moves have already begun or ended.
• Momentum Confirmation (Optional):
Adding momentum signals can help filter false signals, though it’s not part of the core logic.
8. Usage Recommendations
• Timeframes:
Works on various timeframes but may perform better on higher timeframes (e.g., 1H, Daily) to reduce noise.
• Markets:
Can be applied to stocks, forex, and cryptocurrencies.
• Backtesting and Optimization:
Before live trading, backtest the strategy with different EMA periods and other parameters to find optimal settings for your market and timeframe.

Options Scalper v2 - SPY/QQQHere's a comprehensive description of the Options Scalper v2 strategy:
---
## Options Scalper v2 - SPY/QQQ
### Overview
A multi-indicator confluence-based scalping strategy designed for trading SPY and QQQ options on short timeframes (1-5 minute charts). The strategy uses a scoring system to generate high-probability CALL and PUT signals by requiring alignment across multiple technical indicators before triggering entries.
---
### Core Logic
The strategy operates on a **scoring system (0-9 points)** where both bullish (CALL) and bearish (PUT) conditions are evaluated independently. A signal only fires when:
1. A recent EMA crossover occurred (within the last 3 bars)
2. The direction's score meets the minimum threshold (default: 4 points)
3. The signal's score is higher than the opposite direction
4. Enough bars have passed since the last signal (cooldown period)
5. Price action occurs during valid trading sessions
---
### Indicators Used
| Indicator | Purpose | CALL Condition | PUT Condition |
|-----------|---------|----------------|---------------|
| **9/21 EMA Cross** | Primary trigger | Fast EMA crosses above slow | Fast EMA crosses below slow |
| **200 EMA** | Trend filter | Price above 200 EMA | Price below 200 EMA |
| **RSI (14)** | Momentum filter | RSI between 45-65 | RSI between 35-55 |
| **VWAP** | Institutional level | Price above VWAP | Price below VWAP |
| **MACD (12,26,9)** | Momentum confirmation | MACD line > Signal line | MACD line < Signal line |
| **Stochastic (14,3)** | Overbought/Oversold | Oversold or K > D | Overbought or K < D |
| **Volume** | Participation confirmation | Spike on green candle | Spike on red candle |
| **Price Structure** | Breakout detection | Higher high formed | Lower low formed |
---
### Scoring Breakdown
**CALL Score (Max 9 points):**
- Recent EMA cross up: +2 pts
- EMA alignment (fast > slow): +1 pt
- RSI in bullish range: +1 pt
- Above VWAP: +1 pt
- MACD bullish: +1 pt
- Volume spike on green candle: +1 pt
- Stochastic setup: +1 pt
- Above 200 EMA: +1 pt
- Breaking higher high: +1 pt
**PUT Score (Max 9 points):**
- Recent EMA cross down: +2 pts
- EMA alignment (fast < slow): +1 pt
- RSI in bearish range: +1 pt
- Below VWAP: +1 pt
- MACD bearish: +1 pt
- Volume spike on red candle: +1 pt
- Stochastic setup: +1 pt
- Below 200 EMA: +1 pt
- Breaking lower low: +1 pt
---
### Risk Management
The strategy uses **ATR-based dynamic stops and targets**:
| Parameter | Default | Description |
|-----------|---------|-------------|
| Stop Loss | 1.5x ATR | Distance below entry for longs, above for shorts |
| Take Profit | 2.0x ATR | Creates a 1:1.33 risk-reward ratio |
Positions are also closed on:
- Opposite direction signal (flip trade)
- Take profit or stop loss hit
---
### Session Filtering
Trades are restricted to high-liquidity periods by default:
- **Morning Session:** 9:30 AM - 11:00 AM EST
- **Afternoon Session:** 2:30 PM - 3:55 PM EST
This avoids choppy midday price action and captures the highest volume periods.
---
### Input Parameters
| Parameter | Default | Description |
|-----------|---------|-------------|
| Fast EMA | 9 | Fast moving average period |
| Slow EMA | 21 | Slow moving average period |
| Trend EMA | 200 | Long-term trend filter |
| RSI Length | 14 | RSI calculation period |
| RSI Overbought | 65 | Upper RSI threshold |
| RSI Oversold | 35 | Lower RSI threshold |
| Volume Multiplier | 1.2x | Volume spike detection threshold |
| Min Signal Strength | 4 | Minimum score required to trigger |
| Crossover Lookback | 3 | Bars to consider crossover "recent" |
| Min Bars Between Signals | 5 | Cooldown period between signals |
---
### Visual Elements
**Chart Plots:**
- Green line: 9 EMA (fast)
- Red line: 21 EMA (slow)
- Gray line: 200 EMA (trend)
- Purple dots: VWAP
**Signal Markers:**
- Green triangle up + "CALL" label: Buy call signal
- Red triangle down + "PUT" label: Buy put signal
- Small circles: EMA crossover reference points
**Info Table (Top Right):**
- Real-time CALL and PUT scores
- RSI, MACD, Stochastic values
- VWAP and 200 EMA position
- Recent crossover status
- Current signal state
---
### Alerts
| Alert Name | Trigger |
|------------|---------|
| CALL Entry | Standard call signal fires |
| PUT Entry | Standard put signal fires |
| Strong CALL | Call signal with score ≥ 6 |
| Strong PUT | Put signal with score ≥ 6 |
---
### Recommended Usage
| Setting | 0DTE Scalping | Intraday Swings |
|---------|---------------|-----------------|
| Timeframe | 1-2 min | 5 min |
| Min Signal Strength | 5-6 | 4 |
| ATR Stop Mult | 1.0 | 1.5 |
| ATR TP Mult | 1.5 | 2.0 |
| Option Delta | 0.40-0.50 | 0.30-0.40 |
---
### Key Improvements Over v1
1. **Requires actual crossover** - Eliminates false signals from simple trend continuation
2. **Balanced scoring** - Both directions evaluated equally, highest score wins
3. **Signal cooldown** - Prevents overtrading with minimum bar spacing
4. **Multi-indicator confluence** - 8 factors must align for signal generation
5. **Volume-candle alignment** - Volume spikes only count when matching candle direction
---
### Disclaimer
This strategy is for educational purposes. Backtest thoroughly before live trading. Options trading involves significant risk of loss. Past performance does not guarantee future results.

RastaRasta — Educational Strategy (Pine v5)
Momentum · Smoothing · Trend Study
Overview
The Rasta Strategy is a visual and educational framework designed to help traders study momentum transitions using the interaction between a fast-reacting EMA line and a slower smoothed reference line.
It is not a signal generator or profit system; it’s a learning tool for understanding how smoothing, crossovers, and filters interact under different market conditions.
The script displays:
A primary EMA line (the fast reactive wave).
A Smoothed line (using your chosen smoothing method).
Optional fog zones between them for quick visual context.
Optional DNA rungs connecting both lines to illustrate volatility compression and expansion.
Optional EMA 8 / EMA 21 trend filter to observe higher-time-frame alignment.
Core Idea
The Rasta model focuses on wave interaction. When the fast EMA crosses above the smoothed line, it reflects a shift in short-term momentum relative to background trend pressure. Cross-unders suggest weakening or reversal.
Rather than treating this as a trading “signal,” use it to observe structure, study trend alignment, and test how smoothing type affects reaction speed.
Smoothing Types Explained
The script lets you experiment with multiple smoothing techniques:
Type Description Use Case
SMA (Simple Moving Average) Arithmetic mean of the last n values. Smooth and steady, but slower. Trend-following studies; filters noise on higher time frames.
EMA (Exponential Moving Average) Weights recent data more. Responds faster to new price action. Momentum or reactive strategies; quick shifts and reversals.
RMA (Relative Moving Average) Used internally by RSI; smooths exponentially but slower than EMA. Momentum confirmation; balanced response.
WMA (Weighted Moving Average) Linear weights emphasizing the most recent data strongly. Intraday scalping; crisp but potentially noisy.
None Disables smoothing; uses the EMA line alone. Raw comparison baseline.
Each smoothing method changes how early or late the strategy reacts:
Faster smoothing (EMA/WMA) = more responsive, good for scalping.
Slower smoothing (SMA/RMA) = more stable, good for trend following.
Modes of Study
🔹 Scalper Mode
Use short EMA lengths (e.g., 3–5) and fast smoothing (EMA or WMA).
Focus on 1 min – 15 min charts.
Watch how quick crossovers appear near local tops/bottoms.
Fog and rung compression reveal volatility contraction before bursts.
Goal: study short-term rhythm and liquidity pulses.
🔹 Momentum Mode
Use moderate EMA (5–9) and RMA smoothing.
Ideal for 1 H–4 H charts.
Observe how the fog color aligns with trend shifts.
EMA 8 / 21 filter can act as macro bias; “Enter” labels will appear only in its direction when enabled.
Goal: study sustained motion between pullbacks and acceleration waves.
🔹 Trend-Follower Mode
Use longer EMA (13–21) with SMA smoothing.
Great for daily/weekly charts.
Focus on periods where fog stays unbroken for long stretches — these illustrate clear trend dominance.
Watch rung spacing: tight clusters often precede consolidations; wide rungs signal expanding volatility.
Goal: visualize slow-motion trend transitions and filter whipsaw conditions.
Components
EMA Line (Red): Fast-reacting short-term direction.
Smoothed Line (Yellow): Reference trend baseline.
Fog Zone: Green when EMA > Smoothed (up-momentum), red when below.
DNA Rungs: Thin connectors showing volatility structure.
EMA 8 / 21 Filter (optional):
When enabled, the strategy will only allow Enter events if EMA 8 > EMA 21.
Use this to study higher-trend gating effects.
Educational Applications
Momentum Visualization: Observe how the fast EMA “breathes” around the smoothed baseline.
Trend Transitions: Compare different smoothing types to see how early or late reversals are detected.
Noise Filtering: Experiment with fog opacity and smoothing lengths to understand trade-off between responsiveness and stability.
Risk Concept Simulation: Includes a simple fixed stop-loss parameter (default 13%) for educational demonstrations of position management in the Strategy Tester.
How to Use
Add to Chart → “Strategy.”
Works on any timeframe and instrument.
Adjust Parameters:
Length: base EMA speed.
Smoothing Type: choose SMA, EMA, RMA, or WMA.
Smoothing Length: controls delay and smoothness.
EMA 8 / 21 Filter: toggles trend gating.
Fog & Rungs: visual study options only.
Study Behavior:
Use Strategy Tester → List of Trades for entry/exit context.
Observe how different smoothing types affect early vs. late “Enter” points.
Compare trend periods vs. ranging periods to evaluate efficiency.
Combine with External Tools:
Overlay RSI, MACD, or Volume for deeper correlation analysis.
Use replay mode to visualize crossovers in live sequence.
Interpreting the Labels
Enter: Marks where fast EMA crosses above the smoothed line (or when filter flips positive).
Exit: Marks where fast EMA crosses back below.
These are purely analytical markers — they do not represent trade advice.
Educational Value
The Rasta framework helps learners explore:
Reaction time differences between moving-average algorithms.
Impact of smoothing on signal clarity.
Interaction of local and global trends.
Visualization of volatility contraction (tight DNA rungs) and expansion (wide fog zones).
It’s a sandbox for studying price structure, not a promise of profit.
Disclaimer
This script is provided for educational and research purposes only.
It does not constitute financial advice, trading signals, or performance guarantees. Past market behavior does not predict future outcomes.
Users are encouraged to experiment responsibly, record observations, and develop their own understanding of price behavior.
Author: Michael Culpepper (mikeyc747)
License: Educational / Open for study and modification with credit.
Philosophy:
“Learning the rhythm of the market is more valuable than chasing its profits.” — Rasta

A Physicist's Bitcoin Trading Strategy
1. Summary
This strategy and indicator were designed for, and intended to be used to guide trading activity in, crypto markets, particularly Bitcoin. This strategy uses a custom indicator to determine the state of the market (bullish vs bearish) and allocates funds accordingly. This particular variation also uses the custom indicator to determine when the market is significantly oversold and takes advantage of the opportunity (it buys the dip). The specific mathematical formula that is used to calculate the underlying custom indicator allows the trader to get in before, or near the start of, the bull trends, and get out before the bear trends. The strategy's properties dialogue box includes many display settings and parameters for optimization and customization to meet the user's needs and risk tolerance; this is both a tool to gauge the market, as well as a trading strategy to beat the market. Guidelines for parameter settings are provided. A sample dataset of backtest results using randomized parameters, both within the guidelines and outside the guidelines, is available upon request; notably, all trials outperformed the intended market (Bitcoin) during the 9-year backtest period.
2. The Indicator and Strategy
2.1. The Indicator
A mathematical formula is used to determine the state of the market according to three different "frequencies", which, for lack of better terminology, are called fast, moderate, and slow indicators. There are two parameters for each of the three indicators, one called response time and the other is a simple look-back period. Finally, four exponential moving averages are used to smooth each indicator. In total, there are 18 different levels of bullishness/bearishness. The purpose of using three indicators, rather than one, is to capture the full character of the market, from a macro/global scope down to a micro/local scope. I.e. the full indicator looks at the forest, the trees, and the branches, simultaneously.
2.2. The Strategy
The trend-trading strategy is very simple; there are only four types of orders: 1) The entire position (e.g. all bitcoins held) is sold (if it hasn't already been totally sold) when the indicator becomes maximally bearish, 2) When the movement of the indicator is in the bullish direction, the strategy dollar-cost-average (DCA) buys at an exponentially decreasing rate, i.e. it buys more in the early stages of the transition from bear->bull. 3) When the indicator is maximally bullish, it goes "all-in" † (if it hasn't already gone all-in), i.e. it converts all available cash into the underlying security/token. And, 4) when the movement of the indicator is in the bearish direction, the strategy DCA sells (again, exponentially decreasing) to get out quickly. No leverage is used in this strategy. The strategy never takes a short position.
A second "buy-the-dip" strategy is also used, and it is the synergy of these two strategies, together, that is responsible for most of the outperformance in the backtests (this strategy handily beats the non-dip-buying variation in backtests). To do this, the custom indicator is used to determine when the market is significantly oversold on a short-term basis, and the strategy responds by DCA buying. However, unlike the DCA buying during bull/bear transitions, the buy-the-dip DCA buying increases with time. Specifically, within each candle that is short-term oversold, the strategy converts 10% x # of candles since becoming oversold (up to a max of 6 candles) of available cash into the underlying security/token. I.e. the first buy is 10% of available cash and occurs in the first oversold candle, the second buy is 20% of available cash and occurs in the second oversold candle, etc. up to six consecutive oversold candles. Lastly, to ensure no conflicting orders and no leverage (buying more than what is affordable with the available cash in the fund), buy-the-dip orders take precedence over the trend-trading orders enumerated in the previous paragraph.
† Technically the strategy goes 99.5% in when it goes "all-in". This is to ensure no leverage is used given that there may be a commission of 0.5%.
3. Backtest Results
Backtest results demonstrate significant outperformance over buy-and-hold. The default parameters of the strategy/indicator have been set by the author to achieve maximum (or, close to maximum) outperformance on backtests executed on the BTCUSD (Bitcoin) chart. However, significant outperformance over buy-and-hold is still easily achievable using non-default parameters. Basically, as long as the parameters are set to adequately capture the full character of the market, significant outperformance on backtests is achievable and is quite easy. In fact, after some experimentation, it seems as if underperformance hardly achievable and requires deliberately setting the parameters illogically (e.g. setting one parameter of the slow indicator faster than the fast indicator). In the interest of providing a quality product to the user, suggestions and guidelines for parameter settings are provided in section (6). Finally, some metrics of the strategy's outperformance on the BTCUSD chart are listed below, both for the default (optimal) parameters as well as for a random sample of parameter settings that adhere to the guidelines set forth in section (6).
Using the default parameters, relative to buy-and-hold strategy, backtested from August 2011 to August 2020,
Total cumulative outperformance (total return of strategy minus total return of buy-n-hold): 13,000,000%.
Rolling 1-year outperformance: mean 318%, median 84%, 1st quartile 55%, 3rd quartile, 430%.
Rolling 1-month outperformance: mean 2.8% (annualized, 39%), median -2.1%, 1st quartile -7.7%, 3rd quartile 13.2%, 10th percentile -13.9%, 90th percentile 24.5%.
Using the default parameters, relative to buy-and-hold strategy, during specific periods,
Cumulative outperformance during the past year (August 2019-August 2020): 37%.
12/17/2016 - 12/17/2017 (2017 bull market) absolute performance of 2563% vs buy-n-hold absolute performance of 2385%
11/29/2012 - 11/29/2013 (2013 bull market) absolute performance of 14033% vs buy-n-hold absolute performance of 9247%
Using a random sample (n=20) of combinations of parameter settings that adhere to the guidelines outlined in section (6), relative to buy-and-hold strategy, backtested from August 2011 to August 2020,
Average total cumulative outperformance, from August 2011 to August 2020: 2,000,000%.
Median total cumulative outperformance, from August 2011 to August 2020: 1,000,000%.
4. Limitations
This strategy is basically a DCA-swing trading strategy, and as such it is intended to be used on the 6-hr chart. Similar performance is expected on daily chart, 12-hr chart, and 4-hr chart, but performance is likely to be limited when used on charts of shorter time-frames. However, due to the flexibility afforded by the large quantity of parameters, as well as the tools included, it may be possible to tweak the indicator settings to get some outperformance on smaller time-frames. Admittedly, the author did not spend much time investigating this.
As is apparent in the backtests, this strategy has very limited absolute performance during large bear markets, such as Bitcoin's 2018 bear market. As described, it does outperform the underlying security by a large amount in backtests, but a large absolute return is unlikely during large and prolonged declines (unless, of course, your unit of account is the underlying token, in which case an outperformance of the underlying is, by definition, an absolute positive return).
This strategy is likely to underperform if used to trade ETFs of broad equity markets. This strategy may produce a small amount of outperformance when used to trade precious metals ETFs, given that the parameters are set optimally by the user.
5. Use
The default parameters have already been set for highly optimal backtest results on the chart of BTCUSD (Bitcoin / US Dollar BITSTAMP), (although, a different combination of parameter settings may yet produce better results). Still, there is a great number of combinations that can be explored, so the user is free to tweak the settings to meet his/her/their needs. Some display options are provided to give the user a visual aid while tweaking the parameters. These include a blue/red background display of the custom indicator, a calibration system, and options to display information about the backtest results. The background pattern represents the various levels of bullishness/bearishness as semi-transparent layers of blue and red, with blue corresponding with bullish and red corresponding with bearish.
The parameters that affect the indicator are the response times, the periods, and some EMA lengths. The parameters that affect the quantity of contracts (tokens/shares/bitcoins/etc) to be bought/sold are the transitionary buy/sell rates. There are also two sets of date parameters.
The response time and period parameters are direct inputs into the underlying math formula and are used to create the base-level indicators (fast, moderate, and slow). The response times control the speed of each of the three indicators (shorter is fast, longer is slower) and the period controls how much historical data is used in computation. Information about how these should be set are included in section (6). Another set of parameters control EMA look-back periods that serve to smooth the base-level indicators. Increasing these EMA lengths makes the overall indicator less sensitive to short-term price action, while reducing them does the opposite. The effect of these parameters are obvious when the background blue/red visualization is displayed. Another EMA length is an EMA for the entire indicator. Increasing this parameter reduces the responsiveness of the trading strategy (buy/sell orders) to quick/small changes of the overall level of the indicator, so as to avoid unnecessary buying and selling in times of relatively small and balanced price perturbations. Note, changing this parameter does not have an effect on the overall indicator itself, and thus will not affect the blue/red background representation.
The transitionary buy/sell rates control the portion of the available asset to be converted to the other. E.g. if the buy rate is set to 90%, then 90% of the available cash will be used to buy contracts/tokens/shares/bitcoins during transitions bullish transitions, e.g. if the available cash at the start of the bullish transition is $10,000 and the parameter is set to 90%, then $9,000 will be used to buy in the first candle during which the transition is bullish, then $900 will be used to buy in the second candle, then $90 in the third candle, etc.
There are two dates that can be set. The first is the date at which the strategy goes all in. This is included because the buy-and-hold strategy is the benchmark against which this strategy is compared, so setting this date to some time before the strategy starts to make trades will show, very clearly, the outperformance of the strategy, especially when the initial capital parameter in the Properties tab is equal to the price of one unit of the underlying security on the date that is set, e.g. all-in on Bitcoin on 8/20/2011 and set initial capital to the BTCUSD price on that date, which was $11.70. The second date is a date to control when the strategy can begin to place trades.
Finally (actually, firstly in the Inputs dialogue box), a set of checkbox inputs controls whether or not the backtest is on or off, and what is displayed. The display options are the blue/red (bull/bear) background layers †, a set of calibrators, a plot of the total strategy equity, a plot of the cash position of the strategy, a plot of the size of the position of the strategy in contracts/shares/units (labeled as BTC position), and a plot of the rolling 1-year performances of buy-and-hold and the strategy.
About the calibrators: The calibration system allows the user to quickly assess and calibrate how well the indicator... indicates. Quite simply, the system has two parts: one plot that is the cumulative sum of the product of the indicator level and the change in the underlying price, i.e. sum of ‡, over all candles. The second part is a similar plot that is reduced according to the quickness with which the indicator changes, i.e. sum of . Maximizing the first plot at the expense of the second will cause the indicator to match the price action very well but therefore it will change very rapidly, from bullish to bearish, which is visualized by a background pattern that changes frequently from blue to red to blue. Ignoring the first plot and maximizing the second will also cause the indicator to more closely match the price action, but the transitions will be slower and less frequent, and will therefore focus on identifying the major trends of the market.
† The blue/red background has many layers and will make the chart lag as the user interacts with it.
‡ Bearish states are coded as negative quantities, so a bearish state x negative price action = positive number, and bullish state x positive price action = positive number.
6. Suggestions and Guidelines
As described in section (2.1), the indicator used in this strategy was designed to determine the state of the market--whether it is bullish or bearish--as well as the change in the state of the market--whether it is increasingly bullish or increasingly bearish. As such, the following suggestions are provided based on the principles of the indicator's design,
1. Response Time 1 should be less than (<) Response Time 2 which should be < Response Time 3
2. Fast Period < Moderate Period < Slow Period
3. In terms of the period of a full market cycle (e.g. ~ 4 years for BTC, ~ 5.5 years for equities, etc.), response times 1, 2, and 3 should be about 0.3% to 1%, 3% to 20%, and 20% to 50% of a full market cycle period, respectively. However, this is a loose guideline.
4. In terms of the period of a full market cycle, periods 1, 2, and 3 should all be about 25% to 75% of a full cycle period. Again, this is a loose guideline.
4. EMA 1 Length < EMA 2 Length < EMA 3 Length < EMA 4 Length
5. EMA Lengths 1, 2, 3, and 4 should be limited to about 1/4th the length of a full market cycle. Note, EMA lengths are measured in bars (candles), not in days. 1/4th of 1000 days is 250 days which is 250 x 4 = 1000 6-hr candles.
The following guidelines are provided based on results of over 100 backtests on the BTCUSD chart using randomized parameters †,
1. 9 days < Response Time 1 < 14 days
2. 5 days < EMA 1 Length < 100 days
3. 600 days < EMA 4 length < 1000 days
4. The ratio of the EMA range (EMA 4 len - EMA 1 len) to the sum of EMA lengths (EMA 1 len + EMA 2 len + ...) be greater than 0.4
5. The ratio of the sum of EMA 1 and EMA 2 lengths to the sum of EMA 3 and EMA 4 lengths be less than 0.3.
A suggestion from the author: Given that backtests show a high degree of outperformance using the guidelines enumerated above, a good trading strategy may be to not rely on any one particular combination of parameters. Rather, a random set of combinations of parameter settings that adhere to the guidelines above could be used to create multiple instances of the strategy in a TradingView chart, each of which varies by a small amount due to their unique parameter settings. The proportion of the entire set of strategy instances that agree about the current state of the market could indicate to the trader the level of confidence of the indicator, in aggregate.
† A sample dataset of backtest results using randomized parameters is available upon request; notably, all trials outperformed the intended market (Bitcoin).
7. General Remarks About the Indicator
Other than some exponential moving averages, no traditional technical indicators or technical analysis tools are employed in this strategy. No MACD, no RSI, no CMF, no Bollinger bands, parabolic SARs, Ichimoku clouds, hoosawatsits, XYZs, ABCs, whatarethese. No tea leaves can be found in this strategy, only mathematics. It is in the nature of the underlying math formula, from which the indicator is produced, to quickly identify trend changes.
8. Remarks About Expectations of Future Results and About Backtesting
8.1. In General
As it's been stated in many prospectuses and marketing literature, "past performance is no guarantee of future results." Backtest results are retrospective, and hindsight is 20/20. Therefore, no guarantee can, nor should, be expressed by me or anybody else who is selling a financial product (unless you have a money printer, like the Federal Reserve does).
8.2. Regarding This Strategy
No guarantee of future results using this strategy is expressed by the author, not now nor at any time in the future.
With that written, the author is free to express his own expectations and opinions based on his intimate knowledge of how the indicator works, and the author will take that liberty by writing the following: As described in section (7), this trading strategy does not include any traditional technical indicators or TA tools (other than smoothing EMAs). Instead, this strategy is based on a principle that does not change, it employs a complex indicator that is based on a math formula that does not change, and it places trades based on five simple rules that do not change. And, as described in section (2.1), the indicator is designed to capture the full character of the market, from a macro/global scope down to a micro/local scope. Additionally, as described in section (3), outperformance of the market for which this strategy was intended during backtesting does not depend on luckily setting the parameters "just right." In fact, all random combinations of parameter settings that followed the guidelines outperformed the intended market in backtests. Additionally, no parameters are included within the underlying math formula from which the indicator is produced; it is not as if the formula contains a "5" and future outperformance would depend on that "5" being a "6" instead. And, again as described, it is in the nature of the formula to quickly identify trend changes. Therefore, it is the opinion of the author that the outperformance of this strategy in backtesting is directly attributable to the fundamental nature of the math formula from which the indicator is produced. As such, it is also the opinion of the author that continued outperformance by using this strategy, applied to the crypto (Bitcoin) market, is likely, given that the parameter settings are set reasonably and in accordance with the guidelines. The author does not, however, expect future outperformance of this strategy to match or exceed the outperformance observed in backtests using the default parameters, i.e. it probably won't outperform by anything close to 13,000,000% during the next 9 years.
Additionally, based on the rolling 1-month outperformance data listed in section (3), expectations of short-term outperformance should be kept low; the median 1-month outperformance was -2%, so it's basically a 50/50 chance that any significant outperformance is seen in any given month. The true strength of this strategy is to be out of the market during large, sharp declines and capitalizing on the opportunities presented at the bottom of those declines by buying the dip. Given that such price action does not happen every month, outperformance in the initial months of use is approximately as likely as underperformance.
9. Access
Those who are interested in using this strategy may send a personal message to inquire about how to gain access. Those who are interested in acquiring the sample dataset of backtest results may send a personal message to request a copy of the data.

XPloRR MA-Trailing-Stop StrategyXPloRR MA-Trailing-Stop Strategy
Long term MA-Trailing-Stop strategy with Adjustable Signal Strength to beat Buy&Hold strategy
None of the strategies that I tested can beat the long term Buy&Hold strategy. That's the reason why I wrote this strategy.
Purpose: beat Buy&Hold strategy with around 10 trades. 100% capitalize sold trade into new trade.
My buy strategy is triggered by the fast buy EMA (blue) crossing over the slow buy SMA curve (orange) and the fast buy EMA has a certain up strength.
My sell strategy is triggered by either one of these conditions:
the EMA(6) of the close value is crossing under the trailing stop value (green) or
the fast sell EMA (navy) is crossing under the slow sell SMA curve (red) and the fast sell EMA has a certain down strength.
The trailing stop value (green) is set to a multiple of the ATR(15) value.
ATR(15) is the SMA(15) value of the difference between the high and low values.
The scripts shows a lot of graphical information:
The close value is shown in light-green. When the close value is lower then the buy value, the close value is shown in light-red. This way it is possible to evaluate the virtual losses during the trade.
the trailing stop value is shown in dark-green. When the sell value is lower then the buy value, the last color of the trade will be red (best viewed when zoomed)(in the example, there are 2 trades that end in gain and 2 in loss (red line at end))
the EMA and SMA values for both buy and sell signals are shown as a line
the buy and sell(close) signals are labeled in blue
How to use this strategy?
Every stock has it's own "DNA", so first thing to do is tune the right parameters to get the best strategy values voor EMA , SMA, Strength for both buy and sell and the Trailing Stop (#ATR).
Look in the strategy tester overview to optimize the values Percent Profitable and Net Profit (using the strategy settings icon, you can increase/decrease the parameters)
Then keep using these parameters for future buy/sell signals only for that particular stock.
Do the same for other stocks.
Important : optimizing these parameters is no guarantee for future winning trades!
Here are the parameters:
Fast EMA Buy: buy trigger when Fast EMA Buy crosses over the Slow SMA Buy value (use values between 10-20)
Slow SMA Buy: buy trigger when Fast EMA Buy crosses over the Slow SMA Buy value (use values between 30-100)
Minimum Buy Strength: minimum upward trend value of the Fast SMA Buy value (directional coefficient)(use values between 0-120)
Fast EMA Sell: sell trigger when Fast EMA Sell crosses under the Slow SMA Sell value (use values between 10-20)
Slow SMA Sell: sell trigger when Fast EMA Sell crosses under the Slow SMA Sell value (use values between 30-100)
Minimum Sell Strength: minimum downward trend value of the Fast SMA Sell value (directional coefficient)(use values between 0-120)
Trailing Stop (#ATR): the trailing stop value as a multiple of the ATR(15) value (use values between 2-20)
Example parameters for different stocks (Start capital: 1000, Order=100% of equity, Period 1/1/2005 to now) compared to the Buy&Hold Strategy(=do nothing):
BEKB(Bekaert): EMA-Buy=12, SMA-Buy=44, Strength-Buy=65, EMA-Sell=12, SMA-Sell=55, Strength-Sell=120, Stop#ATR=20
NetProfit: 996%, #Trades: 6, %Profitable: 83%, Buy&HoldProfit: 78%
BAR(Barco): EMA-Buy=16, SMA-Buy=80, Strength-Buy=44, EMA-Sell=12, SMA-Sell=45, Strength-Sell=82, Stop#ATR=9
NetProfit: 385%, #Trades: 7, %Profitable: 71%, Buy&HoldProfit: 55%
AAPL(Apple): EMA-Buy=12, SMA-Buy=45, Strength-Buy=40, EMA-Sell=19, SMA-Sell=45, Strength-Sell=106, Stop#ATR=8
NetProfit: 6900%, #Trades: 7, %Profitable: 71%, Buy&HoldProfit: 2938%
TNET(Telenet): EMA-Buy=12, SMA-Buy=45, Strength-Buy=27, EMA-Sell=19, SMA-Sell=45, Strength-Sell=70, Stop#ATR=14
NetProfit: 129%, #Trade

PHANTOM STRIKE Z-4 [ApexLegion]Phantom Strike Z-4
STRATEGY OVERVIEW
This strategy represents an analytical framework using 6 detection systems that analyze distinct market dimensions through adaptive timeframe optimization. Each system targets specific market inefficiencies - automated parameter adjustment, market condition filtering, phantom strike pattern detection, SR exit management, order block identification, and volatility-aware risk management - with results processed through a multi-component scoring calculation that determines signal generation and position management decisions.
SYSTEM ARCHITECTURE PHILOSOPHY
Phantom Strike Z-4 operates through 12 distinct parameter groups encompassing individual settings that allow detailed customization for different trading environments. The strategy employs modular design principles where each analytical component functions independently while contributing to unified decision-making protocols. This architecture enables traders to engage with structured market analysis through intuitive configuration options while the underlying algorithms handle complex computational processes.
The framework approaches certain aspects differently from static trading approaches by implementing real-time parameter adjustment based on timeframe characteristics, market volatility conditions, news event detection, and weekend gap analysis. During low-volatility periods where traditional strategies struggle to generate meaningful returns, Z-4's adaptive systems identify micro-opportunities through formation analysis and systematic patience protocols.
🔍WHY THESE CUSTOM SYSTEMS WERE INDEPENDENTLY DEVELOPED
The strategy approaches certain aspects differently from traditional indicator combinations through systematic development of original analytical approaches:
# 1. Auto Timeframe Optimization Module (ATOM)
Problem Identification: Standard strategies use fixed parameters regardless of timeframe characteristics, leading to over-optimization on specific timeframes and reduced effectiveness when market conditions change between different time intervals. Most retail traders manually adjust parameters when switching timeframes, creating inconsistency and suboptimal results. Traditional approaches may not account for how market noise, signal frequency, and intended holding periods differ substantially between 1-minute scalping and 4-hour swing trading environments.
Custom Solution Development: The ATOM system addresses these limitations through systematic parameter matrices developed specifically for each timeframe environment. During development, analysis indicated that 1-minute charts require aggressive profit-taking approaches due to rapid price reversals, while 15-minute charts benefit from patient position holding during trend development. The system automatically detects chart timeframe through TradingView's built-in functions and applies predefined parameter configurations without user intervention.
Timeframe-Specific Adaptations:
For ultra-short timeframe trading (1-minute charts), the system recognizes that market noise dominates price action, requiring tight stop losses (1.0%) and rapid profit realization (25% at TP1, 35% at TP2, 40% at TP3). Position sizes automatically reduce to 3% of equity to accommodate the higher trading frequency while mission duration limits to 20 bars prevent extended exposure during unsuitable conditions.
Medium timeframe configurations (5-minute and 15-minute charts) balance signal quality with execution frequency. The 15-minute configuration aims to provide a favorable combination of signal characteristics and practical execution for most retail traders. Formation thresholds increase to 2.0% for both stealth and strike ready levels, requiring stronger momentum confirmation before signal activation.
Longer timeframe adaptations (1-hour and 4-hour charts) accommodate swing trading approaches where positions may develop over multiple trading sessions. Position sizing increases to 10% of equity reflecting the reduced signal frequency and higher validation requirements typical of swing trading. Take profit targets extend considerably (TP1: 2.0%, TP2: 4.0%, TP3: 8.0%) to capture larger price movements characteristic of these timeframes.
# 2. Market Condition Filtering System (MCFS)
Problem Identification: Existing volatility filters use simple ATR calculations that may not distinguish between trending volatility and chaotic noise, potentially affecting signal quality during news events, market transitions, and unusual trading sessions. Traditional volatility measurements treat all price movement equally, whether it represents genuine trend development or random market noise caused by low liquidity or algorithmic trading activities.
Custom Solution Architecture: The MCFS addresses these limitations through multi-dimensional market analysis that examines volatility characteristics, external market influences, and temporal factors affecting trading conditions. Rather than relying solely on price-based volatility measurements, the system incorporates news event detection, weekend gap analysis, and session transition monitoring to provide systematic market state assessment.
Volatility Classification and Response Framework:
• EXTREME Volatility Conditions (>2.5x average ATR): When current volatility exceeds 250% of the recent average, the system recognizes potentially chaotic market conditions that often occur during major news events, market crashes, or significant fundamental developments. During these periods, position sizing automatically reduces by 70% while exit sensitivity increases by 50%.
• HIGH Volatility Conditions (1.8-2.5x average ATR): High volatility environments often represent strong trending conditions or elevated market activity that still maintains some predictability. Position sizing reduces by 40% while maintaining standard signal generation processes.
• NORMAL Volatility Conditions (1.2-1.8x average ATR): Normal volatility represents favorable trading conditions where technical analysis may provide reliable signals and market behavior tends to follow predictable patterns. All strategy parameters operate at standard settings.
• LOW Volatility Conditions (0.8-1.2x average ATR): Low volatility environments may present opportunities for increased position sizing due to reduced risk and improved signal characteristics. Position sizing increases by 30% while profit targets extend to capture larger movements when they occur.
• DEAD Volatility Conditions (<0.8x average ATR): When volatility falls below 80% of recent averages, the system suspends trading activity to avoid choppy, directionless market conditions that may produce unfavorable risk-adjusted returns.
# 3. Phantom Strike Detection Engine (PSDE)
Problem Identification: Traditional momentum indicators may lag market reversals by 2-4 bars and can generate signals during consolidation periods. Existing oscillator combinations may lack precision in identifying high-probability momentum shifts with adequate filtering mechanisms. Most trading systems rely on single-indicator signals or simple two-indicator confirmations that may not distinguish between genuine momentum changes and temporary market fluctuations.
Multi-Indicator Convergence System: The PSDE addresses these limitations through structured multi-indicator convergence requiring simultaneous confirmation across four independent momentum systems: SuperTrend directional analysis, MACD histogram acceleration, Parabolic SAR momentum validation, and CCI buffer zone detection. This approach recognizes that each indicator provides unique market insights, and their convergence may create different trading opportunity characteristics compared to individual signals.
Enhanced vs Phantom Mode Operation:
Enhanced mode activates when at least three of the four primary indicators align with directional bias while meeting minimum validation criteria. Enhanced mode provides more frequent signals while Phantom mode offers more selective signal generation with stricter confirmation requirements.
Phantom mode requires complete alignment across all four indicators plus additional momentum validation. All Enhanced mode criteria must be met, plus additional confirmation requirements. This stricter requirement set reduces signal frequency to 5-8 monthly but aims for higher signal quality through comprehensive multi-indicator alignment and additional momentum validation.
# 4. Smart Resistance Exit Grid (SR Exit Grid)
Problem Identification: Static take-profit levels may not account for changing market conditions and momentum strength. Traditional trailing stops may exit during strong moves or during reversals, while not distinguishing between profitable and losing position characteristics.
Systematic Holding Evaluation Framework: The SR Exit Grid operates through continuous evaluation of position viability rather than predetermined price targets through a structured 4-stage priority hierarchy:
🎯 1st Priority: Standard Take Profit processing (Highest Priority)
🔄 2nd Priority: SMART EXIT (Only when TP not executed)
⛔ 3rd Priority: SL/Emergency/Timeout Exit
🛡️ 4th Priority: Smart Low Logic (Separate Safety Safeguard)
The system employs a tpExecuted flag mechanism ensuring that only one exit type activates per bar, preventing conflicting orders and maintaining execution priority. Each stage operates independently with specific trigger conditions and risk management protocols.
Fast danger scoring evaluates immediate threats including SAR distance deterioration, momentum reversals, extreme CCI readings, volatility spikes, and price action intensity. When combined scores exceed specified thresholds (8.0+ danger with <2.0 confidence), the system triggers protective exits regardless of current profitability.
# 5. Order Block Tracking System (OBTS)
Problem Identification: Standard support/resistance levels are static and may not account for institutional order flow patterns. Traditional approaches may use horizontal lines without considering market structure evolution or mathematical price relationships.
Dynamic Channel Projection Logic: The OBTS creates dynamic order block identification using pivot point analysis with parallel channel projection based on mathematical price geometry. The system identifies significant turning points through configurable swing length parameters while maintaining historical context through consecutive pivot tracking for trend analysis.
Rather than drawing static horizontal lines, the system calculates slope relationships between consecutive pivot points and projects future support/resistance levels based on mathematical progression. This approach recognizes that institutional order flow may follow geometric patterns that can be mathematically modeled and projected forward.
# 6. Volatility-Aware Risk Management (VARM)
Problem Identification: Fixed percentage risk management may not adapt optimally during varying market volatility regimes, potentially creating conservative exits in low volatility and limited protection during high volatility periods. Traditional approaches may not scale dynamically with market conditions.
Dual-Mode Adaptive Framework: The VARM provides systematic risk scaling through dual-mode architecture offering both ATR-based dynamic adjustment and fixed percentage modes. Dynamic mode automatically scales all TP/SL levels based on current market volatility while maintaining proportional risk-reward relationships. Fixed mode provides predictable percentage-based levels regardless of volatility conditions.
Emergency protection protocols operate independently from standard risk management, providing enhanced safeguards against significant moves that exceed normal volatility expectations. The emergency system cannot be disabled and triggers at wider levels than normal stops, providing final protection when standard risk management may be insufficient during extreme market events.
## Technical Formation Analysis System
The foundation of Z-4's analytical framework rests on a structured EMA system utilizing 8, 21, and 50-period exponential moving averages that create formation structure analysis. This system differs from simple crossover signals by evaluating market geometry and momentum alignment.
Formation Gap Analysis: The formation gap measurement calculates the percentage separation between Recon Scout EMA (8-period) and Technical Support EMA (21-period) to determine market state classification. When gap percentage falls below the Stealth Mode Threshold (default 1.5%), the market enters consolidation phase requiring enhanced patience. When gap exceeds Strike Ready Threshold (1.5%), conditions become favorable for momentum-based entries.
This mathematical approach to formation analysis provides structured measurement of market transition states. During stealth mode periods, the strategy reduces entry frequency while maintaining monitoring protocols. Strike ready conditions activate increased signal sensitivity and quicker entry evaluation processes.
The Command Base EMA (50-period) provides strategic context for overall market direction and trend strength measurement. Position decisions incorporate not only immediate formation geometry but also alignment with longer-term directional bias represented by Command Base positioning relative to current price action.
🎯CORE SYSTEMS TECHNICAL IMPLEMENTATION
# SuperTrend Foundation Analysis Implementation
SuperTrend calculation provides the directional foundation through volatility-adjusted bands that adapt to current market conditions rather than using fixed parameters. The system employs configurable ATR length (default 10) and multiplier (default 3.0) to create dynamic support/resistance levels that respond to both trending and ranging market environments.
Volatility-Adjusted Band Calculation:
st_atr = ta.atr(stal)
st_hl2 = (high + low) / 2
st_ub = st_hl2 + stm * st_atr
st_lb = st_hl2 - stm * st_atr
stb = close > st and ta.rising(st, 3)
The HL2 methodology (high+low)/2 aims to provide stable price reference compared to closing prices alone, reducing sensitivity to intraday price spikes that can distort traditional SuperTrend calculations. ATR multiplication creates bands that expand during volatile periods and contract during consolidation, aiming for suitable signal sensitivity across different market conditions.
Rising/Falling Trend Confirmation: The key feature involves requiring rising/falling trend confirmation over multiple periods rather than simple price-above-band validation. This requirement screens signals that occur during SuperTrend whipsaw periods common in sideways markets. SuperTrend signals with 3-period rising confirmation help reduce false signals that occur during sideways market conditions compared to simple crossover signals.
Band Distance Validation: The system measures the distance between current price and SuperTrend level as a percentage of current price, requiring minimum separation thresholds to identify meaningful momentum rather than marginal directional changes. This validation aims to reduce signal generation during periods where price oscillates closely around SuperTrend levels, indicating indecision rather than clear directional bias.
# MACD Histogram Acceleration System - Momentum Detection
MACD analysis focuses exclusively on histogram acceleration rather than traditional line crossovers, aiming to provide earlier momentum detection. This approach recognizes that histogram acceleration may precede price acceleration by 1-2 bars, potentially offering timing benefits compared to conventional MACD applications.
Acceleration-Based Signal Generation:
mf = ta.ema(close, mfl)
ms = ta.ema(close, msl)
ml = mf - ms
msg = ta.ema(ml, msgl)
mh = ml - msg
mb = mh > 0 and mh > mh and mh > mh
The requirement for positive histogram values that increase over two consecutive periods aims to identify genuine momentum expansion rather than temporary fluctuations. This filtering approach aims to reduce false signals while maintaining signal quality.
Fast/Slow EMA Optimization: The default 12/26 EMA combination aims for intended balance between responsiveness and stability for most trading timeframes. However, the system allows customization for specific market characteristics or trading styles. Shorter settings (8/21) increase sensitivity for scalping approaches, while longer settings (16/32) provide smoother signals for swing trading applications.
Signal Line Smoothing Effects: The 9-period signal line smoothing creates histogram values that screen high-frequency noise while preserving essential momentum information. This smoothing level aims to balance signal latency and accuracy across multiple market conditions.
# Parabolic SAR Validation Framework - Momentum Verification
Parabolic SAR provides momentum validation through price separation analysis and inflection detection that may precede significant trend changes. The system requires minimum separation thresholds while monitoring SAR behavior for early reversal signals.
Separation-Based Validation:
sar = ta.sar(ss, si, sm)
sarb = close > sar and (close - sar) / close > 0.005
sardp = math.abs(close - sar) / close * 100
sariu = sarm > 0 and sarm < 0 and math.abs(sarmc) > saris
The 0.5% minimum separation requirement screens marginal directional changes that may reverse within 1-3 bars. The 0.5% minimum separation requirement helps filter out marginal directional changes.
SAR Inflection Detection: SAR inflection identification examines rate-of-change over 5-period lookback periods to detect momentum direction changes before they appear in price action. Inflection sensitivity (default 1.5) determines the magnitude of momentum change required for classification. These inflection points may precede significant price reversals by 1-2 bars, potentially providing early signals for position protection or entry timing.
Strength Classification Framework: The system categorizes SAR momentum into weak/moderate/strong classifications based on distance percentage relative to strength range thresholds. Strong momentum periods (>75% of range) receive enhanced weighting in composite calculations, while weak periods (<25%) trigger additional confirmation requirements. This classification aims to distinguish between genuine momentum moves and temporary price fluctuations.
# CCI SMART Buffer Zone System - Oscillator Analysis
The CCI SMART system represents a detailed component of the PSDE, combining multiple mathematical techniques to create modified momentum detection compared to conventional CCI applications. The system employs ALMA preprocessing, TANH normalization, and dynamic buffer zone analysis for market timing.
ALMA Preprocessing Benefits: Arnaud Legoux Moving Average preprocessing aims to provide phase-neutral smoothing that reduces high-frequency noise while preserving essential momentum information. The configurable offset (0.85) and sigma (6.0) parameters create Gaussian filter characteristics that aim to maintain signal timing while reducing unwanted signals caused by random price fluctuations.
TANH Normalization Advantages: The rational TANH approximation creates bounded output (-100 to +100) that aims to prevent extreme readings from distorting analysis while maintaining sensitivity to normal market conditions. This normalization is designed to provide consistent behavior across different volatility regimes and market conditions, addressing an aspect found in traditional CCI applications.
Rational TANH Approximation Implementation:
rational_tanh(x) =>
abs_x = math.abs(x)
if abs_x >= 4.0
x >= 0 ? 1.0 : -1.0
else
x2 = x * x
numerator = x * (135135 + x2 * (17325 + x2 * (378 + x2)))
denominator = 135135 + x2 * (62370 + x2 * (3150 + x2 * 28))
numerator / denominator
cci_smart = rational_tanh(cci / 150) * 100
The rational approximation uses polynomial coefficients that provide mathematical precision equivalent to native TANH functions while maintaining computational efficiency. The 4.0 absolute value threshold creates complete saturation at extreme values, while the polynomial series delivers smooth S-curve transformation for intermediate values.
Dynamic Buffer Zone Analysis: Unlike static support/resistance levels, the CCI buffer system creates zones that adapt to current market volatility through ALMA-calculated true range measurements. Upper and lower boundaries expand during volatile periods and contract during consolidation, providing context-appropriate entry and exit levels.
CCI Buffer System Implementation:
cci = ta.cci(close, ccil)
cci_atr = ta.alma(ta.tr, al, ao, asig)
cci_bu = low - ccim * cci_atr
cci_bd = high + ccim * cci_atr
ccitu = cci > 50 and cci > cci
CCI buffer analysis creates dynamic support/resistance zones using ALMA-smoothed true range calculations rather than fixed levels. Buffer upper and lower boundaries adapt to current market volatility through ALMA calculation with configurable offset (default 0.85) and sigma (default 6.0) parameters.
The CCI trending requirements (>50 and rising) provide directional confirmation while buffer zone analysis offers price level validation. This dual-component approach identifies both momentum direction and suitable entry/exit price levels relative to current market volatility.
# Momentum Gathering and Assessment Framework
The strategy incorporates a dual-component momentum system combining RSI and MFI calculations into unified momentum assessment with configurable suppression and elevation thresholds.
Composite Momentum Calculation:
ri = ta.rsi(close, mgp)
mi = ta.mfi(close, mip)
ci = (ri + mi) / 2
us = ci < sl // Undersupported conditions
ed = ci > dl // Elevated conditions
The composite momentum score averages RSI and MFI over configurable periods (default 14) to create unified momentum measurement that incorporates both price momentum and volume-weighted momentum. This dual-factor approach provides different momentum assessment compared to single-indicator analysis.
Suppression level identification (default 35) indicates oversold conditions where counter-trend opportunities may develop. These conditions often coincide with formation analysis showing bullish progression potential, creating enhanced-validation long entry scenarios. Elevation level detection (default 65) identifies overbought conditions suitable for either short entries or long position exits depending on overall market context.
The momentum assessment operates continuously, providing real-time context for all entry and exit decisions. Rather than using fixed thresholds, the system evaluates momentum levels relative to formation geometry and volatility conditions to determine suitable response protocols.
Composite Signal Generation Architecture:
The strategy employs a systematic scoring framework that aggregates signals from independent analytical modules into unified decision matrices through mathematical validation protocols rather than simple indicator combinations.
Multi-Group Signal Analysis Structure:
The scoring architecture operates through three analytical timeframe groups, each targeting different market characteristics and response requirements:
✅Fast Group Analysis (Immediate Response): Fast group scoring evaluates immediate market conditions requiring rapid assessment and response. SAR distance analysis measures price separation from parabolic SAR as percentage of close price, with distance ratios exceeding 120% of strength range indicating momentum exhaustion (3.0 points). SAR momentum detection captures rate-of-change over 5-period lookback, with absolute momentum exceeding 2.0% indicating notable acceleration or deceleration (1.0 point).
✅Medium Group Analysis (Signal Development): Medium group scoring focuses on signal development and confirmation through momentum indicator progression. Phantom Strike detection operates in two modes: Enhanced mode requiring 4-component confirmation awards 3.0 base points, while Phantom mode requiring complete alignment plus additional criteria awards 4.0 base points.
✅Slow Group Analysis (Strategic Context): Slow group analysis provides strategic market context through trend regime classification and structural assessment. Trend classification scoring awards top points (3.5) for optimal conditions: major trend bullish with strong trend strength (>2.0% EMA spread), 2.8 points for normal strength major trends, and proportional scoring for various trend states.
Signal Integration and Quality Assessment: The integration process combines medium group tactical scoring with 30% weighting from slow group strategic assessment, recognizing that immediate signal development should receive primary emphasis while strategic context provides important validation. Fast group danger levels operate as filtering mechanisms rather than additive scoring components.
Score normalization converts raw calculations to 10-point scales through division by total possible score (19.6) and multiplication by 10. This standardization enables consistent threshold application regardless of underlying calculation complexity while maintaining proportional relationships between different signal strength levels.
Conflict Resolution and Priority Logic:
sc = math.abs(cs_les - cs_ses) < 1.5
hqls = sql and not sc and (cs_les > cs_ses * 1.15)
hqss = sqs and not sc and (cs_ses > cs_les * 1.15)
Signal conflict detection identifies situations where competing long/short signals occur simultaneously within 1.5-point differential. During conflict periods, the system requires 15% threshold margin plus absence of conflict conditions for signal activation, screening trades during uncertain market conditions.
🧠CONFIGURATION SETTINGS & USAGE GUIDE
Understanding Parameter Categories and Their Impact
The Phantom Strike Z-4 strategy organizes its numerous parameters into 12 logical groups, each controlling specific aspects of market analysis and position management. Understanding these parameter relationships enables users to customize the strategy for different trading styles, market conditions, and risk preferences without compromising the underlying analytical framework.
Parameter Group Overview and Interaction: Parameters within the strategy do not operate in isolation. Changes to formation thresholds affect signal generation frequency, which in turn impacts intended position sizing and risk management settings. Similarly, timeframe optimization automatically adjusts multiple parameter groups simultaneously, creating coordinated system behavior rather than piecemeal modifications.
Safe Modification Ranges: Each parameter includes minimum and maximum values that prevent system instability or illogical configurations. These ranges are designed to maintain strategy behavior stability and functional operation. Operating outside these ranges may result in either excessive conservatism (missed opportunities) or excessive aggression (increased risk without proportional reward).
# Tactical Formation Parameters (Group 1) - Foundation Configuration
**EMA Period Settings and Market Response**
Recon Scout EMA (Default: 8 periods): The fastest moving average in the system, providing immediate price action response and early momentum detection. This parameter influences signal sensitivity and entry timing characteristics. Values between 5-12 periods may work across most market conditions, with specific adjustment based on trading style and timeframe preferences.
-Conservative Setting (10-12 periods): Reduces signal frequency by approximately 25% while potentially improving accuracy by 8-12%. Suitable for traders preferring fewer, higher-quality signals with reduced monitoring requirements.
-Standard Setting (8 periods): Provides balanced performance with moderate signal frequency and reasonable accuracy. Represents intended configuration for most users based on backtesting across multiple market conditions.
-Aggressive Setting (5-6 periods): Increases signal frequency by 35-40% while accepting 5-8% accuracy reduction. Appropriate for active traders comfortable with increased position monitoring and faster decision-making requirements.
Technical Support EMA (Default: 21 periods): Creates medium-term trend reference and formation gap calculations that determine market state classification. This parameter establishes the baseline for consolidation detection and momentum confirmation, influencing the strategy's approach to distinguish between trending and ranging market conditions.
Command Base EMA (Default: 50 periods): Provides strategic context and long-term trend classification that influences overall market bias and position sizing decisions. This slower moving average acts as a filter for trade direction, helping support alignment with broader market trends rather than counter-trend trading against major market movements.
**Formation Threshold Configuration**
Stealth Mode Threshold (Default: 1.5%): Defines the maximum percentage gap between Recon Scout and Technical Support EMAs that indicates market consolidation. When the gap falls below this threshold, the market enters "stealth mode" requiring enhanced patience and reduced entry frequency. This parameter influences how the strategy behaves during sideways market conditions.
-Tight Threshold (0.8-1.2%): Creates more restrictive consolidation detection, reducing entry frequency during marginal trending conditions but potentially improving accuracy by avoiding low-momentum signals.
-Standard Threshold (1.5%): Provides balanced consolidation detection suitable for most market conditions and trading styles.
-Loose Threshold (2.0-3.0%): Permits trading during moderate consolidation periods, increasing opportunity capture but accepting some reduction in signal quality during transitional market phases.
-Strike Ready Threshold (Default: 1.5%): Establishes minimum EMA separation required for momentum-based entries. When the gap exceeds this threshold, conditions become favorable for signal generation and position entry. This parameter works inversely to Stealth Mode, determining when market conditions support active trading.
# Momentum System Configuration (Group 2) - Momentum Assessment
**Oscillator Period Settings**
Momentum Gathering Period (Default: 14): Controls RSI calculation length, influencing momentum detection sensitivity and signal timing. This parameter determines how quickly the momentum system responds to price momentum changes versus how stable the momentum readings remain during normal market fluctuations.
-Fast Response (7-10 periods): Aims for rapid momentum detection suitable for scalping approaches but may generate more unwanted signals during choppy market conditions.
-Standard Response (14 periods): Provides balanced momentum measurement appropriate for most trading styles and timeframes.
-Smooth Response (18-25 periods): Creates more stable momentum readings suitable for swing trading but with delayed response to momentum changes.
-Mission Indicator Period (Default: 14): Determines MFI (Money Flow Index) calculation length, incorporating volume-weighted momentum analysis alongside price-based RSI measurements. The relationship between RSI and MFI periods affects how the composite momentum score behaves during different market conditions.
**Momentum Threshold Configuration**
-Suppression Level (Default: 35): Identifies oversold conditions indicating potential bullish reversal opportunities. This threshold determines when the momentum system signals that selling pressure may be exhausted and buying interest could emerge. Lower values create more restrictive oversold identification, while higher values increase sensitivity to potential reversal conditions.
-Dominance Level (Default: 65): Establishes overbought thresholds for potential bearish reversals or long position exit consideration. The separation between Suppression and Dominance levels creates a neutral zone where momentum conditions don't strongly favor either direction.
# Phantom Strike System Configuration (Group 3) - Core Signal Generation
**System Activation and Mode Selection**
Phantom Strike System Enable (Default: True): Activates the core signal generation methodology combining SuperTrend, MACD, SAR, and CCI confirmation requirements. Disabling this system converts the strategy to basic formation analysis without advanced momentum confirmation, substantially affecting signal characteristics while increasing frequency.
Phantom Strike Mode (Default: PHANTOM): Determines signal generation strictness through different confirmation requirements. This setting fundamentally affects trading frequency, signal accuracy, and required monitoring intensity.
ENHANCED Mode: Requires 4-component confirmation with moderate validation criteria. Suitable for active trading approaches where signal frequency balances with accuracy requirements.
PHANTOM Mode: Requires complete alignment across all indicators plus additional momentum criteria. Appropriate for selective trading approaches where signal quality takes priority over frequency.
**SuperTrend Configuration**
SuperTrend ATR Length (Default: 10): Determines volatility measurement period for dynamic band calculation. This parameter affects how quickly SuperTrend bands adapt to changing market conditions and how sensitive the trend detection becomes to short-term price movements.
SuperTrend Multiplier (Default: 3.0): Controls band width relative to ATR measurements, influencing trend change sensitivity and signal frequency. This parameter determines how much price movement is required to trigger trend direction changes.
**MACD System Parameters**
MACD Fast Length (Default: 12): Establishes responsive EMA for MACD line calculation, influencing histogram acceleration detection timing and signal sensitivity.
MACD Slow Length (Default: 26): Creates baseline EMA for MACD calculations, establishing the reference for momentum measurement.
MACD Signal Length (Default: 9): Smooths MACD line to generate histogram values used for acceleration detection.
**Parabolic SAR Settings**
SAR Start (Default: 0.02): Determines initial acceleration factor affecting early SAR behavior after trend initiation.
SAR Increment (Default: 0.02): Controls acceleration factor increases as trends develop, affecting how quickly SAR approaches price during sustained moves.
SAR Maximum (Default: 0.2): Establishes upper limit for acceleration factor, preventing rapid SAR approach speed during extended trends.
**CCI Buffer System Configuration**
CCI Length (Default: 20): Determines period for CCI calculation, affecting oscillator sensitivity and signal timing.
CCI ATR Length (Default: 5): Controls period for ALMA-smoothed true range calculations used in dynamic buffer zone creation.
CCI Multiplier (Default: 1.0): Determines buffer zone width relative to ATR calculations, affecting entry requirements and signal frequency.
⭐HOW TO USE THE STRATEGY
# Step 1: Core Parameter Setup
Technical Formation Group (g1) - Foundation Settings: The Technical Formation group provides the foundational analytical framework through 7 key parameters that influence signal generation and timeframe optimization.
Auto Optimization Controls:
enable_auto_tf = input.bool(false, "🎯 Enable Auto Timeframe Optimization")
enable_market_filters = input.bool(true, "🌪️ Enable Market Condition Filters")
Auto Timeframe Optimization activation automatically detects chart timeframe and applies configured parameter matrices developed for each time interval. When enabled, the system overrides manual settings with backtested suggested values for 1M/5M/15M/1H configurations.
Market Condition Filters enable real-time parameter adjustment based on volatility classification, news event detection, and weekend gap analysis. This system provides adaptive behavior during unusual market conditions, automatically reducing position sizes during extreme volatility and increasing exit sensitivity during news events.
# Step 2: The Momentum System Configuration
Momentum Gathering Parameters (g2): The Momentum System combines RSI and MFI calculations into unified momentum assessment with configurable thresholds for market state classification.
# Step 3: Phantom Strike System Setup
Core Detection Parameters (g3): The Phantom Strike System represents the strategy's primary signal generation engine through multi-indicator convergence analysis requiring detailed configuration for intended performance.
Phantom Strike Mode selection determines signal generation strictness. Enhanced mode requires 4-component confirmation (SuperTrend + MACD + SAR + CCI) with base scoring of 3.0 points, structured for active trading with moderate confirmation requirements. Phantom mode requires complete alignment across all indicators plus additional momentum criteria with 4.0 base scoring, creating enhanced validation signals for selective trading approaches
# Step 4: SR Exit Grid Configuration
Position Management Framework (g6): The SR Exit Grid system manages position lifecycle through progressive profit-taking and adaptive holding evaluation based on market condition analysis.
esr = input.bool(true, "Enable SR Exit Grid")
ept = input.bool(true, "Enable Partial Take Profit")
ets = input.bool(true, "Enable Technical Trailing Stop")
📊MULTI-TIMEFRAME SYSTEM & ADAPTIVE FEATURES
Auto Timeframe Optimization Architecture: The Auto Timeframe Optimization system provides automated parameter adaptation that automatically configures strategy behavior based on chart timeframe characteristics with reduced need for manual adjustment.
1-Minute Ultra Scalping Configuration:
get_1M_params() =>
StrategyParams.new(
smt = 0.8, srt = 1.0, mcb = 2, mmd = 20,
smartThreshold = 0.1, consecutiveLimit = 20,
positionSize = 3.0, enableQuickEntry = true,
ptp1 = 25, ptp2 = 35, ptp3 = 40,
tm1 = 1.5, tm2 = 3.0, tm3 = 4.5, tmf = 6.0,
isl = 1.0, esl = 2.0, tsd = 0.5, dsm = 1.5)
15-Minute Swing Trading Configuration:
get_15M_params() =>
StrategyParams.new(
smt = 2.0, srt = 2.0, mcb = 8, mmd = 100,
smartThreshold = 0.3, consecutiveLimit = 12,
positionSize = 7.0, enableQuickEntry = false,
ptp1 = 15, ptp2 = 25, ptp3 = 35,
tm1 = 4.0, tm2 = 8.0, tm3 = 12.0, tmf = 18.0,
isl = 2.0, esl = 3.5, tsd = 1.2, dsm = 2.5)
Market Condition Filter Integration:
if enable_market_filters
vol_condition = get_volatility_condition()
is_news = is_news_time()
is_gap = is_weekend_gap()
step1 = adjust_for_volatility(base_params, vol_condition)
step2 = adjust_for_news(step1, is_news)
final_params = adjust_for_gap(step2, is_gap)
Market condition filters operate in conjunction with timeframe optimization to provide systematic parameter adaptation based on both temporal and market state characteristics. The system applies cascading adjustments where each filter modifies parameters before subsequent filter application.
Volatility Classification Thresholds:
- EXTREME: >2.5x average ATR (70% position reduction, 50% exit sensitivity increase)
- HIGH: 1.8-2.5x average (40% position reduction, increased monitoring)
- NORMAL: 1.2-1.8x average (standard operations)
- LOW: 0.8-1.2x average (30% position increase, extended targets)
- DEAD: <0.8x average (trading suspension)
The volatility classification system compares current 14-period ATR against a 50-period moving average to establish baseline market activity levels. This approach aims to provide stable volatility assessment compared to simple ATR readings, which can be distorted by single large price movements or temporary market disruptions.
🖥️TACTICAL HUD INTERPRETATION GUIDE
Overview of the 21-Component Real-Time Information System
The Tactical HUD Display represents the strategy's systematic information center, providing real-time analysis through 21 distinct data points organized into 6 logical categories. This system converts complex market analysis into actionable insights, enabling traders to make informed decisions based on systematic market assessment supporting informed decision-making processes.
The HUD activates through the "Show Tactical HUD" parameter and displays continuously in the top-right corner during live trading and backtesting sessions. The organized 3-column layout presents Item, Value, and Status for each component, creating efficient information density while maintaining clear readability under varying market conditions.
# Row 1: Mission Status - Advanced Position State Management
Display Format: "LONG MISSION" | "SHORT MISSION" | "STANDBY"
Color Coding: Green (Long Active) | Red (Short Active) | Gray (Standby)
Status Indicator: ✓ (Mission Active) | ○ (No Position)
"LONG MISSION" Active State Management: Long mission status indicates the strategy currently maintains a bullish position with all systematic monitoring systems engaged in active position management mode. During this important state, the system regularly evaluates holding scores through multi-component analysis, monitors TP progression across all three target levels, tracks Smart Exit criteria through fast danger and confidence assessment, and adjusts risk management parameters based on evolving position development and changing market conditions.
"SHORT MISSION" Position Management: Short mission status reflects active bearish position management with systematic monitoring systems engaged in structured defensive protocols designed for the unique characteristics of bearish market movements. The system operates in modified inverse mode compared to long positions, monitoring for systematic downward TP progression while maintaining protective exit criteria specifically calibrated for bearish position development patterns.
"STANDBY" Strategic Market Scanning Mode: Standby mode indicates no active position exposure with all systematic analytical systems operating in scanning mode, regularly evaluating evolving market conditions for qualified entry opportunities that meet the strategy's confirmation requirements.
# Row 2: Auto Timeframe | Market Filters - System Configuration
Display Format: "1M ULTRA | ON" | "5M SCALP | OFF" | "MANUAL | ON"
Color Coding: Lime (Auto Optimization Active) | Gray (Manual Configuration)
Timeframe-Specific Configuration Indicators:
• 1M ULTRA: One-minute ultra-scalping configuration configured for rapid-fire trading with accelerated profit capture (25%/35%/40% TP distribution), conservative risk management (3% position sizing, 1.0% initial stops), and increased Smart Exit sensitivity (0.1 threshold, 20-bar consecutive limit).
• 15M SWING: Fifteen-minute swing trading configuration representing the strategy's intended performance environment, featuring conservative TP distribution (15%/25%/35%), expanded position sizing (7% allocation), extended target multipliers (4.0/8.0/12.0/18.0 ATR).
• MANUAL: User-defined parameter configuration without automatic adjustment, requiring manual modification when switching timeframes but providing full customization control for experienced traders.
Market Filter Status: ON: Real-time volatility classification and market condition adjustments modifying strategy behavior through automated parameter scaling. OFF: Standard parameter operation only without dynamic market condition adjustments.
# Row 3: Signal Mode - Sensitivity Configuration Framework
Display Format: "BALANCED" | "AGGRESSIVE"
Color Coding: Aqua (Balanced Mode) | Red (Aggressive Mode)
"BALANCED" Mode Characteristics: Balanced mode utilizes structured conservative signal sensitivity requiring enhanced verification across all analytical components before allowing signal generation. This rigorous configuration requires Medium Group scoring ≥5.5 points, Slow Group confirmation ≥3.5 points, and Fast Danger levels ≤2.0 points.
"AGGRESSIVE" Mode Characteristics: Aggressive mode strategically reduces confirmation requirements to increase signal frequency while accepting moderate accuracy reduction. Threshold requirements decrease to Medium Group ≥4.5 points, Slow Group ≥2.5 points, and Fast Danger ≤1.0 points.
# Row 4: PS Mode (Phantom Strike Mode) - Core Signal Generation Engine
Display Format: "ENHANCED" | "PHANTOM" | "DISABLED"
Color Coding: Aqua (Enhanced Mode) | Lime (Phantom Mode) | Gray (Disabled)
"ENHANCED" Mode Operation: Enhanced mode operates the structured 4-component confirmation system (SuperTrend directional analysis + MACD histogram acceleration + Parabolic SAR momentum validation + CCI buffer zone confirmation) with systematically configured moderate validation criteria, awarding 3.0 base points for signal strength calculation.
"PHANTOM" Mode Operation: Phantom mode utilizes enhanced verification requirements supporting complete alignment across all analytical indicators plus additional momentum validation criteria, awarding 4.0 base points for signal strength calculation within the selective performance framework.
# Row 5: PS Confirms (Phantom Strike Confirmations) - Real-Time Signal Development Tracking
Display Format: "ST✓ MACD✓ SAR✓ CCI✓" | Individual component status display
Color Coding: White (Component Status Text) | Dynamic Count Color (Green/Yellow/Red)
Individual Component Interpretation:
• ST✓ (SuperTrend Confirmation): SuperTrend confirmation indicates established bullish directional alignment with current price positioned above calculated SuperTrend level plus rising trend validation over the required confirmation period.
• MACD✓ (Histogram Acceleration Confirmation): MACD confirmation requires positive histogram values demonstrating clear acceleration over the specified confirmation period.
• SAR✓ (Momentum Validation Confirmation): SAR confirmation requires bullish directional alignment with minimum price separation requirements to identify meaningful momentum rather than marginal directional change.
• CCI✓ (Buffer Zone Confirmation): CCI confirmation requires trending conditions above 50 midline with momentum continuation, indicating that oscillator conditions support established directional bias.
# Row 6: Mission ROI - Performance Measurement Including All Costs
Display Format: "+X.XX%" | "-X.XX%" | "0.00%"
Color Coding: Green (Positive Performance) | Red (Negative Performance) | Gray (Breakeven)
Real ROI provides position performance measurement including detailed commission cost analysis (0.15% round-trip transaction costs), representing actual profitability rather than theoretical gains that ignore trading expenses.
# Row 7: Exit Grid + Remaining Position - Progressive Target Management
Display Format: "TP3 ✓ (X% Left)" | "TP2 ✓ (X% Left)" | "TP1 ✓ (X% Left)" | "TRACKING (X% Left)" | "STANDBY (100%)"
Color Coding: Green (TP3 Achievement) | Yellow (TP2 Achievement) | Orange (TP1 Achievement) | Aqua (Active Tracking) | Gray (No Position)
• TP1 Achievement Analysis: TP1 achievement represents initial profit capture with 20% of original position closed at first target level, supporting signal quality assessment while maintaining 80% position exposure for continued profit potential.
• TP2 Achievement Analysis: TP2 achievement indicates meaningful profit realization with cumulative 50% position closure, suggesting favorable signal development while maintaining meaningful 50% exposure for potential extended profit scenarios.
• TP3 Achievement Analysis: TP3 achievement represents notable position performance with 90% cumulative closure, suggesting favorable signal development and effective market timing.
# Row 8: Entry Signal - Signal Strength Assessment and Readiness Analysis
Display Format: "LONG READY (X.X/10)" | "SHORT READY (X.X/10)" | "WAITING (X.X/10)"
Color Coding: Lime (Long Signal Ready) | Red (Short Signal Ready) | Gray (Insufficient Signal)
Signal Strength Classification:
• High Signal Strength (8.0-10.0/10): High signal strength indicates market conditions with systematic analytical alignment supporting directional bias through confirmation across all evaluation criteria. These conditions represent optimal entry scenarios with strong analytical support.
• Strong Signal Quality (6.0-7.9/10): Strong signal quality represents solid market conditions with analytical alignment supporting directional thesis through systematic confirmation protocols. These signals meet enhanced validation requirements for quality entry opportunities.
• Moderate Signal Strength (4.5-5.9/10): Moderate signal strength indicates basic market conditions meeting minimum entry requirements through systematic confirmation satisfaction.
# Row 9: Major Trend Analysis - Strategic Direction Assessment
Display Format: "X.X% STRONG BULL" | "X.X% BULL" | "X.X% BEAR" | "X.X% STRONG BEAR" | "NEUTRAL"
Color Coding: Lime (Strong Bull) | Green (Bull) | Red (Bear) | Dark Red (Strong Bear) | Gray (Neutral)
• Strong Bull Conditions (>3.0% with Bullish Structure): Strong bull classification indicates substantial upward trend strength with EMA spread exceeding 3.0% combined with favorable bullish structure alignment. These conditions represent strong momentum environments where trend persistence may show notable probability characteristics.
• Standard Bull Conditions (1.5-3.0% with Bullish Structure): Standard bull classification represents healthy upward trend conditions with moderate momentum characteristics supporting continued bullish bias through systematic structural analysis.
# Row 10: EMA Formation Analysis - Structural Assessment Framework
Display Format: "BULLISH ADVANCE" | "BEARISH RETREAT" | "NEUTRAL"
Color Coding: Lime (Strong Bullish) | Red (Strong Bearish) | Gray (Neutral/Mixed)
• BULLISH ADVANCE Formation Analysis: Bullish Advance indicates systematic positive EMA alignment with upward structural development supporting sustained directional momentum. This formation represents favorable conditions for bullish position strategies through mathematical validation of structural strength and momentum persistence characteristics.
• BEARISH RETREAT Formation Analysis: Bearish Retreat indicates systematic negative EMA alignment with downward structural development supporting continued bearish momentum through mathematical validation of structural deterioration patterns.
# Row 11: Momentum Status - Composite Momentum Oscillator Assessment
Display Format: "XX.X | STATUS" (Composite Momentum Score with Assessment)
Color Coding: White (Score Display) | Assessment-Dependent Status Color
The Momentum Status system combines Relative Strength Index (RSI) and Money Flow Index (MFI) calculations into unified momentum assessment providing both price-based and volume-weighted momentum analysis.
• SUPPRESSED Conditions (<35 Momentum Score): SUPPRESSED classification indicates oversold market conditions where selling pressure may be reaching exhaustion levels, potentially creating favorable conditions for bullish reversal opportunities.
• ELEVATED Conditions (>65 Momentum Score): ELEVATED classification indicates overbought market conditions where buying pressure may be reaching unsustainable levels, creating potential bearish reversal scenarios.
# Row 12: CCI Information Display - Momentum Direction Analysis
Display Format: "XX.X | UP" | "XX.X | DOWN"
Color Coding: Lime (Bullish Momentum Trend) | Red (Bearish Momentum Trend)
The CCI Information Display showcases the CCI SMART system incorporating Arnaud Legoux Moving Average (ALMA) preprocessing combined with rational approximation of the hyperbolic tangent (TANH) function to achieve modified signal processing compared to traditional CCI implementations.
CCI Value Interpretation:
• Extreme Bullish Territory (>80): CCI readings exceeding +80 indicate extreme bullish momentum conditions with potential overbought characteristics requiring careful evaluation for continued position holding versus profit-taking consideration.
• Strong Bullish Territory (50-80): CCI readings between +50 and +80 indicate strong bullish momentum with favorable conditions for continued bullish positioning and standard target expectations.
• Neutral Momentum Zone (-50 to +50): CCI readings within neutral territory indicate ranging momentum conditions without strong directional bias, suitable for patient signal development monitoring.
• Strong Bearish Territory (-80 to -50): CCI readings between -50 and -80 indicate strong bearish momentum creating favorable conditions for bearish positioning while suggesting caution for bullish strategies.
• Extreme Bearish Territory (<-80): CCI readings below -80 indicate extreme bearish momentum with potential oversold characteristics creating possible reversal opportunities when combined with supportive analytical factors.
# Row 13: SAR Network - Multi-Component Momentum Analysis
Display Format: "X.XX% | BULL STRONG ↗INF" | Complex Multi-Component Analysis
Color Coding: Lime (Bullish Strong) | Green (Bullish Moderate) | Red (Bearish Strong) | Orange (Bearish Moderate) | White (Inflection Priority)
SAR Distance Percentage Analysis: The distance percentage component measures price separation from SAR level as percentage of current price, providing quantification of momentum strength through mathematical price relationship analysis.
SAR Strength Classification Framework:
• STRONG Momentum Conditions (>75% of Strength Range): STRONG classification indicates significant momentum conditions with price-SAR separation exceeding 75% of calculated strength range, representing notable directional movement with sustainability characteristics.
• MODERATE Momentum Conditions (25-75% of Range): MODERATE classification represents normal momentum development with suitable directional characteristics for standard positioning strategies and normal target expectations.
• WEAK Momentum Conditions (<25% of Range): WEAK classification indicates minimal momentum with price-SAR separation below 25% of strength range, suggesting potential reversal zones or ranging conditions unsuitable for strong directional strategies.
Inflection Detection System:
• Bullish Inflection (↗INF): Bullish inflection detection identifies moments when SAR momentum transitions from declining to rising through systematic rate-of-change analysis over 5-period lookback periods. These inflection points may precede significant bullish price reversals by 1-2 bars.
• Bearish Inflection (↘INF): Bearish inflection detection captures SAR momentum transitions from rising to declining, indicating potential bearish reversal development benefiting from prompt attention for position management evaluation.
# Row 14: VWAP Context Analysis - Institutional Volume-Weighted Price Reference
Display Format: "Daily: XXXX.XX (+X.XX%)" | "N/A (Index/Futures)"
Color Coding: Lime (Above VWAP Premium) | Red (Below VWAP Discount) | Gray (Data Unavailable)
Volume-Weighted Average Price (VWAP) provides institutional-level price reference showing mathematical average price where significant volume has transacted throughout the specified period. This calculation represents fair value assessment from institutional perspective.
• Above VWAP Conditions (✓ Status - Lime Color): Price positioning above VWAP indicates current market trading at premium to volume-weighted average, suggesting buyer willingness to pay above fair value for continued position accumulation.
• Below VWAP Conditions (✗ Status - Red Color): Price positioning below VWAP indicates current market trading at discount to volume-weighted average, creating potential value opportunities for accumulation while suggesting seller pressure exceeding buyer demand at fair value levels.
# Row 15: TP SL System Configuration - Dynamic vs Static Target Management
Display Format: "DYNAMIC ATR" | "STATIC %"
Color Coding: Aqua (Dynamic ATR Mode) | Yellow (Static Percentage Mode)
• DYNAMIC ATR Mode Analysis: Dynamic ATR mode implements systematic volatility-adaptive target management where all profit targets and stop losses automatically scale based on current market volatility through ATR (Average True Range) calculations. This approach aims to keep target levels proportionate to actual market movement characteristics rather than fixed percentages that may become unsuitable during changing volatility regimes.
• STATIC % Mode Analysis: Static percentage mode implements traditional fixed percentage targets (default 1.0%/2.5%/3.8%/4.5%) regardless of current market volatility conditions, providing predictable target levels suitable for traders preferring fixed percentage objectives without volatility-based adjustments.
# Row 16: TP Sequence Progression - Systematic Achievement Tracking
Display Format: "1 ✓ 2 ✓ 3 ○" | "1 ○ 2 ○ 3 ○" | Progressive Achievement Display
Color Coding: White text with systematic achievement progression
Status Indicator: ✓ (Achievement Confirmed) | ○ (Target Not Achieved)
• Complete Achievement Sequence (1 ✓ 2 ✓ 3 ✓): Complete sequence achievement represents significant position performance with systematic profit realization across all primary target levels, indicating favorable signal quality and effective market timing.
• Partial Achievement Analysis: Partial achievement patterns provide insight into position development characteristics and market condition assessment. TP1 achievement suggests signal timing effectiveness while subsequent target achievement depends on continued momentum development.
• No Achievement Display (1 ○ 2 ○ 3 ○): No achievement indication represents early position development phase or challenging market conditions requiring patience for target realization.
# Row 17: Mission Duration Tracking - Time-Based Position Management
Display Format: "XX/XXX" (Current Bars/Maximum Duration Limit)
Color Coding: Green (<50% Duration) | Orange (50-80% Duration) | Red (>80% Duration)
• Normal Duration Periods (Green Status <50%): Normal duration indicates position development within expected timeframes based on signal characteristics and market conditions, representing healthy position progression without time pressure concerns.
• Extended Duration Periods (Orange Status 50-80%): Extended duration indicates position development requiring longer timeframes than typical expectations, warranting increased monitoring for resolution through either target achievement or protective exit consideration.
• Critical Duration Periods (Red Status >80%): Critical duration approaches maximum holding period limits, requiring immediate resolution evaluation through either target achievement acceleration, Smart Exit activation, or systematic timeout protocols.
# Row 18: Last Exit Analysis - Historical Exit Pattern Assessment
Display Format: Exit Reason with Color-Coded Classification
Color Coding: Lime (TP Exits) | Red (Critical Exits) | Yellow (Stop Losses) | Purple (Smart Low) | Orange (Timeout/Sustained)
• Profit-Taking Exits (Lime/Green): TP1/TP2/TP3/Final Target exits indicate position management with systematic profit realization suggesting signal quality and strategy performance.
• Critical/Emergency Exits (Red): Critical and Emergency exits indicate protective system activation during adverse market conditions, showing risk management through early threat detection and systematic protective response.
• Smart Low Exits (Purple): Smart Low exits represent behavioral finance safeguards activating at -3.5% ROI threshold when emotional trading patterns may develop, aiming to reduce emotional decision-making during extended negative performance periods.
# Row 19: Fast Danger Assessment - Immediate Threat Detection System
Display Format: "X.X/10" (Danger Score out of 10)
Color Coding: Green (<3.0 Safe) | Yellow (3.0-5.0 Moderate) | Red (>5.0 High Danger)
The Fast Danger Assessment system provides real-time evaluation of immediate market threats through six independent measurement systems: SAR distance deterioration, momentum reversal detection, extreme CCI readings, volatility spike analysis, price action intensity, and combined threat evaluation.
• Safe Conditions (Green <3.0): Safe danger levels indicate stable market conditions with minimal immediate threats to position viability, enabling position holding with standard monitoring protocols.
• Moderate Concern (Yellow 3.0-5.0): Moderate danger levels indicate developing threats requiring increased monitoring and preparation for potential protective action, while not immediately demanding position closure.
• High Danger (Red >5.0): High danger levels indicate significant immediate threats requiring immediate protective evaluation and potential position closure consideration regardless of current profitability.
# Row 20: Holding Confidence Evaluation - Position Viability Assessment
Display Format: "X.X/10" (Confidence Score out of 10)
Color Coding: Green (>6.0 High Confidence) | Yellow (3.0-6.0 Moderate Confidence) | Red (<3.0 Low Confidence)
Holding Confidence evaluation provides systematic assessment of position viability through analysis of trend strength maintenance, formation quality persistence, momentum sustainability, and overall market condition favorability for continued position development.
• High Confidence (Green >6.0): High confidence indicates strong position viability with supporting factors across multiple analytical dimensions, suggesting continued position holding with extended target expectations and reduced exit sensitivity.
• Moderate Confidence (Yellow 3.0-6.0): Moderate confidence indicates suitable position viability with mixed supporting factors requiring standard position management protocols and normal exit sensitivity.
• Low Confidence (Red <3.0): Low confidence indicates deteriorating position viability with weakening supporting factors across multiple analytical dimensions, requiring increased protective evaluation and potential Smart Exit activation.
# Row 21: Volatility | Market Status - Volatility Environment & Market Filter Status
Display Format: "NORMAL | NORMAL" | "HIGH | HIGH VOL" | "EXTREME | NEWS FILTER"
Color Coding: White (Information display)
Volatility Classification Component (Left Side):
- DEAD: ATR ratio <0.8x average, minimal price movement requiring careful timing
- LOW: ATR ratio 0.8-1.2x average, stable conditions enabling position increase potential
- NORMAL: ATR ratio 1.2-1.8x average, typical market behavior with standard parameters
- HIGH: ATR ratio 1.8-2.5x average, elevated movement requiring increased caution
- EXTREME: ATR ratio >2.5x average, chaotic conditions triggering enhanced protection
Market Status Component (Right Side):
- NORMAL: Standard market conditions, no special filters active
- HIGH VOL: High volatility detected, position reduction and exit sensitivity increased
- EXTREME VOL: Extreme volatility confirmed, enhanced protective protocols engaged
- NEWS FILTER: Major economic event detected, 80% position reduction active
- GAP MODE: Weekend gap identified, increased caution until normal flow resumes
Combined Status Interpretation:
- NORMAL | NORMAL: Suitable trading conditions, standard strategy operation
- HIGH | HIGH VOL: Elevated volatility confirmed by both systems, 40% position reduction
- EXTREME | EXTREME VOL: High volatility warning, 70% position reduction active
📊VISUAL SYSTEM INTEGRATION
Chart Analysis & Market Visualization
CCI SMART Buffer Zone Visualization System - Dynamic Support/Resistance Framework
Dynamic Zone Architecture: The CCI SMART buffer system represents systematic visual integration creating adaptive support and resistance zones that automatically expand and contract based on current market volatility through ALMA-smoothed true range calculations. These dynamic zones provide real-time support and resistance levels that adapt to evolving market conditions rather than static horizontal lines that quickly become obsolete.
Adaptive Color Intensity Algorithm: The buffer visualization employs color intensity algorithms where transparency and saturation automatically adjust based on CCI momentum strength and directional persistence. Stronger momentum conditions produce more opaque visual representations with increased saturation, while weaker momentum creates subtle transparency indicating reduced prominence or significance.
Color Interpretation Framework for Strategic Decision Making:
-Intense Blue/Purple (High Opacity): Strong CCI readings exceeding ±80 with notable momentum strength indicating support/resistance zones suitable for increased position management decisions
• Moderate Blue/Purple (Medium Opacity): Standard CCI readings ranging ±40-80 with normal momentum indicating support/resistance areas for standard position management protocols
• Faded Blue/Purple (High Transparency): Weak CCI readings below ±40 with minimal momentum suggesting cautious interpretation and conservative position management approaches
• Dynamic Color Transitions: Automatic real-time shifts between bullish (blue spectrum) and bearish (purple spectrum) based on CCI trend direction and momentum persistence characteristics
CCI Inflection Circle System - Momentum Reversal Identification: The inflection detection system creates distinctive visual alerts through dual-circle design combining solid cores with transparent glow effects for enhanced visibility across different chart backgrounds and timeframe configurations.
Inflection Circle Classification:
• Neon Green Circles: CCI extreme bullish inflection detected (>80 threshold) with systematic core + glow effect indicating bearish reversal warning for position management evaluation
• Hot Pink Circles: CCI extreme bearish inflection detected (<-80 threshold) with dual-layer visualization indicating bullish reversal opportunity for strategic entry consideration
• Dual-Circle Design Architecture: Solid tiny core providing location identification with large transparent glow ensuring visibility without chart obstruction across multiple timeframe analyses
SAR Visual Network - Multi-Layer Momentum Display Architecture
SAR Visualization Framework: The SAR visual system implements structured multi-layer display architecture incorporating trend lines, strength classification markers, and momentum analysis through various visual elements that automatically adapt to current momentum conditions and strength characteristics.
SAR Strength Visual Classification System:
• Bright Triangles (High Intensity): Strong SAR momentum exceeding 75% of calculated strength range, indicating significant momentum quality suitable for increased positioning considerations and extended target scenarios
• Standard Circles (Medium Intensity): Moderate SAR momentum within 25-75% strength range, representing normal momentum development appropriate for standard positioning approaches and regular target expectations
• Faded Markers (Low Intensity): Weak SAR momentum below 25% strength range, suggesting caution and conservative positioning during minimal momentum conditions with increased exit sensitivity
⚠️IMPORTANT DISCLAIMERS AND RISK WARNINGS
Past Performance Limitations: The backtesting results presented represent hypothetical performance based on historical market data and do not guarantee future results. All trading involves substantial risk of loss. This strategy is provided for informational purposes and does not constitute financial advice. No trading strategy can guarantee 100% success or eliminate the risk of loss.
Users must approach trading with appropriate caution, never risking more than they can afford to lose.
Users are responsible for their own trading decisions, risk management, and compliance with applicable regulations in their jurisdiction.

SDR Market Structure (liv3) 1.0🧠 SDR Market Structure (LIV3) v1.0
Precision-Based Market Structure & Momentum Scalping
Strategy Type: Market Structure-Based Scalping
Built For: Intraday, Scalping, Trend-Following or Reversal entries with confirmation filters
Assets: All (optimized for FX and indices)
Timeframes: 1min to 15min (ideal for scalping); higher TFs can be used for structure alignment
🎯 Strategy Overview
SDR Market Structure is a robust scalping strategy that combines structural market context (Change-of-Character, Break of Structure) with a modular system of technical filters that advanced traders can toggle on/off. The strategy is adaptable and surgical, designed to find high-probability trade entries during momentum shifts, liquidity grabs, and trend continuations.
This script supports fine-tuned risk management, multiple confirmation layers, and intraday session filtering, allowing experienced traders to tailor it for precision-based trading in varying volatility regimes.
🔍 Core Logic: CHoCH and Market Structure
At the heart of SDR Scalper is Change-of-Character (CHoCH) detection:
Bullish CHoCH: Occurs when price breaks above a recent swing high (pivot) after making a lower low, implying a potential reversal or continuation.
Bearish CHoCH: Triggers when price breaks below a recent swing low after making a higher high.
Once a CHoCH is identified:
Entry is confirmed only if all selected filters pass, ensuring high-confidence setups.
SL is placed at the most recent swing low/high or an optional looser SL based on fractals.
Break-even logic moves SL to entry upon hitting 1R.
Risk-Reward ratio is fully customizable.
🛠️ Advanced Filter Modules
Each filter module below can be toggled independently, allowing for custom filtering strategies based on trading conditions.
1️⃣ HTF EMA Filter
Purpose: Confirms trend bias using a higher timeframe EMA (e.g., 55 EMA on 15-min TF).
Logic:
Longs: Entry only allowed if price > HTF EMA
Shorts: Entry only allowed if price < HTF EMA
Why Use It: Prevents counter-trend trades. Excellent when used during trending sessions.
Best Paired With: EMA crossover filter or RSI for intraday trend alignment.
2️⃣ EMA Crossover Filter
Inputs: Fast EMA (default 10), Slow EMA (default 50)
Logic:
Longs: Fast EMA must be above Slow EMA
Shorts: Fast EMA below Slow EMA
Enhancement: Adds a moving average structure filter to CHoCH. Good for filtering false breakouts during sideways markets.
Combo Tip: Use alongside RSI/MACD filters to confirm trend momentum.
3️⃣ RSI Filter
Default Period: 14
Logic:
Longs: RSI > threshold (default 50)
Shorts: RSI < threshold
Edge: Useful for momentum confirmation in trending conditions.
Advanced Use:
Raise thresholds to 60/40 in strong trends.
Combine with MACD to filter momentum exhaustion.
4️⃣ MACD Histogram Filter
MACD Histogram > 0: Long entries only
MACD Histogram < 0: Short entries only
Purpose: Measures positive/negative momentum shifts, helpful in volatile breakouts.
Pro Tip: Combine with ROC filter in fast-moving markets for maximum edge.
5️⃣ Rate of Change (ROC) Filter
Default: 9-period
Logic:
Longs: ROC > threshold (default 0.0)
Shorts: ROC < threshold
Why It Works: Captures short bursts of momentum often missed by other lagging indicators.
Combos That Work:
MACD + ROC: Double momentum filter
ROC + EMA crossover: Catch high-speed trend continuations
6️⃣ Stochastic RSI Filter
Parameters: Customizable %K and %D smoothing
Logic:
Longs: StochRSI > threshold and K > D
Shorts: StochRSI < threshold and K < D
Use Case: Effective for mean-reversion and momentum crossovers near S/R zones.
Advanced Tip: Use in ranging markets or to fade extended trends.
7️⃣ Time Filter
Customize Start/End Time: Default is 09:30 - 16:00 (New York session)
Supports Time Zones: Input via string (e.g., GMT+0, EST, etc.)
Visual Aid: Background shading for valid sessions.
Benefits:
Avoids low-liquidity or overnight trading periods.
Prevents false signals in pre/post-market sessions.
8️⃣ Loose Stop-Loss Option
If Enabled: SL placed 1 fractal beyond the last pivot.
Why: Helps in volatile assets like crypto where swing points are commonly breached before reversals.
Note: Should be used with tight risk controls or lower position sizing.
💼 Risk Management & Break-Even Logic
Risk-to-Reward Ratio: Adjustable via input
Auto TP & SL: Based on defined RR and recent structure
Break-Even Feature: Moves SL to entry after 1R is reached to protect capital
📈 Strategy Display Elements
CHoCH & BoS Labels: Visual confirmation of structure breaks
Liquidity Sweep (✖): Optional display for potential stop hunts
Trend Color Candles: Highlights bullish or bearish candle clusters
Session Overlay: Displays active time window on chart
⚙️ Recommended Configurations
Objective Suggested Filters
Trend Scalping HTF EMA + EMA Crossover + RSI
Volatility Breakouts ROC + MACD Histogram + Time Filter
Mean Reversion Stochastic RSI + RSI
Structure-Only Mode Disable all filters except Time Filter
Conservative Mode Enable all filters with tightened thresholds
📌 Final Notes
This script is highly modular and is not a one-size-fits-all strategy. It is a framework that allows advanced traders to apply contextual judgment and optimize entries based on confluence. Extensive backtesting per asset and timeframe is highly recommended.
🛠️ Strategy Parameters Summary
✅ Market Structure Entry (CHoCH)
✅ Smart SL & Break-Even Logic
✅ Modular Momentum Filters (RSI, MACD, ROC, StochRSI)
✅ Trend Filters (HTF EMA, EMA Cross)
✅ Session Filtering & Visualization
✅ Liquidity Sweeps (optional)
pinescript version5

Market Trend Levels Non-Repainting [BigBeluga X PineIndicators]This strategy is based on the Market Trend Levels Detector developed by BigBeluga. Full credit for the concept and original indicator goes to BigBeluga.
The Market Trend Levels Detector Strategy is a non-repainting trend-following strategy that identifies market trend shifts using two Exponential Moving Averages (EMA). It also detects key price levels and allows traders to apply multiple filters to refine trade entries and exits.
This strategy is designed for trend trading and enables traders to:
Identify trend direction based on EMA crossovers.
Detect significant market levels using labeled trend lines.
Use multiple filter conditions to improve trade accuracy.
Avoid false signals through non-repainting calculations.
How the Market Trend Levels Detector Strategy Works
1. Core Trend Detection Using EMA Crossovers
The strategy detects trend shifts using two EMAs:
Fast EMA (default: 12 periods) – Reacts quickly to price movements.
Slow EMA (default: 25 periods) – Provides a smoother trend confirmation.
A bullish crossover (Fast EMA crosses above Slow EMA) signals an uptrend , while a bearish crossover (Fast EMA crosses below Slow EMA) signals a downtrend .
2. Market Level Detection & Visualization
Each time an EMA crossover occurs, a trend level line is drawn:
Bullish crossover → A green line is drawn at the low of the crossover candle.
Bearish crossover → A purple line is drawn at the high of the crossover candle.
Lines can be extended to act as support and resistance zones for future price action.
Additionally, a small label (●) appears at each crossover to mark the event on the chart.
3. Trade Entry & Exit Conditions
The strategy allows users to choose between three trading modes:
Long Only – Only enters long trades.
Short Only – Only enters short trades.
Long & Short – Trades in both directions.
Entry Conditions
Long Entry:
A bullish EMA crossover occurs.
The trade direction setting allows long trades.
Filter conditions (if enabled) confirm a valid long signal.
Short Entry:
A bearish EMA crossover occurs.
The trade direction setting allows short trades.
Filter conditions (if enabled) confirm a valid short signal.
Exit Conditions
Long Exit:
A bearish EMA crossover occurs.
Exit filters (if enabled) indicate an invalid long position.
Short Exit:
A bullish EMA crossover occurs.
Exit filters (if enabled) indicate an invalid short position.
Additional Trade Filters
To improve trade accuracy, the strategy allows traders to apply up to 7 additional filters:
RSI Filter: Only trades when RSI confirms a valid trend.
MACD Filter: Ensures MACD histogram supports the trade direction.
Stochastic Filter: Requires %K line to be above/below threshold values.
Bollinger Bands Filter: Confirms price position relative to the middle BB line.
ADX Filter: Ensures the trend strength is above a set threshold.
CCI Filter: Requires CCI to indicate momentum in the right direction.
Williams %R Filter: Ensures price momentum supports the trade.
Filters can be enabled or disabled individually based on trader preference.
Dynamic Level Extension Feature
The strategy provides an optional feature to extend trend lines until price interacts with them again:
Bullish support lines extend until price revisits them.
Bearish resistance lines extend until price revisits them.
If price breaks a line, the line turns into a dotted style , indicating it has been breached.
This helps traders identify key levels where trend shifts previously occurred, providing useful support and resistance insights.
Customization Options
The strategy includes several adjustable settings :
Trade Direction: Choose between Long Only, Short Only, or Long & Short.
Trend Lengths: Adjust the Fast & Slow EMA lengths.
Market Level Extension: Decide whether to extend support/resistance lines.
Filters for Trade Confirmation: Enable/disable individual filters.
Color Settings: Customize line colors for bullish and bearish trend shifts.
Maximum Displayed Lines: Limit the number of drawn support/resistance lines.
Considerations & Limitations
Trend Lag: As with any EMA-based strategy, signals may be slightly delayed compared to price action.
Sideways Markets: This strategy works best in trending conditions; frequent crossovers in sideways markets can produce false signals.
Filter Usage: Enabling multiple filters may reduce trade frequency, but can also improve trade quality.
Line Overlap: If many crossovers occur in a short period, the chart may become cluttered with multiple trend levels. Adjusting the "Display Last" setting can help.
Conclusion
The Market Trend Levels Detector Strategy is a non-repainting trend-following system that combines EMA crossovers, market level detection, and customizable filters to improve trade accuracy.
By identifying trend shifts and key price levels, this strategy can be used for:
Trend Confirmation – Using EMA crossovers and filters to confirm trend direction.
Support & Resistance Trading – Identifying dynamic levels where price reacts.
Momentum-Based Trading – Combining EMA crossovers with additional momentum filters.
This strategy is fully customizable and can be adapted to different trading styles, timeframes, and market conditions.
Full credit for the original concept and indicator goes to BigBeluga.

RSI Trend Following StrategyOverview
The RSI Trend Following Strategy utilizes Relative Strength Index (RSI) to enter the trade for the potential trend continuation. It uses Stochastic indicator to check is the price is not in overbought territory and the MACD to measure the current price momentum. Moreover, it uses the 200-period EMA to filter the counter trend trades with the higher probability. The strategy opens only long trades.
Unique Features
Dynamic stop-loss system: Instead of fixed stop-loss level strategy utilizes average true range (ATR) multiplied by user given number subtracted from the position entry price as a dynamic stop loss level.
Configurable Trading Periods: Users can tailor the strategy to specific market windows, adapting to different market conditions.
Two layers trade filtering system: Strategy utilizes MACD and Stochastic indicators measure the current momentum and overbought condition and use 200-period EMA to filter trades against major trend.
Trailing take profit level: After reaching the trailing profit activation level script activates the trailing of long trade using EMA. More information in methodology.
Wide opportunities for strategy optimization: Flexible strategy settings allows users to optimize the strategy entries and exits for chosen trading pair and time frame.
Methodology
The strategy opens long trade when the following price met the conditions:
RSI is above 50 level.
MACD line shall be above the signal line
Both lines of Stochastic shall be not higher than 80 (overbought territory)
Candle’s low shall be above the 200 period EMA
When long trade is executed, strategy set the stop-loss level at the price ATR multiplied by user-given value below the entry price. This level is recalculated on every next candle close, adjusting to the current market volatility.
At the same time strategy set up the trailing stop validation level. When the price crosses the level equals entry price plus ATR multiplied by user-given value script starts to trail the price with trailing EMA(by default = 20 period). If price closes below EMA long trade is closed. When the trailing starts, script prints the label “Trailing Activated”.
Strategy settings
In the inputs window user can setup the following strategy settings:
ATR Stop Loss (by default = 1.75)
ATR Trailing Profit Activation Level (by default = 2.25)
MACD Fast Length (by default = 12, period of averaging fast MACD line)
MACD Fast Length (by default = 26, period of averaging slow MACD line)
MACD Signal Smoothing (by default = 9, period of smoothing MACD signal line)
Oscillator MA Type (by default = EMA, available options: SMA, EMA)
Signal Line MA Type (by default = EMA, available options: SMA, EMA)
RSI Length (by default = 14, period for RSI calculation)
Trailing EMA Length (by default = 20, period for EMA, which shall be broken close the trade after trailing profit activation)
Justification of Methodology
This trading strategy is designed to leverage a combination of technical indicators—Relative Strength Index (RSI), Moving Average Convergence Divergence (MACD), Stochastic Oscillator, and the 200-period Exponential Moving Average (EMA)—to determine optimal entry points for long trades. Additionally, the strategy uses the Average True Range (ATR) for dynamic risk management to adapt to varying market conditions. Let's look in details for which purpose each indicator is used for and why it is used in this combination.
Relative Strength Index (RSI) is a momentum indicator used in technical analysis to measure the speed and change of price movements in a financial market. It helps traders identify whether an asset is potentially overbought (overvalued) or oversold (undervalued), which can indicate a potential reversal or continuation of the current trend.
How RSI Works? RSI tracks the strength of recent price changes. It compares the average gains and losses over a specific period (usually 14 periods) to assess the momentum of an asset. Average gain is the average of all positive price changes over the chosen period. It reflects how much the price has typically increased during upward movements. Average loss is the average of all negative price changes over the same period. It reflects how much the price has typically decreased during downward movements.
RSI calculates these average gains and losses and compares them to create a value between 0 and 100. If the RSI value is above 70, the asset is generally considered overbought, meaning it might be due for a price correction or reversal downward. Conversely, if the RSI value is below 30, the asset is considered oversold, suggesting it could be poised for an upward reversal or recovery. RSI is a useful tool for traders to determine market conditions and make informed decisions about entering or exiting trades based on the perceived strength or weakness of an asset's price movements.
This strategy uses RSI as a short-term trend approximation. If RSI crosses over 50 it means that there is a high probability of short-term trend change from downtrend to uptrend. Therefore RSI above 50 is our first trend filter to look for a long position.
The MACD (Moving Average Convergence Divergence) is a popular momentum and trend-following indicator used in technical analysis. It helps traders identify changes in the strength, direction, momentum, and duration of a trend in an asset's price.
The MACD consists of three components:
MACD Line: This is the difference between a short-term Exponential Moving Average (EMA) and a long-term EMA, typically calculated as: MACD Line = 12 period EMA − 26 period EMA
Signal Line: This is a 9-period EMA of the MACD Line, which helps to identify buy or sell signals. When the MACD Line crosses above the Signal Line, it can be a bullish signal (suggesting a buy); when it crosses below, it can be a bearish signal (suggesting a sell).
Histogram: The histogram shows the difference between the MACD Line and the Signal Line, visually representing the momentum of the trend. Positive histogram values indicate increasing bullish momentum, while negative values indicate increasing bearish momentum.
This strategy uses MACD as a second short-term trend filter. When MACD line crossed over the signal line there is a high probability that uptrend has been started. Therefore MACD line above signal line is our additional short-term trend filter. In conjunction with RSI it decreases probability of following false trend change signals.
The Stochastic Indicator is a momentum oscillator that compares a security's closing price to its price range over a specific period. It's used to identify overbought and oversold conditions. The indicator ranges from 0 to 100, with readings above 80 indicating overbought conditions and readings below 20 indicating oversold conditions.
It consists of two lines:
%K: The main line, calculated using the formula (CurrentClose−LowestLow)/(HighestHigh−LowestLow)×100 . Highest and lowest price taken for 14 periods.
%D: A smoothed moving average of %K, often used as a signal line.
This strategy uses stochastic to define the overbought conditions. The logic here is the following: we want to avoid long trades in the overbought territory, because when indicator reaches it there is a high probability that the potential move is gonna be restricted.
The 200-period EMA is a widely recognized indicator for identifying the long-term trend direction. The strategy only trades in the direction of this primary trend to increase the probability of successful trades. For instance, when the price is above the 200 EMA, only long trades are considered, aligning with the overarching trend direction.
Therefore, strategy uses combination of RSI and MACD to increase the probability that price now is in short-term uptrend, Stochastic helps to avoid the trades in the overbought (>80) territory. To increase the probability of opening long trades in the direction of a main trend and avoid local bounces we use 200 period EMA.
ATR is used to adjust the strategy risk management to the current market volatility. If volatility is low, we don’t need the large stop loss to understand the there is a high probability that we made a mistake opening the trade. User can setup the settings ATR Stop Loss and ATR Trailing Profit Activation Level to realize his own risk to reward preferences, but the unique feature of a strategy is that after reaching trailing profit activation level strategy is trying to follow the trend until it is likely to be finished instead of using fixed risk management settings. It allows sometimes to be involved in the large movements.
Backtest Results
Operating window: Date range of backtests is 2023.01.01 - 2024.08.01. It is chosen to let the strategy to close all opened positions.
Commission and Slippage: Includes a standard Binance commission of 0.1% and accounts for possible slippage over 5 ticks.
Initial capital: 10000 USDT
Percent of capital used in every trade: 30%
Maximum Single Position Loss: -3.94%
Maximum Single Profit: +15.78%
Net Profit: +1359.21 USDT (+13.59%)
Total Trades: 111 (36.04% win rate)
Profit Factor: 1.413
Maximum Accumulated Loss: 625.02 USDT (-5.85%)
Average Profit per Trade: 12.25 USDT (+0.40%)
Average Trade Duration: 40 hours
These results are obtained with realistic parameters representing trading conditions observed at major exchanges such as Binance and with realistic trading portfolio usage parameters.
How to Use
Add the script to favorites for easy access.
Apply to the desired timeframe and chart (optimal performance observed on 2h BTC/USDT).
Configure settings using the dropdown choice list in the built-in menu.
Set up alerts to automate strategy positions through web hook with the text: {{strategy.order.alert_message}}
Disclaimer:
Educational and informational tool reflecting Skyrex commitment to informed trading. Past performance does not guarantee future results. Test strategies in a simulated environment before live implementation

Dual Chain StrategyDual Chain Strategy - Technical Overview
How It Works:
The Dual Chain Strategy is a unique approach to trading that utilizes Exponential Moving Averages (EMAs) across different timeframes, creating two distinct "chains" of trading signals. These chains can work independently or together, capturing both long-term trends and short-term price movements.
Chain 1 (Longer-Term Focus):
Entry Signal: The entry signal for Chain 1 is generated when the closing price crosses above the EMA calculated on a weekly timeframe. This suggests the start of a bullish trend and prompts a long position.
bullishChain1 = enableChain1 and ta.crossover(src1, entryEMA1)
Exit Signal: The exit signal is triggered when the closing price crosses below the EMA on a daily timeframe, indicating a potential bearish reversal.
exitLongChain1 = enableChain1 and ta.crossunder(src1, exitEMA1)
Parameters: Chain 1's EMA length is set to 10 periods by default, with the flexibility for user adjustment to match various trading scenarios.
Chain 2 (Shorter-Term Focus):
Entry Signal: Chain 2 generates an entry signal when the closing price crosses above the EMA on a 12-hour timeframe. This setup is designed to capture quicker, shorter-term movements.
bullishChain2 = enableChain2 and ta.crossover(src2, entryEMA2)
Exit Signal: The exit signal occurs when the closing price falls below the EMA on a 9-hour timeframe, indicating the end of the shorter-term trend.
exitLongChain2 = enableChain2 and ta.crossunder(src2, exitEMA2)
Parameters: Chain 2's EMA length is set to 9 periods by default, and can be customized to better align with specific market conditions or trading strategies.
Key Features:
Dual EMA Chains: The strategy's originality shines through its dual-chain configuration, allowing traders to monitor and react to both long-term and short-term market trends. This approach is particularly powerful as it combines the strengths of trend-following with the agility of momentum trading.
Timeframe Flexibility: Users can modify the timeframes for both chains, ensuring the strategy can be tailored to different market conditions and individual trading styles. This flexibility makes it versatile for various assets and trading environments.
Independent Trade Logic: Each chain operates independently, with its own set of entry and exit rules. This allows for simultaneous or separate execution of trades based on the signals from either or both chains, providing a robust trading system that can handle different market phases.
Backtesting Period: The strategy includes a configurable backtesting period, enabling thorough performance assessment over a historical range. This feature is crucial for understanding how the strategy would have performed under different market conditions.
time_cond = time >= startDate and time <= finishDate
What It Does:
The Dual Chain Strategy offers traders a distinctive trading tool that merges two separate EMA-based systems into one cohesive framework. By integrating both long-term and short-term perspectives, the strategy enhances the ability to adapt to changing market conditions. The originality of this script lies in its innovative dual-chain design, providing traders with a unique edge by allowing them to capitalize on both significant trends and smaller, faster price movements.
Whether you aim to capture extended market trends or take advantage of more immediate price action, the Dual Chain Strategy provides a comprehensive solution with a high degree of customization and strategic depth. Its flexibility and originality make it a valuable tool for traders seeking to refine their approach to market analysis and execution.
How to Use the Dual Chain Strategy
Step 1: Access the Strategy
Add the Script: Start by adding the Dual Chain Strategy to your TradingView chart. You can do this by searching for the script by name or using the link provided.
Select the Asset: Apply the strategy to your preferred trading pair or asset, such as #BTCUSD, to see how it performs.
Step 2: Configure the Settings
Enable/Disable Chains:
The strategy is designed with two independent chains. You can choose to enable or disable each chain depending on your trading style and the market conditions.
enableChain1 = input.bool(true, title='Enable Chain 1')
enableChain2 = input.bool(true, title='Enable Chain 2')
By default, both chains are enabled. If you prefer to focus only on longer-term trends, you might disable Chain 2, or vice versa if you prefer shorter-term trades.
Set EMA Lengths:
Adjust the EMA lengths for each chain to match your trading preferences.
Chain 1: The default EMA length is 10 periods. This chain uses a weekly timeframe for entry signals and a daily timeframe for exits.
len1 = input.int(10, minval=1, title='Length Chain 1 EMA', group="Chain 1")
Chain 2: The default EMA length is 9 periods. This chain uses a 12-hour timeframe for entries and a 9-hour timeframe for exits.
len2 = input.int(9, minval=1, title='Length Chain 2 EMA', group="Chain 2")
Customize Timeframes:
You can customize the timeframes used for entry and exit signals for both chains.
Chain 1:
Entry Timeframe: Weekly
Exit Timeframe: Daily
tf1_entry = input.timeframe("W", title='Chain 1 Entry Timeframe', group="Chain 1")
tf1_exit = input.timeframe("D", title='Chain 1 Exit Timeframe', group="Chain 1")
Chain 2:
Entry Timeframe: 12 Hours
Exit Timeframe: 9 Hours
tf2_entry = input.timeframe("720", title='Chain 2 Entry Timeframe (12H)', group="Chain 2")
tf2_exit = input.timeframe("540", title='Chain 2 Exit Timeframe (9H)', group="Chain 2")
Set the Backtesting Period:
Define the period over which you want to backtest the strategy. This allows you to see how the strategy would have performed historically.
startDate = input.time(timestamp('2015-07-27'), title="StartDate")
finishDate = input.time(timestamp('2026-01-01'), title="FinishDate")
Step 3: Analyze the Signals
Understand the Entry and Exit Signals:
Buy Signals: When the price crosses above the entry EMA, the strategy generates a buy signal.
bullishChain1 = enableChain1 and ta.crossover(src1, entryEMA1)
Sell Signals: When the price crosses below the exit EMA, the strategy generates a sell signal.
bearishChain2 = enableChain2 and ta.crossunder(src2, entryEMA2)
Review the Visual Indicators:
The strategy plots buy and sell signals on the chart with labels for easy identification:
BUY C1/C2 for buy signals from Chain 1 and Chain 2.
SELL C1/C2 for sell signals from Chain 1 and Chain 2.
This visual aid helps you quickly understand when and why trades are being executed.
Step 4: Optimize the Strategy
Backtest Results:
Review the strategy’s performance over the backtesting period. Look at key metrics like net profit, drawdown, and trade statistics to evaluate its effectiveness.
Adjust the EMA lengths, timeframes, and other settings to see how changes affect the strategy’s performance.
Customize for Live Trading:
Once satisfied with the backtest results, you can apply the strategy settings to live trading. Remember to continuously monitor and adjust as needed based on market conditions.
Step 5: Implement Risk Management
Use Realistic Position Sizing:
Keep your risk exposure per trade within a comfortable range, typically between 1-2% of your trading capital.
Set Alerts:
Set up alerts for buy and sell signals, so you don’t miss trading opportunities.
Paper Trade First:
Consider running the strategy in a paper trading account to understand its behavior in real market conditions before committing real capital.
This dual-layered approach offers a distinct advantage: it enables the strategy to adapt to varying market conditions by capturing both broad trends and immediate price action without one chain's activity impacting the other's decision-making process. The independence of these chains in executing transactions adds a level of sophistication and flexibility that is rarely seen in more conventional trading systems, making the Dual Chain Strategy not just unique, but a powerful tool for traders seeking to navigate complex market environments.

DLX-NationThis Strategy is based on 8 EMAs and the RSI ( 14 Length )
Its algorism check for the trend of the market using crossover EMAs, then it waits for a 38% - 50% pullback. During this Pullback it checks the behaviour of the EMAs by making sure consolidation is coming to and end by checking if the red EMA cuts through certain candle bodies. Then it detects a takeover in the market, meaning during a pullback ( in case of a buy ) it calculates the selling volume and waits to confirm that buyers retake over the Market by calculating the candle sizes making sure the current candle is bigger than the previous candle using the 3rd EMA (if 50 EMA is below market price) then finally It checks if there is enough buying Strength ( in case of a buy ) or enough selling strength ( in case of a sell) by checking the RSI level over a certain period of time. When all these confirmations are done, it then analyses previous supports and resistence, and only sends a signal if there is not resistance for a buy and no support for a sell.
Its best for a strong bullish or bearish 1min, 5mins and 15mins market, thats why it only available on US30 and NAS100 for now. Its best when all the EMAs are spreading out or in other words the distance between the EMAs are increasing.
In case of a consolidation, you will see all EMAs moving together and in this case you shouldnt take any signal called. Following EMAs should guide you identifying a consilidation
50 EMA = Aqua
90 EMA = Green
150 EMA = Purple
200 EMA = Gray
400 EMA = Orange
800 EMA = Blue
Note: If you see all these EMA coming closer to each other, it indicates a long going consolidation and during these moments you shouldnt execute any signal. These is the reason why we decided to plot them on the Chart. We understand trading with a clean Chart is important, moreover using certain tools to be more profitable is essential. In case the 50 EMA ( Aqua ) Crosses over or below the 150 EMA ( Green ) and 200 EMA (Gray), this will indicate end of the consolidation and the signals will have more liquidity and movement.
Lastly when a signal is being called make sure the last candle is clearly bigger than the previous candles, this indicates that the buyer ( in case of a buy candle ) are clearly taking over the market or the sellers ( in case of a sell candle ) are clearly taking over the market giving you more volume and liquidity.
To optain the max Profit:
After adding the Strategy / Indicator on your Chart go to Settings -> Properties and set the Pyramiding to 30. These implies that we can have 30 consecutive buy signals in a row or sell signals in a row. We recommend an initail Balance of 2000$, but mininum 1000% and a lotsize of 10cent per pip (0.1). Strickly follow the Take Profit (100pips) and StopLoss (500pips) level that will be provided in this case also risk only 1% of your account per trade and maximun 5% per running trades.
Keep in mind, the smaller the TImeframe the more trades you will recieve and the stronger the momentum the more profitable the trade will be.

STD-Filterd, R-squared Adaptive T3 w/ Dynamic Zones BT [Loxx]STD-Filterd, R-squared Adaptive T3 w/ Dynamic Zones BT is the backtest strategy for "STD-Filterd, R-squared Adaptive T3 w/ Dynamic Zones " seen below:
Included:
This backtest uses a special implementation of ATR and ATR smoothing called "True Range Double" which is a range calculation that accounts for volatility skew.
You can set the backtest to 1-2 take profits with stop-loss
Signals can't exit on the same candle as the entry, this is coded in a way for 1-candle delay post entry
This should be coupled with the INDICATOR version linked above for the alerts and signals. Strategies won't paint the signal "L" or "S" until the entry actually happens, but indicators allow this, which is repainting on current candle, but this is an FYI if you want to get serious with Pinescript algorithmic botting
You can restrict the backtest by dates
It is advised that you understand what Heikin-Ashi candles do to strategies, the default settings for this backtest is NON Heikin-Ashi candles but you have the ability to change that in the source selection
This is a mathematically heavy, heavy-lifting strategy with multi-layered adaptivity. Make sure you do your own research so you understand what is happening here. This can be used as its own trading system without any other oscillators, moving average baselines, or volatility/momentum confirmation indicators.
What is the T3 moving average?
Better Moving Averages Tim Tillson
November 1, 1998
Tim Tillson is a software project manager at Hewlett-Packard, with degrees in Mathematics and Computer Science. He has privately traded options and equities for 15 years.
Introduction
"Digital filtering includes the process of smoothing, predicting, differentiating, integrating, separation of signals, and removal of noise from a signal. Thus many people who do such things are actually using digital filters without realizing that they are; being unacquainted with the theory, they neither understand what they have done nor the possibilities of what they might have done."
This quote from R. W. Hamming applies to the vast majority of indicators in technical analysis . Moving averages, be they simple, weighted, or exponential, are lowpass filters; low frequency components in the signal pass through with little attenuation, while high frequencies are severely reduced.
"Oscillator" type indicators (such as MACD , Momentum, Relative Strength Index ) are another type of digital filter called a differentiator.
Tushar Chande has observed that many popular oscillators are highly correlated, which is sensible because they are trying to measure the rate of change of the underlying time series, i.e., are trying to be the first and second derivatives we all learned about in Calculus.
We use moving averages (lowpass filters) in technical analysis to remove the random noise from a time series, to discern the underlying trend or to determine prices at which we will take action. A perfect moving average would have two attributes:
It would be smooth, not sensitive to random noise in the underlying time series. Another way of saying this is that its derivative would not spuriously alternate between positive and negative values.
It would not lag behind the time series it is computed from. Lag, of course, produces late buy or sell signals that kill profits.
The only way one can compute a perfect moving average is to have knowledge of the future, and if we had that, we would buy one lottery ticket a week rather than trade!
Having said this, we can still improve on the conventional simple, weighted, or exponential moving averages. Here's how:
Two Interesting Moving Averages
We will examine two benchmark moving averages based on Linear Regression analysis.
In both cases, a Linear Regression line of length n is fitted to price data.
I call the first moving average ILRS, which stands for Integral of Linear Regression Slope. One simply integrates the slope of a linear regression line as it is successively fitted in a moving window of length n across the data, with the constant of integration being a simple moving average of the first n points. Put another way, the derivative of ILRS is the linear regression slope. Note that ILRS is not the same as a SMA ( simple moving average ) of length n, which is actually the midpoint of the linear regression line as it moves across the data.
We can measure the lag of moving averages with respect to a linear trend by computing how they behave when the input is a line with unit slope. Both SMA (n) and ILRS(n) have lag of n/2, but ILRS is much smoother than SMA .
Our second benchmark moving average is well known, called EPMA or End Point Moving Average. It is the endpoint of the linear regression line of length n as it is fitted across the data. EPMA hugs the data more closely than a simple or exponential moving average of the same length. The price we pay for this is that it is much noisier (less smooth) than ILRS, and it also has the annoying property that it overshoots the data when linear trends are present.
However, EPMA has a lag of 0 with respect to linear input! This makes sense because a linear regression line will fit linear input perfectly, and the endpoint of the LR line will be on the input line.
These two moving averages frame the tradeoffs that we are facing. On one extreme we have ILRS, which is very smooth and has considerable phase lag. EPMA has 0 phase lag, but is too noisy and overshoots. We would like to construct a better moving average which is as smooth as ILRS, but runs closer to where EPMA lies, without the overshoot.
A easy way to attempt this is to split the difference, i.e. use (ILRS(n)+EPMA(n))/2. This will give us a moving average (call it IE /2) which runs in between the two, has phase lag of n/4 but still inherits considerable noise from EPMA. IE /2 is inspirational, however. Can we build something that is comparable, but smoother? Figure 1 shows ILRS, EPMA, and IE /2.
Filter Techniques
Any thoughtful student of filter theory (or resolute experimenter) will have noticed that you can improve the smoothness of a filter by running it through itself multiple times, at the cost of increasing phase lag.
There is a complementary technique (called twicing by J.W. Tukey) which can be used to improve phase lag. If L stands for the operation of running data through a low pass filter, then twicing can be described by:
L' = L(time series) + L(time series - L(time series))
That is, we add a moving average of the difference between the input and the moving average to the moving average. This is algebraically equivalent to:
2L-L(L)
This is the Double Exponential Moving Average or DEMA , popularized by Patrick Mulloy in TASAC (January/February 1994).
In our taxonomy, DEMA has some phase lag (although it exponentially approaches 0) and is somewhat noisy, comparable to IE /2 indicator.
We will use these two techniques to construct our better moving average, after we explore the first one a little more closely.
Fixing Overshoot
An n-day EMA has smoothing constant alpha=2/(n+1) and a lag of (n-1)/2.
Thus EMA (3) has lag 1, and EMA (11) has lag 5. Figure 2 shows that, if I am willing to incur 5 days of lag, I get a smoother moving average if I run EMA (3) through itself 5 times than if I just take EMA (11) once.
This suggests that if EPMA and DEMA have 0 or low lag, why not run fast versions (eg DEMA (3)) through themselves many times to achieve a smooth result? The problem is that multiple runs though these filters increase their tendency to overshoot the data, giving an unusable result. This is because the amplitude response of DEMA and EPMA is greater than 1 at certain frequencies, giving a gain of much greater than 1 at these frequencies when run though themselves multiple times. Figure 3 shows DEMA (7) and EPMA(7) run through themselves 3 times. DEMA^3 has serious overshoot, and EPMA^3 is terrible.
The solution to the overshoot problem is to recall what we are doing with twicing:
DEMA (n) = EMA (n) + EMA (time series - EMA (n))
The second term is adding, in effect, a smooth version of the derivative to the EMA to achieve DEMA . The derivative term determines how hot the moving average's response to linear trends will be. We need to simply turn down the volume to achieve our basic building block:
EMA (n) + EMA (time series - EMA (n))*.7;
This is algebraically the same as:
EMA (n)*1.7-EMA( EMA (n))*.7;
I have chosen .7 as my volume factor, but the general formula (which I call "Generalized Dema") is:
GD (n,v) = EMA (n)*(1+v)-EMA( EMA (n))*v,
Where v ranges between 0 and 1. When v=0, GD is just an EMA , and when v=1, GD is DEMA . In between, GD is a cooler DEMA . By using a value for v less than 1 (I like .7), we cure the multiple DEMA overshoot problem, at the cost of accepting some additional phase delay. Now we can run GD through itself multiple times to define a new, smoother moving average T3 that does not overshoot the data:
T3(n) = GD ( GD ( GD (n)))
In filter theory parlance, T3 is a six-pole non-linear Kalman filter. Kalman filters are ones which use the error (in this case (time series - EMA (n)) to correct themselves. In Technical Analysis , these are called Adaptive Moving Averages; they track the time series more aggressively when it is making large moves.
What is R-squared Adaptive?
One tool available in forecasting the trendiness of the breakout is the coefficient of determination ( R-squared ), a statistical measurement.
The R-squared indicates linear strength between the security's price (the Y - axis) and time (the X - axis). The R-squared is the percentage of squared error that the linear regression can eliminate if it were used as the predictor instead of the mean value. If the R-squared were 0.99, then the linear regression would eliminate 99% of the error for prediction versus predicting closing prices using a simple moving average .
R-squared is used here to derive a T3 factor used to modify price before passing price through a six-pole non-linear Kalman filter.
What are Dynamic Zones?
As explained in "Stocks & Commodities V15:7 (306-310): Dynamic Zones by Leo Zamansky, Ph .D., and David Stendahl"
Most indicators use a fixed zone for buy and sell signals. Here’ s a concept based on zones that are responsive to past levels of the indicator.
One approach to active investing employs the use of oscillators to exploit tradable market trends. This investing style follows a very simple form of logic: Enter the market only when an oscillator has moved far above or below traditional trading lev- els. However, these oscillator- driven systems lack the ability to evolve with the market because they use fixed buy and sell zones. Traders typically use one set of buy and sell zones for a bull market and substantially different zones for a bear market. And therein lies the problem.
Once traders begin introducing their market opinions into trading equations, by changing the zones, they negate the system’s mechanical nature. The objective is to have a system automatically define its own buy and sell zones and thereby profitably trade in any market — bull or bear. Dynamic zones offer a solution to the problem of fixed buy and sell zones for any oscillator-driven system.
An indicator’s extreme levels can be quantified using statistical methods. These extreme levels are calculated for a certain period and serve as the buy and sell zones for a trading system. The repetition of this statistical process for every value of the indicator creates values that become the dynamic zones. The zones are calculated in such a way that the probability of the indicator value rising above, or falling below, the dynamic zones is equal to a given probability input set by the trader.
To better understand dynamic zones, let's first describe them mathematically and then explain their use. The dynamic zones definition:
Find V such that:
For dynamic zone buy: P{X <= V}=P1
For dynamic zone sell: P{X >= V}=P2
where P1 and P2 are the probabilities set by the trader, X is the value of the indicator for the selected period and V represents the value of the dynamic zone.
The probability input P1 and P2 can be adjusted by the trader to encompass as much or as little data as the trader would like. The smaller the probability, the fewer data values above and below the dynamic zones. This translates into a wider range between the buy and sell zones. If a 10% probability is used for P1 and P2, only those data values that make up the top 10% and bottom 10% for an indicator are used in the construction of the zones. Of the values, 80% will fall between the two extreme levels. Because dynamic zone levels are penetrated so infrequently, when this happens, traders know that the market has truly moved into overbought or oversold territory.
Calculating the Dynamic Zones
The algorithm for the dynamic zones is a series of steps. First, decide the value of the lookback period t. Next, decide the value of the probability Pbuy for buy zone and value of the probability Psell for the sell zone.
For i=1, to the last lookback period, build the distribution f(x) of the price during the lookback period i. Then find the value Vi1 such that the probability of the price less than or equal to Vi1 during the lookback period i is equal to Pbuy. Find the value Vi2 such that the probability of the price greater or equal to Vi2 during the lookback period i is equal to Psell. The sequence of Vi1 for all periods gives the buy zone. The sequence of Vi2 for all periods gives the sell zone.
In the algorithm description, we have: Build the distribution f(x) of the price during the lookback period i. The distribution here is empirical namely, how many times a given value of x appeared during the lookback period. The problem is to find such x that the probability of a price being greater or equal to x will be equal to a probability selected by the user. Probability is the area under the distribution curve. The task is to find such value of x that the area under the distribution curve to the right of x will be equal to the probability selected by the user. That x is the dynamic zone.
Included:
Bar coloring
Signals
Alerts
Loxx's Expanded Source Types

AI ALGO [Ganesh]Core Strategy Components\
1. EMA (Exponential Moving Average) SystemThe strategy uses three EMAs to identify trend direction:
EMA 48 (longer-term trend)
EMA 2 (short-term momentum)
EMA 21 (medium-term trend)
How it works:
Bullish trend: When price is above EMA 21 (green cloud)
Bearish trend: When price is below EMA 21 (red cloud)
EMA Cloud: The area between EMA 2 and EMA 48/21 provides visual trend confirmation
Optional higher timeframe (HTF) analysis for multi-timeframe confirmation
2. DEMA ATR (Double EMA + Average True Range)
This is a dynamic support/resistance indicator that adapts to volatility:Components:
DEMA (Double Exponential Moving Average): Smooths price action with less lag
ATR Bands: Creates upper and lower bands based on volatility (ATR × 1.7 factor)
Signal Generation:
Green line: Uptrend (DEMA ATR rising)
Red line: Downtrend (DEMA ATR falling)
Acts as a trailing stop-loss level that adjusts with market volatility
3. Smart Trail System (Fibonacci-Based)
An advanced trailing stop system using modified true range calculations:Key Features:
Calculates true range using Wilder's smoothing method
Creates Fibonacci retracement levels (61.8%, 78.6%, 88.6%) from the trail line
Adaptive stop-loss: Adjusts based on ATR factor (4.2) and smoothing (4)
Trend Detection:
Bullish: Price > Trailing line (blue zones)
Bearish: Price < Trailing line (red zones)
The Fibonacci zones show potential support/resistance areas
4. ZigZag Indicator Identifies significant swing highs and lows:
Length parameter: 13 (sensitivity control)
Labels: Higher Highs (HH), Lower Lows (LL), etc.
Helps identify trend reversals and key pivot points
5. Support & Resistance Levels
Strength-based S/R: Identifies horizontal support/resistance zones
Zone width: Adjustable percentage-based zones
High/Low zones: Marks significant price levels
Trading LogicEntry Conditions (Implied)The strategy likely enters trades when:Long Entry:
Price crosses above DEMA ATR (green)
Price is above EMA 21 (bullish EMA cloud)
Smart Trail confirms uptrend
Price bounces from Fibonacci support levels
Short Entry:
Price crosses below DEMA ATR (red)
Price is below EMA 21 (bearish EMA cloud)
Smart Trail confirms downtrend
Price rejects from Fibonacci resistance levels
Exit/Stop-Loss Strategy
Trailing stops: Using Smart Trail Fibonacci levels
Dynamic stops: DEMA ATR line acts as a moving stop-loss
Risk management: Position sizing at 50% of equity per trade
Dashboard Features1. Weekly Performance Table
Tracks trades per day of the week
Shows win/loss statistics
Calculates win rate percentage
2. Monthly Performance Table
Monthly P&L breakdown
Yearly performance summary
Color-coded returns (green = profit, red = loss)
Strategy Parameters
Initial Capital: $5,000
Commission: 0.02% per trade
Position Size: 50% of equity
Pyramiding: Disabled (no adding to positions)
Calculation: On bar close (not tick-by-tick)
Visual Elements
EMA clouds: Green (bullish) / Red (bearish)
DEMA ATR line: Dynamic support/resistance
Smart Trail zones: Fibonacci-based colored bands
ZigZag lines: Swing high/low connections
S/R zones: Horizontal support/resistance areas
Strategy Philosophy
This is a trend-following strategy with dynamic risk management that:
Uses multiple timeframes for confirmation
Adapts to volatility through ATR-based indicators
Provides clear visual cues for trend direction
Includes comprehensive performance tracking
Combines momentum (EMAs) with volatility (ATR) for robust signals
The strategy works best in trending markets and uses the Fibonacci trail system to maximize profits while protecting against reversals with adaptive stop-losses.

Hash Momentum Strategy# Hash Momentum Strategy
## 📊 Overview
The **Hash Momentum Strategy** is a professional-grade momentum trading system designed to capture strong directional price movements with precision timing and intelligent risk management. Unlike traditional EMA crossover strategies, this system uses momentum acceleration as its primary signal, resulting in earlier entries and better risk-to-reward ratios.
---
## ⚡ What Makes This Strategy Unique
### 1. Momentum-Based Entry System
Most strategies rely on lagging indicators like moving average crossovers. This strategy captures momentum *acceleration* - entering when price movement is gaining strength, not after the move has already happened.
### 2. Programmable Risk-to-Reward
Set your exact R:R ratio (1:2, 1:2.5, 1:3, etc.) and the strategy automatically calculates stop loss and take profit levels. No more guessing or manual calculations.
### 3. Smart Partial Profit Taking
Lock in profits at multiple stages:
- **First TP**: Take 50% off at 2R
- **Second TP**: Take 40% off at 2.5R
- **Final TP**: Let 10% ride to maximum target
This approach locks in gains while letting winners run.
### 4. Dynamic Momentum Threshold
Uses ATR (Average True Range) multiplied by your threshold setting to adapt to market volatility. Volatile markets = higher threshold. Quiet markets = lower threshold.
### 5. Trade Cooldown System
Prevents overtrading and revenge trading by enforcing a cooldown period between trades. Configurable from 1-24 bars.
### 6. Optional Session & Weekend Filters
Filter trades by Tokyo, London, and New York sessions. Optional weekend-off toggle to avoid low-liquidity periods.
---
## 🎯 How It Works
### Signal Generation
**STEP 1: Calculate Momentum**
- Momentum = Current Price - Price
- Check if Momentum > ATR × Threshold Multiplier
- Momentum must be accelerating (positive change in momentum)
**STEP 2: Confirm with EMA Trend Filter**
- Long: Price must be above EMA
- Short: Price must be below EMA
**STEP 3: Check Filters**
- Not in cooldown period
- Valid session (if enabled)
- Not weekend (if enabled)
**STEP 4: ENTRY SIGNAL TRIGGERED**
### Risk Management Example
**Example Long Trade:**
- Entry: $100
- Stop Loss: $97.80 (2.2% risk)
- Risk Amount: $2.20
**Take Profit Levels:**
- TP1: $104.40 (2R = $4.40) → Close 50%
- TP2: $105.50 (2.5R = $5.50) → Close 40%
- Final: $105.50 (2.5R) → Close remaining 10%
---
## ⚙️ Settings Guide
### Core Strategy
**Momentum Length** (Default: 13)
Number of bars for momentum calculation. Higher = stronger but fewer signals.
**Momentum Threshold** (Default: 2.25)
ATR multiplier. Higher = only trade biggest moves.
**Use EMA Trend Filter** (Default: ON)
Only long above EMA, short below EMA.
**EMA Length** (Default: 28)
Period for trend-confirming EMA.
### Filters
**Use Trading Session Filter** (Default: OFF)
Restrict trading to specific sessions.
**Tokyo Session** (Default: OFF)
Trade during Asian hours (00:00-09:00 JST).
**London Session** (Default: OFF)
Trade during European hours (08:00-17:00 GMT).
**New York Session** (Default: OFF)
Trade during US hours (08:00-17:00 EST).
**Weekend Off** (Default: OFF)
Disable trading on Saturdays and Sundays.
### Risk Management
**Stop Loss %** (Default: 2.2)
Fixed percentage stop loss from entry.
**Risk:Reward Ratio** (Default: 2.5)
Your target reward as multiple of risk.
**Use Partial Profit Taking** (Default: ON)
Take profits in stages.
**First TP R:R** (Default: 2.0)
First target as multiple of risk.
**First TP Size %** (Default: 50)
Percentage of position to close at TP1.
**Second TP R:R** (Default: 2.5)
Second target as multiple of risk.
**Second TP Size %** (Default: 40)
Percentage of position to close at TP2.
### Trade Management
**Use Trade Cooldown** (Default: ON)
Prevent overtrading.
**Cooldown Bars** (Default: 6)
Bars to wait after closing a trade.
---
## 🎨 Visual Elements
### Chart Indicators
🟢 **Green Dot** (below bar) = Long entry signal
🔴 **Red Dot** (above bar) = Short entry signal
🔵 **Blue X** (above bar) = Long position closed
🟠 **Orange X** (below bar) = Short position closed
**EMA Line** = Trend direction (green when bullish, red when bearish)
**White Line** = Entry price
**Red Line** = Stop loss level
**Green Lines** = Take profit levels (TP1, TP2, Final)
### Dashboard
When not in real-time mode, a dashboard displays:
- Current position (LONG/SHORT/FLAT)
- Entry price
- Stop loss price
- Take profit price
- R:R ratio
- Current momentum strength
- Total trades
- Win rate
- Net profit %
---
## 📈 Recommended Settings by Timeframe
### 1-Hour Timeframe (Default)
- Momentum Length: 13
- Momentum Threshold: 2.25
- EMA Length: 28
- Stop Loss: 2.2%
- R:R Ratio: 2.5
- Cooldown: 6 bars
### 4-Hour Timeframe
- Momentum Length: 24-36
- Momentum Threshold: 2.5
- EMA Length: 50
- Stop Loss: 3-4%
- R:R Ratio: 2.0-2.5
- Cooldown: 6-8 bars
### 15-Minute Timeframe
- Momentum Length: 8-10
- Momentum Threshold: 2.0
- EMA Length: 20
- Stop Loss: 1.5-2%
- R:R Ratio: 2.0
- Cooldown: 4-6 bars
---
## 🔧 Optimization Tips
### Want More Trades?
- Decrease Momentum Threshold (2.0 instead of 2.25)
- Decrease Momentum Length (10 instead of 13)
- Decrease Cooldown Bars (4 instead of 6)
### Want Higher Quality Trades?
- Increase Momentum Threshold (2.5-3.0)
- Increase Momentum Length (18-24)
- Increase Cooldown Bars (8-10)
### Want Lower Drawdown?
- Increase Cooldown Bars
- Use tighter stop loss
- Enable session filters (trade only high-liquidity sessions)
- Enable Weekend Off
### Want Higher Win Rate?
- Increase R:R Ratio (may reduce total profit)
- Increase Momentum Threshold (fewer but stronger signals)
- Use longer EMA for trend confirmation
---
## 📊 Performance Expectations
Based on typical backtesting results:
- **Win Rate**: 35-45%
- **Profit Factor**: 1.5-2.0
- **Risk:Reward**: 1:2.5 (configurable)
- **Max Drawdown**: 10-20%
- **Trades/Month**: 8-15 (1H timeframe)
**Note:** Win rate may appear low, but with 2.5:1 R:R, you only need ~29% win rate to break even. The strategy aims for quality over quantity.
---
## 🎓 Strategy Logic Explained
### Why Momentum > EMA Crossover?
**EMA Crossover Problems:**
- Signals lag behind price
- Late entries = poor R:R
- Many false signals in ranging markets
**Momentum Advantages:**
- Catches moves as they start accelerating
- Earlier entries = better R:R
- Adapts to volatility via ATR
### Why Partial Profit Taking?
**Without Partial TPs:**
- All-or-nothing approach
- Winners often turn to losers
- High stress watching open positions
**With Partial TPs:**
- Lock in 50% at first target
- Reduce risk to breakeven
- Let remainder ride for bigger gains
- Lower psychological pressure
### Why Trade Cooldown?
**Without Cooldown:**
- Revenge trading after losses
- Overtrading in choppy markets
- Emotional decision-making
**With Cooldown:**
- Forces discipline
- Waits for new setup to develop
- Reduces transaction costs
- Better signal quality
---
## ⚠️ Important Notes
1. **This is a momentum strategy, not an EMA strategy**
The EMA only confirms trend direction. Momentum generates the actual signals.
2. **Backtest thoroughly before live trading**
Past performance ≠ future results. Test on your specific asset and timeframe.
3. **Use proper position sizing**
Risk 1-2% of account per trade maximum. The strategy uses 100% equity by default (adjust in Properties).
4. **Dashboard auto-hides in real-time**
Clean chart for live trading. Visible during backtesting.
5. **Customize for your trading style**
All settings are fully adjustable. No single "best" configuration.
---
## 🚀 Quick Start Guide
1. **Add to Chart**: Apply to your preferred asset and timeframe
2. **Keep Defaults**: Start with default settings
3. **Backtest**: Review historical performance
4. **Paper Trade**: Test with simulated money first
5. **Go Live**: Start small and scale up
---
## 💡 Pro Tips
**Tip 1: Combine Timeframes**
Use higher timeframe (4H) for trend direction, lower timeframe (1H) for entries.
**Tip 2: Avoid News Events**
Major news can cause whipsaws. Consider manual intervention during high-impact events.
**Tip 3: Monitor Momentum Strength**
Dashboard shows momentum in sigma (σ). Values >1.0σ indicate very strong momentum.
**Tip 4: Adjust for Volatility**
In high-volatility markets, increase threshold and stop loss. In quiet markets, decrease them.
**Tip 5: Review Losing Trades**
Check if losses are hitting stop loss or reversing. Adjust stop accordingly.
---
## 📝 Changelog
**v1.0** - Initial Release
- Momentum-based signal generation
- EMA trend filter
- Programmable R:R ratio
- Partial profit taking (3 stages)
- Trade cooldown system
- Session filters (Tokyo/London/New York)
- Weekend off toggle
- Smart dashboard (auto-hides in real-time)
- Clean visual design
---
## 🙏 Credits
Developed by **Hash Capital Research**
If you find this strategy useful, please give it a like and share with others!
---
## ⚖️ Disclaimer
This strategy is for educational purposes only. Trading involves substantial risk of loss and is not suitable for all investors. Past performance is not indicative of future results. Always do your own research and consult with a qualified financial advisor before trading.
---
## 📬 Feedback
Have suggestions or found a bug? Leave a comment below! I'm continuously improving this strategy based on community feedback.
---
**Happy Trading! 🚀📈**

Breadth-Driven Swing StrategyWhat it does
This script trades the S&P 500 purely on market breadth extremes:
• Data source : INDEX:S5TH = % of S&P 500 stocks above their own 200-day SMA (range 0–100).
• Buy when breadth is washed-out.
• Sell when breadth is overheated.
It is long-only by design; shorting and ATR trailing stops have been removed to keep the logic minimal and transparent.
⸻
Signals in plain English
1. Long entry
A. A 200-EMA trough in breadth is printed and the trough value is ≤ 40 %.
or
B. A 5-EMA trough appears, its prominence passes the user threshold, and the lowest breadth reading in the last 20 bars is ≤ 20 %.
(Toggle this secondary trigger on/off with “ Enter also on 5-EMA trough ”.)
2. Exit (close long)
First 200-EMA peak whose breadth value is ≥ 70 %.
3. Risk control
A fixed stop-loss (% of entry price, default 8 %) is attached to every long trade.
⸻
Key parameters (defaults shown)
• Long EMA length 200 • Short EMA length 5
• Peak prominence 0.5 pct-pts • Trough prominence 3 pct-pts
• Peak level 70 % • Trough level 40 % • 5-EMA trough level 20 %
• Fixed stop-loss 8 %
• “Enter also on 5-EMA trough” = true (allows additional entries on extreme momentum reversals)
Feel free to tighten or relax any of these thresholds to match your risk profile or account for different market regimes.
⸻
How to use it
1. Load the script on a daily SPX / SPY chart.
(The price chart drives order execution; the breadth series is pulled internally and does not need to be on the chart.)
2. Verify the breadth feed.
INDEX:S5TH is updated after each session; your broker must provide it.
3. Back-test across several cycles.
Two decades of daily data is recommended to see how the rules behave in bear markets, range markets, and bull trends.
4. Adjust position sizing in the Properties tab.
The default is “100 % of equity”; change it if you prefer smaller allocations or pyramiding caps.
⸻
Why it can help
• Breadth signals often lead price, allowing entries before index-level momentum turns.
• Simple, rule-based exits prevent “waiting for confirmation” paralysis.
• Only one input series—easy to audit, no black-box math.
Trade-offs
• Relies on a single breadth metric; other internals (advance/decline, equal-weight returns, etc.) are ignored.
• May sit in cash during shallow pullbacks that never push breadth ≤ 40 %.
• Signals arrive at the end of the session (breadth is EoD data).
⸻
Disclaimer
This script is provided for educational purposes only and is not financial advice. Markets are risky; test thoroughly and use your own judgment before trading real money.
ストラテジー概要
本スクリプトは S&P500 のマーケットブレッド(内部需給) だけを手がかりに、指数をスイングトレードします。
• ブレッドデータ : INDEX:S5TH
(S&P500 採用銘柄のうち、それぞれの 200 日移動平均線を上回っている銘柄比率。0–100 %)
• 買い : ブレッドが極端に売られたタイミング。
• 売り : ブレッドが過熱状態に達したタイミング。
余計な機能を削り、ロングオンリー & 固定ストップ のシンプル設計にしています。
⸻
シグナルの流れ
1. ロングエントリー
• 条件 A : 200-EMA がトラフを付け、その値が 40 % 以下
• 条件 B : 5-EMA がトラフを付け、
・プロミネンス条件を満たし
・直近 20 本のブレッドス最小値が 20 % 以下
• B 条件は「5-EMA トラフでもエントリー」を ON にすると有効
2. ロング決済
最初に出現した 200-EMA ピーク で、かつ値が 70 % 以上 のバーで手仕舞い。
3. リスク管理
各トレードに 固定ストップ(初期価格から 8 %)を設定。
⸻
主なパラメータ(デフォルト値)
• 長期 EMA 長さ : 200 • 短期 EMA 長さ : 5
• ピーク判定プロミネンス : 0.5 %pt • トラフ判定プロミネンス : 3 %pt
• ピーク水準 : 70 % • トラフ水準 : 40 % • 5-EMA トラフ水準 : 20 %
• 固定ストップ : 8 %
• 「5-EMA トラフでもエントリー」 : ON
相場環境やリスク許容度に合わせて閾値を調整してください。
⸻
使い方
1. 日足の SPX / SPY チャート にスクリプトを適用。
2. ブレッドデータの供給 (INDEX:S5TH) がブローカーで利用可能か確認。
3. 20 年以上の期間でバックテスト し、強気相場・弱気相場・レンジ局面での挙動を確認。
4. 資金配分 は プロパティ → 戦略実行 で調整可能(初期値は「資金の 100 %」)。
⸻
強み
• ブレッドは 価格より先行 することが多く、天底を早期に捉えやすい。
• ルールベースの出口で「もう少し待とう」と迷わずに済む。
• 入力 series は 1 本のみ、ブラックボックス要素なし。
注意点・弱み
• 単一指標に依存。他の内部需給(A/D ライン等)は考慮しない。
• 40 % を割らない浅い押し目では機会損失が起こる。
• ブレッドは終値ベースの更新。ザラ場中の変化は捉えられない。
⸻
免責事項
本スクリプトは 学習目的 で提供しています。投資助言ではありません。
実取引の前に必ず自己責任で十分な検証とリスク管理を行ってください。
