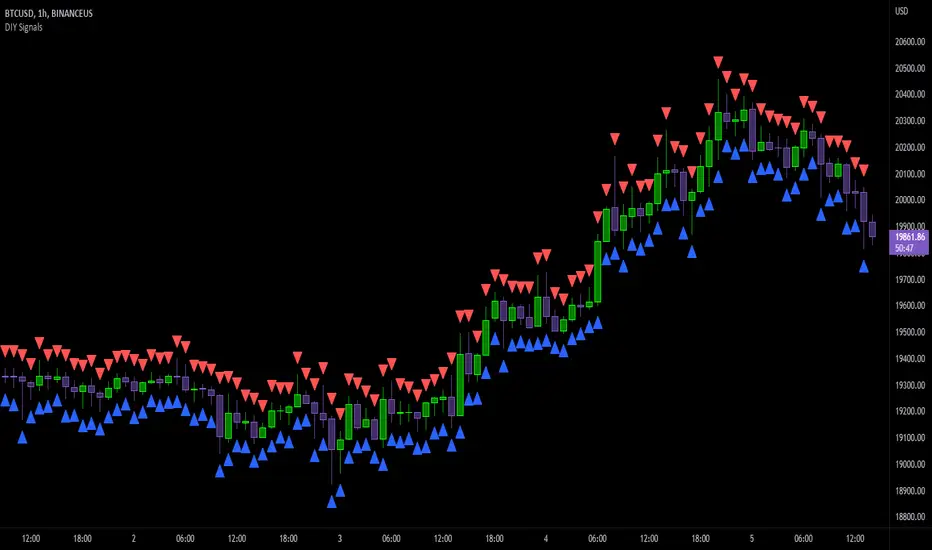
DIY Entry SignalsThis indicator allows you to set up entry signals based on your own conditions.
Note that this indicator DOES NOT give any information about exits. It is not intended to be a signal indicator that someone could blindly follow. It is intended for use in backtesting to help spot entry points more easily.
Also note that this indicator DOES NOT plot anything other than moving averages and entry signals. The other indicators referenced will need to be added on their own to be visible on the chart.
Credit to The_Caretaker for both BBWP and PMARP indicators. For more information on how those work, see their descriptions. Big thanks to him for making them open source, as well.
Instructions for use:
Signal Types:
This section allows you to choose whether you want long, short, or both types of signals.
Moving Averages:
Configure up to 4 moving averages to be plotted on the chart. Options include show/hide, color, length, and type.
RSI:
Choose the period and source used for the Relative Strength Index indicator, a very commonly used momentum oscillator.
Stochastic:
Choose the K, D, smoothing, and source for the Stochastic indicator, a very commonly used momentum oscillator.
BBWP:
Choose settings for the Bollinger Band Width Percentile indicator. This measures volatility based on Bollinger Bands and was created by The_Caretaker. The indicator is free and open source, so definitely check it out.
This section allows the user to choose the price source, basis type ( SMA , EMA , or VWMA ), length, and lookback. It also includes a threshold setting to determine the BBWP requirement used for entry signals.
PMARP:
Choose settings for the Price Moving Average Ratio & Percentile. This calculates the ratio between a source price and moving average over a lookback period. This was also created by The_Caretaker, and it is a free and open source indicator.
This section allows the user to choose price source, lookback, PMAR length, and moving average type.
DMI/ADX:
Choose settings for the Directional Movement Index and the Average Directional Index. This shows which direction the price is moving by comparing prior highs and lows and calculating a positive directional movement and a negative directional movement. The average of the positive and negative movements is used to plot the ADX line.
Long/Short Conditions:
Choose which indicators will be used to determine entry signals, as well as some options for each indicator that is included.
Note: A signal will only be plotted if ALL selected conditions are met.
Options in these sections include:
Faster moving averages above or below slower moving averages (implying a trend direction)
RSI thresholds (separate for long and short)
Stochastic thresholds (separate for long and short)
Whether K should be above or below D (implying trend direction of the Stochastic indicator)
Whether a signal should only be generated on the bar when the Stochastic first crosses the threshold.
BBWP on/off (The threshold for this is determined in the BBWP section of the settings)
PMARP thresholds (separate for long and short)
ابحث في النصوص البرمجية عن "entry"
Bogdan Ciocoiu - Sniper EntryWhat is Sniper Entry
Sniper Entry is a set indicator that encapsulates a collection of pre-configured scripts using specific variables that enable users to extract signals by interpreting market behaviour quickly, suitable for 1-3min scalping. This instrument is a tool that acts as a confluence for traders to make decisions concerning current market conditions. This indicator does not apply solely to an asset.
What Sniper Entry is not
Sniper Entry is not interpreting fundamental analysis and will also not be providing out of box market signals. Instead, it will provide a collection of integrated and significantly improved open-source subscripts designed to help traders speculate on market trends. Traders must apply their strategies and configure Sniper Entry accordingly to maximise the script's output.
Originality and usefulness
The collection of subscripts encapsulated in this tool makes it unique in the Trading View ecosystem. This indicator enables traders to consider entry positions or exit positions by comparing similar algorithms at once.
Its usefulness also emerges from the unique configurations embedded in the indicator's settings, which are different from those of the original scripts.
This indicator's originality is also reflected in how its modules are integrated, including the integration of the settings.
Open-source reuse
I used the following open-source resources, which I simplified significantly and pre-configured for short term scalping. The source codes for the below are already in the public domain, including the following links listed below.
www.tradingview.com (open source)
(open source and generic algorithm)
www.tradingview.com (open source)
(open source)
(open source)
www.tradingview.com (generic MA algorithm and open source)
(generic VWAP algorithm and open source)

CCT Entry BarThis indicator is meant to help traders confirm their entries.
What it does.
This indicator includes the Ichikomu cloud for trend direction.
Buy and Sell Entry Bars then confirms the current trend and advises the trader when to enter.
Support, Resistance and Pivot Lines are also available to help find key areas on the chart.
User can adjust the time frame of these pivots.
How it does it.
Entry Bars are calculated based on different market situations, candle formations and market volatility.
These entry bars also indicate market strength and weakness.
An Entry Bar confirms entry when the candle closes.
How to use it
Entry Bars are use for entering a trade based on the trend of the market. Green Entry Bars for bullish and Red Entry Bars for bearish.
We use these Entry Bars with the CCT Trend Meter for extra confirmation.
CCT Entry bar works on all time frames and assets.
This indicator does not repaint.
Alert Functions are also available when an Entry Bar appears.
To access this indicator use the link below.

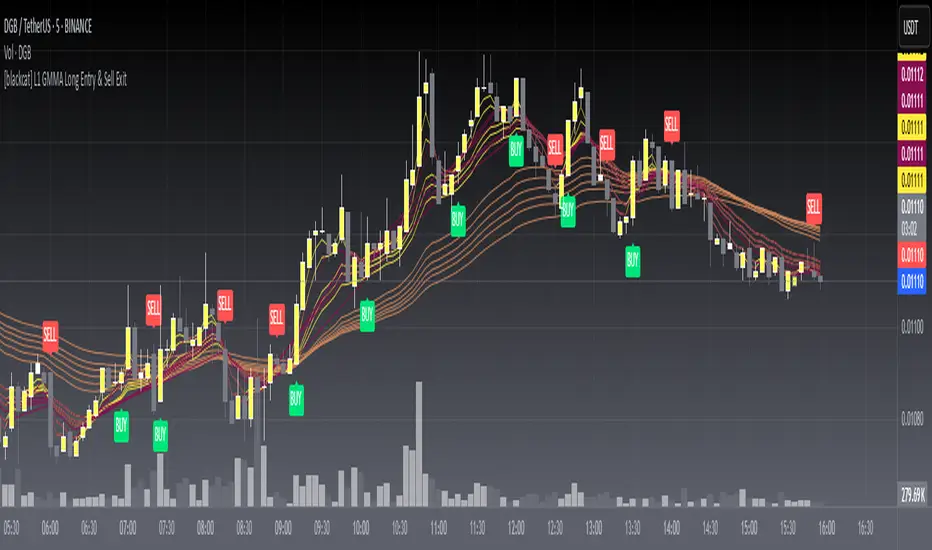
[blackcat] L1 GMMA Long EntryLevel: 1
Background
The Guppy Multiple Moving Average (GMMA) is a technical indicator that identifies changing trends, breakouts, and trading opportunities in the price of an asset by combining two sets of moving averages (MA) with different time periods. There is a short term group of MAs and a long term group of MAs.
Function
L1 GMMA Long Entry classify short-mid term GMMA cluster and long term GMMA cluster with key Fibnocci numbers. Long entry signal is generated with GMMA cluster relationship.
Key Signal
Long entry 1~6 ---> Long entry signal generated with GMMA cluster relationship.
Pros and Cons
Pros:
1. easy observe price trend
2. it covers short, middle and long term trend analysis
Cons:
1. Only long entry signal is disclosed here
2. No complex trading strategy is used yet
Remarks
NA
Readme
In real life, I am a prolific inventor. I have successfully applied for more than 60 international and regional patents in the past 12 years. But in the past two years or so, I have tried to transfer my creativity to the development of trading strategies. Tradingview is the ideal platform for me. I am selecting and contributing some of the hundreds of scripts to publish in Tradingview community. Welcome everyone to interact with me to discuss these interesting pine scripts.
The scripts posted are categorized into 5 levels according to my efforts or manhours put into these works.
Level 1 : interesting script snippets or distinctive improvement from classic indicators or strategy. Level 1 scripts can usually appear in more complex indicators as a function module or element.
Level 2 : composite indicator/strategy. By selecting or combining several independent or dependent functions or sub indicators in proper way, the composite script exhibits a resonance phenomenon which can filter out noise or fake trading signal to enhance trading confidence level.
Level 3 : comprehensive indicator/strategy. They are simple trading systems based on my strategies. They are commonly containing several or all of entry signal, close signal, stop loss, take profit, re-entry, risk management, and position sizing techniques. Even some interesting fundamental and mass psychological aspects are incorporated.
Level 4 : script snippets or functions that do not disclose source code. Interesting element that can reveal market laws and work as raw material for indicators and strategies. If you find Level 1~2 scripts are helpful, Level 4 is a private version that took me far more efforts to develop.
Level 5 : indicator/strategy that do not disclose source code. private version of Level 3 script with my accumulated script processing skills or a large number of custom functions. I had a private function library built in past two years. Level 5 scripts use many of them to achieve private trading strategy.
[blackcat] L1 Banker Entry IndicatorLevel: 1
Background
@testtttt1111 inquired me how to model banker entry
Function
L1 Banker Entry Indicator demostrates a simple model of banker entry for long or short
Key Signal
bankerthreshold ---> customized input for threshold value for banker move identification
pumpdumpsoon ---> alerts for pump or dump start soon in green color
longshortentry ---> alerts for long or short entry in orange color
bankermove ---> alerts for banker move in yellow color
Pros and Cons
Pros:
1. indicating banker move and entries
2. simple classification of banker move alerts
Cons:
1. no direction can be identified
2. no volume information is utilized for big fund move
Remarks
A demo for banker entry inquired by @testtttt1111
Readme
In real life, I am a prolific inventor. I have successfully applied for more than 60 international and regional patents in the past 12 years. But in the past two years or so, I have tried to transfer my creativity to the development of trading strategies. Tradingview is the ideal platform for me. I am selecting and contributing some of the hundreds of scripts to publish in Tradingview community. Welcome everyone to interact with me to discuss these interesting pine scripts.
The scripts posted are categorized into 5 levels according to my efforts or manhours put into these works.
Level 1 : interesting script snippets or distinctive improvement from classic indicators or strategy. Level 1 scripts can usually appear in more complex indicators as a function module or element.
Level 2 : composite indicator/strategy. By selecting or combining several independent or dependent functions or sub indicators in proper way, the composite script exhibits a resonance phenomenon which can filter out noise or fake trading signal to enhance trading confidence level.
Level 3 : comprehensive indicator/strategy. They are simple trading systems based on my strategies. They are commonly containing several or all of entry signal, close signal, stop loss, take profit, re-entry, risk management, and position sizing techniques. Even some interesting fundamental and mass psychological aspects are incorporated.
Level 4 : script snippets or functions that do not disclose source code. Interesting element that can reveal market laws and work as raw material for indicators and strategies. If you find Level 1~2 scripts are helpful, Level 4 is a private version that took me far more efforts to develop.
Level 5 : indicator/strategy that do not disclose source code. private version of Level 3 script with my accumulated script processing skills or a large number of custom functions. I had a private function library built in past two years. Level 5 scripts use many of them to achieve private trading strategy.

L1 Moving Average Fingerprint for Long EntryLevel: 1
Background
This script combines moving average processing with highest high and lowest low to disclose the "fingerprint" of a specific trading pair to describe its unique behavior.
Function
Moving Average Fingerprint for Long Entry is a Level 1 pine script. It utilize several moving average of inherent highest high and lowest low and combine them with customized fingerprint coefficients to depict the unique behavior of a specific trading pair across multiple markets for long entry point identification.
Key Signal
FingerPrint1~6 are basic-level fingerprints with moving average of highest high and lowest low.
FingerPrint7~8 are composite fingerprint definitions with coefficients/weights,where coefficients/weights need to be tuned to discover the inherent "fingerprint" of a specific trading pair.
FingerPrint10~12 are composite fingerprint calculation for long entry alerts
ReadytoLong is a long entry filter where long entry point may happen within it. By using crossover() function to a customized threshold value, you can define accurate long entries.
Pros and Cons
Pros:
1. Combine moving average and extreme points to disclose a trading pair behavior.
2. Smart to tune specific set of parameters to obtain unique fingerprints of trading pairs.
3. Smart position sizing scheme by adjusting the threshold values.
Cons:
1. Require tune input parameters for each trading pair in a specific period and time frame.
2. Only long entry was studied, no short entry and re-entry are available yet to form as a trading system.
3. "ReadytoLong" is an inaccurate range where multiple long entries may happen at improper points in chop market.
4. Complex input parameters to obtain a unique fingerprint set.
Remarks
Although I wrote pine script for more than two years, this is the first script published in the community. I will publish more with my works in this platform.
Hope the community can improve this concept and make it as a trading system.
Readme
In real life, I am a prolific inventor. I have successfully applied for more than 60 international and regional patents in the past 12 years. But in the past two years or so, I have tried to transfer my creativity to the development of trading strategies. Tradingview is the ideal platform for me. I am selecting and contributing some of the hundreds of scripts to publish in Tradingview community. Welcome everyone to interact with me to discuss these interesting pine scripts.
The scripts posted are categorized into 5 levels according to my efforts or manhours put into these works.
Level 1 : interesting script snippets or distinctive improvement from classic indicators or strategy. Level 1 scripts can usually appear in more complex indicators as a function module or element.
Level 2 : composite indicator/strategy. By selecting or combining several independent or dependent functions or sub indicators in proper way, the composite script exhibits a resonance phenomenon which can filter out noise or fake trading signal to enhance trading confidence level.
Level 3 : comprehensive indicator/strategy. They are simple trading systems based on my strategies. They are commonly containing several or all of entry signal, close signal, stop loss, take profit, re-entry, risk management, and position sizing techniques. Even some interesting fundamental and mass psychological aspects are incorporated.
Level 4 : script snippets or functions that do not disclose source code. Interesting element that can reveal market laws and work as raw material for indicators and strategies. If you find Level 1~2 scripts are helpful, Level 4 is a private version that took me far more efforts to develop.
Level 5 : indicator/strategy that do not disclose source code. private version of Level 3 script with my accumulated script processing skills or a large number of custom functions. I had a private function library built in past two years. Level 5 scripts use many of them to achieve private trading strategy.

NCTA Adaptive Entry SystemAdaptive Entry System (AES)
Price action of stocks, indexes, and futures consists of periods of trending action, retracements within the trend and then a resumption of the original trend. Trending patterns do not move straight up or straight down. They move in cycles which, when properly identified, can offer traders an opportunity to “follow the trend” while also recognizing the probability of a near term retracement before resuming movement in the direction of the trend. Experienced traders with advanced skills at interpreting wave patterns (Elliott Wave), Fibonacci retracements, Stochastics (overbought / oversold conditions), Momentum, and Moving Averages apply their advanced knowledge to trading and identifying these trend - retracement - continuation of trend cycles. These skills require an advanced knowledge of these complex indicators and can be difficult for traders without the same skill set to optimize their trading performance.
The Adaptive Entry System (AES) was created as a technical market metrics system to interpret a variety of advanced signals and present to the trader a “single actionable signal” displayed in an easy to recognize format for traders of most any skill level to benefit from.
AES is a “system” as opposed to a single indicator. It was designed with the goal of simplifying a traders ability to recognize an entry opportunity by summarizing the consensus of several key indicators and displaying a single entry / exit signal in a color highlighted, strategy labeled format. The work of comparing a variety of indicators and assessing the strength of alignment is performed for the trader by the Adaptive Entry System.
There are three possible entry signals displayed. A trader may trade all three or customize the settings to choose just a single signal to trade. It is important for any trader incorporating AES into their toolset that they trade in sim / virtual mode for a period of time to confirm they understand how price action responds to the signals and to personally track the performance of each. A good trading system still requires due diligence on the part of the trader to confirm understanding of how the system performs.
Entry Signal #1 Description:
Trend Bias Plus Signal is intended to provide traders with an early view of the probable directional bias of the stock, index, or futures being traded. Trend Bias was designed to recognize the probability of the early stages of the strongest segment of a wave pattern. Recognizing the probable bias of the trend at an early stage and also having an indication of when that trend may be ending offers traders an opportunity to enhance their ability to optimally benefit from the trend.
How to Read the Trend Bias Plus Signal:
The Trend Bias Plus Signal is displayed as a simple to recognize color coding of the price bars. Blue price bars indicate a probable rising price bias. Red price bars indicate a probable declining price bias. White bars indicate a neutral period with no clear directional bias.
How to Trade the Trend Bias Plus Signal:
The Trend Bias Plus Signal is simple to interpret. When a price bar closes blue and the next price bar opens blue, this signals to the trader to open an upward bias position. Buy-to-open a call option, buy the stock, or open a long futures position. When a price bar closes red and the next price bar opens red, this signals to the trader to open a downward bias position. Buy-to-open a put option, short the stock or close a long stock position, or open a short futures position.
When holding a short or long position based on the Trend Bias Plus, there are a variety of exit methods which a trader can use including stops, limit price orders with fixed profit targets, or trail stops. Regardless, the end of a Trend Bias Plus cycle is indicated when a new price bar opens white. This is evidence that the current rising or declining trend is shifting to a neutral state. A trend may also be viewed as having ended when an opposite color bar prints at the open of a new price bar.
Entry Signal #2 Description:
The Momentum Signal is a near term indication of a probable retracement of the current trend. It identifies a temporary reversal of an overarching trend in a stock's price. Retracements are short-term periods of movement against a trend, followed by a return to the previous trend. Momentum signals are usually counter-trend trades identifying that part of the wave sequence where price temporarily moves opposite the direction of the trend. The momentum signal can be an opportunity for traders to take advantage of the natural pattern of trend - retracements - continuation.
How to Read the Momentum Signal:
The Momentum signal is displayed as a vertical color highlight on the price bar with a “M” label inside a directional indicator box. A red vertical highlight with an arrow box and “M” label pointing lower is a signal that the near term price movement may be downward bias. For an upward bias price movement signal, the Momentum indicator will display a green highlight across the price bar with an arrow box and “M” label pointing higher.
How to Trade the Momentum Signal:
When the highlighted directional labeled box prints at the open of a new price bar, take the trade based on the directional bias displayed. Momentum signals are generally counter trend indicators so a downward bias red bar, prompting the trader to go short may print on a long bias blue Trend Bias Plus price bar. This should not be viewed as a conflict but instead as a probable indication of a short term retracement following the natural sequence of cycles in price movement.
Momentum signals may be traded using stocks, options, or futures.
Entry Signal #3 Description:
The Consensus Signal is an indication that price action may be resuming in the direction of the primary trend.
How to Read the Consensus Signal:
The Consensus Signal is displayed as a vertical color highlight on the price bar with a “C” label inside a directional indicator box. A red vertical highlight and an arrow box with a “C” label pointing lower is a signal that the price movement may be resuming a downward bias trend or strengthening a conviction to the current trend. For an upward bias price movement signal, the Consensus indicator will display a green highlight across the price bar and an arrow box with a “C” label pointing higher. This is a signal that the retracement off of the trend may be concluding and/or a strengthening of a conviction to the current trend.
How to Trade the Consensus Signal:
When the highlighted directional labeled box prints at the open of a new price bar, take the trade based on the directional bias displayed. Consensus signals are generally most productive when traded aligned with the trend, as displayed by the Trend Bias Plus price bar color or when a white bar indicates a neutral state of the price trend. Counter trend trades using the Consensus Signal are not advised and considered to be less productive / higher risk.
Consensus signals may be traded using stocks, options, or futures.
Some General Rules:
Trade signals are only considered valid when they display at the open of a new price bar.
The signals can be traded on different timeframe charts from short term 3 minute charts to longer timeframe daily charts.
The signals are designed to be a generic indication of probable price movement and as such, can be used effectively for trading futures, stocks, options on stocks, options on ETFs, and options on cash settled indexes.
AES offers traders an opportunity to optimize performance from the natural cycles of the market….trend - retracement - continuation.
AES offers an opportunity for traders to have a clear entry / exit criteria. However, it is still imperative that each trader understands the trading strategy they intend to use and the risks and opportunities associated with that strategy. It is highly advised, regardless of the system or strategies being used, that a trader validates their understanding of the system/strategy by trading in a simulated, paper account format to self test the system and personal ability to trade it successfully.
Next Bar Alert:
Included is an optional "Next Bar Alert" setting. Since many of these signals benefit from very prompt action at the beginning of a price bar, there is an additional option in Settings to set an arbitrary number of seconds to be alerted before the next price bar opens. Simply set this to a level you prefer, then set an alert in TradingView on the indicator using the "Next Bar Alert" alert parameter.
Summary:
The color highlight indicator allows the trader to be 100% certain that the rules/criteria for confirming a valid entry were met at the open of the price bar. This feature, along with the alert settings in Trading View, provide clear confirmation of the timing and print of the signal as either valid or not.
Adaptive Entry System has been designed to help traders of all skill levels to trade the natural sequence of patterns in price action using a simple to recognize, single signal entry/exit format. The natural cycle of trend (Trend Bias Plus), then retracement (Momentum), followed by a continuation of the original trend (Consensus) can be identified within this system and offers traders a simple signal to take advantage of each phase in the cycle. Stock investors, options traders, and futures traders can benefit from the simple design of the AES on a variety of time frames.
Trend Bias Plus signals on NASDAQ:TSLA Daily chart:
Trend Bias Plus signals on NASDAQ:AMZN Daily chart:

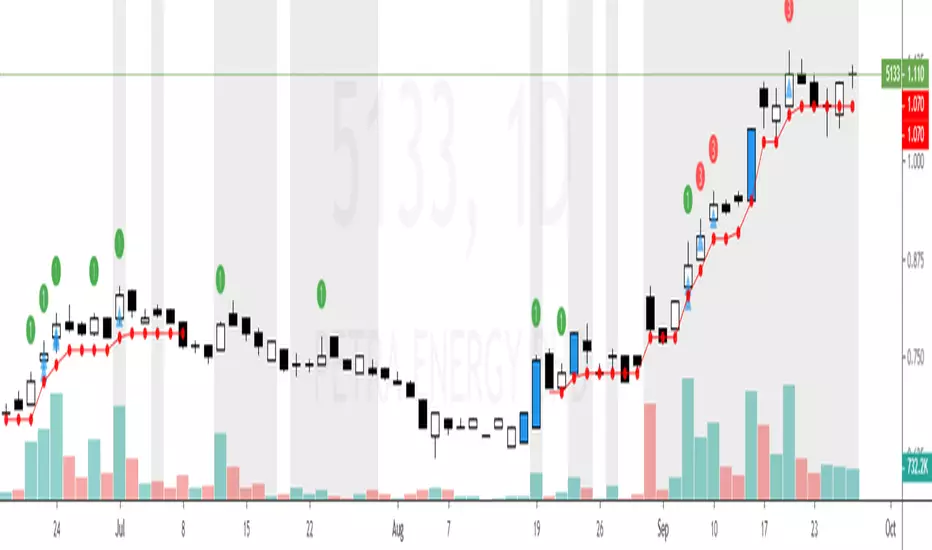
Flexta PVA Entry & Stop Loss V1Flexta PVA Entry Stop Loss V1
This indicator used together with result generated from Flexta PVA Scanner.
It is a guideline to decide entry or exit position based on Flexta PVA trading rules.
User will easily understand each stock trend based on PVA phases and it will help to improve the decision making before entry or exit.
How to Use :
1. Green Circle with number 1 (Above Candle)
- PVA Stage 2 Priority 1
2. Orange Circle with number 2 (Above Candle)
- PVA Stage 2 Priority 2
3. Red Circle with number 3 (Above Candle)
- PVA Stage 3
4. Blue Candle Color
- Top TPVA
5. Grey Background Pillar
- Momentum Detected
6. Red Circle (Below Candle)
- Stop Loss Suggestion
7. Red Line (Below Candle)
- Stop Loss trailing
8. Cyan circle with star (Below Candle)
- PVA + RSI Oversold
9. Blue Triangle (Below Candle)
- Entry Suggestion
10. Trading Guideline Panel
- Check list before making final decision to entry
SMC MICRO ENTRY SETUPThis setup is designed based on Fair Value Gaps where trader can predict Bullish Or Bearish Trend with Market Structure and FVG, We may get Micro Levels for Buying and Selling with Small FVG Detection with Lower Time Frames, This setup will help trader to find good trades with Smart Money entries with FVG Order Blocks,
Same setup is only for Education Purposes don't take blind traded on it. Before taking any trade please concern with your Financial Advisor.
Green OB = Bullish Trend with Fresh Demand
Red OB = Bearish Trend with Fresh Supply
Gray OB = If Tested Red of Green OB it will automatic convert into Gray as a Entry Taken with OB

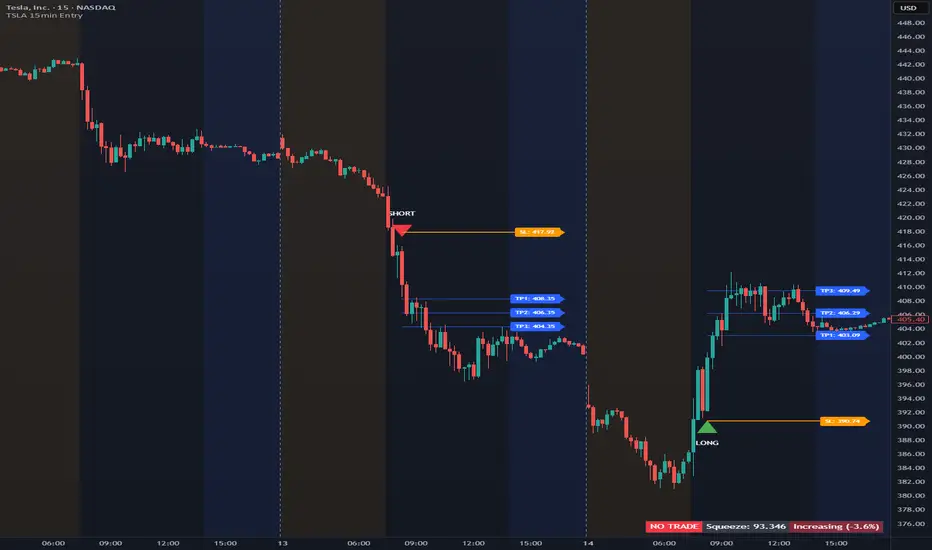
TSLA 15min EntryTSLA 15min Entry
Indicator Type: Market Structure Breakout & Momentum Confirmation Tool
Timeframe: Optimized for 15-minute charts
The TSLA 15min Entry indicator is designed to identify high-probability directional setups based on structural breakout behavior combined with volume-weighted momentum confirmation.
It highlights potential entry zones where price is showing a decisive break from short-term equilibrium, then provides dynamic stop-loss and tiered take-profit targets to help manage trades systematically.
Key features include:
✅ Automatic Entry Signals: Generates clear LONG or SHORT entries when price confirms a structural breakout pattern.
🟡 Dynamic Stop-Loss: Optional “Tight SL” mode for active day traders, or a balanced default mode for smoother setups.
🔵 Tiered Take-Profit Lines: Displays up to three adjustable TP levels (TP1, TP2, TP3) directly on the chart.
⚙️ Clean Chart Options: Each line (SL, TP1–3) can be toggled on or off individually for a customizable view.
📊 Squeeze & Trend Panel: Helps visualize contraction and expansion phases in momentum — useful for timing entries during volatility shifts.
🕒 Session-Based Logic: All signals and lines reset daily, making it ideal for intraday traders focused on short-term market structure.
This indicator was specifically built and optimized for trading TSLA on the 15-minute timeframe.
Other tickers or timeframes are not recommended, as the logic and signal timing are tuned exclusively for TSLA’s price behavior and volatility.
Extended Hours must be turned on in your TradingView chart settings for the indicator to function properly.
⚠️ Disclaimer: This indicator is for educational and informational purposes only. It does not constitute financial advice or a recommendation to buy or sell any security. Always perform your own analysis and trade responsibly.
BOS Indicator (Anchored, TP1-TP3, MTF>=4, Multi-Entry)BOS Indicator (Anchored, TP1–TP3, MTF≥4, Multi-Entry)
This indicator is designed to identify high-probability Break of Structure (BOS) trade setups using a combination of market structure, EMA bias, and multi-timeframe direction confirmation. It is intended for discretionary traders who want clear structure-based entries with predefined risk and profit targets.
🔹 Core Logic
Uses a long-term EMA to define bullish or bearish market bias
Tracks market structure using swing pivots to identify valid BOS events
A trade is only signaled after:
Price is on the correct side of the EMA
A valid pullback has formed
Structure is broken in the direction of the trend
Optional multi-timeframe confirmation ensures alignment across higher timeframes before signaling a trade
🔹 Trade Visualization
When a valid BOS setup occurs, the indicator automatically draws:
Entry level
Stop loss zone
Profit target zone
Three Take Profit levels (TP1, TP2, TP3)
Risk and reward boxes anchored to the signal candle
🔹 Take Profit & Trade Management (Important)
This script is designed to be used with partial profit-taking:
TP1
Take 50% of the position off
Locks in early profits and reduces risk
TP2
Take 25% more off the position
At this point, it is recommended to move the stop loss slightly into profit (or near TP1) to protect the trade and eliminate downside risk
TP3
Let the remaining 25% run toward the final target
This allows traders to benefit from extended moves while already being protected
This approach balances risk control, consistency, and the ability to capture larger trend moves.
🔹 Additional Features
Supports multi-entry trends after exits
Works across all markets and timeframes
Visual MTF direction panel for quick confirmation
Designed to avoid false signals caused by minor consolidations
⚠️ Disclaimer
This indicator is a decision-support tool only and does not guarantee profits. Always use proper risk management and confirm signals with your own analysis.

Bassi MA Entry Helper MTF EMA , VWMA Swing , ADX , SMA200 , TPBassi MA Entry Helper is an advanced multi-timeframe confluence system designed to identify high-probability entries using trend, volume, market structure, and volatility filters.
It is built for traders who want cleaner signals, fewer false entries, and strong multi-confirmation setups.
Key Features
Multi-Timeframe EMA Crossovers – HTF signal engine
SMA200 Trend Filter – prevents counter-trend trades
VWMA Swing Confirmation – volume-validated micro-swings
ADX Filter – only trade when the trend has strength
Fractal Structure Mapping – identifies swing highs/lows
Retracement Filter – confirms pullbacks before entries
TP/SL Automation – ATR or percentage based
Clean Entry Labels – main & additional entry signals
Highly Customizable – mode, timeframe, filters, visuals
This script is ideal for:
Scalping • Intraday • Swing • Trend continuation • Volume-based setups • Multi-timeframe alignment
How It Works
Main Buy/Sell Signals
Triggered when:
✔ Fast EMA crosses Slow EMA (HTF)
✔ Price aligned with trend
✔ SMA200 filter valid
✔ VWMA confirmation (optional)
✔ ADX strong
✔ Retracement valid (optional)
Additional Buy/Sell Signals
Triggered when VWMA crosses Slow EMA during trend continuation.
TP/SL System
You can choose between:
%-based take-profit & stop-loss
ATR-based dynamic levels
Automatically projects clean visual levels on your chart.
Notes
This indicator does not repaint and is suitable for both real-time and historical analysis.
Always combine signals with proper risk management.
Initial Release – v1.0
Added multi-timeframe EMA engine
Added SMA200 trend filter
Added VWMA swing entries
Added ADX strength filter
Added retracement filter
Added fractal swing detection
Added TP/SL auto plotting
Added main & additional entry labels
Performance optimized

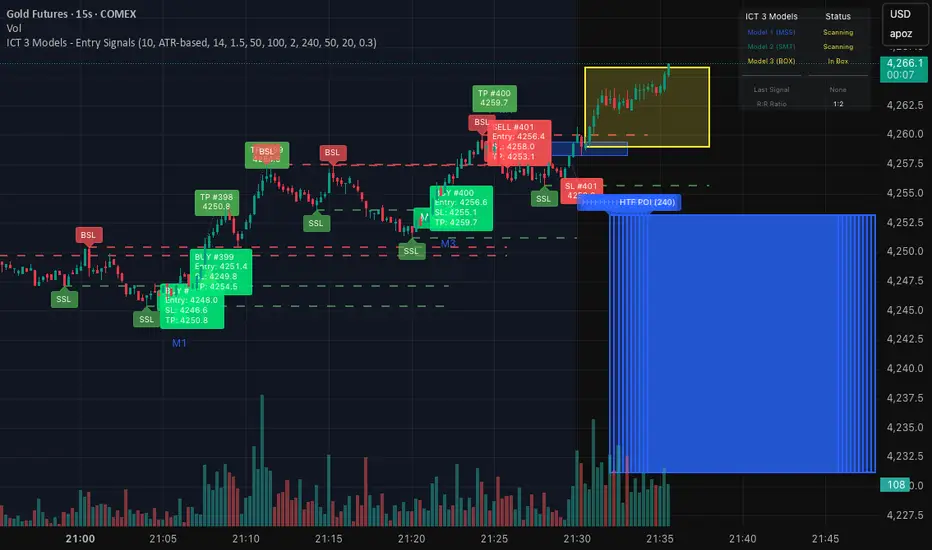
ICT 3 Models - Entry Signals 1.2This script combines 3 powerful ICT (Smart Money Concepts) Entry Models into one comprehensive strategy setup. It is designed to identify high-probability setups based on Higher Timeframe POIs and includes a fully functional Strategy Tester engine.
🔥 The 3 Entry Models:
Model 1 (MSS + FVG): Classic reversal setup using HTF Order Blocks, Liquidity Sweep, Market Structure Shift (MSS), and entry at FVG.
Model 2 (SMT / Sweep): Catches "Turtle Soup" or Failure Swing setups where price grabs liquidity and quickly reverses using FVG confirmation.
Model 3 (AMD / Box): Accumulation, Manipulation, Distribution setup. Identifies consolidation boxes and trades the manipulation leg.
✨ Highlights:
Full Backtesting Engine: Test the strategy with customizable Initial Capital and Order Sizing.
Auto HTF POI: Automatically plots Higher Timeframe Order Blocks on your chart.
Flexible Risk Management: Set SL/TP via Fixed Points or ATR Multiplier.
Alerts Included: Ready for automation.
Disclaimer: This tool is for educational purposes only. Trading involves risk.
Liquidity Sweep + FVG Entry Model//@version=5
indicator("Liquidity Sweep + FVG Entry Model", overlay = true, max_labels_count = 500, max_lines_count = 500)
// Just to confirm indicator is loaded, always plot close:
plot(close, color = color.new(color.white, 0))
// ─────────────────────────────────────────────
// PARAMETERS
// ─────────────────────────────────────────────
len = input.int(5, "Liquidity Lookback")
tpMultiplier = input.float(2.0, "TP Distance Multiplier")
// ─────────────────────────────────────────────
// LIQUIDITY SWEEP DETECTION
// ─────────────────────────────────────────────
lowestPrev = ta.lowest(low, len)
highestPrev = ta.highest(high, len)
sweepLow = low < lowestPrev and close > lowestPrev
sweepHigh = high > highestPrev and close < highestPrev
// Plot liquidity levels
plot(lowestPrev, "Liquidity Low", color = color.new(color.blue, 40), style = plot.style_line)
plot(highestPrev, "Liquidity High", color = color.new(color.red, 40), style = plot.style_line)
// ─────────────────────────────────────────────
// DISPLACEMENT DETECTION
// ─────────────────────────────────────────────
bullDisp = sweepLow and close > open and close > close
bearDisp = sweepHigh and close < open and close < close
// ─────────────────────────────────────────────
// FAIR VALUE GAP (FVG)
// ─────────────────────────────────────────────
bullFVG = low > high
bearFVG = high < low
// we’ll store the last FVG lines
var line fvgTop = na
var line fvgBottom = na
// clear old FVG lines when new one appears
if bullFVG or bearFVG
if not na(fvgTop)
line.delete(fvgTop)
if not na(fvgBottom)
line.delete(fvgBottom)
// Bullish FVG box
if bullFVG
fvgTop := line.new(bar_index , high , bar_index, high , extend = extend.right, color = color.new(color.green, 60))
fvgBottom := line.new(bar_index , low, bar_index, low, extend = extend.right, color = color.new(color.green, 60))
// Bearish FVG box
if bearFVG
fvgTop := line.new(bar_index , low , bar_index, low , extend = extend.right, color = color.new(color.red, 60))
fvgBottom := line.new(bar_index , high, bar_index, high, extend = extend.right, color = color.new(color.red, 60))
// ─────────────────────────────────────────────
// ENTRY, SL, TP CONDITIONS
// ─────────────────────────────────────────────
var line slLine = na
var line tp1Line = na
var line tp2Line = na
f_deleteLineIfExists(line_id) =>
if not na(line_id)
line.delete(line_id)
if bullDisp and bullFVG
sl = low
tp1 = close + (close - sl) * tpMultiplier
tp2 = close + (close - sl) * (tpMultiplier * 1.5)
f_deleteLineIfExists(slLine)
f_deleteLineIfExists(tp1Line)
f_deleteLineIfExists(tp2Line)
slLine := line.new(bar_index, sl, bar_index + 1, sl, extend = extend.right, color = color.red)
tp1Line := line.new(bar_index, tp1, bar_index + 1, tp1, extend = extend.right, color = color.green)
tp2Line := line.new(bar_index, tp2, bar_index + 1, tp2, extend = extend.right, color = color.green)
label.new(bar_index, close, "BUY Entry\nFVG Retest\nSL Below Sweep",
style = label.style_label_up, color = color.new(color.green, 0), textcolor = color.white)
if bearDisp and bearFVG
sl = high
tp1 = close - (sl - close) * tpMultiplier
tp2 = close - (sl - close) * (tpMultiplier * 1.5)
f_deleteLineIfExists(slLine)
f_deleteLineIfExists(tp1Line)
f_deleteLineIfExists(tp2Line)
slLine := line.new(bar_index, sl, bar_index + 1, sl, extend = extend.right, color = color.red)
tp1Line := line.new(bar_index, tp1, bar_index + 1, tp1, extend = extend.right, color = color.green)
tp2Line := line.new(bar_index, tp2, bar_index + 1, tp2, extend = extend.right, color = color.green)
label.new(bar_index, close, "SELL Entry\nFVG Retest\nSL Above Sweep",
style = label.style_label_down, color = color.new(color.red, 0), textcolor = color.white)

AI Exclusive(Precision Entry)AI Exclusive (Precision Entry)
Overview: An indicator that provides precise entry signals along with defined Take Profit (TP) and Stop Loss (SL).
Benefits:
• Confident entries with built in risk management
• Clear TP and SL displayed on the chart
• Suitable for both beginner and professional traders
Features:
• Transparent, unambiguous signals
• Usable on all symbols and timeframes
• Visual design with colored lines and clear labels

VLB Entry TOOL — Dynamic Key Levels & Continuation Behavior ModThe VLB Entry Tool is a behavior-driven analysis system built specifically for XAUUSD.
It focuses on two structural elements that consistently influence gold’s movement:
1. Key Levels
2. Continuation thresholds after expansion
The indicator automatically identifies and displays key levels on the chart—levels that gold frequently reacts to through rejections, breaks, or pullbacks.
Since these levels form the foundation of most intraday movement, the tool removes the need to manually update them each session.
A core observation behind this model is that gold often breaks through a major level, retraces, and then gains continuation strength once price expands beyond the level by a predefined threshold.
This “break → pullback → continuation” behavior is used to plot objective price zones where continuation has historically shown a higher probability of developing.
Dynamic Adaptive Levels
The VLB Entry Tool continuously adjusts its key levels and continuation thresholds as market structure evolves.
As price forms new highs/lows or shifts intraday behavior, the tool automatically recalibrates to the new environment—helping traders stay aligned with real-time market structure without redrawing levels manually.
What the indicator provides:
-Automatically mapped key levels based on gold’s structural behavior
-Highlighted continuation zones after price expansion
-Real-time adaptive recalculation as market conditions change
-Objective, rules-based entry zones
-A consistent framework that reduces guesswork around “where” to enter
-A focus on price behavior rather than predictions
The VLB Entry Tool does not provide guaranteed outcomes or financial advice.
It organizes XAUUSD structure into predefined reference points using historical behavior, volatility characteristics, and a rules-based approach.
Traders remain responsible for their own timing, confirmation, fundamental context, and risk management.
This tool is designed for traders who want a structured, adaptive, and behavior-focused framework for interpreting XAUUSD movement—centered on the key levels that matter most.


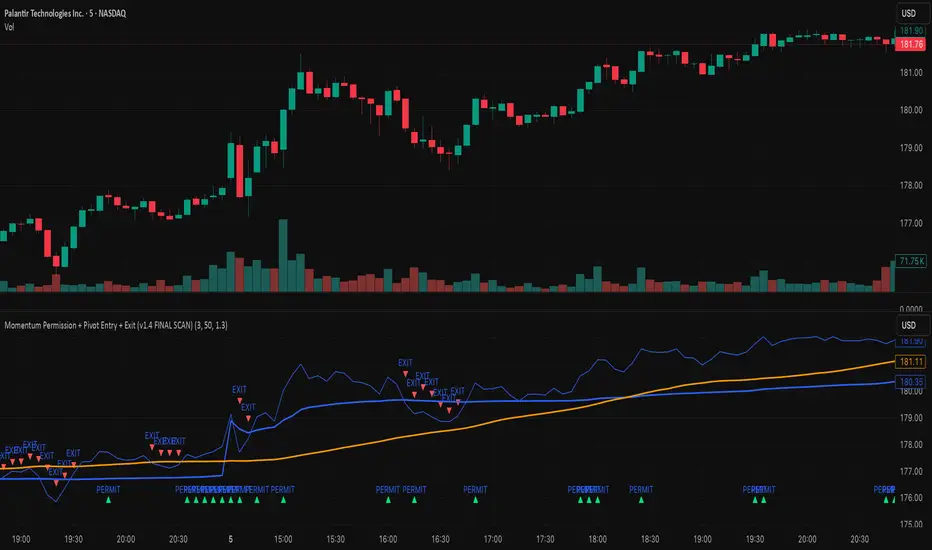
Momentum Permission + Pivot Entry + Exit (v1.4 FINAL SCAN)plot(permitOut, "PERMIT", display=display.none)
plot(entryOut, "ENTRY", display=display.none)
plot(exitOut, "EXIT", display=display.none)
TUAN DO – EMA35/105/500 Entry + SL/TP v1.0EMA35/105/500 Gold M1 system with automatic Entry, SL, TP, pip calculation and exit labeling.

Scalping 4D+ Engine (Advanced Entry Modes {SMC})Scalping 4D+ Engine (Advanced Entry Modes {SMC}) is a next-generation quantitative trading model engineered for traders who want fewer but higher-probability signals.
This system combines Smart Money Concepts (SMC), quantitative volume analysis, volatility regime modeling, and momentum confirmation into a unified scoring engine that filters out noise and highlights only the strongest directional opportunities.
Unlike conventional indicators that rely on a single trigger (EMA crosses, RSI oversold, MACD flips), the SMC 4D+ engine evaluates multiple market dimensions simultaneously, allowing it to track the true underlying state of the market before issuing a BUY or SELL signal.

Bollinger Band Breakout & Re-entry StrategyA mean reversion indicator that identifies failed breakouts of Bollinger Bands and generates entry signals when price returns to the band range. Requires 2 consecutive closes outside the bands to confirm a breakout, then triggers LONG signals when price re-enters above the lower band or SHORT signals when re-entering below the upper band. Each signal includes a quality score (0-100) based on volume, volatility, and momentum, with automatic stop loss and 4 profit targets calculated using risk multiples (0.85R to 4.5R).

4H high low, break and entry This Pine Script indicator identifies the high and low price levels from the 4:00 AM to 8:00 AM trading period and displays them as horizontal lines throughout the day. It detects when price breaks out above the high or below the low after 8:00 AM, marking these breakouts with labeled alerts. When price closes back into the range after a breakout, it displays prominent blue arrow entry signals - down arrows for re-entries from above and up arrows for re-entries from below.
