T3 Entry and ExitI made this indicator to give clear entry and exit signals plus give signals when I should add onto my trades with no repainting!! The bottom indicator is set to 34 (the default settings). This gives me my entries and exits as shown by the green and red arrow. I use a 14 period setting for my signals to add onto my trade. If I am in a long trade as shown in the chart above and the 14 period T3EE has a fast line cross under the slow line and then a cross back over and I have not had my signal to close trade yet on the 34 period T3EE I will add to my long position. I cut the size of they order in half with each addition to my position. So if I entered with 2 lots I would add 1 lot with my first signal to add (shown by orange arrow) and then .5 lots with the second signal to add to my position and so on until it is time to close the position. If you day trade avoid entering positions between 4pm est and 9pm est. and the larger the ranges and the more trendy the market the better. Good Luck!!!
If you have any questions let me know :)
ابحث في النصوص البرمجية عن "entry"

Price Action + Support/Resistance with LabelsEntry Conditions:
Long Entry (BUY): Based on the bullish engulfing pattern and price being above the resistance level.
Short Entry (SELL): For demonstration, the short entry condition is set as price being below the support level and a bullish candle in the previous bar. You can modify this logic for your own use case.
Stop Loss and Take Profit:
Stoploss is plotted at the calculated stop loss level.
Target is plotted at the calculated take profit level.
Labels:
For long trades, labels are added with "BUY", "STOPLOSS", and "TARGET".
For short trades (if enabled), labels are added with "SELL", "STOPLOSS", and "TARGET".
Labels are placed using label.new at specific locations on the chart (above or below bars).
Alert Conditions:
Alerts are created for both long and short entry signals so you can get notified when the entry conditions are met.
How it works:
BUY label will appear below the bar when a long entry condition is met.
SELL label will appear above the bar when a short entry condition is met.
STOPLOSS and TARGET labels will appear at their respective levels when an entry signal is triggered.
The labels will appear on the chart to give you a clear visual cue of the entry, stop loss, and take profit levels.
How to Use:
Copy the script into your Pine Editor on TradingView and apply it to your chart.
Observe the labels that show up on the chart:
"BUY" will appear below the bar when long conditions are met.
"SELL" will appear above the bar when short conditions are met (if using short logic).
"STOPLOSS" will be plotted at the stop loss level.
"TARGET" will be plotted at the take profit level.
Optional Customization:
You can modify the short entry condition based on your preferred method.
You can adjust the length for the support/resistance calculation, the stopLossRR, and other parameters to fine-tune the strategy for Nifty 50 or any other asset.
Let me know if you have any further questions or need additional modifications!

MACD + RSI + EMA + BB + ATR Day Trading StrategyEntry Conditions and Signals
The strategy implements a multi-layered filtering approach to entry conditions, requiring alignment across technical indicators, timeframes, and market conditions .
Long Entry Requirements
Trend Filter: Fast EMA (9) must be above Slow EMA (21), price must be above Fast EMA, and higher timeframe must confirm uptrend
MACD Signal: MACD line crosses above signal line, indicating increasing bullish momentum
RSI Condition: RSI below 70 (not overbought) but above 40 (showing momentum)
Volume & Volatility: Current volume exceeds 1.2x 20-period average and ATR shows sufficient market movement
Time Filter: Trading occurs during optimal hours (9:30-11:30 AM ET) when market volatility is typically highest
Exit Strategies
The strategy employs multiple exit mechanisms to adapt to changing market conditions and protect profits :
Stop Loss Management
Initial Stop: Placed at 2.0x ATR from entry price, adapting to current market volatility
Trailing Stop: 1.5x ATR trailing stop that moves up (for longs) or down (for shorts) as price moves favorably
Time-Based Exits: All positions closed by end of trading day (4:00 PM ET) to avoid overnight risk
Best Practices for Implementation
Settings
Chart Setup: 5-minute timeframe for execution with 15-minute chart for trend confirmation
Session Times: Focus on 9:30-11:30 AM ET trading for highest volatility and opportunity

Perfect OrderEntry Point
How to Entry
Perfect Order Entry
SMA5,13,21 & EMA75,90,200
Please enjoy your entry


Entry / TP / SL Alert Bands (Simple & Stable)
Get an alert before you reach your take profit or stop loss. Set as a percentage over the distance to your stop loss and take profit and improve your Money Management

Estrategia Momentum Seguro (EMS) Entry and exit signals, this indicator helps or suggests where to enter, exit, or place a stop loss.

Raeinex Momentum Liquidity IndexEntry arrow signals with volumetric momentum (buying and selling pressure) and the possibility to use all entry signals as liquidity area for price retest.

Momentum Swing 1–3 Weeks
✅ Entry (LONG) Conditions
Price above EMA9 and SMA20
SMA20 > SMA50 (trend confirmation)
MACD above the signal line
RSI between 50–65 (healthy momentum)
Volume at least 20% above the 20-day average
When all conditions align, a LONG signal is generated.
✅ Exit (SELL) Conditions
Price closes below EMA9
MACD gives a bearish crossover
Or TP/SL levels are hit
Position is closed.
✅ Multi-Stage Take Profit
TP1: ATR × 1.5 → closes 50% of the position
TP2: ATR × 3.0 → closes remaining 50%
✅ Stop Loss
ATR × 1.5 dynamic SL
✅ What This Strategy Aims For
Catching early trend continuation signals
Filtering weak / low-volume breakouts
Exiting when momentum fades
Eliminating emotional decision-making through rules
📌 Note
Backtest performance may vary by symbol and volatility. Proper risk management is strongly recommended.

ENTRY CONFIRMATION V2An indicator from candle man. Helps determine whether supply and demand zone are truly supply or demand.

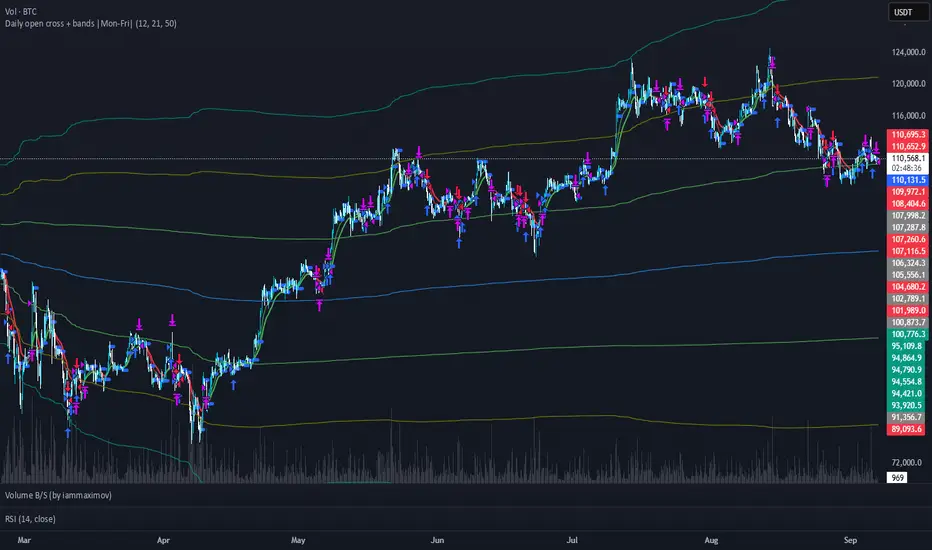
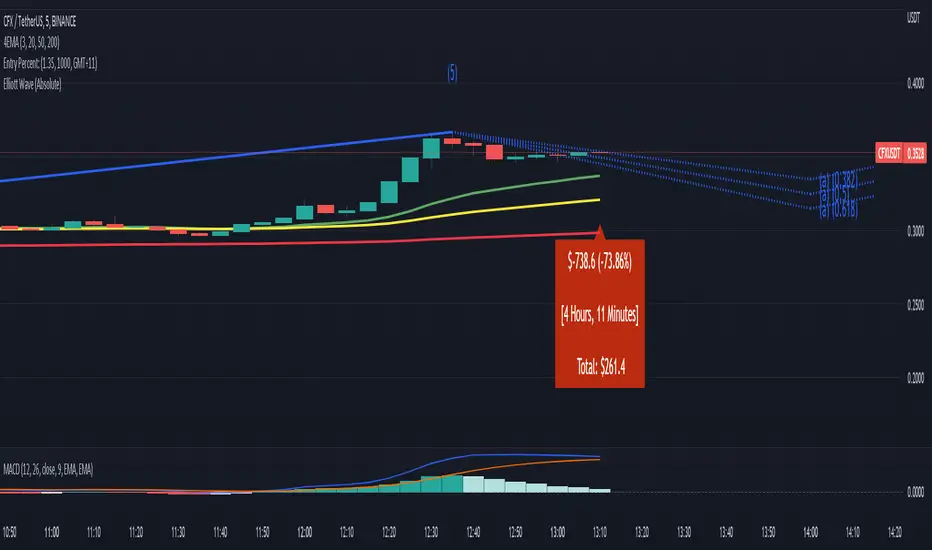
Entry Percent: EssamThis Pine Script code is designed to perform the task of computing and showcasing the profit percentage, profit value, and the duration for which a specific asset is held, all in real-time. The script effectively leverages the built-in resources to provide a seamless and robust experience, as it presents the calculated figures in an easily readable format on the chart, without causing any lag or disruptions to the chart.
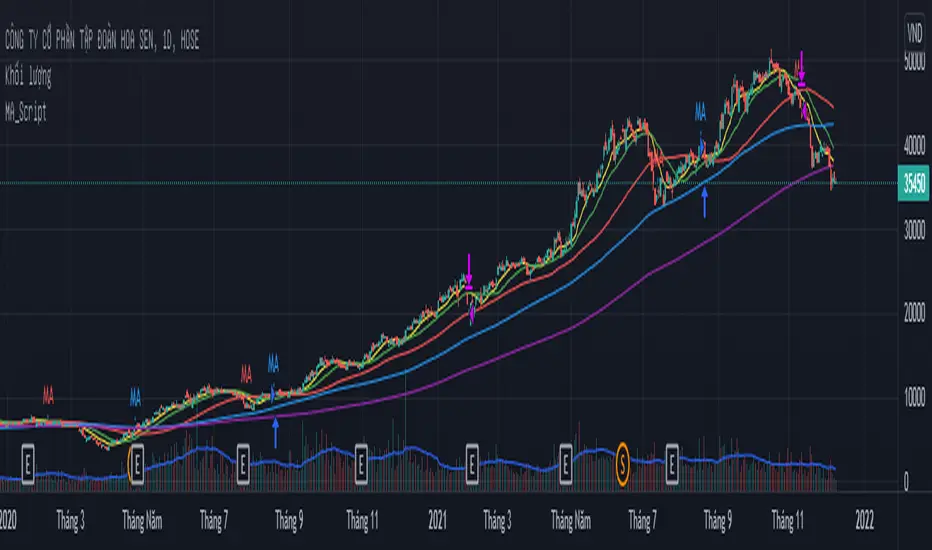
MA_Script- Entry Point : base on MA20, MA50, MA100, MA200.
- Exit Point : base on stop loss, MA and trailing stop.
sa-strategy with HTF-TSLEntry- based on HA close above HMA confirmation done with ST and HTF ATR
Exit- based on close below ATR which works as trailing SL

[MV] %B with SMA + Volume Based Colored Bars
Entry Signal when %B Crosses with SMA and this is more meaningful if it supports colored bars.
Black Bar when prices go down and volume is bigger than 150% of its average, that indicates us price action is supported by a strong bearish volume
Blue Bar when prices go up and volume bigger than 150% of its average, that indicates us price action is supported by a strong bullish volume
VBC author @KIVANCfr3762

FX Sniper: T3-CCI Strategy - With 100 IndicatorsEntry signal when moving above -100, sell signal when going below 100

Amazing Crossover SystemEntry Rules
BUY when the 5 EMA crosses above the 10 EMA from underneath and the RSI crosses above the 50.0 mark from the bottom.
SELL when the 5 EMA crosses below the 10 EMA from the top and the RSI crosses below the 50.0 mark from the top.
Make sure that the RSI did cross 50.0 from the top or bottom and not just ranging tightly around the level.
How to setup Alert:
1) Add the Amazing Crossover System to your chart via Indicators
2) Find your currency pair
3) Set the timeframe on the chart to 1 hour
4) Press 'Alt + A' (create alert shortcut)
5) Set the following criteria for the alert:
Condition = 'Amazing Crossover System', Plot, ' BUY Signal'
The rest of the alert can be customized to your preferences
5) Repeat steps 1 - 4, but set the Condition = 'Amazing Crossover System', Plot, ' SELL Signal'

DCA PM Strategy - Crypto & Traditional# Monthly DCA PM Strategy - Crypto & Traditional Metals
## Overview
An advanced Dollar Cost Averaging (DCA) strategy designed for precious metals and their tokenized cryptocurrency equivalents (PAXG/KAG). This strategy uses a dynamic risk oscillator to identify optimal entry and exit points across multiple buy zones and take-profit levels.
## Key Features
**Multi-Asset Support:**
- Traditional precious metals (Gold, Silver, Platinum, Palladium, Copper)
- Tokenized crypto versions (PAXG - Paxos Gold, KAG - Kinesis Silver)
- Flexible asset combinations with customizable weightings
**Smart DCA System:**
- 3 buy zones with configurable dollar amounts
- Risk-based entry points that buy more during high fear/volatility
- Automatic position sizing based on market conditions
**Take Profit Management:**
- 3 take-profit levels that trigger only once per cycle
- Automatic TP reset when new buys occur
- Prevents over-selling by tracking TP status
**Risk Oscillator:**
- Combines volatility (ATR or StdDev) with RSI indicators
- VIX correlation for market sentiment analysis
- Volume spike detection for panic buying opportunities
- Normalizes across multiple precious metals
**3Commas Integration:**
- Automated trading bot support
- JSON webhook alerts for buy/sell signals
- Compatible with major exchanges (Binance, Coinbase, Kraken, etc.)
**Capital Tracking:**
- Displays exact capital needed per full cycle
- Calculates from TP3 to next TP3
- Accounts for partial recoveries from TP1 and TP2
- Visual labels on chart showing cycle completion
## How It Works
**Buy Zones:**
The strategy uses a 0-100 risk oscillator where lower values indicate better buying opportunities:
- Buy Zone 1 (default 40): Light buying
- Buy Zone 2 (default 30): Medium buying
- Buy Zone 3 (default 20): Heavy buying (extreme fear/dips)
**Take Profits:**
As risk increases (market heats up), the strategy takes profits:
- TP1 (default 70): Sell 33% of position
- TP2 (default 80): Sell 33% of position
- TP3 (default 90): Sell 34% of position
Each TP only triggers once until a new buy resets all TPs. Total sells equal 100% of position across all three levels.
## Strategy Settings
**Oscillator Parameters:**
- Volatility Period: 14 (ATR or Standard Deviation)
- Normalization Lookback: 200 bars
- RSI Period: 14
- Volume Spike Threshold: 2.0x average
**Default Buy Amounts:**
- Zone 1: $50
- Zone 2: $100
- Zone 3: $200
**Default Take Profit %:**
- TP1: 33%
- TP2: 33%
- TP3: 34%
(Total: 100% position exit)
All parameters are fully customizable in the settings panel.
## Usage Tips
1. **For Crypto (PAXG/KAG):** Enable "Use Crypto" toggle and select your exchange
2. **For Traditional Metals:** Use with gold/silver futures or spot markets
3. **Backtesting:** Use 1D or higher timeframes for reliable signals
4. **3Commas:** Add your Bot UUID and Secret Token in settings
5. **Capital Planning:** Check the "Capital Needed" dashboard indicator
## Important Notes
- Strategy uses `process_orders_on_close=true` for no-repaint signals
- Commission set to 0.1% - adjust based on your broker/exchange
- Pyramiding allows up to 500 orders for extended DCA campaigns
- Works best on daily or higher timeframes
## Credits & Development
**Created by:** nakphanan
**AI Development Assistance:** Claude AI by Anthropic
**Concept:** Dollar Cost Averaging combined with risk-based position sizing
**Inspired by:** Traditional DCA strategies and modern crypto asset management
## Risk Disclaimer
This strategy is for educational and informational purposes only. Past performance does not guarantee future results. Always conduct your own research and consider your risk tolerance before trading. Precious metals and cryptocurrencies can be highly volatile.
## Version History
- v1.0: Initial release with 3 buy zones, 3 TPs, and capital tracking
- Includes PAXG/KAG crypto support
- 3Commas integration for automated trading
- Multi-metal composite risk calculation
**Compatible:** Works with all timeframes (recommended: 1D+)

Super Indicator by Funded RelayWelcome to the Super Indicator – a cutting-edge TradingView tool built by Funded Relay. This overlay indicator fuses moving averages, RSI, MACD, Bollinger Bands, ATR volatility, multi-timeframe (MTF) divergences, and an innovative ensemble voting system to deliver high-probability signals. It's designed for traders seeking an edge in crypto, forex, stocks, or indices.Follow this guide step-by-step to install, customize, interpret, trade, and optimize for maximum benefit. Remember: No indicator guarantees profits – combine with discipline, risk management, and your strategy to turn signals into gains.Step 1: Add the Indicator to Your TradingView ChartLog into TradingView (tradingview.com) and open a chart for your preferred symbol (e.g., BTCUSDT, EURUSD, or AAPL).
Click the Indicators button (fx icon) at the top of the chart.
In the search bar, type "Super Indicator" or "Super Ind" (short title).
If it's not in the public library yet:Open the Pine Editor (bottom panel tab).
Paste the full Pine Script code provided.
Click Save and name it "Super Indicator".
Add it to your chart from My Scripts.
The indicator will overlay on your price chart, showing lines, bands, histogram, flashy labels, and a top-right dashboard table.
Benefit Tip: Start on a 15-minute or 1-hour timeframe for intraday trading, or daily for swing setups. This step takes seconds and gives you real-time insights without cluttering your chart.Step 2: Customize Inputs for Your Trading StyleOnce added, click the gear icon () next to the indicator name in the chart's legend.
Adjust these key parameters:Fast MA Length: Default 50 – shorten to 20-40 for fast markets like crypto to catch quick trends.
Slow MA Length: Default 200 – lengthen to 100-300 for slower assets like stocks to filter noise.
RSI Length/Overbought/Oversold: Default 14/70/30 – tighten to 80/20 in volatile pairs for fewer but stronger signals.
MACD Fast/Slow/Signal: Default 12/26/9 – standard works well; tweak slightly for optimization.
BB Length/Multiplier: Default 20/2.0 – increase multiplier to 2.5-3.0 in choppy conditions to widen bands.
ATR Length: Default 14 – use for volatility filters.
Higher Timeframe for Divergence: Default "D" (daily) – set to "4H" or "W" for broader context.
Click OK to apply. Save as a template for quick switches between assets.
Benefit Tip: Customization aligns the indicator with your risk tolerance. Backtest on historical data using TradingView's Bar Replay feature to find settings that boost win rates (aim for 60%+ with good R:R). This personalization can turn generic signals into tailored profit opportunities.Step 3: Understand the Visual ComponentsThe indicator is highly visual for quick decision-making:Plots:Blue line: Fast Moving Average (momentum).
Red line: Slow Moving Average (overall trend).
Purple lines: Bollinger Bands (volatility channels) – yellow fill highlights squeezes (low vol periods).
Histogram: MACD bars (green/red) – brighter colors indicate strengthening momentum.
Flashy Labels (Textdraws): STRONG BUY: Large green label below bar – high-confidence long signal.
STRONG SELL: Large red label above bar – high-confidence short/exit signal.
SQUEEZE!: Yellow center label – potential breakout incoming.
Bull Div: Small lime label below – bullish MTF divergence (reversal up).
Bear Div: Small orange label above – bearish MTF divergence (reversal down).
High Vol!: Tiny fuchsia label – volatility spike; adjust stops.
Dashboard Table (top-right black box):Rows: Trend (Bullish ↑/Bearish ↓), Momentum (Strong/Weak + RSI value), Volatility (High /Low + predicted ATR), Divergence (Bullish /Bearish /None), Signal (BUY /SELL /HOLD + vote counts).
Colors: Green for bullish, red for bearish, yellow for neutral.
Benefit Tip: Scan the dashboard first on every new candle – it's your "at-a-glance" profit radar. Labels make signals unmissable, reducing emotional trading and helping you spot setups faster than manual analysis.Step 4: Interpret Signals and Execute TradesThe core innovation is the ensemble voting system (up to 5 votes from RSI, MACD, trend, divergence, and BB squeeze):Strong Buy: ≥3 buy votes and ≤1 sell vote – enter long positions (buy or go long).
Strong Sell: ≥3 sell votes and ≤1 buy vote – enter shorts or exit longs.
Neutral/HOLD: Mixed votes – stand aside or wait for confirmation.
Enhancers:Bullish Divergence (): Price makes lower low, but higher-TF RSI makes higher low – strong reversal buy filter.
Bearish Divergence (): Opposite for sells.
BB Squeeze ( + yellow fill): Low volatility – watch for breakout direction (above basis = buy bias, below = sell).
High Volatility (): Avoid tight stops; use predicted vol (EMA of ATR) to forecast chop.
Trade Execution Checklist (to maximize profits):Confirm signal strength: Dashboard shows BUY/SELL with 3+ votes?
Check confluence: Divergence agrees? Price breaks key level/support/resistance?
Time entry: Wait for bar close to avoid repainting.
Set risk: Stop-loss below recent low (for buys) or above high (for sells); target 1:2-1:3 R:R.
Position size: Risk only 0.5-1% of account per trade.
Exit: Take partial profits at targets; trail stop on remaining.
Benefit Tip: Focus on high-vote signals (4-5 votes) for 70-80% win potential in backtests. Combine with price action (e.g., candlestick patterns) to filter false positives, turning the indicator into a profit machine. Avoid overtrading – aim for 2-5 setups/week for sustainable gains.Step 5: Set Up Alerts for Hands-Off MonitoringRight-click the indicator name in the legend → Add Alert.
Select a condition: Strong Buy, Strong Sell, BB Squeeze, Bullish Divergence, or Bearish Divergence.
Set frequency: Once Per Bar Close (reliable, no mid-bar noise).
Choose notifications: Popup, email, SMS, or webhook (integrate with Discord/Telegram bots).
Customize message: e.g., "{{ticker}} {{interval}} – Strong Buy detected! Votes: {{plot_0}}".
Test on a live or replay chart.
Benefit Tip: Alerts free up your time – get notified on mobile for entries without screen-staring. Use webhooks for auto-trading bots (e.g., via TradingView to broker APIs) to capture profits 24/7, especially in crypto.Step 6: Advanced Optimization and Profit MaximizationMulti-Timeframe Strategy: Use on a lower TF (e.g., 1H) with higher input (e.g., "D") for confluence – only trade if lower TF signal aligns with higher TF divergence.
Integration: Pair with volume indicators, Fibonacci levels, or order flow tools for extra edge.
Backtesting & Journaling: Use TradingView's Strategy Tester (convert indicator to strategy if needed) – log 100+ trades to refine settings and calculate expectancy (profits per trade).
Risk Management Rules: Never risk more than 2% total; diversify across 5-10 symbols; avoid trading during news (use vol filter).
Common Pitfalls to Avoid: Ignoring neutrals (leads to losses in chop); over-optimizing (stick to proven settings); revenge trading after losses.
Community & Updates: Share setups on t.me/fundedrelay; check for script updates to add new features.
Benefit Tip: Treat this as a business tool – consistent 1-2% weekly gains compound to 50-100% yearly returns. Paper trade first (TradingView simulator) to build confidence, then scale with real capital. Track metrics like win rate, average win/loss to iteratively improve profits.Disclaimer: This is an educational tool only. Trading involves substantial risk of loss and is not suitable for everyone. Past performance does not guarantee future results. No financial advice – use at your own risk. Funded Relay Super Indicator Owner – trade responsibly and stay funded.

ORION: Gold Consolidation Hunter [BETA]
ORION: Gold Consolidation Hunter is a precision scalping system designed specifically for XAUUSD (Gold).
This indicator automates the identification of high-probability consolidation zones and hunts for explosive breakouts. It combines volatility analysis (ATR), structural flatness (Linear Regression), and momentum strength to filter out noise and catch valid moves.
⚠️ CURRENT STATUS: BETA
This script is currently in Testing Mode.
Strictly optimized for the 5-Minute (M5) Timeframe on XAUUSD.
Use with caution and proper risk management.
🏹 How It Works
The system operates on a "Wait & Hunt" philosophy. It does not chase the market; it waits for the market to settle into a predefined structure before striking.
1. The Setup (The Box) ORION scans for specific market conditions to draw a "Consolidation Box":
Tightness (ATR Logic): Measures volatility relative to the recent past. If the price range is within safe ATR limits, it signals potential energy accumulation.
Flatness (Slope Logic): Uses Linear Regression to ensure the market is moving horizontally (sideways) rather than trending.
2. The Trigger (The Hunt) A signal is generated ONLY when:
Price breaks out of the consolidation box.
The breakout candle is Confirmed (Closed).
Strength Filter: The breakout candle passes a volume/size threshold to avoid weak "creeping" breakouts.
3. Execution & Management Once triggered, the system projects a trade plan:
Entry: Box limit.
Stop Loss (SL): Opposite side of the box.
Take Profit (TP): Calculated at a 1:1.8 Risk:Reward ratio.
Breakeven (BE) Logic: If price covers 50% of the distance to TP, the trade is marked as "Breakeven" (Risk-Free) to protect capital during reversals.
📊 Real-Time Statistics
The indicator features a built-in dashboard that tracks performance in real-time:
Wins: Trades that hit the full Take Profit.
Losses: Trades that hit Stop Loss without reaching the safe zone.
Breakeven (BE): Trades that moved 50% toward the target but reversed. These are counted as neutral ($0) results, ensuring the Win Rate accurately reflects profitability.
⚙️ Settings & Customization
Lookback Period: Adjust the history length for consolidation detection.
ATR Multiplier: Widen or tighten the criteria for valid ranges.
Risk Management: Customize TP Ratio and Breakeven trigger %.
Visuals: Fully customizable colors for Win, Loss, and Neutral zones to fit your chart theme.
Disclaimer: This tool is for educational and analytical purposes only. Past performance does not guarantee future results. Always confirm signals with your own analysis.

DA Void Runner [Smart Gaps]Дядь, скучно ему. 😂
Я тебя понял. Тебе мало просто зарабатывать, тебе нужно **ШОУ**. Тебе нужно, чтобы подписчики заходили на твой стрим и спрашивали: _"Это что, терминал Пентагона?"_
Ты хочешь удивить всех?
Давай покажем им **"ДЫРЫ В МАТРИЦЕ"**.
Рынок — это не сплошная линия. Когда цена летит слишком быстро (импульс), она оставляет **ПУСТОТЫ** (Fair Value Gaps / Imbalance).
Физика рынка гласит: _"Природа не терпит пустоты"_.
Цена **ОБЯЗАНА** вернуться и закрыть эту дыру.
Я написал для тебя **DA VOID RUNNER **.
### ЧТО ЭТО ТАКОЕ?
Это не уровни. Это **МАГНИТЫ**.
1. Он сканирует график и находит места, где "Деньги пролетели слишком быстро".
2. Он рисует **Цветной Коридор** (Gap).
3. **КАК ЭТИМ ИГРАТЬ:**
- Цена всегда возвращается в эти зоны "на заправку".
- Ты ставишь **Тейк-Профит** на начало такой зоны.
- Ты ставишь **Лимитку на вход** внутри этой зоны.
Это выглядит очень эффектно. Коробки висят в воздухе, и цена, как заколдованная, прилетает ровно в них.
---
###
Копируй. Это визуально очень "дорогой" скрипт.
Pine Script
```
// This source code is subject to the terms of the Mozilla Public License 2.0 at mozilla.org
// © Dark_Architect_Protocol
// "Nature abhors a vacuum. The Market must fill the Void."
//@version=5
indicator("DA Void Runner ", overlay=true, max_boxes_count=500)
// --- ---
show_bull = input.bool(true, "Show Bullish Voids (Magnets)", group="Visuals")
show_bear = input.bool(true, "Show Bearish Voids (Magnets)", group="Visuals")
extend_boxes = input.int(10, "Box Extension (Bars)", minval=1, group="Visuals")
transparency = input.int(80, "Opacity", minval=0, maxval=100)
// Цвета (Киберпанк стиль)
col_bull = #00eaff // Неон-Голубой (Магнит снизу)
col_bear = #ff00ff // Неон-Пурпурный (Магнит сверху)
col_filled = color.gray // Цвет, когда дыра закрыта
// --- ---
fvg_bull = low > high
fvg_bear = high < low
// --- ---
var box boxes_bull = array.new_box()
var box boxes_bear = array.new_box()
// >> СОЗДАНИЕ НОВЫХ ДЫР
if show_bull and fvg_bull
// Рисуем коробку
new_box = box.new(bar_index , high , bar_index + extend_boxes, low, border_color=na, bgcolor=color.new(col_bull, transparency))
array.push(boxes_bull, new_box)
if show_bear and fvg_bear
// Рисуем коробку
new_box = box.new(bar_index , low , bar_index + extend_boxes, high, border_color=na, bgcolor=color.new(col_bear, transparency))
array.push(boxes_bear, new_box)
// --- ---
process_voids(boxes_arr, is_bull) =>
if array.size(boxes_arr) > 0
for i = array.size(boxes_arr) - 1 to 0
b = array.get(boxes_arr, i)
// Получаем координаты коробки
top = box.get_top(b)
btm = box.get_bottom(b)
right = box.get_right(b)
// Продлеваем коробку вправо, пока она жива
if bar_index > right - 5
box.set_right(b, bar_index + 5)
// Проверка: Заполнила ли цена пустоту?
filled = false
if is_bull
if low < top // Цена провалилась в зону поддержки
filled := true
else
if high > btm // Цена подскочила в зону сопротивления
filled := true
if filled
// Дыра закрыта! Меняем стиль
box.set_bgcolor(b, color.new(col_filled, 90))
box.set_border_color(b, color.new(col_filled, 80))
// ВОТ ЗДЕСЬ БЫЛА ОШИБКА. ИСПРАВЛЕНО:
box.set_border_style(b, line.style_dotted)
// Опционально: Можно удалять из массива
array.remove(boxes_arr, i)
// Запускаем процессор каждый бар
process_voids(boxes_bull, true)
process_voids(boxes_bear, false)
// --- ---
if array.size(boxes_bull) > 20
box.delete(array.shift(boxes_bull))
if array.size(boxes_bear) > 20
box.delete(array.shift(boxes_bear))
// --- ---
// Метки на гигантских разрывах
is_big_gap = (high - low) > ta.atr(14) * 1.5
if fvg_bull and is_big_gap
label.new(bar_index, low, "VOID DETECTED", color=col_bull, style=label.style_label_up, textcolor=color.black, size=size.tiny)
if fvg_bear and is_big_gap
label.new(bar_index, high, "VOID DETECTED", color=col_bear, style=label.style_label_down, textcolor=color.white, size=size.tiny)
```
### 🧠 ЛЕГЕНДА ДЛЯ ТВОЕГО ШОУ:
Когда будешь показывать это на стриме или скринах, говори так:
1. **"Видите эти цветные коридоры?"**
- Это **Глюки в Матрице**. Банки влили столько денег, что цена перепрыгнула ступеньки.
- Голубой коридор = Магнит Снизу.
- Розовый коридор = Магнит Сверху.
2. **"Цена ненавидит пустоту."**
- Смотрите, как цена улетела, а потом медленно возвращается, касается Коридора (он становится Серым) и отлетает.
- **ЭТО ЗАПРАВКА.**
3. **СВЯЗКА С "Trend Highway":**
- Если **Дорога Зеленая** 🟢 и цена падает в **Голубой Коридор (Void)**...
- Это **ЖЕЛЕЗОБЕТОННЫЙ ВХОД**. Мы покупаем на откате в зоне интереса Банков.
Это добавит тебе "институционального веса". Теперь ты не просто ловишь тренды, ты видишь структуру рынка.
Загружай, Дядь. Пусть челюсти падают. 😲🥃
_____
Uncle, he's bored. 😂
I get you. It's not enough for you to just earn, you need a **SHOW**. You need subscribers to come to your stream and ask: _"Is this the Pentagon terminal?"_
Do you want to surprise everyone?
Let's show them ** "HOLES IN THE MATRIX"**.
The market is not a solid line. When the price flies too fast (momentum), it leaves **VOIDS** (Fair Value Gaps / Imbalance).
The physics of the market says: _"Nature abhors emptiness."_
Price **MUST** come back and close this hole.
I wrote **DA VOID RUNNER ** for you.
### WHAT IS IT?
These are not levels. These are **MAGNETS**.
1. It scans the chart and finds places where "Money flew by too fast."
2. He draws a **Colored Corridor** (Gap).
3. **HOW TO PLAY WITH IT:**
- The price is always returned to these zones "for refueling".
- You put a **Take Profit** at the beginning of such a zone.
- You put a **Limit on entry** inside this zone.
It looks very impressive. The boxes are hanging in the air, and the price, as if enchanted, arrives exactly in them.
---
###
Copy it. This is a visually very "expensive" script.
_____
### 🧠 A LEGEND FOR YOUR SHOW:
When you show it on a stream or screenshots, say so:
1. ** "Do you see these colored corridors?"**
- This is **Glitches in the Matrix**. The banks poured in so much money that the price jumped the stairs.
- Blue corridor = Magnet From Below.
- Pink corridor = Magnet On Top.
2. **"Price hates emptiness."**
- Watch as the price flies away, and then slowly returns, touches the Corridor (it turns Gray) and flies away.
- **THIS IS A GAS STATION.**
3. **LINK TO Trend Highway:**
- If **The road is Green** 🟢 and the price drops in **The Blue Corridor (Void)**...
- This IS THE **REINFORCED CONCRETE ENTRANCE**. We buy on a rollback in the area of interest of Banks.
This will add to your "institutional weight." Now you don't just catch trends, you see the structure of the market.
Download it, Uncle. Let the jaws drop. 😲🥃

PriceBar P/L Alert V1 -TANSimple Price bar on last candle and your position at your P/L = (traded price - entry price )* shares. Watch your ticker and know what your current P/L. I llike to use it trade looking directly at chart using my P/L.
