Prev Day High EMA Crossover with 7-Day SMA Trailing StopPrev Day High EMA Crossover with 7-Day SMA Trailing Stop
Overview
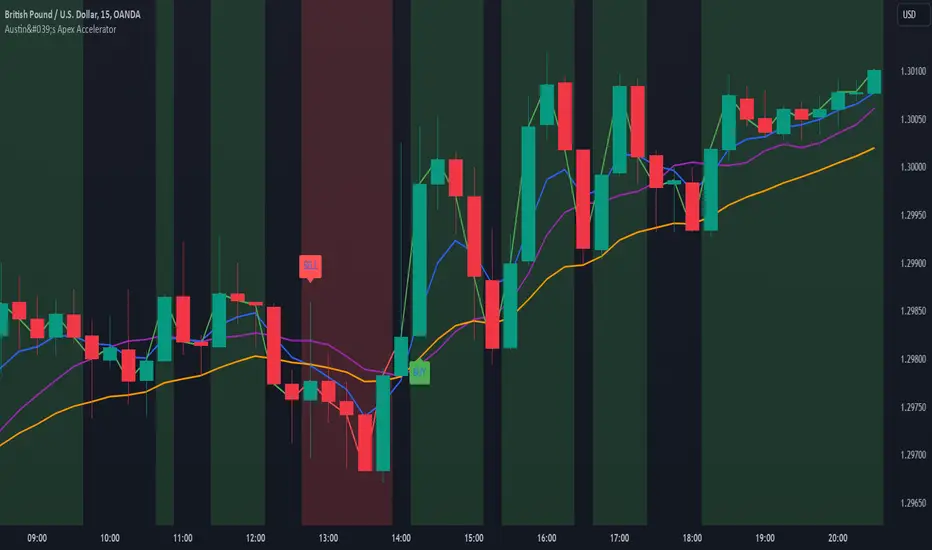
This indicator is designed for traders who seek high-probability breakout trades using a combination of Exponential Moving Averages (EMAs), the previous day's high, and a 7-day Simple Moving Average (SMA) trailing stop. It helps identify bullish and bearish crossover signals while ensuring confirmation with price action above or below key levels.
How It Works
1. Entry Signals:
✅ Bullish Entry:
The 9 EMA crosses above the 15 EMA (bullish momentum).
The price is above the previous day’s high (confirming a breakout).
The candle closes above the open (bullish confirmation).
✅ Bearish Entry:
The 9 EMA crosses below the 15 EMA (bearish momentum).
The price is below the previous day’s high (confirming a failure to break higher).
The candle closes below the open (bearish confirmation).
2. Exit Strategy (Trailing Stop):
📌 Long Exit: If in a long trade, exit when the price closes below the 7-day SMA.
📌 Short Exit: If in a short trade, exit when the price closes above the 7-day SMA.
مؤشر Pine Script®