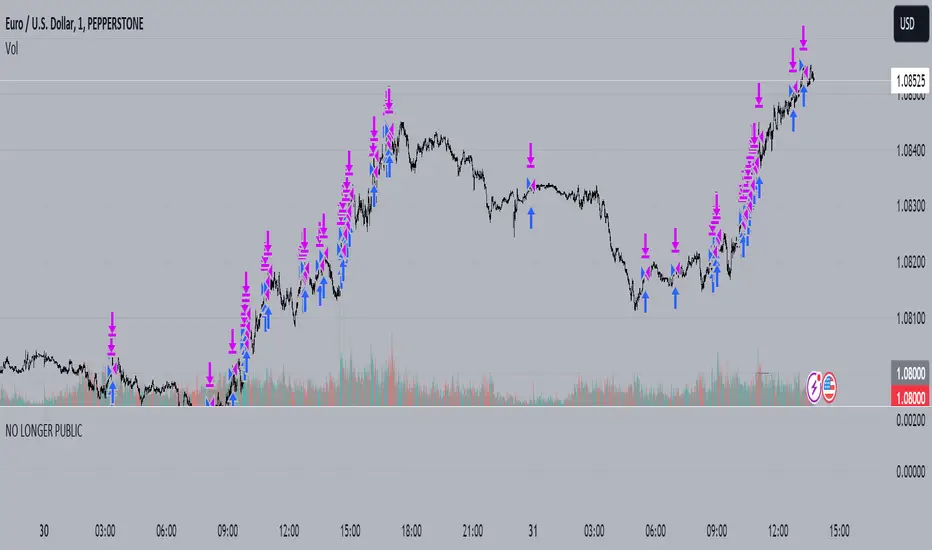
9-20 EMA Crossover with TP and SL9-20 EMA Crossover: This script tracks the crossover of the 9-period EMA and the 20-period EMA.
When the 9 EMA crosses above the 20 EMA, a buy signal is triggered.
When the 9 EMA crosses below the 20 EMA, a sell signal is triggered.
Take Profit and Stop Loss Levels:
The take profit for a long position is set at 3% above the entry price (close * 1.03).
The stop loss for a long position is set at 1% below the entry price (close * 0.99).
The take profit for a short position is set at 3% below the entry price (close * 0.97).
The stop loss for a short position is set at 1% above the entry price (close * 1.01).
Leverage: The strategy uses 20x leverage for both long and short positions (leverage=20).
Alerts: Alerts are set up for the buy signal when the 9 EMA crosses above the 20 EMA and the sell signal when the 9 EMA crosses below the 20 EMA. These alerts can be used with a webhook to trigger trades on Binance Futures.
Strategy:
For long trades: The strategy enters a long position and sets a take profit at 3% above the entry price and a stop loss at 1% below the entry price.
For short trades: The strategy enters a short position and sets a take profit at 3% below the entry price and a stop loss at 1% above the entry price.
ابحث في النصوص البرمجية عن "entry"
Martingale8MARTINGALE8 Indicator: Comprehensive User Guide
Welcome to the MARTINGALE8 Indicator, your ultimate tool for implementing a customizable martingale trading strategy directly on TradingView! Whether you're a beginner trader or an experienced strategist, this indicator offers flexibility and clarity, empowering you to trade with confidence. Let’s dive into how you can make the most of it!
What Is the Martingale Principle?
The martingale strategy is a betting technique often used in gambling and trading. The idea is simple: double down on losing positions so that when a trade eventually succeeds, the profits will recover all previous losses and yield a small profit. In trading, this translates to placing incrementally larger buy orders as the price moves against your initial position, assuming the price will eventually reverse in your favor.
The martingale principle works under the asumption of mean reversion —that the price will eventually recover to a point where all accumulated losses are recouped, and a profit is made. By increasing order sizes at lower levels, the average entry price moves closer to the current price, reducing the price move required to reach profitability. However, like any strategy, it carries risks — if the price continues to move against your position without reversing, losses can escalate quickly .
What Does MARTINGALE8 Do?
The MARTINGALE8 Indicator is an open source script designed to:
Calculate multiple price levels (buy and take-profit) using a martingale strategy.
Allow full customization of entry size, order deviation, profit targets, and order multipliers.
Visualize key trading levels directly on the chart for better decision-making.
Provide helpful labels with real-time metrics like total cost, range analysis, and high-volume bar prices.
This indicator is ideal for traders looking to automate and refine their martingale-based trading approaches.
Features
1. Customizable Inputs
You have complete control over key parameters:
Start Price: Set a custom starting price, or let it default to the market price.
Entry Size: Choose your initial trade size (default: equivalent to 7.5 USDT).
Order Multiplier: Adjust the size of each subsequent order in the martingale sequence.
Order Deviation: Define the percentage deviation for each buy level.
Profit Deviation: Determine the target percentage deviation for take-profit levels.
Length: Specify the lookback period for market analysis (default: 84 bars).
2. Market Analysis
The script calculates key metrics, including:
Highest Volume Bar (HVB): Identifies the bar with the highest trading volume in the selected period.
Range Analysis: Computes the high-to-low range percentage to help you understand market volatility.
3. Martingale Levels
Automatically generates :
10 Buy Levels: Strategically placed below the starting price.
Take-Profit Level: A target above the starting price based on the profit deviation.
4. Cost Calculation
The script calculates the total cost of all orders, including a 10% buffer for safety, so you can plan your capital allocation effectively.
5. Visual Elements
The indicator draws clean and intuitive lines for:
Take-Profit Level: Highlighted in fuchsia.
Buy Levels: Clearly marked with aqua lines.
Zero Line: Your base price, shown in white.
Additional labels provide:
A summary of key metrics like total cost, entry price, and range.
Precise price values for the take-profit and lowest buy levels.
How to Use MARTINGALE8
Step 1: Add the Indicator to Your Chart
Click on the “Indicators” tab in TradingView.
Search for “MARTINGALE8” and add it to your chart.
Step 2: Configure the Inputs
Navigate to the Settings menu of the indicator and adjust the following parameters:
Start Price : Set your starting price or leave it as 0 to use the current market price.
Entry Size : Define the size of your initial trade (e.g., 7.5 USDT).
Order Multiplier : Choose how much larger each subsequent order should be.
Order Deviation : Specify the percentage distance between buy levels.
Profit Deviation : Set your desired percentage for the take-profit level.
Length : Adjust the number of bars to analyze for high volume.
Step 3: Visualize the Levels
The indicator will plot:
A white line for the base price.
Aqua lines for the buy levels.
A fuchsia line for the take-profit level.
Step 4: Monitor the Labels
Look for the summary label on the chart, which shows:
Total cost of the martingale orders.
Entry price and key market metrics (range, high-volume bar price).
Tips for Optimal Use
Adjust Inputs to Match Market Conditions : Experiment with order and profit deviations to account for volatile or steady markets.
Manage Risk : Use the cost calculation feature to ensure you allocate capital responsibly.
Technical Details
The script is written in Pine Script v6 and uses:
Switch Statements : For flexible default values.
Line Objects : To draw and update key price levels dynamically.
Labels : To display relevant trading metrics.
I’m glad to share this tool with the TradingView community. If you enjoy using MARTINGALE8, please keep it going and share your feedback. Let’s trade smarter, not harder!
Buy/Sell Break and RetestThis script is a Pine Script indicator for TradingView titled **"Buy/Sell Break and Retest"**. Here's a description of its functionality:
### Purpose:
The script identifies potential **buy** and **sell entry levels** based on break-and-retest patterns in the market. It works by analyzing higher timeframe data (e.g., 1-hour) and marking entries on a lower timeframe (e.g., 1-minute).
### Key Features:
1. **Configurable Timeframes**:
- `Analysis Timeframe`: Used for identifying break-and-retest signals (default: 1-hour).
- `Entry Timeframe`: Used for marking and plotting entries (default: 1-minute).
2. **Buy and Sell Signals**:
- A **sell entry** is triggered when a bearish candle (close < open) is identified in the analysis timeframe.
- A **buy entry** is triggered when a bullish candle (close > open) is identified in the analysis timeframe.
3. **Retest Logic**:
- For sell signals: The retest is validated when the price breaks below the identified sell level.
- For buy signals: The retest is validated when the price breaks above the identified buy level.
4. **Visual Indicators**:
- Entry levels are marked with labels:
- **Buy Entry**: Green labels are placed at bullish candle opens.
- **Sell Entry**: Red labels are placed at bearish candle closes.
- Plots the levels for easy reference:
- **Sell Level**: Displayed as red circles on the chart.
- **Buy Level**: Displayed as green circles on the chart.
5. **Dynamic Updates**:
- Levels are cleared when invalidated by the price action.
### Use Case:
This indicator helps traders spot break-and-retest opportunities by:
- Allowing higher timeframe analysis to determine trend direction and key levels.
- Providing actionable buy and sell entry points on lower timeframes for precision.
Let me know if you'd like further clarification or improvements!
SSL Channel MTFSSL Channel with MTF support, This eliminates the noise of a basic SSL Channel script which is based on ErwinBeckers SSL Channel. So i have used a Multi Time Frame approach to have a clear confirmation of trend and reduce Noise and False signals unlike basic SSL Channel.
This script can be used to determine.
Support/Resistance
High/Low Breakout
Trend Direction
MA candles for Entry
The high and low sma are plotted as SSL CHANNEL when ever the high and low sma cross each other a direction change is observed.
The direction of SSL channel determines the trend of the price. The length of the channel can be changed as required a low value has a high noise and direction can be determined with low accuracy. Increasing the length of SSL channel has high accuracy trend confirmation.
The MTF SSL Channel uses plot from higher timeframe this helps in using SSL Channel as a Price Action Tool. Price when ever crosses over or below the channel determines a breakout. Price tries to move between the High SMA line and Low SMA Line of the SSL Channel rejection, breakouts can be easily observed on a lower timeframe using SSL Channel Plot from a higher timeframe.
I have used 5min/15min chart with MTF SSL from a 1Hr/4Hr and a length of 5 instead of 10. This helps quick direction changes over a period of 1hr to 4hr. Price is trapped within the High SMA and Low SMA lines of SSL Channel. In addition to SSL High Low and average mid line is plotted to additional reference.
Buy Sell Signals are plotted based on crossover of SMA High and Low.
Candle are Plotted Using a SMA with length of 5. This Candle Plot can be used to make an entry based on direction confirmation of SSL. keep in mind the direction of SSL Plot and the candle must be same. Preferably Entry can made above or below the midline of SSL Channel. The Candle Plot eliminates the Noise of traditional Japanese Candlesticks.
Additionally MACD Crossover and MACD Trend line confirmations can be used to confirm a Buy Sell and Entry signals
Alerts are also plotted accordingly.
Precision Trade Zone By KittisakThis indicator is designed for Money Management calculations, helping to facilitate risk management in trading, determining suitable leverage based on acceptable risk, and adjusting the Stop Loss level to align with the calculated leverage.
Abbreviation Descriptions
LR : Suitable Leverage.
EP : Entry Price.
BEP : Break-Even Point (a point where you can move your Stop Loss to prevent losses once the price reaches a certain level).
SL : Stop Loss (a recalculated Stop Loss level to match the leverage. You should use this as the Stop Loss price instead of the initial level you set).
TP : Take Profit (a point where you take profit based on the defined risk-reward ratio).
Note
When first activating the indicator, an error may occur, and no output will be displayed. This happens because you must first specify the Entry Price and Stop Loss in the indicator settings.
How Much Leverage Should You Use?
It may seem like a simple question but is difficult to answer.
Method for Calculating Suitable Leverage
Use the formula:
Leverage = Acceptable Loss / (Distance between Entry Price and Stop Loss + (Buy Fee + Sell Fee))
Calculating the Correct Stop Loss Point
(Stop Loss levels will be slightly adjusted or extended)
For Long Positions :
New Stop Loss = Entry Price * (1 - Acceptable Loss / (Calculated Leverage * 100))
For Short Positions :
New Stop Loss = Entry Price * (1 + Acceptable Loss / (Calculated Leverage * 100))
Calculating the Correct Take Profit Point
(Take Profit levels will be slightly adjusted or extended)
For Long Positions :
Take Profit = Entry Price * (1 + (Acceptable Loss / (Calculated Leverage * 100) * RR) + ((Buy Fee + Sell Fee) / 100))
For Short Positions :
Take Profit = Entry Price * (1 - (Acceptable Loss / (Calculated Leverage * 100) * RR) + ((Buy Fee + Sell Fee) / 100))
Benefits of This Calculation
1. Accurate Risk Assessment
The calculated leverage accounts for trading fees. For example, if you aim for a 2% loss, this method ensures the actual loss is exactly 2%, not more (e.g., 2% plus fees).
2. Eliminates Guesswork
Randomly setting leverage can lead to risks because the Stop Loss level may not align with your position. This calculation ensures that the leverage aligns precisely with your desired Stop Loss level.
3. Realistic Profit Targets
For example, with a 2% acceptable loss and a 1:2 RR, you expect a 4% profit. However, without this calculation, fees may reduce your profit below 4%. This method includes fees, ensuring your profit matches the intended target.
Caution
This indicator does not account for slippage or requotes. Use it with caution and allow a buffer for slippage in your calculations.
Indicator นี้มีไว้สำหรับคำนวณ Money Management ซึ่งจะช่วยอำนวยความสะดวกในการจัดการความเสี่ยงในการเทรด การคำนวณ Leverage ที่เหมาะสมกับความเสี่ยงที่คุณยอมรับได้ และจัดการจุด Stop Loss ให้เหมาะสมกับ Leverage นั้น
คำอธิบายเกี่ยวกับคำย่อ
LR หมายถึง Leverage ที่เหมาะสม
EP หมายถึง Entry Price หรือราคาเข้าซื้อ
BEP หมายถึง Break-Even Point หรือจุดคุ้มทุน (คุณสามารถย้าย Stop Loss มาที่จุดนี้เมื่อราคาไปถึงจุดหนึ่งเพื่อป้องกันการขาดทุนได้)
SL หมายถึง Stop Loss (ซึ่งเป็น Stop Loss ที่คำนวณใหม่เพื่อให้ตำแหน่งเหมาะสมกับ Leverage ที่คำนวณได้ คุณควรใช้จุดนี้เพื่อเป็นราคา Stop Loss แทนจุด Stop Loss ที่คุณกำหนดไว้ในตอนแรก)
TP หมายถึง Take Profit (เป็นจุดที่คุณจะขายทำกำไรตาม RR ที่กำหนดไว้)
* หมายเหตุ เมื่อเริ่มเปิด Indicator จะเกิด Error ขึ้น และไม่มีผลลัพท์ใด ๆ แสดงให้เห็น นั่นเป็นเพราะคุณต้องเข้าไปกำหนด Entry Price และ Stop Loss ในการตั้งค่าของ Indicator เสียก่อน
ต้องใช้ Leverage เท่าไหร่? มันเป็นคำถามที่ดูเหมือนง่าย แต่ตอบยาก
วิธีคำนวณ Leverage ที่เหมาะสม ใช้สมการคือ
Levarage = การขาดทุนที่ยอมรับได้ / (ระยะห่างระหว่าง Entry Price และ Stop Loss + (ค่าธรรมเนียมซื้อ + ค่าธรรมเนียมขาย))
นำผลลัพท์ Leverage ที่ได้มาคำนวณเพื่อหาจุด Stop Loss ที่ถูกต้อง (จุดของ Stop Loss จะมีการยืดขยายออกไปเล็กน้อย) โดยใช้สมการ
ตำแหน่ง Stop Loss ใหม่ = Entry Price * (1 - การขาดทุนที่ยอมรับได้ / (Leverage ที่คำนวณได้ * 100)) // สำหรับ Long
ตำแหน่ง Stop Loss ใหม่ = Entry Price * (1 + การขาดทุนที่ยอมรับได้ / (Leverage ที่คำนวณได้ * 100)) // สำหรับ Short
นำผลลัพท์ Leverage ที่ได้มาคำนวณเพื่อหาจุด Take Profit ที่ถูกต้อง (จุดของ Take Profit จะมีการยืดขยายออกไปเล็กน้อย) โดยใช้สมการ
ตำแหน่ง Take Profit = Entry Price * (1 + (การขาดทุนที่ยอมรับได้ / (Leverage ที่คำนวณได้ * 100) * RR) + ((ค่าธรรมเนียมซื้อ + ค่าธรรมเนียมขาย) / 100)) // สำหรับ Long
ตำแหน่ง Take Profit = Entry Price * (1 - (การขาดทุนที่ยอมรับได้ / (Leverage ที่คำนวณได้ * 100) * RR) + ((ค่าธรรมเนียมซื้อ + ค่าธรรมเนียมขาย) / 100)) // สำหรับ Short
ข้อดีของการคำนวณคือ
1. คุณจะได้ค่า Leverage ที่เหมาะสมกับความเสี่ยงที่คุณยอมรับได้โดยรวมค่าธรรมเนียมเข้าไปในนั้นแล้ว นั่นหมายความว่า ความสูญเสียจะเป็น 2% (ตามตัวอย่าง) จริง ๆ ไม่ใช่ 2% และถูกหักค่าธรรมเนียมเพิ่มอีก กลายเป็นสูญเสียมากกว่า 2%
2. การตั้ง Leverage มั่ว ๆ กลายเป็นความเสี่ยง นั่นเพราะตำแหน่งของ Stop Loss ไม่ได้อยู่ในจุดที่ควรจะเป็น การคำนวณนี้ช่วยให้คุณได้ Leverage ในตำแหน่ง Stop Loss ที่คุณต้องการโดยแท้จริง
3. ผลกำไรที่ได้รับตรงกับความต้องการจริง ๆ เช่น การขาดทุนที่ยอมรับได้ 2% และ RR 1:2 สิ่งที่คุณคิดคือกำไร 4% แต่จริง ๆ แล้วไม่ถึง 4% นั่นเพราะว่าโดนหักค่าธรรมเนียมไปส่วนหนึ่ง การคำนวณนี้ได้รวมค่าธรรมเนียมให้แล้ว คุณจึงได้กำไรที่ 4% อย่างถูกต้องตามต้องการ
ข้อควรระวัง
Indicator นี้ไม่ได้มีการควบคุมความเสี่ยงในเรื่องของ slippage หรือ requote โปรดใช้งานอย่างระมัดระวังและมีการเผื่อระยะสำหรับ slippage ด้วย
Mean Reversion Pro Strategy [tradeviZion]Mean Reversion Pro Strategy : User Guide
A mean reversion trading strategy for daily timeframe trading.
Introduction
Mean Reversion Pro Strategy is a technical trading system that operates on the daily timeframe. The strategy uses a dual Simple Moving Average (SMA) system combined with price range analysis to identify potential trading opportunities. It can be used on major indices and other markets with sufficient liquidity.
The strategy includes:
Trading System
Fast SMA for entry/exit points (5, 10, 15, 20 periods)
Slow SMA for trend reference (100, 200 periods)
Price range analysis (20% threshold)
Position management rules
Visual Elements
Gradient color indicators
Three themes (Dark/Light/Custom)
ATR-based visuals
Signal zones
Status Table
Current position information
Basic performance metrics
Strategy parameters
Optional messages
📊 Strategy Settings
Main Settings
Trading Mode
Options: Long Only, Short Only, Both
Default: Long Only
Position Size: 10% of equity
Starting Capital: $20,000
Moving Averages
Fast SMA: 5, 10, 15, or 20 periods
Slow SMA: 100 or 200 periods
Default: Fast=5, Slow=100
🎯 Entry and Exit Rules
Long Entry Conditions
All conditions must be met:
Price below Fast SMA
Price below 20% of current bar's range
Price above Slow SMA
No existing position
Short Entry Conditions
All conditions must be met:
Price above Fast SMA
Price above 80% of current bar's range
Price below Slow SMA
No existing position
Exit Rules
Long Positions
Exit when price crosses above Fast SMA
No fixed take-profit levels
No stop-loss (mean reversion approach)
Short Positions
Exit when price crosses below Fast SMA
No fixed take-profit levels
No stop-loss (mean reversion approach)
💼 Risk Management
Position Sizing
Default: 10% of equity per trade
Initial capital: $20,000
Commission: 0.01%
Slippage: 2 points
Maximum one position at a time
Risk Control
Use daily timeframe only
Avoid trading during major news events
Consider market conditions
Monitor overall exposure
📊 Performance Dashboard
The strategy includes a comprehensive status table displaying:
Strategy Parameters
Current SMA settings
Trading direction
Fast/Slow SMA ratio
Current Status
Active position (Flat/Long/Short)
Current price with color coding
Position status indicators
Performance Metrics
Net Profit (USD and %)
Win Rate with color grading
Profit Factor with thresholds
Maximum Drawdown percentage
Average Trade value
📱 Alert Settings
Entry Alerts
Long Entry (Buy Signal)
Short Entry (Sell Signal)
Exit Alerts
Long Exit (Take Profit)
Short Exit (Take Profit)
Alert Message Format
Strategy name
Signal type and direction
Current price
Fast SMA value
Slow SMA value
💡 Usage Tips
Consider starting with Long Only mode
Begin with default settings
Keep track of your trades
Review results regularly
Adjust settings as needed
Follow your trading plan
⚠️ Disclaimer
This strategy is for educational and informational purposes only. It is not financial advice. Always:
Conduct your own research
Test thoroughly before live trading
Use proper risk management
Consider your trading goals
Monitor market conditions
Never risk more than you can afford to lose
📋 Release Notes
14 January 2025
Added New Fast & Slow SMA Options:
Fibonacci-based periods: 8, 13, 21, 144, 233, 377
Additional period: 50
Complete Fast SMA options now: 5, 8, 10, 13, 15, 20, 21, 34, 50
Complete Slow SMA options now: 100, 144, 200, 233, 377
Bug Fixes:
Fixed Maximum Drawdown calculation in the performance table
Now using strategy.max_drawdown_percent for accurate DD reporting
Previous version showed incorrect DD values
Performance metrics now accurately reflect trading results
Performance Note:
Strategy tested with Fast/Slow SMA 13/377
Test conducted with 10% equity risk allocation
Daily Timeframe
For Beginners - How to Modify SMA Levels:
Find this line in the code:
fastLength = input.int(title="Fast SMA Length", defval=5, options= )
To add a new Fast SMA period: Add the number to the options list, e.g.,
To remove a Fast SMA period: Remove the number from the options list
For Slow SMA, find:
slowLength = input.int(title="Slow SMA Length", defval=100, options= )
Modify the options list the same way
⚠️ Note: Keep the periods that make sense for your trading timeframe
💡 Tip: Test any new combinations thoroughly before live trading
"Trade with Discipline, Manage Risk, Stay Consistent" - tradeviZion
IU Trailing Stop Loss MethodsThe 'IU Trailing Stop Loss Methods' it's a risk management tool which allows users to apply 12 trailing stop-loss (SL) methods for risk management of their trades and gives live alerts when the trailing Stop loss has hit. Below is a detailed explanation of each input and the working of the Script.
Main Inputs:
- bar_time: Specifies the date from which the trade begins and entry price will be the open of the first candle.
- entry_type: Choose between 'Long' or 'Short' positions.
- trailing_method: Select the trailing stop-loss method. Options include ATR, Parabolic SAR, Supertrend, Point/Pip based, Percentage, EMA, Highest/Lowest, Standard Deviation, and multiple target-based methods.
- exit_after_close: If checked, exits the trade only after the candle closes.
Optional Inputs:
ATR Settings:
- atr_Length: Length for the ATR calculation.
- atr_factor: ATR multiplier for SL calculation.
Parabolic SAR Settings:
- start, increment, maximum: Parameters for the Parabolic SAR indicator.
Supertrend Settings:
- supertrend_Length, supertrend_factor: Length and factor for the Supertrend indicator.
Point/Pip Based:
- point_base: Set trailing SL in points/pips.
Percentage Based:
- percentage_base: Set SL as a percentage of entry price.
EMA Settings:
- ema_Length: Length for EMA calculation.
Standard Deviation Settings:
- std_Length, std_factor: Length and factor for standard deviation calculation.
Highest/Lowest Settings:
- highest_lowest_Length: Length for the highest/lowest SL calculation.
Target-Based Inputs:
- ATR, Point, Percentage, and Standard Deviation based target SL settings with customizable lengths and multipliers.
Entry Logic:
- Trades initiate based on the entry_type selected and the specified bar_time.
- If Long is selected, a long trade is initiated when the conditions match, and vice versa for Short.
Trailing Stop-Loss (SL) Methods Explained:
The strategy dynamically adjusts stop-loss based on the chosen method. Each method has its calculation logic:
- ATR: Stop-loss calculated using ATR multiplied by a user-defined factor.
- Parabolic SAR: Uses the Parabolic SAR indicator for trailing stop-loss.
- Supertrend: Utilizes the Supertrend indicator as the stop-loss line.
- Point/Pip Based: Fixed point-based stop-loss.
- Percentage Based: SL set as a percentage of entry price.
- EMA: SL based on the Exponential Moving Average.
- Highest/Lowest: Uses the highest high or lowest low over a specified period.
- Standard Deviation: SL calculated using standard deviation.
Exit Conditions:
- If exit_after_close is enabled, the position will only close after the candle confirms the stop-loss hit.
- If exit_after_close is disabled, the strategy will close the trade immediately when the SL is breached.
Visualization:
The script plots the chosen trailing stop-loss method on the chart for easy visualization.
Target-Based Trailing SL Logic:
- When a position is opened, the strategy calculates the initial stop-loss and progressively adjusts it as the price moves favorably.
- Each SL adjustment is stored in an array for accurate tracking and visualization.
Alerts and Labels:
- When the Entry or trailing stop loss is hit this scripts draws a label and give alert to the user that trailing stop has been hit for the trade.
Note - on the historical data The Script will show nothing if the entry and the exit has happened on the same candle, because we don't know what was hit first SL or TP (basically how the candle was formed on the lower timeframe).
Summary:
This script offers flexible trailing stop-loss options for traders who want dynamic risk management in their strategies. By offering multiple methods like ATR, SAR, Supertrend, and EMA, it caters to various trading styles and risk preferences.
00 Averaging Down Backtest Strategy by RPAlawyer v21FOR EDUCATIONAL PURPOSES ONLY! THE CODE IS NOT YET FULLY DEVELOPED, BUT IT CAN PROVIDE INTERESTING DATA AND INSIGHTS IN ITS CURRENT STATE.
This strategy is an 'averaging down' backtester strategy. The goal of averaging/doubling down is to buy more of an asset at a lower price to reduce your average entry price.
This backtester code proves why you shouldn't do averaging down, but the code can be developed (and will be developed) further, and there might be settings even in its current form that prove that averaging down can be done effectively.
Different averaging down strategies exist:
- Linear/Fixed Amount: buy $1000 every time price drops 5%
- Grid Trading: Placing orders at price levels, often with increasing size, like $1000 at -5%, $2000 at -10%
- Martingale: doubling the position size with each new entry
- Reverse Martingale: decreasing position size as price falls: $4000, then $2000, then $1000
- Percentage-Based: position size based on % of remaining capital, like 10% of available funds at each level
- Dynamic/Adaptive: larger entries during high volatility, smaller during low
- Logarithmic: position sizes increase logarithmically as price drops
Unlike the above average costing strategies, it applies averaging down (I use DCA as a synonym) at a very strong trend reversal. So not at a certain predetermined percentage negative PNL % but at a trend reversal signaled by an indicator - hence it most closely resembles a dynamically moving grid DCA strategy.
Both entering the trade and averaging down assume a strong trend. The signals for trend detection are provided by an indicator that I published under the name '00 Parabolic SAR Trend Following Signals by RPAlawyer', but any indicator that generates numeric signals of 1 and -1 for buy and sell signals can be used.
The indicator must be connected to the strategy: in the strategy settings under 'External Source' you need to select '00 Parabolic SAR Trend Following Signals by RPAlawyer: Connector'. From this point, the strategy detects when the indicator generates buy and sell signals.
The strategy considers a strong trend when a buy signal appears above a very conservative ATR band, or a sell signal below the ATR band. The conservative ATR is chosen to filter ranging markets. This very conservative ATR setting has a default multiplier of 8 and length of 40. The multiplier can be increased up to 10, but there will be very few buy and sell signals at that level and DCA requirements will be very high. Trade entry and DCA occur at these strong trends. In the settings, the 'ATR Filter' setting determines the entry condition (e.g., ATR Filter multiplier of 9), and the 'DCA ATR' determines when DCA will happen (e.g., DCA ATR multiplier of 6).
The DCA levels and DCA amounts are determined as follows:
The first DCA occurs below the DCA Base Deviation% level (see settings, default 3%) which acts as a threshold. The thick green line indicates the long position avg price, and the thin red line below the green line indicates the 3% DCA threshold for long positions. The thick red line indicates the short position avg price, and the thin red line above the thick red line indicates the short position 3% DCA threshold. DCA size multiplier defines the DCA amount invested.
If the loss exceeds 3% AND a buy signal arrives below the lower ATR band for longs, or a sell signal arrives above the upper ATR band for shorts, then the first DCA will be executed. So the first DCA won't happen at 3%, rather 3% is a threshold where the additional condition is that the price must close above or below the ATR band (let's say the first DCA occured at 8%) – this is why the code resembles a dynamic grid strategy, where the grid moves such that alongside the first 3% threshold, a strong trend must also appear for DCA. At this point, the thick green/red line moves because the avg price is modified as a result of the DCA, and the thin red line indicating the next DCA level also moves. The next DCA level is determined by the first DCA level, meaning modified avg price plus an additional +8% + (3% * the Step Scale Multiplier in the settings). This next DCA level will be indicated by the modified thin red line, and the price must break through this level and again break through the ATR band for the second DCA to occur.
Since all this wasn't complicated enough, and I was always obsessed by the idea that when we're sitting in an underwater position for days, doing DCA and waiting for the price to correct, we can actually enter a short position on the other side, on which we can realize profit (if the broker allows taking hedge positions, Binance allows this in Europe).
This opposite position in this strategy can open from the point AFTER THE FIRST DCA OF THE BASE POSITION OCCURS. This base position first DCA actually indicates that the price has already moved against us significantly so time to earn some money on the other side. Breaking through the ATR band is also a condition for entry here, so the hedge position entry is not automatic, and the condition for further DCA is breaking through the DCA Base Deviation (default 3%) and breaking through the ATR band. So for the 'hedge' or rather opposite position, the entry and further DCA conditions are the same as for the base position. The hedge position avg price is indicated by a thick black line and the Next Hedge DCA Level is indicated by a thin black line.
The TPs are indicated by green labels for base positions and red labels for hedge positions.
No SL built into the strategy at this point but you are free to do your coding.
Summary data can be found in the upper right corner.
The fantastic trend reversal indicator Machine learning: Lorentzian Classification by jdehorty can be used as an external indicator, choose 'backtest stream' for the external source. The ATR Band multiplicators need to be reduced to 5-6 when using Lorentz.
The code can be further developed in several aspects, and as I write this, I already have a few ideas 😊
EBL - Enigma BOS LogicThe EBL - Enigma BOS Logic indicator is designed to detect key trend reversal points with precision by leveraging a unique concept based on two-candle price action analysis. Inspired by the balance of pairs in creation, this indicator identifies trend changes by focusing on significant bullish and bearish candle pairs, storing key levels, and waiting for confirmation to provide actionable trade signals. It goes beyond conventional trend-following indicators by offering real-time alerts and clear visual cues for traders.
How It Works
Bullish Setup:
The indicator identifies a bullish candle followed by a bearish candle. It then stores the high of the bullish candle as a potential reversal level.
A bullish confirmation occurs when a future bullish candle closes above the stored high. When this happens:
A green arrow is plotted below the confirming candle.
A horizontal green line is drawn at the stored high level, extending forward by a user-defined number of bars.
An alert is triggered to notify the trader of a confirmed bullish trend.
Bearish Setup:
The indicator identifies a bearish candle followed by a bullish candle. It stores the low of the bearish candle as a potential reversal level.
A bearish confirmation occurs when a future bearish candle closes below the stored low. When this happens:
A red arrow is plotted above the confirming candle.
A horizontal red line is drawn at the stored low level, extending forward by a user-defined number of bars.
An alert is triggered to notify the trader of a confirmed bearish trend.
Touch or Cross Alerts:
In addition to initial trend confirmation, the indicator tracks price movements relative to the drawn horizontal lines.
If the price returns to touch or cross a previously drawn horizontal line, an alert is triggered, indicating a potential re-entry or retracement opportunity.
Customization Options
To make the indicator versatile and adaptable for different trading styles, several customization options are provided:
Line Colors: Traders can customize the colors of the bullish and bearish lines.
Show/Hide Arrows and Lines: Users can choose whether to display the arrows and horizontal lines on the chart.
Line Length: The length of the horizontal lines (number of bars they extend into the future) is user-defined, offering flexibility based on trading timeframes and preferences.
Use Cases
Trend Reversal Detection: EBL is ideal for identifying key trend reversals, allowing traders to enter trades with a high probability of success.
Breakout Confirmation: The indicator provides visual and alert-based confirmation of breakouts beyond critical support or resistance levels.
Re-entry Opportunities: With alerts for price touching or crossing horizontal lines, traders can spot potential re-entry points during retracements.
Conceptual Foundation
The methodology behind this indicator is rooted in the principle that markets often move in pairs of bullish and bearish forces. By tracking the interaction between consecutive bullish and bearish candles and waiting for clear confirmations, this indicator ensures that only high-probability trend changes are signaled. This reduces noise and enhances trading accuracy, making it suitable for scalping, day trading, and swing trading across various timeframes.
How to Use
Apply the indicator to any chart and timeframe of your choice.
Set your preferred customization options, including line colors, arrow display, and line length.
Watch for arrows and listen for alerts to identify confirmed trend changes.
Pay attention to touch or cross alerts on horizontal lines, as these can signal potential re-entry or secondary trade opportunities.
Combine with other analysis: While EBL is powerful on its own, combining it with support/resistance analysis, moving averages, or volume indicators can further enhance its effectiveness.
This indicator is a powerful tool for traders seeking precision in identifying trend changes and actionable trade signals. Its unique logic, real-time alerts, and clear visual cues make it a valuable addition to any trader’s toolkit.
Fibonacci Trend [ChartPrime]Fibonacci Trend Indicator
This powerful indicator leverages supertrend analysis to detect market direction while overlaying dynamic Fibonacci levels to highlight potential support, resistance, and optimal trend entry zones. With its straightforward design, it is perfect for traders looking to simplify their workflow and enhance decision-making.
⯁ KEY FEATURES AND HOW TO USE
⯌ Supertrend Trend Identification :
The indicator uses a supertrend algorithm to identify market direction. It displays purple for downtrends and green for uptrends, ensuring quick and clear trend analysis.
⯌ Fibonacci Levels for Current Swings :
Automatically calculates Fibonacci retracement levels (0.236, 0.382, 0.618, 0.786) for the current swing leg.
- These levels act as key zones for potential support, resistance, and trend continuation.
- The high and low swing points are labeled with exact prices, ensuring clarity.
- If the swing range is insufficient (less than five times ATR), Fibonacci levels are not displayed, avoiding irrelevant data.
⯌ Extended Fibonacci Levels :
User-defined extensions project Fibonacci levels into the future, aiding traders in planning price targets or projecting key zones.
⯌ Optimal Trend Entry Zone :
A filled area between 0.618 and 0.786 levels visually highlights the optimal entry zone for trend continuation. This allows traders to refine their entry points during pullbacks.
⯌ Diagonal Trend Line :
A dashed diagonal line connects the swing high and low, visually confirming the range and trend strength of the current swing.
⯌ Visual Labels for Fibonacci Levels :
Each Fibonacci level is marked with a label displaying its value for quick reference.
⯁ HOW TRADERS CAN POTENTIALLY USE THIS TOOL
Fibonacci Retracements:
Use the Fibonacci retracement levels to find key support or resistance zones where the price may pull back before continuing its trend.
Example: Enter long trades when the price retraces to 0.618–0.786 levels in an uptrend.
Fibonacci Extensions:
Use Fibonacci extensions to project future price targets based on the current trend's swing leg. Levels like 127.2% and 161.8% are commonly used as profit-taking zones.
Reversal Identification:
Spot potential reversals by monitoring price reactions at key Fibonacci retracement levels (e.g., 0.236 or 0.382) or the swing high/low.
Optimal Trend Entries:
The filled zone between 0.618 and 0.786 is a statistically strong area for entering a position in the direction of the trend.
Example: Enter long positions during retracements to this range in an uptrend.
Risk Management:
Set stop-losses below key Fibonacci levels or the swing low/high, and take profits at extension levels, enhancing your trade management strategies.
⯁ CONCLUSION
The Fibonacci Trend Indicator is a straightforward yet effective tool for identifying trends and key Fibonacci levels. It simplifies analysis by integrating supertrend-based trend identification with Fibonacci retracements, extensions, and optimal entry zones. Whether you're a beginner or experienced trader, this indicator is an essential addition to your toolkit for trend trading, reversal spotting, and risk management.
Outside Bar Strategy % (Alessio)Outside Bar Strategy %
This strategy is based on identifying Outside Bars, which occur when the current bar's high is higher than the previous bar's high and its low is lower than the previous bar's low. The strategy enters trades in the direction of the Outside Bar, offering a powerful way to capture price moves following a strong price expansion.
Key Features:
Long and Short Entries: The strategy enters a Long trade when the Outside Bar closes bullish (current close > open), and a Short trade when the Outside Bar closes bearish (current close < open).
Customizable Entry Levels: The entry point is calculated based on a customizable percentage of the Outside Bar's range, allowing flexibility for traders to fine-tune their entries at 50% or 70% of the bar's range.
Stop Loss (SL) and Take Profit (TP):
Stop Loss (SL) is automatically placed at the Outside Bar's low for Long trades and at its high for Short trades.
Take Profit (TP) is calculated as a percentage of the Outside Bar's range, with customizable settings for take-profit levels.
Visual Indicators:
Entry, Stop Loss, and Take Profit levels are plotted as lines on the chart, with customizable colors and widths for easy identification.
Labels are placed on the chart to indicate whether the trade is Long or Short, positioned above or below the Outside Bar's candlestick.
Alerts: Users can enable alerts to receive notifications when a trade is triggered, including details such as entry points and stop loss levels.
Strategy Parameters:
Entry Percentage: Set the entry level as a percentage of the Outside Bar's range (e.g., 50%, 70%).
Take Profit Percentage: Customize the Take Profit level as a percentage of the Outside Bar's range.
Customizable Colors and Line Widths: Adjust the colors and thickness of the entry, stop loss, and take profit lines to fit your preferences.
Alerts: Enable alerts to be notified when a trade is executed or when the entry level is reached.
This strategy is ideal for traders who want to capitalize on significant price moves after a breakout, with clear risk management through Stop Loss and Take Profit levels. The customizable features make it suitable for various market conditions and trading styles.
Stop Loss & TargetHow to Use the SL/TP Indicator
The SL/TP indicator is a versatile tool designed for traders to easily visualize entry, stop-loss (SL), and take-profit (TP) levels on their charts. This guide will walk you through the steps to configure and use the indicator effectively.
Features:
Configure Long Trades and Short Trades independently.
Define Entry Price, Stop Loss, and up to three Take Profit levels for each trade.
Customize line colors for better visualization.
Works for both risk-reward and target-based trading.
Adding the Indicator:
Open the TradingView platform.
Search for the indicator name: SL/TP.
Click the Add to Chart button to apply it.
Configuration:
1. Long Trade Settings
Enable Long Trade: Check this option to activate long trade lines on the chart.
Long Entry Price: Input the price at which you plan to enter the long trade.
Long Stop Loss: Input your stop-loss level for the long trade.
Line Colors: You can customize the colors for the Entry, SL, and TP lines in the Long Trade settings group.
Take Profit Levels (Calculated Automatically):
TP1: 1:1 Risk-Reward ratio (difference between Entry and SL added to Entry).
TP2: 1:2 Risk-Reward ratio.
TP3: 1:3 Risk-Reward ratio.
2. Short Trade Settings
Enable Short Trade: Check this option to activate short trade lines on the chart.
Short Entry Price: Input the price at which you plan to enter the short trade.
Short Stop Loss: Input your stop-loss level for the short trade.
Line Colors: You can customize the colors for the Entry, SL, and TP lines in the Short Trade settings group.
Take Profit Levels (Calculated Automatically):
TP1: 1:1 Risk-Reward ratio (difference between Entry and SL subtracted from Entry).
TP2: 1:2 Risk-Reward ratio.
TP3: 1:3 Risk-Reward ratio.
Visualizing on the Chart:
Once you configure the settings and enable the trade, the indicator will draw horizontal lines on the chart for:
Entry Price
Stop Loss
Take Profit Levels (TP1, TP2, TP3)
Each line will extend to three bars ahead of the current bar index.
Customization:
Adjust colors for better visibility depending on your chart theme.
The width and style of lines can also be modified in the source code if needed.
Example Usage:
Long Trade Example:
Enable Long Trade: Check the box.
Set Entry Price: 100.
Set Stop Loss: 95.
The indicator will draw the following lines:
Entry Line: At 100 (customizable color).
Stop Loss Line: At 95 (customizable color).
TP1 Line: At 105 (1:1 Risk-Reward).
TP2 Line: At 110 (1:2 Risk-Reward).
TP3 Line: At 115 (1:3 Risk-Reward).
Short Trade Example:
Enable Short Trade: Check the box.
Set Entry Price: 200.
Set Stop Loss: 205.
The indicator will draw the following lines:
Entry Line: At 200 (customizable color).
Stop Loss Line: At 205 (customizable color).
TP1 Line: At 195 (1:1 Risk-Reward).
TP2 Line: At 190 (1:2 Risk-Reward).
TP3 Line: At 185 (1:3 Risk-Reward).
Notes:
Ensure that you input valid and realistic price levels for Entry and Stop Loss.
The indicator will only display lines if both the Entry Price and Stop Loss are non-zero.
Use this indicator for planning trades visually but always confirm levels with your trading strategy.
Disclaimer: This indicator is a tool to assist in trading. Use it with proper risk management and your own due diligence.
P/L CalculatorDescription of the P/L Calculator Indicator
The P/L Calculator is a dynamic TradingView indicator designed to provide traders with real-time insights into profit and loss metrics for their trades. It visualizes key levels such as entry price, profit target, and stop-loss, while also calculating percentage differences and net profit or loss, factoring in fees.
Features:
Customizable Input Parameters:
Entry Price: Define the starting price of the trade.
Profit and Stop-Loss Levels (%): Set percentage thresholds for targets and risk levels.
USDT Amount: Specify the trade size for precise calculations.
Trade Type: Choose between "Long" or "Short" positions.
Visual Representation:
Entry Price, Profit Target, and Stop-Loss levels are plotted as horizontal lines on the chart.
Line styles, colors, and thicknesses are fully customizable for better visibility.
Real-Time Metrics:
Percentage difference between the live price and the entry price is calculated dynamically.
Profit/Loss (P/L) and fees are computed in real time to display net profit or loss.
Alerts:
Alerts are triggered when:
The live price hits the profit target.
The live price crosses the stop-loss level.
The price reaches the specified entry level.
A user-defined percentage difference is reached.
Labels and Annotations:
Displays percentage difference, P/L, and fee information in a clear label near the live price.
Custom Fee Integration:
Allows input of trading fees (%), enabling accurate net profit or loss calculations.
Price Scale Visualization:
Displays the percentage difference on the price scale for enhanced context.
Use Case:
The P/L Calculator is ideal for traders who want to monitor their trades' performance and make informed decisions without manually calculating metrics. Its visual cues and alerts ensure you stay updated on critical levels and price movements.
This indicator supports a wide range of trading styles, including swing trading, scalping, and position trading, making it a versatile tool for anyone in the market.
Autonomous 5-Minute RobotKey Components of the Strategy:
Trend Detection:
A 50-period simple moving average (SMA) is used to define the market trend. If the current close is above the SMA, the market is considered to be in an uptrend (bullish), and if it's below, it's considered a downtrend (bearish).
The strategy also looks at the trend over the last 30 minutes (6 candles in a 5-minute chart). The strategy compares the previous close with the current close to detect an uptrend or downtrend.
Volume Analysis:
The strategy calculates buyVolume and sellVolume based on price movement within each candle.
The condition for entering a long position is when the market is in an uptrend, and the buy volume is greater than the sell volume.
The condition for entering a short position is when the market is in a downtrend, and the sell volume is greater than the buy volume.
Trade Execution:
The strategy enters a long position when the trend is up and the buy volume is higher than the sell volume.
The strategy enters a short position when the trend is down and the sell volume is higher than the buy volume.
Positions are closed based on stop-loss and take-profit conditions.
Stop-loss is set at 3% below the entry price.
Take-profit is set at 29% above the entry price.
Exit Conditions:
Long trades will be closed if the price falls 3% below the entry price or rises 29% above the entry price.
Short trades will be closed if the price rises 3% above the entry price or falls 29% below the entry price.
Visuals:
The SMA (50-period) is plotted on the chart to show the trend.
Buy and sell signals are marked with labels on the chart for easy identification.
With this being said this algo is still being worked on to be autonomous
Analyze the Market Direction: Determine whether the market is in an uptrend or downtrend over the past 30 minutes (using the last 6 candles in a 5-minute chart).
Use Trend Indicators and Volume: Implement trend-following indicators like moving averages or the SMA/EMA crossover and consider volume to decide when to enter or exit a trade.
Enter and Exit Trades: The robot will enter long positions when the trend is up and short positions when the trend is down. Additionally, it will close positions based on volume signals and price action (e.g., volume spikes, price reversals).
Nen Star Harmonic Pattern [TradingFinder] NenStar Reversal Auto🔵 Introduction
The Nen-Star Harmonic Pattern is an advanced reversal pattern in technical analysis, designed to identify market trend changes and predict key price reversal points. This pattern is defined by a combination of Fibonacci ratios and critical concepts such as Potential Reversal Zones (PRZ), market structure, and corrective waves.
The key points of this pattern include X, A, B, C, and D, and it appears in both bullish and bearish forms. In its bullish form, the pattern resembles the letter M, while in its bearish form, it takes the shape of W. The critical Fibonacci ratios for this pattern are 0.382 to 0.786 for the XA wave, 1.13 to 1.414 for the AB wave, and 1.272 to 2.618 for the BC wave.
The Nen-Star Harmonic Pattern is one of the most precise tools for identifying market reversals and executing reversal trades. Traders can use it to pinpoint optimal entry and exit points and benefit from high risk-to-reward ratios.
By emphasizing Fibonacci retracement levels, XABCD waves, the formation of bullish and bearish patterns, and precise trade entry points, this pattern has become a practical tool in advanced technical analysis.
Bullish Nen-Star Pattern :
Bearish Nen-Star Pattern :
🔵 How to Use
The Nen-Star Harmonic Pattern indicator allows traders to automatically identify the bullish and bearish structures of this pattern and locate optimal entry and exit points. By accurately analyzing Fibonacci ratios and determining points X, A, B, C, and D, the indicator highlights Potential Reversal Zones (PRZ) on the chart. Traders can rely on the generated signals to manage their trades with greater precision.
🟣 Bullish Nen-Star Pattern
The bullish Nen-Star pattern begins with a price increase from point X to point A, followed by a retracement to point B, which lies between 0.382 and 0.786 of the XA wave.
After this retracement, the price moves to point C, located between 1.13 and 1.414 of the AB wave. The final movement is a price decline to point D, which is between 1.272 and 2.618 of the BC wave and 1.13 to 1.272 of the XA wave.
Point D : Serves as the key Potential Reversal Zone (PRZ).
Entry : A buy trade is initiated at point D, signaling the end of the corrective movement and the beginning of a price increase.
Price Targets :
61.8% retracement of the CD wave
Point A
Point C
1.272 and 1.618 extensions of the CD wave if resistance at point C is broken
Stop Loss : Placed slightly below point D.
🟣 Bearish Nen-Star Pattern
The bearish Nen-Star pattern starts with a price decrease from point X to point A, followed by a retracement to point B, which lies between 0.382 and 0.786 of the XA wave.
After this retracement, the price moves to point C, located between 1.13 and 1.414 of the AB wave. The final movement is a price increase to point D, which is between 1.272 and 2.618 of the BC wave and 1.13 to 1.272 of the XA wave.
Point D : Serves as the key Potential Reversal Zone (PRZ).
Entry : A sell trade is initiated at point D, signaling the end of the corrective movement and the beginning of a price decline.
Price Targets :
61.8% retracement of the CD wave
Point A
Point C
1.272 and 1.618 extensions of the CD wave if support at point C is broken
Stop Loss : Placed slightly above point D.
🔵 Setting
🟣 Logical Setting
ZigZag Pivot Period : You can adjust the period so that the harmonic patterns are adjusted according to the pivot period you want. This factor is the most important parameter in pattern recognition.
Show Valid Forma t: If this parameter is on "On" mode, only patterns will be displayed that they have exact format and no noise can be seen in them. If "Off" is, the patterns displayed that maybe are noisy and do not exactly correspond to the original pattern.
Show Formation Last Pivot Confirm : if Turned on, you can see this ability of patterns when their last pivot is formed. If this feature is off, it will see the patterns as soon as they are formed. The advantage of this option being clear is less formation of fielded patterns, and it is accompanied by the latest pattern seeing and a sharp reduction in reward to risk.
Period of Formation Last Pivot : Using this parameter you can determine that the last pivot is based on Pivot period.
🟣 Genaral Setting
Show : Enter "On" to display the template and "Off" to not display the template.
Color : Enter the desired color to draw the pattern in this parameter.
LineWidth : You can enter the number 1 or numbers higher than one to adjust the thickness of the drawing lines. This number must be an integer and increases with increasing thickness.
LabelSize : You can adjust the size of the labels by using the "size.auto", "size.tiny", "size.smal", "size.normal", "size.large" or "size.huge" entries.
🟣 Alert Setting
Alert : On / Off
Message Frequency : This string parameter defines the announcement frequency. Choices include: "All" (activates the alert every time the function is called), "Once Per Bar" (activates the alert only on the first call within the bar), and "Once Per Bar Close" (the alert is activated only by a call at the last script execution of the real-time bar upon closing). The default setting is "Once per Bar".
Show Alert Time by Time Zone : The date, hour, and minute you receive in alert messages can be based on any time zone you choose. For example, if you want New York time, you should enter "UTC-4". This input is set to the time zone "UTC" by default.
🔵 Conclusion
The Nen-Star Harmonic Pattern is a highly effective analytical tool in global financial markets, playing a crucial role in identifying reversal points and market trend changes. By leveraging Fibonacci principles and price structure, this pattern enables precise analysis across various assets, including stocks, cryptocurrencies, forex, and commodities.
Traders operating in global markets can use this pattern to identify high risk-to-reward trading opportunities. Its clear entry and exit points, defined Potential Reversal Zones (PRZ), and accurate price targets make it an excellent tool for risk management and profitability enhancement.
In the global context, the Nen-Star pattern is widely used by professional analysts in both advanced and emerging markets due to its versatility in analyzing long-term and short-term charts. Beyond trend prediction, it enhances trading strategies and optimizes investment decisions.
Combining this pattern with complementary tools such as volume analysis, technical indicators, and macroeconomic conditions can provide traders with deeper market insights, helping them capitalize on global opportunities.
4Vietnamese 3x SupertrendThis strategy attempts to capture long positions in the Vietnamese stock market using a combination of three Supertrend indicators and additional filters. It utilizes pyramiding to enter up to three long positions with a 33.33% allocation each.
Key Elements:
Supertrend Indicators: Three Supertrend indicators are used with different lengths and multipliers to identify potential trend changes.
Entry Conditions:
The strategy looks for a downtrend on the slowest Supertrend (Supertrend3) followed by uptrends on the medium (Supertrend2) and fast (Supertrend1) Supertrends.
Alternatively, if Supertrend3 is still downtrending, but Supertrend1 is downtrending and a significant previous high (highestGreen) exists, an entry signal is generated.
An optional filter allows using the highest of the last two red candles for highestGreen calculation.
Entry Stop Loss:
An optional stop loss can be set based on the entry price of previous long positions, preventing further losses if the price falls below entry prices.
Exit Conditions:
Three exit options are available:
- All Downtrend Exit: Close all positions if all Supertrends turn uptrend and a bearish candlestick pattern (close price lower than open price) is formed.
- Average Price in Loss Exit: Close all positions if the average entry price of open positions is higher than the current closing price (indicating a loss).
- All Positions in Loss Exit: Close all positions if any of the following conditions are met:
A single open position exists, and its entry price is higher than the current close price.
Two open positions exist, and their entry prices are both higher than the current close price.
Three open positions exist, and their entry prices are all higher than the current close price.
Pyramiding: The strategy allows entering up to three long positions with a fixed allocation of 33.33% each.
Customization Options:
The strategy provides various input parameters to customize its behavior:
Supertrend lengths and multipliers for each indicator.
Option to use the highest of the last two red candles for highestGreen calculation.
Enabling/disabling Entry Stop Loss and different exit conditions.
Further Enhancements:
Explore additional entry and exit filters to refine trade signals.
Consider incorporating risk management techniques like position sizing and trailing stops.
Backtest the strategy with historical data to evaluate its effectiveness and identify potential areas for improvement.
Fibonacci Trading Strategy (Auto Levels)How It Works
Swing Highs and Lows Detection:
The script identifies the highest high and lowest low over a specified lookback period (default: 50 candles). These points are used as the basis for Fibonacci calculations.
Fibonacci Levels:
Fibonacci retracement levels: 0%, 38.2%, 50%, 61.8%, 78.6%, and 100%.
Fibonacci extension levels: 127.2%, 161.8%, 200%, 261.8%, and 361.8%.
Each level is plotted on the chart with a specific color and labeled with the corresponding price.
Entry Zones:
Pullback Area: Between the 50% and 61.8% retracement levels. This area is highlighted in green, indicating a potential entry for conservative traders.
Full Margin Area: Between the 61.8% and 78.6% retracement levels. This area is highlighted in red, suggesting a higher-risk entry for aggressive traders.
Stop Loss (SL):
The Stop Loss is placed at the 78.6% Fibonacci retracement level. A dotted red line is drawn at this level to provide a visual reference for risk management.
Entry labels include the Stop Loss price for clarity.
Take Profit (TP) Levels:
Multiple take-profit targets are identified using Fibonacci extension levels (127.2%, 161.8%, 200%, 261.8%, and 361.8%).
Each level is labeled with the price and target percentage.
Visual Aids:
The script dynamically labels each Fibonacci level with its corresponding price.
Entry points (Pullback and Full Margin) are marked with clear labels, including the recommended Stop Loss.
Background highlights help distinguish the Pullback and Full Margin areas.
Strategy Highlights
Risk Management:
Incorporates a well-defined Stop Loss at the 78.6% level to limit downside risk.
Multiple take-profit levels help traders scale out of positions gradually.
Automation:
Automatically recalculates levels when new swing highs or lows are detected, ensuring accuracy in dynamic markets.
Customizability:
Users can adjust the lookback period to suit different timeframes or trading styles.
Clarity:
Clean visuals and detailed labels ensure the strategy is easy to interpret and apply.
When to Use
The strategy is suitable for trend-following traders looking to enter during pullbacks in an established trend.
It works best in trending markets where Fibonacci levels often act as strong support or resistance.
Example Scenario
Bullish Setup:
Price retraces to the 50%-61.8% area (Pullback Area) after a swing high.
A buy order is placed in this zone, with the Stop Loss at the 78.6% level.
Profit targets are set at the 127.2%, 161.8%, and higher Fibonacci extensions.
Bearish Setup:
In a downtrend, price retraces upward to the 50%-61.8% zone.
A sell order is placed, with the Stop Loss at the 78.6% level and take-profit levels below.
EMA Crossover Strategy with Take Profit and Candle HighlightingStrategy Overview:
This strategy is based on the Exponential Moving Averages (EMA), specifically the EMA 20 and EMA 50. It takes advantage of EMA crossovers to identify potential trend reversals and uses multiple take-profit levels and a stop-loss for risk management.
Key Components:
EMA Crossover Signals:
Buy Signal (Uptrend): A buy signal is generated when the EMA 20 crosses above the EMA 50, signaling the start of a potential uptrend.
Sell Signal (Downtrend): A sell signal is generated when the EMA 20 crosses below the EMA 50, signaling the start of a potential downtrend.
Take Profit Levels:
Once a buy or sell signal is triggered, the strategy calculates multiple take-profit levels based on the range of the previous candle. The user can define multipliers for each take-profit level.
Take Profit 1 (TP1): 50% of the previous candle's range above or below the entry price.
Take Profit 2 (TP2): 100% of the previous candle's range above or below the entry price.
Take Profit 3 (TP3): 150% of the previous candle's range above or below the entry price.
Take Profit 4 (TP4): 200% of the previous candle's range above or below the entry price.
These levels are adjusted dynamically based on the previous candle's high and low, so they adapt to changing market conditions.
Stop Loss:
A stop-loss is set to manage risk. The default stop-loss is 3% from the entry price, but this can be adjusted in the settings. The stop-loss is triggered if the price moves against the position by this amount.
Trend Direction Highlighting:
The strategy highlights the bars (candles) with colors:
Green bars indicate an uptrend (when EMA 20 crosses above EMA 50).
Red bars indicate a downtrend (when EMA 20 crosses below EMA 50).
These visual cues help users easily identify the market direction.
Strategy Entries and Exits:
Entries: The strategy enters a long (buy) position when the EMA 20 crosses above the EMA 50 and a short (sell) position when the EMA 20 crosses below the EMA 50.
Exits: The strategy exits the positions at any of the defined take-profit levels or the stop-loss. Multiple exit levels provide opportunities to take profit progressively as the price moves in the favorable direction.
Entry and Exit Conditions in Detail:
Buy Entry Condition (Uptrend):
A buy position is opened when EMA 20 crosses above EMA 50, signaling the start of an uptrend.
The strategy calculates take-profit levels above the entry price based on the previous bar's range (high-low) and the multipliers for TP1, TP2, TP3, and TP4.
Sell Entry Condition (Downtrend):
A sell position is opened when EMA 20 crosses below EMA 50, signaling the start of a downtrend.
The strategy calculates take-profit levels below the entry price, similarly based on the previous bar's range.
Exit Conditions:
Take Profit: The strategy attempts to exit the position at one of the take-profit levels (TP1, TP2, TP3, or TP4). If the price reaches any of these levels, the position is closed.
Stop Loss: The strategy also has a stop-loss set at a default value (3% below the entry for long trades, and 3% above for short trades). The stop-loss helps to protect the position from significant losses.
Backtesting and Performance Metrics:
The strategy can be backtested using TradingView's Strategy Tester. The results will show how the strategy would have performed historically, including key metrics like:
Net Profit
Max Drawdown
Win Rate
Profit Factor
Average Trade Duration
These performance metrics can help users assess the strategy's effectiveness over historical periods and optimize the input parameters (e.g., multipliers, stop-loss level).
Customization:
The strategy allows for the adjustment of several key input values via the settings panel:
Take Profit Multipliers: Users can customize the multipliers for each take-profit level (TP1, TP2, TP3, TP4).
Stop Loss Percentage: The user can also adjust the stop-loss percentage to a custom value.
EMA Periods: The default periods for the EMA 50 and EMA 20 are fixed, but they can be adjusted for different market conditions.
Pros of the Strategy:
EMA Crossover Strategy: A classic and well-known strategy used by traders to identify the start of new trends.
Multiple Take Profit Levels: By taking profits progressively at different levels, the strategy locks in gains as the price moves in favor of the position.
Clear Trend Identification: The use of green and red bars makes it visually easier to follow the market's direction.
Risk Management: The stop-loss and take-profit features help to manage risk and optimize profit-taking.
Cons of the Strategy:
Lagging Indicators: The strategy relies on EMAs, which are lagging indicators. This means that the strategy might enter trades after the trend has already started, leading to missed opportunities or less-than-ideal entry prices.
No Confirmation Indicators: The strategy purely depends on the crossover of two EMAs and does not use other confirming indicators (e.g., RSI, MACD), which might lead to false signals in volatile markets.
How to Use in Real-Time Trading:
Use for Backtesting: Initially, use this strategy in backtest mode to understand how it would have performed historically with your preferred settings.
Paper Trading: Once comfortable, you can use paper trading to test the strategy in real-time market conditions without risking real money.
Live Trading: After testing and optimizing the strategy, you can consider using it for live trading with proper risk management in place (e.g., starting with a small position size and adjusting parameters as needed).
Summary:
This strategy is designed to identify trend reversals using EMA crossovers, with customizable take-profit levels and a stop-loss to manage risk. It's well-suited for traders looking for a systematic way to enter and exit trades based on clear market signals, while also providing flexibility to adjust for different risk profiles and trading styles.
EMA SHIFT & PARALLEL [n_dot]BINANCE:ETHUSDT.P
This strategy was developed for CRYPTO FUTURES, (the settings for ETHUSDT.P) . I aimed for the strategy to function in a live environment, so I focused on making its operation realistic:
When determining the position, only 80% (adjustable) of the available cash is invested to reduce the risk of position liquidation.
I account for a 0.05% commission, typical on the futures market, for each entry and exit.
Concept:
I modified a simple, well-known method: the crossover of two exponential moving averages (FAST, SLOW) generates the entry and exit signals.
I enhanced the base idea as follows:
For the fast EMA, I incorporated a multiplier (offset) to filter out market noise and focus only on strong signals.
I use different EMAs for long and short entry points; both have their own FAST and SLOW EMAs and their own offset. For longs, the FAST EMA is adjusted downward (<1), while for shorts, it is adjusted upward (>1). Consequently, the signal is generated when the modified FAST EMA crosses the SLOW EMA.
Risk Management:
The position includes the following components:
Separate stop-losses for long and short positions.
Separate trailers for long and short positions.
The strategy operates so that the entry point is determined by the EMA crossover, while the exit is governed only by the Stop Loss or Trailer. Optionally, it can be set to close the position at the EMA recrossing ("Close at Signal").
Trailer Operation:
An entry percentage and offset are defined. The trailer activates when the price surpasses the entry price, calculated automatically by the system.
The trailer closes the position when the price drops by the offset percentage from the highest reached price.
Example for trailer:
Purchase Price = 100
Trailer Enter = 5% → Activation Price = 105 (triggers trailer if market price crosses it).
Trailer Offset = 2%
If the price rises to 110, the exit price becomes 107.8.
If the price goes to 120, the exit price becomes 117.6.
If the price falls below 117.6, the trailer closes the position.
Settings:
Source: Determines the market price reference.
End Close: Closes positions at the end of the simulation to avoid "shadow positions" and provide an objective result.
Lot proportional to free cash (%): Only a portion of free cash is invested to meet margin requirements.
Plot Short, Plot Long: Simplifies displayed information by toggling indicator lines on/off.
Long Position (toggleable):
EMA Fast ws: Window size for FAST EMA.
EMA Slow ws: Window size for SLOW EMA.
EMA Fast down shift: Adjustment factor for FAST EMA.
Stop Loss long (%): Percent drop to close the position.
Trailer enter (%): Percent above the purchase price to activate the trailer.
Trailer offset (%): Percent drop to close the position.
Short Position (toggleable):
EMA Fast ws: Window size for FAST EMA.
EMA Slow ws: Window size for SLOW EMA.
EMA Fast up shift: Adjustment factor for FAST EMA.
Stop Loss short (%): Percent rise to close the position.
Trailer enter (%): Percent below the purchase price to activate the trailer.
Trailer offset (%): Percent rise to close the position.
Operational Framework:
If in a long position and a short EMA crossover occurs, the strategy closes the long and opens a short (flip).
If in a short position and a long EMA crossover occurs, the strategy closes the short and opens a long (flip).
A position can close in three ways:
Stop Loss
Trailer
Signal Recrossing
If none are active, the position remains open until the end of the simulation.
Observations:
Shifts significantly deviating from 1 increase overfitting risk. Recommended ranges: 0.96–0.99 (long) and 1.01–1.05 (short).
The strategy's advantage lies in risk management, crucial in leveraged futures markets. It operates with relatively low DrawDown.
Recommendations:
Bullish Market: Higher entry threshold (e.g., 6%) and larger offset (e.g., 3%).
Volatile/Sideways Market: Tighter parameters (e.g., 3%, 1%).
The method is stable, and minor parameter adjustments do not significantly impact results, helping assess overfitting: if small changes lead to drastic differences, the strategy is over-optimized.
EMA Settings: Adjust FAST and SLOW EMAs based on the asset's volatility and cyclicality.
On the crypto market, especially in the Futures market, short time periods (1–15 minutes) often show significant noise, making patterns/repetitions hard to identify. I recommend setting the interval to at least 1 hour.
I hope this contributes to your success!
DCA Strategy with HedgingThis strategy implements a dynamic hedging system with Dollar-Cost Averaging (DCA) based on the 34 EMA. It can hold simultaneous long and short positions, making it suitable for ranging and trending markets.
Key Features:
Uses 34 EMA as baseline indicator
Implements hedging with simultaneous long/short positions
Dynamic DCA for position management
Automatic take-profit adjustments
Entry confirmation using 3-candle rule
How it Works
Long Entries:
Opens when price closes above 34 EMA for 3 candles
Adds positions every 0.1% price drop
Takes profit at 0.05% above average entry
Short Entries:
Opens when price closes below 34 EMA for 3 candles
Adds positions every 0.1% price rise
Takes profit at 0.05% below average entry
Settings
EMA Length: Controls the EMA period (default: 34)
DCA Interval: Price movement needed for additional entries (default: 0.1%)
Take Profit: Profit target from average entry (default: 0.05%)
Initial Position: Starting position size (default: 1.0)
Indicators
L: Long Entry
DL: Long DCA
S: Short Entry
DS: Short DCA
LTP: Long Take Profit
STP: Short Take Profit
Alerts
Compatible with all standard TradingView alerts:
Position Opens (Long/Short)
DCA Entries
Take Profit Hits
Note: This strategy works best on lower timeframes with high liquidity pairs. Adjust parameters based on asset volatility.
Arrow-SimplyTrade vol1.5-FinalTitle: Arrow-SimplyTrade vol1.5-Final
Description:
This advanced trading indicator is designed to assist traders in analyzing market trends and identifying optimal entry signals. It combines several popular technical analysis tools and strategies, including EMA (Exponential Moving Average), MA (Simple Moving Averages), Bollinger Bands, and candlestick patterns. This indicator provides both trend-following and counter-trend signals, making it suitable for various trading styles, such as scalping and swing trading.
Main Features:
EMA (Exponential Moving Average):
EMA200 is the main trend line that helps determine the overall market direction. When the price is above EMA200, the trend is considered bullish, and when the price is below EMA200, the trend is considered bearish.
It helps filter out signals that go against the prevailing market trend.
Simple Moving Averages (MA5 and MA15):
This indicator uses two Simple Moving Averages: MA5 (Fast) and MA15 (Slow). Their crossovers create buy or sell signals:
Buy Signal: When MA5 crosses above MA15, signaling a potential upward trend.
Sell Signal: When MA5 crosses below MA15, signaling a potential downward trend.
Bollinger Bands:
Bollinger Bands measure market volatility and can identify periods of overbought or oversold conditions. The Upper and Lower Bands help detect potential breakout points, while the Middle Line (Basis) serves as dynamic support or resistance.
This tool is particularly useful for identifying volatile conditions and potential reversals.
Arrows:
The indicator plots arrows on the chart to signal entry opportunities:
Green Arrows signal buy opportunities (when MA5 crosses above MA15 and price is above EMA200).
Red Arrows signal sell opportunities (when MA5 crosses below MA15 and price is below EMA200).
Opposite Arrows: Optionally, the indicator can also display arrows for counter-trend signals, triggered by MA5 and MA15 crossovers, regardless of the price's position relative to EMA200.
Candlestick Patterns:
The indicator detects popular candlestick patterns such as Bullish Engulfing, Bearish Engulfing, Hammer, and Doji.
These patterns are important for confirming entry points or anticipating trend reversals.
How to Use:
EMA200: The main trend line. If the price is above EMA200, consider long positions. If the price is below EMA200, consider short positions.
MA5 and MA15: Short-term trend indicators. The crossover of these averages generates buy or sell signals.
Bollinger Bands: Use these bands to spot overbought/oversold conditions. Breakouts from the bands may signal potential entry points.
Arrows: Green arrows represent buy signals, and red arrows represent sell signals. Opposite direction arrows can be used for counter-trend strategies.
Candlestick Patterns: Patterns like Bullish Engulfing or Doji can help confirm the signals.
Customizable Settings:
Fully customizable colors, line styles, and display settings for EMA, MAs, Bollinger Bands, and arrows.
The Candlestick Patterns feature can be toggled on or off based on user preference.
Important Notes:
This indicator is intended to be used in conjunction with other analysis tools.
Past performance does not guarantee future results.
Polish:
Tytuł: Arrow-SimplyTrade vol1.5-Final
Opis:
Ten zaawansowany wskaźnik handlowy jest zaprojektowany, aby pomóc traderom w analizie trendów rynkowych oraz identyfikowaniu optymalnych sygnałów wejścia. Łączy w sobie kilka popularnych narzędzi analizy technicznej i strategii, w tym EMA (Wykładnicza Średnia Ruchoma), MA (Prosta Średnia Ruchoma), Bollinger Bands oraz formacje świecowe. Wskaźnik generuje zarówno sygnały podążające za trendem, jak i przeciwnym trendowi, co sprawia, że jest odpowiedni do różnych stylów handlu, takich jak scalping oraz swing trading.
Główne Funkcje:
EMA (Wykładnicza Średnia Ruchoma):
EMA200 to główna linia trendu, która pomaga określić ogólny kierunek rynku. Gdy cena znajduje się powyżej EMA200, trend jest uznawany za wzrostowy, a gdy poniżej EMA200, za spadkowy.
Pomaga to filtrować sygnały, które są niezgodne z głównym trendem rynkowym.
Proste Średnie Ruchome (MA5 i MA15):
Wskaźnik używa dwóch Prostych Średnich Ruchomych: MA5 (szybka) oraz MA15 (wolna). Ich przecięcia generują sygnały kupna lub sprzedaży:
Sygnał Kupna: Kiedy MA5 przecina MA15 od dołu, sygnalizując potencjalny wzrost.
Sygnał Sprzedaży: Kiedy MA5 przecina MA15 od góry, sygnalizując potencjalny spadek.
Bollinger Bands:
Bollinger Bands mierzą zmienność rynku i mogą pomóc w identyfikowaniu okresów wykupienia lub wyprzedania rynku. Górna i dolna linia pomagają wykrywać punkty wybicia, a Środkowa Linia (Basis) działa jako dynamiczny poziom wsparcia lub oporu.
Narzędzie to jest szczególnie przydatne w wykrywaniu warunków zmienności i potencjalnych odwróceń trendu.
Strzałki:
Wskaźnik wyświetla strzałki na wykresie, które wskazują sygnały kupna i sprzedaży:
Zielona strzałka wskazuje sygnał kupna (gdy MA5 przecina MA15 i cena jest powyżej EMA200).
Czerwona strzałka wskazuje sygnał sprzedaży (gdy MA5 przecina MA15 i cena jest poniżej EMA200).
Strzałki w przeciwnym kierunku: Opcjonalna funkcja, która pokazuje strzałki w przeciwnym kierunku, uruchamiane przez przecięcia MA5 i MA15, niezależnie od pozycji ceny względem EMA200.
Formacje Świecowe:
Wskaźnik wykrywa popularne formacje świecowe, takie jak Bullish Engulfing, Bearish Engulfing, Hammer oraz Doji.
Formacje te pomagają traderom potwierdzić punkty wejścia i przewidzieć możliwe odwrócenia trendu.
Jak Używać:
EMA200: Główna linia trendu. Jeśli cena jest powyżej EMA200, rozważaj pozycje długie. Jeśli cena jest poniżej EMA200, rozważaj pozycje krótkie.
MA5 i MA15: Śledzą krótkoterminowe zmiany trendu. Przecięcia tych średnich generują sygnały kupna lub sprzedaży.
Bollinger Bands: Używaj tych pasm do wykrywania wykupionych lub wyprzedanych warunków. Wybicia z pasm mogą wskazywać potencjalne punkty wejścia.
Strzałki: Zielona strzałka wskazuje sygnał kupna, a czerwona strzałka sygnał sprzedaży. Strzałki w przeciwnym kierunku mogą być używane do strategii przeciwtrendowych.
Formacje Świecowe: Formacje takie jak Bullish Engulfing czy Doji mogą pomóc w potwierdzaniu sygnałów.
Ustawienia Personalizacji:
W pełni personalizowalne kolory, style linii i ustawienia wyświetlania dla EMA, MAs, Bollinger Bands oraz strzałek.
Funkcja Formacji Świecowych może być włączana lub wyłączana według preferencji użytkownika.
Ważne Uwagi:
Ten wskaźnik powinien być używany w połączeniu z innymi narzędziami analizy rynku.
Wyniki z przeszłości nie gwarantują wyników w przyszłości.
Omega_galskyThe strategy uses three Exponential Moving Averages (EMAs) — EMA8, EMA21, and EMA89 — to decide when to open buy or sell trades. It also includes a mechanism to move the Stop Loss (SL) to the Break-Even (BE) point, which is the entry price, once the price reaches a Risk-to-Reward (R2R) ratio of 1:1.
Key Steps:
Calculating EMAs: The script computes the EMA values for the specified periods. These help identify market trends and potential entry points.
Buy Conditions:
EMA8 crosses above EMA21.
The candle that causes the crossover is green (closing price is higher than the opening price).
The closing price is above EMA89.
If all conditions are met, a buy order is executed.
Sell Conditions:
EMA8 crosses below EMA21.
The candle that causes the crossover is red (closing price is lower than the opening price).
The closing price is below EMA89.
If all conditions are met, a sell order is executed.
Stop Loss and Take Profit:
Initial Stop Loss and Take Profit levels are calculated based on the entry price and a percentage defined by the user.
These levels help protect against large losses and lock in profits.
Break-Even Logic:
When the price moves favorably to reach a 1:1 R2R ratio:
For a buy trade, the Stop Loss is moved to the entry price if the price increases sufficiently.
For a sell trade, the Stop Loss is moved to the entry price if the price decreases sufficiently.
This ensures the trade is risk-free after the price reaches the predefined level.
Visual Representation:
The EMAs are plotted on the chart for easy visualization of trends and crossovers.
Entry and exit points are also marked on the chart to track trades.
Purpose:
The strategy is designed to capitalize on EMA crossovers while minimizing risks using Break-Even logic and predefined Stop Loss/Take Profit levels. It automates decision-making for trend-following traders and ensures disciplined risk management.
IronBot v3Introduction
IronBot V3 is a TradingView indicator that analyzes market trends, identifies potential trading opportunities, and helps manage trades by visualizing entry points, stop-loss levels, and take-profit targets.
How It Works
The indicator evaluates price action within a specified analysis window to determine market trends. It uses Fibonacci retracement levels to identify key price levels for trend detection and trading signals. Based on user-defined inputs, it calculates and displays trade levels, including entry points, stop-loss, and multiple take-profit levels.
Trend Definition:
The highest high and lowest low are calculated over a specified number of candles.
The price range is determined as the difference between the highest high and lowest low.
Three Fibonacci levels are calculated within this range:
- Fib Level 0.236
- Trend Line (0.5 level)
- Fib Level 0.786
Determining Long and Short Conditions:
Long Conditions (Buy):
The closing price must be above both the trend line (0.5 level) and the Fib Level 0.236.
Additionally, the market must not currently be in a bearish trend.
Short Conditions (Sell):
The closing price must be below both the trend line and the Fib Level 0.786.
The market must not currently be in a bullish trend.
Trend State Updates:
When a condition is met, the indicator sets the trend to bullish or bearish and turns off bearish or bullish trend conditions.
If neither buy nor sell conditions are met, the trend remains unchanged, and no new trade signals are generated.
Inputs and Their Role in the Algorithm
General Settings
Analysis Window: Specifies the number of historical candles to analyze. This influences the calculation of key levels such as highs and lows, which are critical for determining Fibonacci retracement levels.
First Trade: Defines the start date for generating trading signals.
Trade Configuration
Display TP/SL: Enables or disables the visualization of take-profit and stop-loss levels on the chart.
Leverage: Defines the leverage applied to trades for risk and position size calculations.
Initial Capital: Specifies the starting capital, which is used for calculating position sizes and profits.
Exchange Fees (%): Sets the percentage of fees applied by the exchange, which is factored into profit calculations.
Country Tax (%): Allows users to define applicable taxes, which are subtracted from net profits.
Stop-Loss Configuration
Break Even: Toggles the break-even functionality. When enabled, the stop-loss level adjusts dynamically as take-profit levels are reached.
Stop Loss (%): Defines the percentage distance from the entry price to the stop-loss level.
Take-Profit Settings
The indicator supports up to four take-profit levels:
- TP1 through TP4 Ratios: Specify the price levels for each take-profit target as a percentage of the entry price.
- Profit Percentages: Allocate a percentage of the position size to each take-profit level.
Visualization Elements
Trend Indicators: Displays Fibonacci-based trend lines and markers for bullish or bearish conditions.
Trade Levels: Entry, stop-loss, and take-profit levels are visualized on the chart by dotted lines for clarity. Additionally, a semi-transparent background is applied when a portion of the trade is closed to enhance visualization. Positive profits from a closed trade are green; otherwise, they are red.
Trade Profit Indicator: On each trade, every time a part of the trade is closed (e.g., take profit is reached), the profit indicator will be updated.
Performance Panel: Summarizes key account statistics, including net balance, profit/loss, and trading performance metrics.
Usage Guidelines
Add the indicator to your TradingView chart.
Configure the input settings based on your trading strategy.
Use the displayed levels and trend signals to make informed trading decisions.
Contact
For further assistance, including automation inquiries, feel free to contact me through TradingView’s messaging system.
Purpose and Disclaimer
IronBot V3 is designed for educational purposes and to assist in analyzing market trends. It is not financial advice, and users should perform their own due diligence before making any trading decisions.
Trading involves significant risk, and past performance is not indicative of future results. Use this indicator responsibly.