NVentures Liquidity Radar ProInstitutional Liquidity Radar Pro
OVERVIEW
This indicator combines three institutional trading concepts into a unified confluence scoring system: Liquidity Zones (swing-based), Order Blocks, and Fair Value Gaps. The unique value lies not in these individual concepts, but in HOW they interact through the confluence scoring algorithm to filter high-probability zones.
HOW THE CONFLUENCE SCORING WORKS
The core innovation is the calcConfluence() function that assigns a numerical score to each detected level:
1. Base Score: Every swing pivot starts with score = 1
2. Zone Overlap Detection: The algorithm iterates through all active zones within confDist * ATR proximity. Each overlapping zone adds +1 to the score
3. Order Block Proximity: If an Order Block's midpoint (top + bottom) / 2 falls within the confluence distance, +1 is added
4. HTF Validation: Using request.security(), the indicator fetches higher timeframe swing pivots. If the current zone aligns with an HTF swing within 2 * confDist * ATR_htf, a +2 bonus is awarded
Zones scoring 4+ are highlighted as high confluence - these represent areas where multiple institutional concepts converge.
HOW LIQUIDITY ZONES ARE CALCULATED
Detection: ta.pivothigh() and ta.pivotlow() with configurable lookback (default: 5 bars left/right)
Zone Width - Three modes available:
- ATR Dynamic: ATR(14) * multiplier (default 0.25)
- Fixed %: close * (percentage / 100)
- Wick Based: max(upperWick, lowerWick) * 1.5
Proximity Filter: isTooClose() prevents clustering by enforcing minimum ATR * minATRdist between zones
HOW ORDER BLOCKS ARE DETECTED
The detectBullishOB() / detectBearishOB() functions identify the last opposing candle before an impulse move:
1. Check if candle is opposing direction (bearish before bullish impulse, vice versa)
2. Validate consecutive candles in impulse direction (configurable, default: 3)
3. Volume confirmation: volume >= volMA * volMult (using 50-period SMA)
4. Minimum move validation: abs(close - close ) > ATR
This filters out weak OBs and focuses on those with institutional volume footprints.
HOW FAIR VALUE GAPS ARE DETECTED
FVGs represent price imbalances:
- Bullish FVG: low - high > ATR * fvgMinSize
- Bearish FVG: low - high > ATR * fvgMinSize
The ATR-relative sizing ensures gaps are significant relative to current volatility.
HOW SWEEP DETECTION WORKS
The checkSweep() function identifies false breakouts through wick analysis:
1. Calculate wick percentage: upperWick / totalRange or lowerWick / totalRange
2. Sweep conditions for resistance: high > zone.upper AND close < zone.price AND wickPct >= threshold
3. Sweep conditions for support: low < zone.lower AND close > zone.price AND wickPct >= threshold
A sweep indicates liquidity was grabbed without genuine continuation - often preceding reversals.
HOW FRESHNESS DECAY WORKS
The calcFreshness() function implements linear decay:
freshness = 1.0 - (age / decayBars)
freshness = max(freshness, minFresh)
This ensures old, tested zones fade visually while fresh zones remain prominent.
WHY THESE COMPONENTS WORK TOGETHER
The synergy is based on the principle that institutional activity leaves multiple footprints:
- Swing Pivots = where retail stops cluster
- Order Blocks = where institutions entered
- FVGs = where aggressive institutional orders created imbalances
- HTF Alignment = where higher timeframe participants are active
When these footprints converge at the same price level (high confluence score), the probability of significant price reaction increases.
CONFIGURATION
- Swing Detection Length: 5-8 for intraday, 8-15 for swing trading
- HTF Timeframe: One level above trading TF (e.g., D for H4)
- Min Confluence to Display: 2 for comprehensive view, 3-4 for high-probability only
- FVGs: Disabled by default for cleaner charts
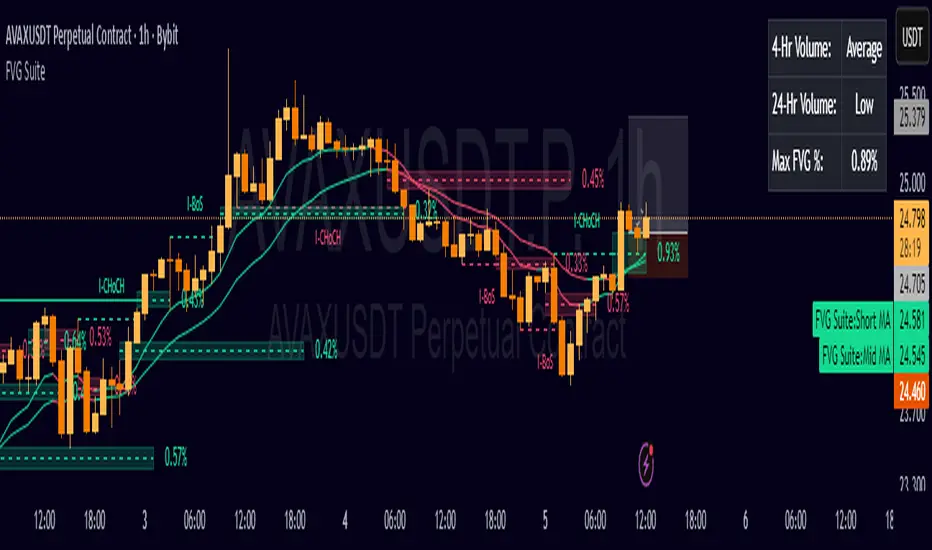
STATISTICS PANEL
Displays: Active resistance/support zones, high confluence count, swept zones, active OBs, active FVGs, current ATR, selected HTF.
ALERTS
- Price approaching high confluence zone
- Liquidity sweep detected
- Bullish/Bearish Order Block formed
- Bullish/Bearish FVG detected
TECHNICAL NOTES
- Uses User-Defined Types (UDTs) for clean data structure management
- Respects Pine Script drawing limits (500 boxes/labels/lines)
- All calculations are ATR-normalized for cross-market compatibility
مؤشر Pine Script®