Fib Cross Moving AveragesThe white line is the main 200-candle MA. The fibonacci ratio MAs are relative to that 200-day MA. Some lines change color based on the trend shown by this indicator.
So 61.8% for example, the orange/red line golden ratio MA is a 124 candle MA (~68% of 200). There is also a weighted 124 candle MA that works along-side the 100 candle MA.
ابحث في النصوص البرمجية عن "fib"


Fib EMA Ichi MACD BollingerAll in one necessary indicators for those, who limited to three of them.
Fibonacci EMA + EMA 200 (all can be modified for your custom periods)
MACD Graph overlay
Ichimoku cloud
Bollinger Bands
All is open, made from different basic indicators and tested to show correct data.
Fib EMA RibbonPretty weird and experimental fibonacci ribbon overlay, for visual use and fun only at the moment. Will update the script if i think of any other ways to use it, ideas welcome.
Meant for use with Heikin Ashi candles.
Biffy
FIB Band Signals with RSI FilterOriginal Author: Rashad
Added by Rashad 6-26-16
These Bollinger bands feature Fibonacci retracements to very clearly show areas of support and resistance . The basis is calculate off of the Volume Weighted Moving Average . The Bands are 3 standard deviations away from the mean. 99.73% of observations should be in this range.
Updated by Dysrupt 7-12-18
-Buy signals added on lower bands, mean and upper 3 bands
-Sell signals added to upper 3 bands
-RSI filter applied to signals
-Alerts not yet added
-Long Biased
NOTE: This is NOT a set and forget signal indicator. It is extremely versatile for all environments by adjusting the RSI filter and checking the band signals needed for the current trend and trading style.
Fib Guppy for volatility predictionsThis is a guppy made from FIbbonacci numbers (from 1 to 1597).
Here is how to trade with this guppy.
when 6-8 lines tighten together, it means there will be high volatility coming very soon. Trade according to where the next candle opens (for scalping etc). For example: if the 8 lines of guppy tighten and candle closes above guppy with momentum and trend in the same direction(up), then there could be expected a big move in that direction. Vice versa if a candle closes below the tightened guppy with momentum and trend at the same direction, then the volatility will push price lower exponentially.
Easy. peace of cake. go make yourself a millionaire.

FibMA by WSM.TFib MA, allows you to identify major and minor trend analysis. Position of FibMA allow one to see those position in past and act accordingly in present..
It can be useful with combining bands.. Will be publishing them soon.

IA-12 ScreenerIA-12 Screener is a table-based, multi-asset indicator designed to help traders quickly identify potential buying and shorting opportunities across up to 12 instruments simultaneously.
The indicator combines Fibonacci-based price levels, trend context, momentum, and volatility-adjusted risk metrics into a single, easy-to-scan dashboard. It is intended as a decision-support tool, allowing you to evaluate multiple assets at a glance without cluttering your chart.
Key Features
Supports up to 12 user-defined assets
Uses All-Time High (ATH) as the Fibonacci anchor
Automatically identifies Nearest Buy Fib (support) and Nearest Sell Fib (resistance) levels
Highlights potential opportunities when price is close to a Fib level
Normalizes distance using ATR for volatility-aware risk assessment
Includes trend and momentum filters to improve signal quality
Column Overview
Column | Description
Ticker | Asset symbol
Price | Current / live price on the chart timeframe
ATH (D) | All-time high calculated from daily data
Dist ATH % | Percentage distance below ATH
Trend | Daily trend regime using 50/200 MA (Bull / Bear / Neutral)
RSI | Momentum regime (OB = Overbought, OS = Oversold, N = Neutral)
Buy Fib | Nearest Fibonacci level below price (support)
Buy % | Percentage distance to Buy Fib
Buy ATR | Distance to Buy Fib expressed in ATR units
Sell Fib | Nearest Fibonacci level above price (resistance)
Sell % | Percentage distance to Sell Fib
Sell ATR | Distance to Sell Fib expressed in ATR units
Band % | Width between Buy and Sell Fib (compression measure)
Last Chg | Bars since the nearest Fib side changed
Visual Highlights
Green cells indicate the price is closest to that Fib side (Buy or Sell) and within a user-defined distance threshold.
“Tight” Band % highlights Fibonacci compression zones, which often precede volatility expansion.
How to Use the Screener
For Long (Buy) Ideas
Trend = Bull
Buy Fib highlighted (green)
Buy ATR < ~1.0
RSI = Neutral or Oversold
For Short (Sell) Ideas
Trend = Bear or Neutral
Sell Fib highlighted (green)
Sell ATR < ~1.0
Price close to ATH (low Dist ATH %)
For Watchlist Priority
Look for Tight Band % values
Signals with low “Last Chg” are fresher
Customization
Assets are fully user-configurable (defaults are provided)
Thresholds for highlighting and compression can be adjusted
Designed to work on any chart timeframe
⚠️ Disclaimer
This indicator is not a trading system and does not generate buy or sell orders. It is intended for analysis and screening purposes only. Always confirm signals with your own risk management and additional analysis.

FibSync - DynamicFibSupportWhat is this indicator?
FibSync – DynamicFibSupport overlays your chart with both static and dynamic Fibonacci retracement levels, making it easy to spot potential areas of support and resistance.
Static Fibs: Calculated from the highest and lowest price over a user-defined lookback period.
Dynamic Fibs: Calculated from the most recent swing high and swing low, automatically adapting as new swings form.
How to use
Add the indicator to your chart.
Configure the settings:
Static Fib Period: Sets the lookback window for static fib levels.
Show Dynamic Fibonacci Levels: Toggle dynamic fibs on/off.
Dynamic Fib Swing Search Window: How far back to search for valid swing highs/lows.
Swing Strength (bars left/right): How many bars define a swing high/low (higher = stronger swing).
Interpret the levels:
Solid lines are static fibs.
Transparent lines are dynamic fibs (if enabled).
Colors match standard fib conventions (yellow = 0.236, red = 0.382, blue = 0.618, green = 0.786, gray = 0.5).
Tips
Static and dynamic fibs can overlap-this often highlights especially important support/resistance zones.
Adjust the swing strength for your trading style: lower values for short-term, higher for long-term swings.
Hide/show individual lines using the indicator’s style settings in TradingView.
Trading Ideas (for higher timeframes and static fibs)
Close above the blue line (0.618 static fib):
This can be interpreted as a potential long (buy) signal, suggesting the market is breaking above a key resistance level.
Close below the red line (0.382 static fib):
This can be interpreted as a potential short (sell) signal, indicating the market is breaking below a key support level.
Note: These signals are most meaningful on higher timeframes and when using the static fib lines. Always confirm with your own strategy and risk management.

ICT Master Suite [Trading IQ]Hello Traders!
We’re excited to introduce the ICT Master Suite by TradingIQ, a new tool designed to bring together several ICT concepts and strategies in one place.
The Purpose Behind the ICT Master Suite
There are a few challenges traders often face when using ICT-related indicators:
Many available indicators focus on one or two ICT methods, which can limit traders who apply a broader range of ICT related techniques on their charts.
There aren't many indicators for ICT strategy models, and we couldn't find ICT indicators that allow for testing the strategy models and setting alerts.
Many ICT related concepts exist in the public domain as indicators, not strategies! This makes it difficult to verify that the ICT concept has some utility in the market you're trading and if it's worth trading - it's difficult to know if it's working!
Some users might not have enough chart space to apply numerous ICT related indicators, which can be restrictive for those wanting to use multiple ICT techniques simultaneously.
The ICT Master Suite is designed to offer a comprehensive option for traders who want to apply a variety of ICT methods. By combining several ICT techniques and strategy models into one indicator, it helps users maximize their chart space while accessing multiple tools in a single slot.
Additionally, the ICT Master Suite was developed as a strategy . This means users can backtest various ICT strategy models - including deep backtesting. A primary goal of this indicator is to let traders decide for themselves what markets to trade ICT concepts in and give them the capability to figure out if the strategy models are worth trading!
What Makes the ICT Master Suite Different
There are many ICT-related indicators available on TradingView, each offering valuable insights. What the ICT Master Suite aims to do is bring together a wider selection of these techniques into one tool. This includes both key ICT methods and strategy models, allowing traders to test and activate strategies all within one indicator.
Features
The ICT Master Suite offers:
Multiple ICT strategy models, including the 2022 Strategy Model and Unicorn Model, which can be built, tested, and used for live trading.
Calculation and display of key price areas like Breaker Blocks, Rejection Blocks, Order Blocks, Fair Value Gaps, Equal Levels, and more.
The ability to set alerts based on these ICT strategies and key price areas.
A comprehensive, yet practical, all-inclusive ICT indicator for traders.
Customizable Timeframe - Calculate ICT concepts on off-chart timeframes
Unicorn Strategy Model
2022 Strategy Model
Liquidity Raid Strategy Model
OTE (Optimal Trade Entry) Strategy Model
Silver Bullet Strategy Model
Order blocks
Breaker blocks
Rejection blocks
FVG
Strong highs and lows
Displacements
Liquidity sweeps
Power of 3
ICT Macros
HTF previous bar high and low
Break of Structure indications
Market Structure Shift indications
Equal highs and lows
Swings highs and swing lows
Fibonacci TPs and SLs
Swing level TPs and SLs
Previous day high and low TPs and SLs
And much more! An ongoing project!
How To Use
Many traders will already be familiar with the ICT related concepts listed above, and will find using the ICT Master Suite quite intuitive!
Despite this, let's go over the features of the tool in-depth and how to use the tool!
The image above shows the ICT Master Suite with almost all techniques activated.
ICT 2022 Strategy Model
The ICT Master suite provides the ability to test, set alerts for, and live trade the ICT 2022 Strategy Model.
The image above shows an example of a long position being entered following a complete setup for the 2022 ICT model.
A liquidity sweep occurs prior to an upside breakout. During the upside breakout the model looks for the FVG that is nearest 50% of the setup range. A limit order is placed at this FVG for entry.
The target entry percentage for the range is customizable in the settings. For instance, you can select to enter at an FVG nearest 33% of the range, 20%, 66%, etc.
The profit target for the model generally uses the highest high of the range (100%) for longs and the lowest low of the range (100%) for shorts. Stop losses are generally set at 0% of the range.
The image above shows the short model in action!
Whether you decide to follow the 2022 model diligently or not, you can still set alerts when the entry condition is met.
ICT Unicorn Model
The image above shows an example of a long position being entered following a complete setup for the ICT Unicorn model.
A lower swing low followed by a higher swing high precedes the overlap of an FVG and breaker block formed during the sequence.
During the upside breakout the model looks for an FVG and breaker block that formed during the sequence and overlap each other. A limit order is placed at the nearest overlap point to current price.
The profit target for this example trade is set at the swing high and the stop loss at the swing low. However, both the profit target and stop loss for this model are configurable in the settings.
For Longs, the selectable profit targets are:
Swing High
Fib -0.5
Fib -1
Fib -2
For Longs, the selectable stop losses are:
Swing Low
Bottom of FVG or breaker block
The image above shows the short version of the Unicorn Model in action!
For Shorts, the selectable profit targets are:
Swing Low
Fib -0.5
Fib -1
Fib -2
For Shorts, the selectable stop losses are:
Swing High
Top of FVG or breaker block
The image above shows the profit target and stop loss options in the settings for the Unicorn Model.
Optimal Trade Entry (OTE) Model
The image above shows an example of a long position being entered following a complete setup for the OTE model.
Price retraces either 0.62, 0.705, or 0.79 of an upside move and a trade is entered.
The profit target for this example trade is set at the -0.5 fib level. This is also adjustable in the settings.
For Longs, the selectable profit targets are:
Swing High
Fib -0.5
Fib -1
Fib -2
The image above shows the short version of the OTE Model in action!
For Shorts, the selectable profit targets are:
Swing Low
Fib -0.5
Fib -1
Fib -2
Liquidity Raid Model
The image above shows an example of a long position being entered following a complete setup for the Liquidity Raid Modell.
The user must define the session in the settings (for this example it is 13:30-16:00 NY time).
During the session, the indicator will calculate the session high and session low. Following a “raid” of either the session high or session low (after the session has completed) the script will look for an entry at a recently formed breaker block.
If the session high is raided the script will look for short entries at a bearish breaker block. If the session low is raided the script will look for long entries at a bullish breaker block.
For Longs, the profit target options are:
Swing high
User inputted Lib level
For Longs, the stop loss options are:
Swing low
User inputted Lib level
Breaker block bottom
The image above shows the short version of the Liquidity Raid Model in action!
For Shorts, the profit target options are:
Swing Low
User inputted Lib level
For Shorts, the stop loss options are:
Swing High
User inputted Lib level
Breaker block top
Silver Bullet Model
The image above shows an example of a long position being entered following a complete setup for the Silver Bullet Modell.
During the session, the indicator will determine the higher timeframe bias. If the higher timeframe bias is bullish the strategy will look to enter long at an FVG that forms during the session. If the higher timeframe bias is bearish the indicator will look to enter short at an FVG that forms during the session.
For Longs, the profit target options are:
Nearest Swing High Above Entry
Previous Day High
For Longs, the stop loss options are:
Nearest Swing Low
Previous Day Low
The image above shows the short version of the Silver Bullet Model in action!
For Shorts, the profit target options are:
Nearest Swing Low Below Entry
Previous Day Low
For Shorts, the stop loss options are:
Nearest Swing High
Previous Day High
Order blocks
The image above shows indicator identifying and labeling order blocks.
The color of the order blocks, and how many should be shown, are configurable in the settings!
Breaker Blocks
The image above shows indicator identifying and labeling order blocks.
The color of the breaker blocks, and how many should be shown, are configurable in the settings!
Rejection Blocks
The image above shows indicator identifying and labeling rejection blocks.
The color of the rejection blocks, and how many should be shown, are configurable in the settings!
Fair Value Gaps
The image above shows indicator identifying and labeling fair value gaps.
The color of the fair value gaps, and how many should be shown, are configurable in the settings!
Additionally, you can select to only show fair values gaps that form after a liquidity sweep. Doing so reduces "noisy" FVGs and focuses on identifying FVGs that form after a significant trading event.
The image above shows the feature enabled. A fair value gap that occurred after a liquidity sweep is shown.
Market Structure
The image above shows the ICT Master Suite calculating market structure shots and break of structures!
The color of MSS and BoS, and whether they should be displayed, are configurable in the settings.
Displacements
The images above show indicator identifying and labeling displacements.
The color of the displacements, and how many should be shown, are configurable in the settings!
Equal Price Points
The image above shows the indicator identifying and labeling equal highs and equal lows.
The color of the equal levels, and how many should be shown, are configurable in the settings!
Previous Custom TF High/Low
The image above shows the ICT Master Suite calculating the high and low price for a user-defined timeframe. In this case the previous day’s high and low are calculated.
To illustrate the customizable timeframe function, the image above shows the indicator calculating the previous 4 hour high and low.
Liquidity Sweeps
The image above shows the indicator identifying a liquidity sweep prior to an upside breakout.
The image above shows the indicator identifying a liquidity sweep prior to a downside breakout.
The color and aggressiveness of liquidity sweep identification are adjustable in the settings!
Power Of Three
The image above shows the indicator calculating Po3 for two user-defined higher timeframes!
Macros
The image above shows the ICT Master Suite identifying the ICT macros!
ICT Macros are only displayable on the 5 minute timeframe or less.
Strategy Performance Table
In addition to a full-fledged TradingView backtest for any of the ICT strategy models the indicator offers, a quick-and-easy strategy table exists for the indicator!
The image above shows the strategy performance table in action.
Keep in mind that, because the ICT Master Suite is a strategy script, you can perform fully automatic backtests, deep backtests, easily add commission and portfolio balance and look at pertinent metrics for the ICT strategies you are testing!
Lite Mode
Traders who want the cleanest chart possible can toggle on “Lite Mode”!
In Lite Mode, any neon or “glow” like effects are removed and key levels are marked as strict border boxes. You can also select to remove box borders if that’s what you prefer!
Settings Used For Backtest
For the displayed backtest, a starting balance of $1000 USD was used. A commission of 0.02%, slippage of 2 ticks, a verify price for limit orders of 2 ticks, and 5% of capital investment per order.
A commission of 0.02% was used due to the backtested asset being a perpetual future contract for a crypto currency. The highest commission (lowest-tier VIP) for maker orders on many exchanges is 0.02%. All entered positions take place as maker orders and so do profit target exits. Stop orders exist as stop-market orders.
A slippage of 2 ticks was used to simulate more realistic stop-market orders. A verify limit order settings of 2 ticks was also used. Even though BTCUSDT.P on Binance is liquid, we just want the backtest to be on the safe side. Additionally, the backtest traded 100+ trades over the period. The higher the sample size the better; however, this example test can serve as a starting point for traders interested in ICT concepts.
Community Assistance And Feedback
Given the complexity and idiosyncratic applications of ICT concepts amongst its proponents, the ICT Master Suite’s built-in strategies and level identification methods might not align with everyone's interpretation.
That said, the best we can do is precisely define ICT strategy rules and concepts to a repeatable process, test, and apply them! Whether or not an ICT strategy is trading precisely how you would trade it, seeing the model in action, taking trades, and with performance statistics is immensely helpful in assessing predictive utility.
If you think we missed something, you notice a bug, have an idea for strategy model improvement, please let us know! The ICT Master Suite is an ongoing project that will, ideally, be shaped by the community.
A big thank you to the @PineCoders for their Time Library!
Thank you!

Auto Fibonacci LevelsAuto Fibonacci Momentum Zones with Visible Range Table
Overview and Originality
The Auto Fibonacci Momentum Zones indicator offers a streamlined, static overlay of Fibonacci retracement levels inspired by extreme RSI momentum thresholds, enhanced with a dynamic table displaying the high and low of the currently visible chart range. This isn't a repackaged RSI oscillator or basic Fib drawer—common in TradingView's library—but a purposeful fusion of geometric harmony (Fibonacci ratios) with momentum psychology (RSI extremes at 35/85), projected as fixed horizontal reference lines on the price chart. The addition of the visible range table, powered by PineCoders' VisibleChart library, provides real-time context for the chart's current view, enabling traders to quickly assess range compression or expansion relative to these zones.
This script's originality stems from its "static momentum mapping": by hardcoding Fib levels on a dynamic chart, it creates universal psychological support/resistance lines that transcend specific assets or timeframes.
Unlike dynamic Fib tools that auto-adjust to price swings (risking noise in ranging markets) or standalone RSI plots (confined to panes), this delivers clean, bias-adjustable overlays for confluence analysis. The visible range table justifies the library integration—it's not a gratuitous add-on but a complementary tool that quantifies the "screen real estate" of price action, helping users correlate Fib touches with actual volatility. Drawn from original code (no auto-generation or public templates), it builds TradingView's body of knowledge by simplifying multi-tool workflows into one indicator, ideal for discretionary traders who value visual efficiency over algorithmic complexity.
How It Works: Underlying Concepts
Fibonacci retracements, derived from the Fibonacci sequence and the golden ratio (≈0.618), identify potential reversal points based on the idea that markets retrace prior moves in predictable proportions: shallow (23.6%, 38.2%), mid (50%), and deep (61.8%, 78.6%).
Adjustable Outputs
1. The "Invert Fibs" toggle (default: true) for bearish/topping bias, can be flipped aligning with trend context.
2. Fibonacci Levels: Seven semi-transparent horizontal lines are drawn using `hline()`:
- 0.0 at high (gray).
- 0.236: high - (range × 0.236) (light cyan, shallow pullback).
- 0.382: high - (range × 0.382) (teal, common retracement).
- 0.5: midpoint average (green, equilibrium).
- 0.618: high - (range × 0.618) (amber, golden pocket for reversals).
- 0.786: high - (range × 0.786) (orange, deep support).
- 1.0 at low (gray).
Colors progress from cool (shallow) to warm (deep) for intuitive scanning.
3. Optional Fib Labels: Right-edge text labels (e.g., "0.618") appear only if enabled, positioned at the last bar + offset for non-cluttering visibility.
4. Visible Range Table: Leveraging the VisibleChart library's `visible.high()` and `visible.low()` functions, a compact 2x2 table (top-right corner) updates on the last bar to show the extrema of bars currently in view. This mashup enhances utility: Fib zones provide fixed anchors, while the table's dynamic values reveal if price is "pinned" to a zone (e.g., visible high hugging 0.382 signals resistance). The library is invoked sparingly for performance, adding value by bridging static geometry with viewport-aware data—unavailable in built-ins without custom code.
How to Use It
1. Setup:
Add to any chart (e.g., 15M for scalps, Daily for swings). As an overlay, lines appear directly on price candles—adjust chart scaling if needed.
2. Input Tweaks:
Invert Fibs: Enable for downtrends (85 top), disable for uptrends (35 bottom).
Show Fibs: Toggle labels for ratio callouts (off for clean charts).
Show Table: Display/hide the visible high/low summary (red for high, green for low, formatted to 2 decimals).
3. Trading Application:
Zone Confluence: Seek price reactions at each fibonacci level—e.g., a doji at 0.618 + rising volume suggests entry; use 0.0/1.0 as invalidation.
Range Context: Check the table: If visible high/low spans <20% of the Fib arc (e.g., both near 0.5), anticipate breakout; wider spans signal consolidation.
Multi-Timeframe: Overlay on higher TF for bias, lower for precision—e.g., Daily Fibs guide 1H entries.
Enhancements: Pair with volume or candlesticks; set alerts on line crosses via TradingView's built-in tools. Backtest on your symbols to validate (e.g., equities favor 0.382, forex the 0.786).
This indicator automates advanced Fibonacci synthesis dynamically, eliminating manual measurement and calculations.
published by ozzy_livin

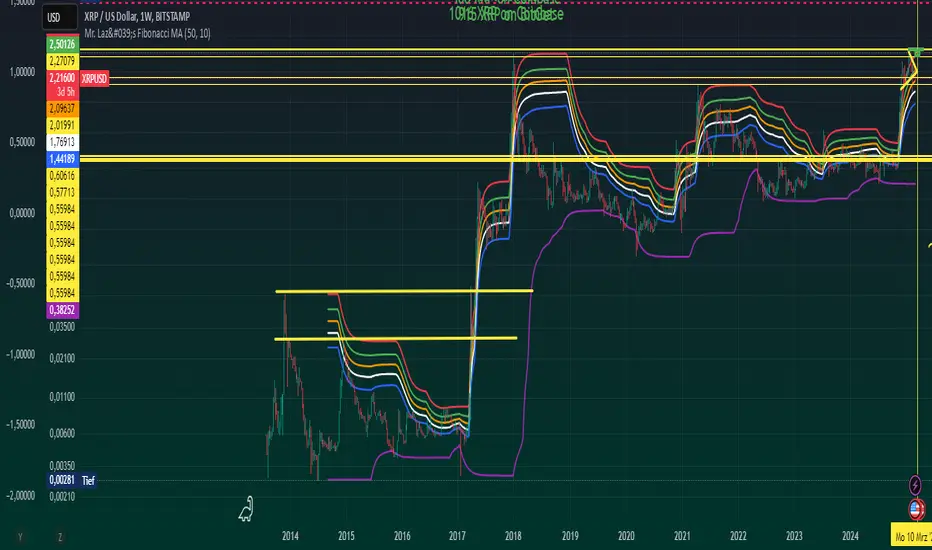
Mr. Laz's Fibonacci MASmoothed Fibonacci Moving Average
This indicator plots six Fibonacci retracement levels overlaid on the chart, with each level smoothly adjusted using an Exponential Moving Average (EMA). The Fibonacci levels are calculated based on the highest high and lowest low over a user-defined period, and they represent key support and resistance zones that traders often watch for price reversals.
The six Fibonacci retracement levels plotted are:
0% (Fib 0): Top level (representing the highest point in the range).
23.6% (Fib 23.6%)
38.2% (Fib 38.2%)
50% (Fib 50%)
61.8% (Fib 61.8%)
100% (Fib 100): Bottom level (representing the lowest point in the range).
These levels are smoothed using a user-defined Smoothing Length, which helps reduce the "zig-zag" nature of the lines and provides a more gradual, smoother appearance as they follow the price movement. The indicator allows you to adjust the smoothing factor to control how sensitive the lines are to price changes.
The colors of the Fibonacci levels are customizable and are plotted from top to bottom as:
Red (for Fib 100%)
Green (for Fib 23.6%)
Orange (for Fib 38.2%)
White (for Fib 50%)
Blue (for Fib 61.8%)
Purple (for Fib 0%)
This indicator is useful for identifying key support and resistance zones based on Fibonacci retracement levels, with the added benefit of smoothing to make the lines more visually appealing and less prone to sudden shifts.
Fibonacci Zone DCA Strategy - R3c0nTraderCredits:
Thank you "eykpunter" for granting me permission to use "Fibonacci Zones" to create this strategy
Thank you "junyou0424" for granting me permission to use "DCA Bot with SuperTrend Emulator" which I used for adding bot inputs, calculations, and strategy
Pre-requisites:
You can use this script without a 3Commas account and see how 3Commas DCA Bot would perform. However, I highly recommend signing up for their free account, going through their training, and testing this strategy with a paper bot. This would give you a base understanding of the settings you will see in this strategy and why you will need to know them.
What can this do?
First off, this is a Long only strategy as I wrote it with DCA in mind. It cannot be used for shorting. Shorting defeats the purpose of a DCA bot which has a goal that is Long a position not Short a position. If you want to short, there are plenty of free scripts out there that do this.
I created this script out of curiosity and I wanted to see how a strategy based on “Fibonacci” levels would work with a 3Commas DCA bot. I came across "eykpunter’s" "Fibonacci Zones" study and in TradingView and I found it to be a very interesting concept. The "Fib Zones" in his study are basically a "Donchian Channel" of 4 Fibonacci lines. These are the High @ 0.236, Center High @ 0.382, Center Low @ 0.618, and Low @ 0.764.
The Fib Zones in this strategy can be used as conditions to open a trade as well as closing a trade. There is also the option to close a trade based on a Target Take Profit (%).
Advanced Fibonacci trading is also supported by specifying additional parameters for Trade Entry and Exit.
For example, for order entry, you can increase the minimum trend strength to open an order via the "minimum ADX value" option. You can also further limit order entry by selecting the option to "Only open trades on bullish +DI" (Positive Directional Index).
Or you can play the contrarian. For example, I would look for "buying the dip" opportunities by doing the following under "Trade Entry Settings":
Set the "Min ADX value to open trade" to zero
Set the option "Open a trade when the price moves" to "1-To the bottom of Downtrend Fib zone" or "2-Higher than the top of the Downtrend Fib zone"
Uncheck option "Only open trades on bullish +DI"
Set the 'Min ADX value to open trade' to Zero
Set the 'Max +DI value to open trade' to a value between 10-20.
For Trade Exit settings, I can use a "Target Take Profit (%)" or one of the High Fib levels to close the trade.
Here's an example result when using a Contrarian-Fibonacci-Zone-DCA strategy:
Explanation of Chart lines and colors on chart
Six Options for Entering a Fibonacci Trade
Open a trade when the price moves:
1-To the bottom of Downtrend Fib zone
2-Higher than the top of the Downtrend Fib zone
3-Higher than the bottom of Ranging Fib Zone
4-Higher than the top of Ranging Fib Zone
5-Higher than the bottom of Uptrend Fib Zone
6-To the top of Uptrend Fib Zone
Three Options for Exiting a Fibonacci Trade
Take profit using:
"Target Take Profit (%)"
"High Fibonacci Border-1"
"High Fibonacci Border-2"

RSI Fibonacci Flow [JOAT]RSI Fibonacci Flow - Advanced Fibonacci Retracement with RSI Confluence
Introduction
RSI Fibonacci Flow is an open-source overlay indicator that combines automatic Fibonacci retracement levels with RSI momentum analysis to identify high-probability trading zones. The indicator automatically detects swing highs and lows, draws Fibonacci levels, and generates confluence signals when RSI conditions align with key Fibonacci zones.
This indicator is designed for traders who use Fibonacci retracements but want additional confirmation from momentum analysis before entering trades.
Originality and Purpose
This indicator is NOT a simple mashup of RSI and Fibonacci tools. It is an original implementation that creates a synergistic relationship between two complementary analysis methods:
Why Combine RSI with Fibonacci? Fibonacci retracements identify WHERE price might reverse, but they don't tell you WHEN. RSI provides the timing component by showing momentum exhaustion. When price reaches the Golden Zone (50%-61.8%) AND RSI shows oversold conditions, the probability of a successful bounce increases significantly.
Original Confluence Scoring System: The indicator calculates a 0-5 confluence score that weights multiple factors: Golden Zone presence (+2), entry zone presence (+1), RSI extreme alignment (+1), RSI divergence (+1), and strong RSI momentum (+1). This scoring system is original to this indicator.
Automatic Pivot Detection: Unlike manual Fibonacci tools, this indicator automatically detects swing highs and lows using a configurable pivot algorithm, then draws Fibonacci levels accordingly. The pivot detection uses a center-bar comparison method that checks if a bar's high/low is the highest/lowest within the specified depth on both sides.
Dynamic Trend Awareness: The indicator determines trend direction based on pivot sequence (last pivot was high or low) and adjusts Fibonacci orientation accordingly. In uptrends, 0% is at swing low; in downtrends, 0% is at swing high.
Each component serves a specific purpose:
Fibonacci levels identify potential reversal zones based on natural price ratios
RSI provides momentum context to filter out low-probability setups
Confluence scoring quantifies setup quality for position sizing decisions
Automatic pivot detection removes subjectivity from level placement
Core Concept: RSI-Fibonacci Confluence
The most powerful trading setups occur when multiple factors align. RSI Fibonacci Flow identifies these moments by:
Automatically detecting price pivots and drawing Fibonacci levels
Tracking which Fibonacci zone the current price occupies
Monitoring RSI for overbought/oversold conditions
Generating signals when RSI extremes coincide with key Fibonacci levels
Scoring confluence strength on a 0-5 scale
When price reaches the Golden Zone (50%-61.8%) while RSI shows oversold conditions in an uptrend, the probability of a bounce increases significantly.
Fibonacci Levels Explained
The indicator draws nine Fibonacci levels based on the most recent swing:
0% (Swing Low/High): The starting point of the move
23.6%: Shallow retracement - often seen in strong trends
38.2%: First significant support/resistance level
50%: Psychological midpoint of the move
61.8% (Golden Ratio): The most important Fibonacci level
78.6%: Deep retracement - last defense before trend failure
100% (Swing High/Low): The end point of the move
127.2% (TP1): First extension target for take profit
161.8% (TP2): Second extension target for take profit
The Golden Zone
The area between 50% and 61.8% is highlighted as the "Golden Zone" because:
It represents the optimal retracement depth for trend continuation
Institutional traders often place orders in this zone
It offers favorable risk-to-reward ratios
Price frequently bounces from this area in healthy trends
When price enters the Golden Zone, the indicator highlights it with a semi-transparent box and optional background coloring.
Pivot Detection System
The indicator uses a configurable pivot detection algorithm:
pivotDetect(float src, int len, bool isHigh) =>
int halfLen = len / 2
float centerVal = nz(src , src)
bool isPivot = true
for i = 0 to len - 1
if isHigh
if nz(src , src) > centerVal
isPivot := false
break
else
if nz(src , src) < centerVal
isPivot := false
break
isPivot ? centerVal : float(na)
This identifies swing highs and lows by checking if a bar's high/low is the highest/lowest within the specified depth on both sides.
Visual Components
1. Fibonacci Lines
Horizontal lines at each Fibonacci level:
Solid lines for major levels (0%, 50%, 61.8%, 100%)
Dashed lines for secondary levels (23.6%, 38.2%, 78.6%)
Dotted lines for extension levels (127.2%, 161.8%)
Color-coded for easy identification
Configurable line width
2. Fibonacci Labels
Price labels at each level showing:
Fibonacci percentage
Actual price at that level
Golden Zone label highlighted
TP1 and TP2 labels for targets
3. Golden Zone Box
A semi-transparent box highlighting the 50%-61.8% zone:
Gold colored border and fill
Extends from swing start to current bar (or beyond if extended)
Provides clear visual of the optimal entry zone
4. ZigZag Lines
Connecting lines between detected pivots:
Cyan for moves from low to high
Orange for moves from high to low
Helps visualize market structure
Configurable line width
5. Pivot Markers
Small labels at detected swing points:
"HH" (Higher High) at swing highs
"LL" (Lower Low) at swing lows
Helps track market structure
6. Entry Signals
BUY and SELL labels when confluence conditions are met:
BUY: RSI oversold + price in entry zone + uptrend + positive momentum
SELL: RSI overbought + price in entry zone + downtrend + negative momentum
Labels include "RSI+FIB" to indicate confluence
Confluence Scoring System
The indicator calculates a confluence score from 0 to 5:
+2 points: Price is in the Golden Zone (50%-61.8%)
+1 point: Price is in the entry zone (38.2%-61.8%)
+1 point: RSI is oversold in uptrend OR overbought in downtrend
+1 point: RSI divergence detected (bullish or bearish)
+1 point: Strong RSI momentum (change > 2 points)
Confluence ratings:
STRONG (4-5): Multiple factors align - high probability setup
MODERATE (2-3): Some factors align - proceed with caution
WEAK (0-1): Few factors align - wait for better setup
Dashboard Panel
The 10-row dashboard provides comprehensive analysis:
RSI Value: Current RSI reading (large text)
RSI State: OVERBOUGHT, OVERSOLD, BULLISH, BEARISH, or NEUTRAL
Fib Trend: UPTREND or DOWNTREND based on last pivot sequence
Price Zone: Current Fibonacci zone (e.g., "GOLDEN ZONE", "38.2% - 50%")
Price: Current close price (large text)
Confluence: Score rating with numeric value (e.g., "STRONG (4/5)")
Nearest Fib: Closest key Fibonacci level with price
TP1 (127.2%): First take profit target price
TP2 (161.8%): Second take profit target price
Input Parameters
Pivot Detection:
Pivot Depth: Bars to look back for swing detection (default: 10)
Min Deviation %: Minimum price move to confirm pivot (default: 1.0)
RSI Settings:
RSI Length: Period for RSI calculation (default: 14)
Source: Price source (default: close)
Overbought: Upper threshold (default: 70)
Oversold: Lower threshold (default: 30)
Fibonacci Display:
Show Fib Lines: Toggle Fibonacci lines (default: enabled)
Show Fib Labels: Toggle price labels (default: enabled)
Show Golden Zone Box: Toggle zone highlight (default: enabled)
Line Width: Thickness of Fibonacci lines (default: 2)
Extend Fib Lines: Extend lines into future (default: enabled)
ZigZag:
Show ZigZag: Toggle connecting lines (default: enabled)
ZigZag Width: Line thickness (default: 2)
Signals:
Show Entry Signals: Toggle BUY/SELL labels (default: enabled)
Show TP Levels: Toggle take profit in dashboard (default: enabled)
Show RSI-Fib Confluence: Toggle confluence analysis (default: enabled)
Dashboard:
Show Dashboard: Toggle information panel (default: enabled)
Position: Choose corner placement
Colors:
Bullish: Color for bullish elements (default: cyan)
Bearish: Color for bearish elements (default: orange)
Neutral: Color for neutral elements (default: gray)
Golden Zone: Color for Golden Zone highlight (default: gold)
How to Use RSI Fibonacci Flow
Identifying Entry Zones:
Wait for price to retrace to the 38.2%-61.8% zone
Check if RSI is approaching oversold (for longs) or overbought (for shorts)
Look for STRONG confluence rating in the dashboard
Enter when BUY or SELL signal appears
Setting Take Profit Targets:
TP1 at 127.2% extension for conservative target
TP2 at 161.8% extension for aggressive target
Consider scaling out at each level
Using the Price Zone:
"BELOW 23.6%" - Price hasn't retraced much; wait for deeper pullback
"23.6% - 38.2%" - Shallow retracement; strong trend continuation possible
"38.2% - 50%" - Good entry zone for trend trades
"GOLDEN ZONE" - Optimal entry zone; highest probability
"61.8% - 78.6%" - Deep retracement; trend may be weakening
"78.6% - 100%" - Very deep; trend reversal possible
"ABOVE/BELOW 100%" - Trend has likely reversed
Confluence Trading Strategy:
Only take trades with confluence score of 3 or higher
STRONG confluence (4-5) warrants larger position size
MODERATE confluence (2-3) warrants smaller position size
WEAK confluence (0-1) - wait for better setup
Alert Conditions
Ten alert conditions are available:
RSI-Fib BUY Signal: Strong bullish confluence detected
RSI-Fib SELL Signal: Strong bearish confluence detected
Price in Golden Zone: Price enters 50%-61.8% zone
New Pivot High: Swing high detected
New Pivot Low: Swing low detected
RSI Overbought: RSI crosses above overbought threshold
RSI Oversold: RSI crosses below oversold threshold
Bullish Divergence: Potential bullish RSI divergence
Bearish Divergence: Potential bearish RSI divergence
Strong Confluence: Confluence score reaches 4 or higher
Understanding Trend Direction
The indicator determines trend based on pivot sequence:
UPTREND: Last pivot was a low after a high (expecting move up)
DOWNTREND: Last pivot was a high after a low (expecting move down)
Fibonacci levels are drawn accordingly:
In uptrend: 0% at swing low, 100% at swing high
In downtrend: 0% at swing high, 100% at swing low
Bar Coloring
When confluence features are enabled:
Cyan bars on strong bullish signals
Orange bars on strong bearish signals
Gold-tinted bars when price is in Golden Zone
Best Practices
Use on 1H timeframe or higher for more reliable pivots
Adjust Pivot Depth based on timeframe (higher for longer timeframes)
Wait for price to enter Golden Zone before considering entries
Confirm RSI is in favorable territory before trading
Use extension levels (127.2%, 161.8%) for realistic profit targets
Combine with support/resistance and candlestick patterns
Higher confluence scores indicate higher probability setups
Limitations
Pivot detection has inherent lag (must wait for confirmation)
Fibonacci levels are subjective - different swings produce different levels
Works best in trending markets with clear swings
RSI can remain overbought/oversold in strong trends
Not all Golden Zone entries will be successful
The source code is open and available for review and modification.
Disclaimer
This indicator is provided for educational and informational purposes only. It is not financial advice. Trading involves substantial risk of loss. Past performance does not guarantee future results. Fibonacci levels are not guaranteed support/resistance - they are probability zones based on historical price behavior. Always conduct your own analysis and use proper risk management.
- Made with passion by officialjackofalltrades :D

Dual Fibonacci Zone & Ranged Vol DCA Strategy - R3c0nTraderWhat does this do?
This is for educational purposes and allows one to backtest two Fibonacci Zones simultaneously. This also includes an option for Ranged Volume as a parameter.
Pre-requisites:
First off, this is a Long only strategy as I wrote it with DCA in mind. It cannot be used for shorting. Shorting defeats the purpose of a DCA bot which has a goal that is Long a position not Short a position. If you want to short, there are plenty of free scripts out there that do this.
You must have some base knowledge or experience with Fibonacci trading, understanding what is ADX, +DI (and -DI), etc.
You can use this script without a 3Commas account and see how 3Commas DCA Bot would perform. However, I highly recommend inexperienced uses get a free account and going through the tutorials, FAQ's and knowledgebase. This would give you a base understanding of the settings you will see in this strategy and why you will need to know them. Only then should you try testing this strategy with a paper bot.
Background
After I had created and released "Fibonacci Zone DCA Strategy", I began expanding and testing other ideas.
The first idea was to add Ranged Volume to the Fibonacci Zone DCA strategy which I wanted for providing further confirmation before entering a trade. The second idea was to add a second Fibonacci Zone that was just as configurable as the first Fibonacci Zone. I managed to add both and they can be easily enabled or disabled via the strategy settings menu.
Things Got Real Interesting
Things got real interesting when I started testing strategies with two Fibonacci zones. Here's a quick list of what I found I was able to do:
Mix and match exit strategies. I could set the Fib-1 zone strategy to exit with a take profit % and separately set the Fib-2 zone strategy to exit when the price crosses the top-high fib border
Trade the trend. A common phrase amongst traders is "the Trend is your friend" and with the help of an additional Fib Zone, I was able to trade the trend more often by using two different Fib Zone strategies which if configured properly can shorten time to re-deploy capital, increase number of closed trades, and in some cases increase net profit.
Trade both bull market uptrends and bear market downtrends in the same strategy. I found I could configure one Fib Zone strategy to be really good in uptrends and another Fib Zone strategy to be really good in downtrends. In some cases, with both Fib Zone strategies enabled together in a single strategy I got better results than if the strategies were backtested separately.
There are many other trade strategies I am finding with this. One could be to trade a convergence or divergence of the two different Fib Zones. This could possibly be achieved by setting one strategy to have different Fibonacci length.
Credits:
Thank you "EvoCrypto" for granting me permission to use "Ranged Volume" to create this strategy
Thank you "eykpunter" for granting me permission to use "Fibonacci Zones" to create this strategy
Thank you "junyou0424" for granting me permission to use "DCA Bot with SuperTrend Emulator" which I used for adding bot inputs, calculations, and strategy

ORB + Expected Move + Trade Bias RWCORB + Expected Move + Trade Bias v3
Overview
A comprehensive 0DTE SPX options trading indicator designed to identify optimal credit spread and iron condor setups based on Opening Range Breakout (ORB) analysis, Expected Move calculations, VWAP dynamics, and multi-factor confidence scoring. The indicator provides specific strike suggestions, real-time position management signals, and exit warnings.
Who This Is For
This indicator is built for traders who sell 0DTE SPX credit spreads (put spreads, call spreads, or iron condors) and want a systematic, data-driven approach to:
Determine trade direction (bullish, bearish, or neutral)
Select appropriate strikes based on market conditions
Manage positions with clear exit signals
Core Components
1. Opening Range Breakout (ORB)
The ORB establishes the initial trading range after market open, serving as the foundation for trade bias determination.
Settings:
ORB Period: Choose 15, 30, 45, or 60 minutes
Shorter periods (15-30 min) = more signals, more noise
Longer periods (45-60 min) = fewer signals, more reliable ranges
ORB Breakout Buffer %: Percentage buffer beyond ORB high/low before confirming breakout (default 0.1%)
Colors: Customize ORB high (green), low (red), and fill colors
How It Works:
Tracks the high and low during the ORB period
After ORB completes, monitors for breakouts above/below with buffer
Counts consecutive bars above/below ORB for confirmation
2. Expected Move (EM)
Calculates the statistically expected daily range based on Average True Range (ATR).
Settings:
ATR Length: Lookback period for ATR calculation (default 14)
ATR Multiplier: Scale the expected move (default 1.0)
Colors: Customize expected move lines and fill
How It Works:
Pulls daily ATR from the previous session
Projects expected move boundaries from session open
Used for strike distance calculations and range containment analysis
3. VWAP Analysis
Volume Weighted Average Price with standard deviation bands provides trend confirmation and stretch detection.
Settings:
Show VWAP: Toggle VWAP line visibility
Show VWAP StdDev Bands: Toggle ±1 standard deviation bands
VWAP Band Multiplier: Adjust band width (default 1.0)
VWAP Slope Lookback: Bars to measure VWAP slope (default 10)
Key Metrics:
VWAP Slope: Normalized slope indicating trend strength
Strong Up (↑↑): > 0.5
Up (↑): 0.3 to 0.5
Flat (—): -0.3 to 0.3
Down (↓): -0.5 to -0.3
Strong Down (↓↓): < -0.5
Stretched Detection: Warns when price is >1.5 standard deviations from VWAP
4. Prior Day Levels (PDH/PDL)
Yesterday's high and low serve as key support/resistance levels where institutional orders often cluster.
Settings:
Show Prior Day High/Low: Toggle PDH/PDL lines
Show Prior Day Close: Optional PDC line
Colors: Customize PDH (teal), PDL (orange), PDC (gray)
Why It Matters:
Price above PDH = strong bullish continuation signal
Price below PDL = strong bearish continuation signal
Price between PDH/PDL = range-bound, favors iron condors
Strikes are adjusted to respect these levels as potential support/resistance
Trade Signal System
Signal Time
Settings:
Signal Time (ET): Choose when the indicator evaluates and locks in the trade signal
1100 = 8:00 AM PT / 11:00 AM ET
1115 = 8:15 AM PT / 11:15 AM ET (default)
1130 = 8:30 AM PT / 11:30 AM ET
1145 = 8:45 AM PT / 11:45 AM ET
1200 = 9:00 AM PT / 12:00 PM ET
Recommendation: Later signal times (8:30-9:00 AM PT) provide more data and reduce morning fakeout signals, but leave less time for theta decay.
Confidence Scoring (9 Factors)
The indicator calculates three scores: Iron Condor (IC), Bullish, and Bearish. The highest score determines the signal.
Factor 1: Price Position vs ORB (max 40 pts)
Inside ORB → +35-40 IC points
Above ORB (confirmed breakout) → +40 Bull points
Below ORB (confirmed breakout) → +40 Bear points
Factor 2: VWAP Slope (max 30 pts)
Flat slope → +25 IC points
Strong positive slope → +30 Bull points
Strong negative slope → +30 Bear points
Factor 3: Price vs VWAP Position (max 20 pts)
Above upper band → +20 Bull points
Below lower band → +20 Bear points
Near VWAP → +12 IC points
Factor 4: VWAP Consistency (max 15 pts)
70%+ bars above VWAP → +15 Bull points
70%+ bars below VWAP → +15 Bear points
Mixed → +10 IC points
Factor 5: Move from Open (max 20 pts)
30% of EM up → +20 Bull points
30% of EM down → +20 Bear points
<12% move either way → +15 IC points
Factor 6: Trend Structure (max 15 pts)
Higher highs + higher lows → +15 Bull points
Lower lows + lower highs → +15 Bear points
No clear structure → +8 IC points
Factor 7: Day Range Containment (max 15 pts)
Range <35% of EM → +15 IC points
Range <50% of EM → +8 IC points
Range >65% of EM → Points to directional score
Factor 8: Gap Behavior (max 12 pts)
Gap up, unfilled, above ORB → +12 Bull points
Gap down, unfilled, below ORB → +12 Bear points
Gap filled, inside ORB → +8 IC points
Factor 9: Prior Day High/Low (max 20 pts)
Above PDH → +20 Bull points
Below PDL → +20 Bear points
Between PDH/PDL → +15-20 IC points
Alignment Bonuses (max 25 pts)
Additional points when multiple factors align in the same direction.
Signal Types
SignalMeaningTradeIRON CONDORRange-bound conditionsSell both put and call credit spreadsPUT SPREADBullish conditionsSell put credit spread onlyCALL SPREADBearish conditionsSell call credit spread onlyNO TRADEConflicting signals or low confidenceStay out
Confidence Levels
ConfidenceColorStrike Mode75%+Green🍆 AGGRESSIVE (tighter strikes, more premium)60-75%Lime/Yellow🌶️ NORMAL (balanced strikes)45-60%Yellow/Orange🐢 CONSERVATIVE (wider strikes, safer)<45%Orange/RedNO TRADE triggered
Strike Suggestions
Base Calculation
For Iron Condors: Strikes are calculated from current price at signal time as the midpoint, ensuring symmetric risk on both sides.
For Directional Spreads: Strikes are calculated from session open, betting on continuation.
Put Strike = Midpoint - (Expected Move × Distance)
Call Strike = Midpoint + (Expected Move × Distance)
Distance Settings:
High Confidence (75%+): 0.60 EM (default) - Tighter strikes, more premium
Mid Confidence (60-75%): 0.70 EM (default) - Balanced
Low Confidence (<60%): 0.80 EM (default) - Wider strikes, safer
Skew Adjustments
When Auto-Adjust for Skew is enabled, strikes are asymmetrically adjusted based on:
VIX Level:
VIX > 20: Puts pushed wider (-0.05), Calls pulled tighter (+0.05)
VIX < 15: Opposite adjustment
2-Day Momentum:
Strong down move: Puts pushed wider
Strong up move: Calls pushed wider
Prior Day Levels:
Below PDL: Puts pushed wider (more downside protection)
Above PDH: Calls pushed wider (more upside protection)
PDH/PDL Strike Reference
If the calculated strike is too close to PDH or PDL, the indicator adjusts to place strikes 10 points beyond these key levels (maximum 20 point adjustment).
Exit Signal System
Three-Stage Warning System
Stage 1: EARLY ⚠️ (Yellow)
Trigger: Price moves against position with:
Below VWAP AND in lower fib zones (for put spreads/IC downside)
Above VWAP AND in upper fib zones (for call spreads/IC upside)
Action: Heightened awareness. Consider reducing position or tightening mental stops.
Note: Only fires once per direction per day to avoid alert fatigue.
Stage 2: CAUTION (Orange)
Trigger:
2+ consecutive bars beyond ORB
Price has traveled 25%+ of the distance to short strike
Action: Actively manage position. Prepare to exit.
Stage 3: EXIT (Red)
Trigger:
3+ consecutive bars beyond ORB (configurable)
Price has traveled 40%+ of the distance to short strike
VWAP slope confirms the move (if enabled)
Action: Close position immediately.
Exit Settings
Exit Confirmation Bars: Consecutive bars required for EXIT signal (default 3)
CAUTION Distance %: How far toward strike before CAUTION (default 25%)
EXIT Distance %: How far toward strike before EXIT (default 40%)
Require VWAP Confirmation: EXIT only fires if VWAP slope confirms direction
Fibonacci Retracement Levels
After signal fires, fib levels are drawn between key price points:
For Iron Condors:
0% = Put Strike
100% = Call Strike
For Put Spreads:
0% = Put Strike (danger zone)
100% = Day High at signal
For Call Spreads:
0% = Day Low at signal
100% = Call Strike (danger zone)
Fib Levels Shown:
0%, 23.6%, 38.2%, 50%, 61.8%, 78.6%, 100%
Fib Zone Tracking: The left table shows current fib zone, color-coded:
Red: Near strikes (danger)
Orange: Approaching strikes
Green: Safe middle zones
Information Tables
Left Table (Position Management)
RowDescriptionSIGNALCurrent trade signal with confidence colorConfConfidence percentageEXITCurrent exit status (HOLD/EARLY/CAUTION/EXIT)Fib ZoneCurrent price position in fib structurePDHPrior day high valuePDLPrior day low valuevs PDPosition relative to prior day rangeModeStrike mode (🍆/🌶️/🐢)PutSuggested short put strikeCallSuggested short call strikeCall Dist% distance traveled toward call strikePut Dist% distance traveled toward put strike
Right Table (Market Factors)
RowDescriptionStructureOverall market structure (BULLISH/BEARISH/RANGE/MIXED)PricePosition relative to ORBVWAPVWAP slope direction and strengthStretchedWarning if price extended from VWAPMoveCurrent move from open as % of EMEM UsedDay range as % of expected moveGapGap status (up/down, filled/unfilled)ReversalV-top or V-bottom detectionConflictAny conflicting signals detectedVIXCurrent VIX levelSkewMomentum-based skew direction
Alerts
The indicator includes pre-configured alerts:
AlertDescriptionEntry: Iron CondorIC signal firedEntry: Put SpreadBullish signal firedEntry: Call SpreadBearish signal firedHigh Confidence EntryAny signal with 75%+ confidenceNo TradeNO TRADE signal firedEARLY WARNINGEarly warning triggeredCAUTIONPosition under pressureEXIT NOWExit signal triggered
Recommended Settings
Conservative (New Traders)
ORB Period: 60 minutes
Signal Time: 1130 (8:30 AM PT)
Min Confidence: 50%
Strike Distances: 0.65 / 0.75 / 0.85
Balanced (Default)
ORB Period: 30-45 minutes
Signal Time: 1115 (8:15 AM PT)
Min Confidence: 45%
Strike Distances: 0.60 / 0.70 / 0.80
Aggressive (Experienced)
ORB Period: 30 minutes
Signal Time: 1100 (8:00 AM PT)
Min Confidence: 40%
Strike Distances: 0.55 / 0.65 / 0.75
Important Notes
This indicator does not guarantee profits. It provides a systematic framework for trade selection and management.
Paper trade first. Test the indicator on historical data and paper trade before using real capital.
Position sizing matters. Never risk more than you can afford to lose on any single trade.
Exits are suggestions. Use the exit signals as guidance, but always apply your own judgment.
Market conditions vary. The indicator performs best in normal volatility environments. Use extra caution during major news events, FOMC days, and earnings season.
SPX/SPY focused. While the indicator may work on other instruments, it was designed specifically for SPX 0DTE options trading.
Version History
v3.0
Added 45/60 minute ORB options
Added configurable signal time (8:00-9:00 AM PT)
Added stretched detection (VWAP distance warning)
Added Prior Day High/Low as scoring factor
Iron Condor strikes now centered on current price (symmetric risk)
Split table UI (left: position, right: factors)
PDH/PDL reference for strike adjustments
Credits
Developed for the 0DTE SPX options trading community. Inspired by SMB Capital's ORB methodology, VWAP analysis techniques, and real-world credit spread trading experience.
Disclaimer: This indicator is for educational and informational purposes only. It is not financial advice. Trading options involves substantial risk of loss and is not suitable for all investors. Past performance is not indicative of future results.

Fibonacci Zones and RejectionsThis tool combines swing structure, Fibonacci retracements and candle-wick rejection logic to highlight high-probability reversal or continuation zones.
What it does
Tracks market structure automatically
Detects swing highs and swing lows based on a user-defined Structure Period.
Marks bullish shifts in structure and bearish shifts with CHoCH labels and Break of Structure (BoS) lines.
Optionally draws a dotted swing trend line between the active swing high and swing low and can show price labels at those swing points.
Draws dynamic Fibonacci retracements on the latest swing
Automatically anchors a Fibonacci retracement between the current swing high and swing low.
Lets you enable/disable individual Fibonacci levels and customize their values, colors and line width.
Can extend Fib levels forward to the latest bar and optionally keep previous Fib structures on the chart for context.
Optionally fills the “Golden Zone” (by default the first two levels, e.g. 0.50 and 0.618) so the core pullback area is visually obvious.
Defines an OTE / “Gold Zone” band from the active Fib levels
Uses the first two Fib lines (by default 0.50 and 0.618 or set another zone such as 61.8% to 78.6%) to form a live “Optimal Trade Entry” band.
Continuously updates this band as new structure forms and swings develop.
Detects rejection candles inside the Fib OTE band
Breaks each candle into upper wick, lower wick, body and total range.
A bullish rejection is a candle where:
Price trades into the OTE band,
The lower wick is a large portion of the bar’s range, and
The body is not tiny (minimum body-to-range ratio is configurable).
A bearish rejection is the mirror condition using the upper wick.
Only candles whose range overlaps the OTE band are considered; this filters for true reactions to the Fib zone.
Plots clear signals and alerts
Bullish OTE rejection is plotted as a large cross at the low of the candle.
Bearish OTE rejection is plotted as a large cross at the high of the candle.
Built-in alertcondition calls allow you to set alerts for:
Bullish OTE Rejection
Bearish OTE Rejection
Optional “debug” markers can show all raw rejection candles and all bars that sit inside the OTE band, to help you understand how the logic behaves.
Use cases
Identify pullback entries into the desired Fib zone after a clear structural move.
Confirm reversals or continuations using wick-based rejection inside a pre-defined Fib discount/premium zone.
Combine with your own higher-timeframe bias or ICT / SMC tools to refine entry timing around key levels.

Fibonacci Levels with MACD ConfirmationHow to Understand and Use the Fibonacci Levels with MACD Confirmation Script
This custom Pine Script is designed to give traders a clear visual framework by combining dynamic Fibonacci retracement levels, MACD histogram confirmation, and volatility-based swing zones. It aims to simplify trend analysis, improve entry timing, and adapt to various market conditions.
How to Interpret the 23.6% & 61.8% Labels
These Fibonacci levels represent key retracement zones where price often reacts during trend pullbacks or reversals.
The 23.6% level indicates a shallow retracement, useful in strong trends where price resumes early.
The 61.8% level is a deeper retracement, often a "last line of defense" before trend invalidation.
The script labels these zones with "CC 23.6" and "CC 61.8" when the price crosses them with MACD histogram confirmation:
Green label (CC) = bullish confirmation
Red label (CC) = bearish confirmation
How to Modify Inputs (Manual Adjustments)
Input Purpose Default How to Use
ATR Period Measures volatility 14 Increase for smoother, slower reactions; reduce for faster swings
Min Lookback Minimum bars for swing zone 20 Avoids short-term noise
Max Lookback Cap for swing zone scan 100 Avoids excessively wide retracement levels
Inverse Candle Chart Flips high/low logic false Enable for inverted analysis or backtesting "opposite logic"
How to Use the Inverse Candle Chart Option
Activating inverse mode flips candle logic:
Highs become negative lows, and vice versa.
Useful for:
Contrarian analysis
Inverse ETFs or short-biased views
Backtesting reverse-pattern behavior
How to Adjust the Style
You can manually personalize the script’s visual appearance:
Change line width in plot(..., linewidth=2) for bolder or thinner Fib levels.
Change colors from color.green, color.red, etc., to suit your theme.
Modify label.size, label.style, and label.color for different labeling visuals.
Customize MACD histogram style from plot.style_columns to other styles like style_histogram.
How the MACD is Set and Displayed
The MACD uses non-standard values:
Fast Length = 24
Slow Length = 52
Signal Smoothing = 18
These values slow down the indicator, reducing noise and aligning better with medium- to long-term trends.
MACD histogram is plotted directly on the main chart for faster, on-screen decision making.
Color-coded histogram:
Green/Lime = Bullish momentum increasing or steady
Red/Maroon = Bearish momentum increasing or steady
How to Use the Indicator in Real-World Trading
This indicator is most effective when used to:
✅ 1. Spot High-Probability Trend Continuation Zones
In a strong trend, price will often retrace to 23.6% or 61.8%, then resume.
Wait for:
Price to cross 23.6 or 61.8
MACD histogram rising (bullish) or falling (bearish)
"CC 23.6" or "CC 61.8" label to appear
🟢 Entry Example: Price retraces to Fib 61.8%, crosses up with green MACD histogram → take long position
✅ 2. Validate Reversal or Breakout Zones
These Fib levels also act as support/resistance.
If price crosses a Fib level but MACD fails to confirm, it may be a fake breakout.
Use confirmation labels only when MACD aligns.
✅ 3. Add Volatility Context (ATR) for Risk Management
The ATR label shows both value and %.
Use ATR to:
Set dynamic stop-losses (e.g., 1.5x ATR below entry)
Decide trade size based on volatility
How to Combine the Indicator With Other Tools
You can combine this script with other technical tools for a powerful trading framework:
🔁 With Moving Averages
Use 50/200 MA for overall trend direction
Take signals only in the direction of MA slope
🔄 With Price Action Patterns
Use the Fib/MACD signals at confluence points:
Support/resistance zones
Breakout retests
Candlestick patterns (pin bars, engulfing)
🔺 With Volume or Order Flow
Combine with volume spikes or order book signals
Confirm that Fib/MACD signals align with strong volume for conviction
✅ Trade Setup Summary
Criteria Long Setup Short Setup
Price at Fib Level At or crossing Fib 23.6 / 61.8 Same
MACD Histogram Rising and above previous bar Falling and below previous bar
Label Appears Green "CC 23.6" or "CC 61.8" Red "CC 23.6" or "CC 61.8"
Optional Filters Trend direction, ATR range, volume, price pattern Same

HarmonicPatternTrackingLibrary "HarmonicPatternTracking"
Library contains few data structures and methods for tracking harmonic pattern trades via pinescript.
method draw(this)
Creates and draws HarmonicDrawing object for given HarmonicPattern
Namespace types: HarmonicPattern
Parameters:
this (HarmonicPattern) : HarmonicPattern object
Returns: current HarmonicPattern object
method addTrade(this)
calculates HarmonicTrade and sets trade object for HarmonicPattern
Namespace types: HarmonicPattern
Parameters:
this (HarmonicPattern) : HarmonicPattern object
Returns: bool true if pattern trades are valid, false otherwise
method delete(this)
Deletes drawing objects of HarmonicDrawing
Namespace types: HarmonicDrawing
Parameters:
this (HarmonicDrawing) : HarmonicDrawing object
Returns: current HarmonicDrawing object
method delete(this)
Deletes drawings of harmonic pattern
Namespace types: HarmonicPattern
Parameters:
this (HarmonicPattern) : HarmonicPattern object
Returns: current HarmonicPattern object
HarmonicDrawing
Drawing objects of Harmonic Pattern
Fields:
xa (series line) : xa line
ab (series line) : ab line
bc (series line) : bc line
cd (series line) : cd line
xb (series line) : xb line
bd (series line) : bd line
ac (series line) : ac line
xd (series line) : xd line
x (series label) : label for pivot x
a (series label) : label for pivot a
b (series label) : label for pivot b
c (series label) : label for pivot c
d (series label) : label for pivot d
xabRatio (series label) : label for XAB Ratio
abcRatio (series label) : label for ABC Ratio
bcdRatio (series label) : label for BCD Ratio
xadRatio (series label) : label for XAD Ratio
HarmonicTrade
Trade tracking parameters of Harmonic Patterns
Fields:
initialEntry (series float) : initial entry when pattern first formed.
entry (series float) : trailed entry price.
initialStop (series float) : initial stop when trade first entered.
stop (series float) : current stop updated as per trailing rules.
target1 (series float) : First target value
target2 (series float) : Second target value
target3 (series float) : Third target value
target4 (series float) : Fourth target value
status (series int) : Trade status referenced as integer
retouch (series bool) : Flag to show if the price retouched after entry
HarmonicProperties
Display and trade calculation properties for Harmonic Patterns
Fields:
fillMajorTriangles (series bool) : Display property used for using linefill for harmonic major triangles
fillMinorTriangles (series bool) : Display property used for using linefill for harmonic minor triangles
majorFillTransparency (series int) : transparency setting for major triangles
minorFillTransparency (series int) : transparency setting for minor triangles
showXABCD (series bool) : Display XABCD pivot labels
lblSizePivots (series string) : Pivot label size
showRatios (series bool) : Display Ratio labels
useLogScaleForScan (series bool) : Use log scale to determine fib ratios for pattern scanning
useLogScaleForTargets (series bool) : Use log scale to determine fib ratios for target calculation
base (series string) : base on which calculation of stop/targets are made.
entryRatio (series float) : fib ratio to calculate entry
stopRatio (series float) : fib ratio to calculate initial stop
target1Ratio (series float) : fib ratio to calculate first target
target2Ratio (series float) : fib ratio to calculate second target
target3Ratio (series float) : fib ratio to calculate third target
target4Ratio (series float) : fib ratio to calculate fourth target
HarmonicPattern
Harmonic pattern object to track entire pattern trade life cycle
Fields:
id (series int) : Pattern Id
dir (series int) : pattern direction
x (series float) : X Pivot
a (series float) : A Pivot
b (series float) : B Pivot
c (series float) : C Pivot
d (series float) : D Pivot
xBar (series int) : Bar index of X Pivot
aBar (series int) : Bar index of A Pivot
bBar (series int) : Bar index of B Pivot
cBar (series int) : Bar index of C Pivot
dBar (series int) : Bar index of D Pivot
przStart (series float) : Start of PRZ range
przEnd (series float) : End of PRZ range
patterns (bool ) : array representing the patterns
patternLabel (series string) : string representation of list of patterns
patternColor (series color) : color assigned to pattern
properties (HarmonicProperties) : HarmonicProperties object containing display and calculation properties
trade (HarmonicTrade) : HarmonicTrade object to track trades
drawing (HarmonicDrawing) : HarmonicDrawing object to manage drawings
Fibonacci Zone Study w/Candles - R3c0nTraderCredits:
Thank you "eykpunter" for granting me permission to use "Fibonacci Zones" to create this study
What does this do? How is it different?
This study was created so it can be used with the strategy 'Fibonacci Zone DCA Strategy - R3c0nTrader' in order to generate buy/sell signals for a 3Commas bot.
I was not able to use "eykpunter's" "Fibonacci Zones" to create these signals as it was missing the code for this. To create the buy or sell signal you need to be able to create an alert for when the price moves through the Fib levels. Unfortunately, the "price" is not available to be selected when creating an alert with the original study. Hence the need to create this new study and to resolve the issue.
This study has overlay turned off by default so it will appear in a separate pane below your active chart. I did this so I can clearly view and separate the strategy from the study.
Steps Overview:
Add the study to your chart
Configure the study to match the Fib length you used in the strategy.
Create Alerts from the study to generate the buy or sell signals to 3Commas
The below steps for creating signals are just examples! Since there are numerous ways you can open or close a trade from a signal, please do your own testing. This cannot be understated.
Example of how to generate buy signals:
After adding the study, select the three dots for this study and click on "Add an alert on Fibonacci Zone Study /w Candles…"
Setup the condition to trigger the alert. If you want to initiate a buy when the price crosses over the top of the lower Fib zone (downtrend zone), then use the following:
Condition>Fibonacci Zone Study>Price High>Crossing Up>Fibonacci Zone Study>Top-Low Fib Border
Options>Once per bar
Expiration>Open-ended
Alert actions>Webhook URL (use the 3Commas webhook URL)
Alert name>Enter a name, "BUY Paper-Fib-Bot"
Message>Use the 3Commas message from the paper bot to open the trade
Example of how to generate sell signals:
After adding the study, select the three dots for this study and click on "Add an alert on Fibonacci Zone Study /w Candles…"
Setup the condition to trigger the alert. If you want to initiate a sell when the price reaches the top of the High Fib zone (uptrend zone), then try the following:
Condition>Fibonacci Zone Study>Price High>Crossing Up>Fibonacci Zone Study>Top-High Fib Border
(Note: I used "Crossing Up" but "Crossing" is another option; I just haven't tested it yet with a paper bot)
Options>Once per bar
Expiration>Open-ended
Alert actions>Webhook URL (use the 3Commas webhook URL)
Alert name>Enter a name, "SELL Paper-Fib-Bot"
Message>Use the 3Commas message from the paper bot to close the trade

Superior-Range Bound Renko - Strategy - 11-29-25 - SignalLynxSuperior-Range Bound Renko Strategy with Advanced Risk Management Template
Signal Lynx | Free Scripts supporting Automation for the Night-Shift Nation 🌙
1. Overview
Welcome to Superior-Range Bound Renko (RBR) — a volatility-aware, structure-respecting swing-trading system built on top of a full Risk Management (RM) Template from Signal Lynx.
Instead of relying on static lookbacks (like “14-period RSI”) or plain MA crosses, Superior RBR:
Adapts its range definition to market volatility in real time
Emulates Renko Bricks on a standard, time-based chart (no Renko chart type required)
Uses a stack of Laguerre Filters to detect genuine impulse vs. noise
Adds an Adaptive SuperTrend powered by a small k-means-style clustering routine on volatility
Under the hood, this script also includes the full Signal Lynx Risk Management Engine:
A state machine that separates “Signal” from “Execution”
Layered exit tools: Stop Loss, Trailing Stop, Staged Take Profit, Advanced Adaptive Trailing Stop (AATS), and an RSI-style stop (RSIS)
Designed for non-repainting behavior on closed candles by basing execution-critical logic on previous-bar data
We are publishing this as an open-source template so traders and developers can leverage a professional-grade RM engine while integrating their own signal logic if they wish.
2. Quick Action Guide (TL;DR)
Best Timeframe:
4 Hours (H4) and above. This is a high-conviction swing-trading system, not a scalper.
Best Assets:
Volatile instruments that still respect market structure:
Bitcoin, Ethereum, Gold (XAUUSD), high-volatility Forex pairs (e.g., GBPJPY), indices with clean ranges.
Strategy Type:
Volatility-Adaptive Trend Following + Impulse Detection.
It hunts for genuine expansion out of ranges, not tiny mean-reversion nibbles.
Key Feature:
Renko Emulation on time-based candles.
We mathematically model Renko Bricks and overlay them on your standard chart to define:
“Equilibrium” zones (inside the brick structure)
“Breakout / impulse” zones (when price AND the impulse line depart from the bricks)
Repainting:
Designed to be non-repainting on closed candles.
All RM execution logic uses confirmed historical data (no future bars, no security() lookahead). Intrabar flicker during formation is allowed, but once a bar closes the engine’s decisions are stable.
Core Toggles & Filters:
Enable Longs and Shorts independently
Optional Weekend filter (block trades on Saturday/Sunday)
Per-module toggles: Stop Loss, Trailing Stop, Staged Take Profits, AATS, RSIS
3. Detailed Report: How It Works
A. The Strategy Logic: Superior RBR
Superior RBR builds its entry signal from multiple mathematical layers working together.
1) Adaptive Lookback (Volatility Normalization)
Instead of a fixed 100-bar or 200-bar range, the script:
Computes ATR-based volatility over a user-defined period.
Normalizes that volatility relative to its recent min/max.
Maps the normalized value into a dynamic lookback window between a minimum and maximum (e.g., 4 to 100 bars).
High Volatility:
The lookback shrinks, so the system reacts faster to explosive moves.
Low Volatility:
The lookback expands, so the system sees a “bigger picture” and filters out chop.
All the core “Range High/Low” and “Range Close High/Low” boundaries are built on top of this adaptive window.
2) Range Construction & Quick Ranges
The engine constructs several nested ranges:
Outer Range:
rangeHighFinal – dynamic highest high
rangeLowFinal – dynamic lowest low
Inner Close Range:
rangeCloseHighFinal – highest close
rangeCloseLowFinal – lowest close
Quick Ranges:
“Half-length” variants of those, used to detect more responsive changes in structure and volatility.
These ranges define:
The macro box price is trading inside
Shorter-term “pressure zones” where price is coiling before expansion
3) Renko Emulation (The Bricks)
Rather than using the Renko chart type (which discards time), this script emulates Renko behavior on your normal candles:
A “brick size” is defined either:
As a standard percentage move, or
As a volatility-driven (ATR) brick, optionally inhibited by a minimum standard size
The engine tracks a base value and derives:
brickUpper – top of the emulated brick
brickLower – bottom of the emulated brick
When price moves sufficiently beyond those levels, the brick “shifts”, and the directional memory (renkoDir) updates:
renkoDir = +2 when bricks are advancing upward
renkoDir = -2 when bricks are stepping downward
You can think of this as a synthetic Renko tape overlaid on time-based candles:
Inside the brick: equilibrium / consolidation
Breaking away from the brick: momentum / expansion
4) Impulse Tracking with Laguerre Filters
The script uses multiple Laguerre Filters to smooth price and brick-derived data without traditional lag.
Key filters include:
LagF_1 / LagF_W: Based on brick upper/lower baselines
LagF_Q: Based on HLCC4 (high + low + 2×close)/4
LagF_Y / LagF_P: Complex averages combining brick structures and range averages
LagF_V (Primary Impulse Line):
A smooth, high-level impulse line derived from a blend of the above plus the outer ranges
Conceptually:
When the impulse line pushes away from the brick structure and continues in one direction, an impulse move is underway.
When its direction flips and begins to roll over, the impulse is fading, hinting at mean reversion back into the range.
5) Fib-Based Structure & Swaps
The system also layers in Fib levels derived from the adaptive ranges:
Standard levels (12%, 23.6%, 38.2%, 50%, 61%, 76.8%, 88%) from the main range
A secondary “swap” set derived from close-range dynamics (fib12Swap, fib23Swap, etc.)
These Fibs are used to:
Bucket price into structural zones (below 12, between 23–38, etc.)
Detect breakouts when price and Laguerre move beyond key Fib thresholds
Drive zSwap logic (where a secondary Fib set becomes the active structure once certain conditions are met)
6) Adaptive SuperTrend with K-Means-Style Volatility Clustering
Under the hood, the script uses a small k-means-style clustering routine on ATR:
ATR is measured over a fixed period
The range of ATR values is split into Low, Medium, High volatility centroids
Current ATR is assigned to the nearest centroid (cluster)
From that, a SuperTrend variant (STK) is computed with dynamic sensitivity:
In quiet markets, SuperTrend can afford to be tighter
In wild markets, it widens appropriately to avoid constant whipsaw
This SuperTrend-based oscillator (LagF_K and its signals) is then combined with the brick and Laguerre stack to confirm valid trend regimes.
7) Final Baseline Signals (+2 / -2)
The “brain” of Superior RBR lives in the Baseline & Signal Generation block:
Two composite signals are built: B1 and B2:
They combine:
Fib breakouts
Renko direction (renkoDir)
Expansion direction (expansionQuickDir)
Multiple Laguerre alignments (LagF_Q, LagF_W, LagF_Y, LagF_Z, LagF_P, LagF_V)
They also factor in whether Fib structures are expanding or contracting.
A user toggle selects the “Baseline” signal:
finalSig = B2 (default) or B1 (alternate baseline)
finalSig is then filtered through the RM state machine and only when everything aligns, we emit:
+2 = Long / Buy signal
-2 = Short / Sell signal
0 = No new trade
Those +2 / -2 values are what feed the Risk Management Engine.
B. The Risk Management (RM) Engine
This script features the Signal Lynx Risk Management Engine, a proprietary state machine built to separate Signal from Execution.
Instead of firing orders directly on indicator conditions, we:
Convert the raw signal into a clean integer (Fin = +2 / -2 / 0)
Feed it into a Trade State Machine that understands:
Are we flat?
Are we in a long or short?
Are we in a closing sequence?
Should we permit re-entry now or wait?
Logic Injection / Template Concept:
The RM engine expects a simple integer:
+2 → Buy
-2 → Sell
Everything else (0) is “no new trade”
This makes the script a template:
You can remove the Superior RBR block
Drop in your own logic (RSI, MACD, price action, etc.)
As long as you output +2 or -2 into the same signal channel, the RM engine can drive all exits and state transitions.
Aggressive vs Conservative Modes:
The input AgressiveRM (Aggressive RM) governs how we interpret signals:
Conservative Mode (Aggressive RM = false):
Uses a more filtered internal signal (AF) to open trades
Effectively waits for a clean trend flip / confirmation before new entries
Minimizes whipsaw at the cost of fewer trades
Aggressive Mode (Aggressive RM = true):
Reacts directly to the fresh alert (AO) pulses
Allows faster re-entries in the same direction after RM-based exits
Still respects your pyramiding setting; this script ships with pyramiding = 0 by default, so it will not stack multiple positions unless you change that parameter in the strategy() call.
The state machine enforces discipline on top of your signal logic, reducing double-fires and signal spam.
C. Advanced Exit Protocols (Layered Defense)
The exit side is where this template really shines. Instead of a single “take profit or stop loss,” it uses multiple, cooperating layers.
1) Hard Stop Loss
A classic percentage-based Stop Loss (SL) relative to the entry price.
Acts as a final “catastrophic protection” layer for unexpected moves.
2) Standard Trailing Stop
A percentage-based Trailing Stop (TS) that:
Activates only after price has moved a certain percentage in your favor (tsActivation)
Then trails price by a configurable percentage (ts)
This is a straightforward, battle-tested trailing mechanism.
3) Staged Take Profits (Three Levels)
The script supports three staged Take Profit levels (TP1, TP2, TP3):
Each stage has:
Activation percentage (how far price must move in your favor)
Trailing amount for that stage
Position percentage to close
Example setup:
TP1:
Activate at +10%
Trailing 5%
Close 10% of the position
TP2:
Activate at +20%
Trailing 10%
Close another 10%
TP3:
Activate at +30%
Trailing 5%
Close the remaining 80% (“runner”)
You can tailor these quantities for partial scaling out vs. letting a core position ride.
4) Advanced Adaptive Trailing Stop (AATS)
AATS is a sophisticated volatility- and structure-aware stop:
Uses Hirashima Sugita style levels (HSRS) to model “floors” and “ceilings” of price:
Dungeon → Lower floors → Mid → Upper floors → Penthouse
These levels classify where current price sits within a long-term distribution.
Combines HSRS with Bollinger-style envelopes and EMAs to determine:
Is price extended far into the upper structure?
Is it compressed near the lower ranges?
From this, it computes an adaptive factor that controls how tight or loose the trailing level (aATS / bATS) should be:
High Volatility / Penthouse areas:
Stop loosens to avoid getting wicked out by inevitable spikes.
Low Volatility / compressed structure:
Stop tightens to lock in and protect profit.
AATS is designed to be the “smart last line” that responds to context instead of a single fixed percentage.
5) RSI-Style Stop (RSIS)
On top of AATS, the script includes a RSI-like regime filter:
A McGinley Dynamic mean of price plus ATR bands creates a dynamic channel.
Crosses above the top band and below the lower band change a directional state.
When enabled (UseRSIS):
RSIS can confirm or veto AATS closes:
For longs: A shift to bearish RSIS can force exits sooner.
For shorts: A shift to bullish RSIS can do the same.
This extra layer helps avoid over-reactive stops in strong trends while still respecting a regime change when it happens.
D. Repainting Protection
Many strategies look incredible in the Strategy Tester but fail in live trading because they rely on intrabar values or future-knowledge functions.
This template is built with closed-candle realism in mind:
The Risk Management logic explicitly uses previous bar data (open , high , low , close ) for the key decisions on:
Trailing stop updates
TP triggers
SL hits
RM state transitions
No security() lookahead or future-bar access is used.
This means:
Backtest behavior is designed to match what you can actually get with TradingView alerts and live automation.
Signals may “flicker” intrabar while the candle is forming (as with any strategy), but on closed candles, the RM decisions are stable and non-repainting.
4. For Developers & Modders
We strongly encourage you to mod this script.
To plug your own strategy into the RM engine:
Look for the section titled:
// BASELINE & SIGNAL GENERATION
You will see composite logic building B1 and B2, and then selecting:
baseSig = B2
altSig = B1
finalSig = sigSwap ? baseSig : altSig
You can replace the content used to generate baseSig / altSig with your own logic, for example:
RSI crosses
MACD histogram flips
Candle pattern detectors
External condition flags
Requirements are simple:
Your final logic must output:
2 → Buy signal
-2 → Sell signal
0 → No new trade
That output flows into the RM engine via finalSig → AlertOpen → state machine → Fin.
Once you wire your signals into finalSig, the entire Risk Management system (Stops, TPs, AATS, RSIS, re-entry logic, weekend filters, long/short toggles) becomes available for your custom strategy without re-inventing the wheel.
This makes Superior RBR not just a strategy, but a reference architecture for serious Pine dev work.
5. About Signal Lynx
Automation for the Night-Shift Nation 🌙
Signal Lynx focuses on helping traders and developers bridge the gap between indicator logic and real-world automation. The same RM engine you see here powers multiple internal systems and templates, including other public scripts like the Super-AO Strategy with Advanced Risk Management.
We provide this code open source under the Mozilla Public License 2.0 (MPL-2.0) to:
Demonstrate how Adaptive Logic and structured Risk Management can outperform static, one-layer indicators
Give Pine Script users a battle-tested RM backbone they can reuse, remix, and extend
If you are looking to automate your TradingView strategies, route signals to exchanges, or simply want safer, smarter strategy structures, please keep Signal Lynx in your search.
License: Mozilla Public License 2.0 (Open Source).
If you make beneficial modifications, please consider releasing them back to the community so everyone can benefit.

FibNexus [CHE]FibNexus — Auto-Fibonacci with Adaptive TrendLen + TFRSI Triggers
What it is.
FibNexus is a chart overlay that auto-anchors Fibonacci levels to the most relevant swing range without any manual timeframe picking. It does this by computing an adaptive trend length (“TrendLen”) from recent price behavior, then drawing retracements/extensions from the detected swing High/Low. A built-in TFRSI module adds LONG/SHORT triggers and ready-made alerts.
What makes FibNexus different (the TrendLen edge)
Most Fibonacci tools either (a) use fixed lookbacks or (b) force you to choose a higher reference timeframe (or a multiplier of it) and then place Fibs on those higher-TF swings. Your earlier Ultimate Fibonacci Trading Tool \ follows that higher-reference approach (auto TF, multiplier, or manual) and emphasizes custom level/label options. ( )
FibNexus flips that workflow:
* It doesn’t rely on a higher timeframe or a static lookback.
* Instead, it measures multiple window lengths inside the current chart timeframe and selects the one that best fits the data right now.
* From that data-driven window, it automatically finds the most recent swing high & low and draws the entire Fib stack from there.
* When the statistically “best” window changes, anchors update once, labels refresh cleanly, and then lines just extend to the right on each new bar.
Result: No more guesswork about “which timeframe or lookback should I use?”—FibNexus adapts the anchors to market conditions and keeps the drawing noise low.
How TrendLen works (transparent, deterministic)
1. Scan windows: The script evaluates a series of lookbacks (10, 20, …, 500 bars).
2. Score by correlation: For each window, it computes the correlation between price and its lagged version and picks the window with the highest correlation (the strongest, most self-consistent trend segment).
3. Anchor the swing: On a confirmed bar and only when TrendLen changes, it scans the last `TrendLen` bars to capture the highest high and lowest low and marks them with “X”.
4. Draw once, extend later: It deletes the old Fib objects, redraws the active levels from those anchors, and from then on extends the lines to the right as new bars print (no redraw spam).
This makes FibNexus responsive (it adapts when the structure shifts) and quiet (it doesn’t constantly repaint Fibs).
Fibonacci engine (levels, labels, direction)
* Retracements: 0.000 · 0.236 · 0.382 · 0.500 · 0.618 · 0.786 · 1.000
* Extensions: 1.618 · 2.618 · 3.618 · 4.236
* Label styles: *Default* (percent + price), *None*, *Percentage*, *Price*
* Label sizing: *tiny → huge*
* Bull/Bear context: Direction is inferred from mid-range positioning; prices are projected accordingly (retracement vs. extension math is handled for both cases).
* Selective toggles: You can show/hide any level and color it independently.
Momentum & signals (TFRSI module)
FibNexus embeds your TFRSI (“The Forbidden RSI \ ”) as the momentum/trigger layer. TFRSI is your open-source oscillator published on TradingView and designed for fast, normalized momentum readouts with customizable length/smoothing. ( )
* Defaults: `TFRSI length = 6`, `signal smoothing = 2`
* Triggers:
* LONG when TFRSI crosses up through the Long level (default 2.0)
* SHORT when TFRSI crosses down through the Short level (default 98.0)
* On-chart labels: Green LONG under the bar, red SHORT above the bar.
* Spam control: Keep only the N most recent labels to avoid clutter.
* Confirmed bars only: Signals/labels finalize at bar close to reduce flicker.
Alerts (ready for TradingView)
* LONG signal (TFRSI crossover)
* SHORT signal (TFRSI crossunder)
* TrendLen changed (anchors/Fibs recalculated)
* Price crossed a Fib level (any active level)
Use the provided `alertcondition(...)` entries in the TV dialog. Optionally enable instant `alert()` calls with verbose text (avoid duplicates if you also add alertconditions).
Typical use-cases & playbook
* Level reaction trading: In trends, watch 0.382 / 0.5 / 0.618 for reaction. A TFRSI up-cross near a retracement in an uptrend is a straightforward continuation setup; the opposite applies in downtrends.
* Breakout objectives: After clearing the 1.000 line (old swing), 1.618 is a common first extension target; beyond that, 2.618/3.618/4.236 map stretch objectives.
* Chop control: In range conditions, keep signals conservative (e.g., stick with the tight defaults 2.0/98.0 or raise thresholds). Always seek confluence (candlesticks, volume, HTF bias).
* Less micromanagement: You don’t need to babysit timeframe selection or anchors—TrendLen recomputes only when the data say so.
Inputs (by group)
* Core: TFRSI length & smoothing.
* Fibonacci Levels: Per-level toggles, numeric values, colors.
* Fibonacci Labels: Style (percentage/price/both/none) and size.
* Signals: Max number of visible LONG/SHORT labels (or 0 = off).
* TFRSI Trigger: Long/Short thresholds (defaults 2.0 / 98.0).
* Alerts: Master enable, per-event toggles, optional instant `alert()`.
Performance & UX
* Overlay indicator; efficient object handling.
* Clean redraw policy: Full re-draw only when TrendLen changes; otherwise Fibs extend horizontally.
* Clarity: Auto-marked swing anchors (“X”), configurable labels/colors.
Credits & references
* TFRSI – “The Forbidden RSI \ ” (open-source publication and description on TradingView). Used here as the momentum basis.
* “Ultimate Fibonacci Trading Tool \ ” (your earlier open-source tool on TradingView). Focuses on higher-reference timeframe selection (auto/multiplier/manual) and rich labeling controls; FibNexus replaces the fixed/higher-TF anchor logic with adaptive TrendLen in the current timeframe.
Risk disclaimer
This indicator is for educational/information purposes only and is not financial advice. No performance guarantees; past behavior does not predict future results. Trading involves substantial risk (including total loss). Always do your own research, test on demo, use risk management, and consult a licensed advisor where appropriate. Use at your own risk.
Disclaimer:
The content provided, including all code and materials, is strictly for educational and informational purposes only. It is not intended as, and should not be interpreted as, financial advice, a recommendation to buy or sell any financial instrument, or an offer of any financial product or service. All strategies, tools, and examples discussed are provided for illustrative purposes to demonstrate coding techniques and the functionality of Pine Script within a trading context.
Any results from strategies or tools provided are hypothetical, and past performance is not indicative of future results. Trading and investing involve high risk, including the potential loss of principal, and may not be suitable for all individuals. Before making any trading decisions, please consult with a qualified financial professional to understand the risks involved.
By using this script, you acknowledge and agree that any trading decisions are made solely at your discretion and risk.
Enhance your trading precision and confidence with FibNexus ! 🚀
Happy trading
Chervolino