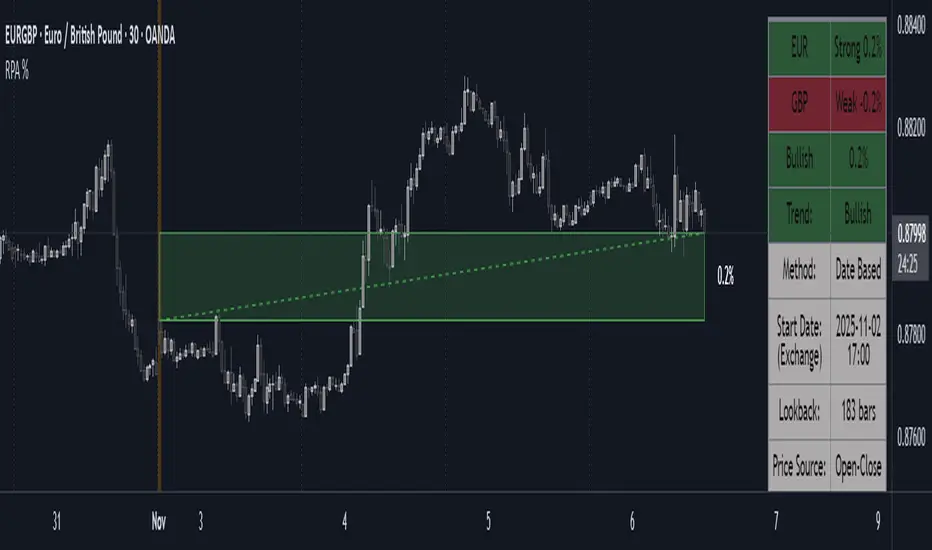
Range Percentage Analyzer This indicator is a tool for analyzing the market range and trend. It calculates the extent of price movement between a specified starting point and the current price, displaying it as a percentage.
The calculation can be based on a fixed lookback period (e.g., the last 30 candles) or from a fixed start date. It also provides a clear table that shows the general trend in "Trend" mode, and the relative strength of the base and quote currencies of forex pairs (e.g., EURUSD) in "Forex" mode.
User Guide
Calculation Method
This setting determines how the indicator defines the starting point for the calculation.
Lookback Period: In this mode, the indicator uses the last N candles (the number can be specified in the "Lookback Period (bars)" field, maximum 250).
The starting point is "floating," meaning it shifts with each new candle. For example, with a setting of 30, the 30th candle from the current one will always be the starting point.
Date Based: In this mode, the calculation starts from a fixed date and time you select.
This mode is ideal for measuring performance from a specific event (e.g., news, start of a week/month).
Note: If you select a date in "Date Based" mode for which no data is available on the current timeframe (e.g., switching to a very low timeframe), the indicator will automatically use the earliest available candle as the starting point.
Start Date & Time
This setting is only active in "Date Based" mode.
Here you can specify the fixed starting point for the calculation.
The specified time is in the Exchange timezone.
Important limitation: Due to TradingView platform limits, visual elements (box, line) are only drawn for a maximum of 250 candles back.
If the set date is older than this, the calculation still applies to the entire period (from the set date), but the drawing only covers the last 250 candles.
When switching to a higher timeframe, the range may restart from a slightly later bar due to TradingView's bar alignment. For best accuracy, set your timeframe first, then select the start date.
Table Mode
This setting controls what data the information table displays.
Trend: This is the default mode, which works on any symbol (stock, index, crypto, etc.). It displays information related to the trend.
Forex: This is a special mode used to measure the strength of currency pairs.
It only works on symbols with exactly 6 characters (e.g., "EURUSD", "BTCUSD"). It treats the first 3 characters as the base currency (e.g., EUR) and the last 3 as the quote currency (e.g., USD).
If the symbol does not have 6 characters, the table will automatically display in "Trend" mode.
Extremes Trend Row
If this is enabled, the table displays an additional row that determines the trend based on the formation order of the high and low within the analyzed range.
The logic is as follows:
Bullish: Indicated if the low was formed before the high.
(Or if they formed on the same candle, which was a bullish candle).
Bearish: Indicated if the high was formed before the low.
(Or if they formed on the same candle, which was a bearish candle).
Neutral: Indicated if the high and low formed on the same candle, and it was a "doji" candle (close = open).
Upper & Lower Threshold
These settings control the logic for the "Change Trend" and "Forex Display" rows at the top of the table.
They determine when the total percentage change for the entire period is considered "Bullish/Strong", "Bearish/Weak", or "Neutral".
Upper Threshold (%): The percentage value (default 0.1%) above which the indicator considers the change "Bullish/Strong".
Lower Threshold (%): The percentage value (default -0.1%) below which the indicator considers the change "Bearish/Weak".
If the change is between the two, the signal is Neutral.
ابحث في النصوص البرمجية عن "forex"
Advanced Psychological Levels with Dynamic Spacing═══════════════════════════════════════
ADVANCED PSYCHOLOGICAL LEVELS WITH DYNAMIC SPACING
═══════════════════════════════════════
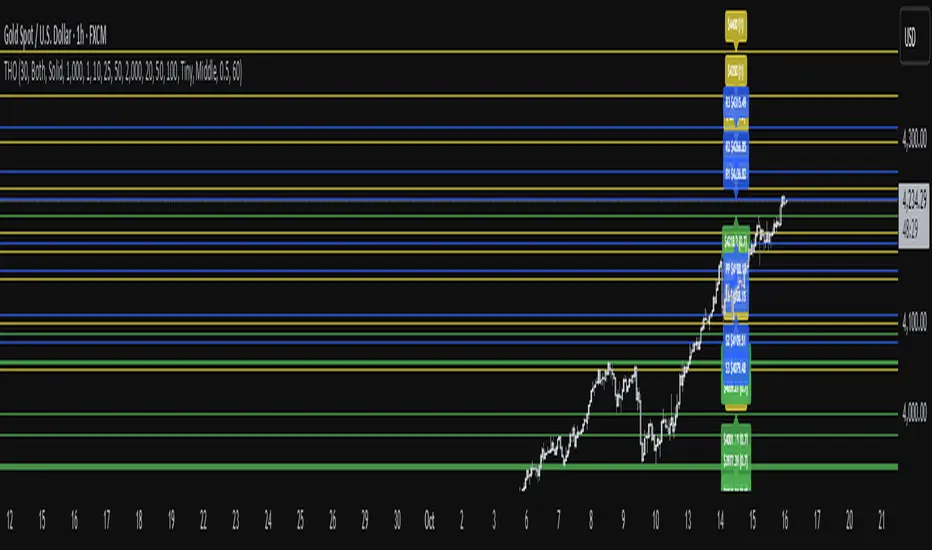
A comprehensive psychological price level indicator that automatically identifies and displays round number levels across multiple timeframes. Features dynamic ATR-based spacing, smart crypto detection, distance tracking, and customizable alert system.
───────────────────────────────────────
WHAT THIS INDICATOR DOES
───────────────────────────────────────
This indicator automatically draws psychological price levels (round numbers) that often act as support and resistance:
- Dynamic ATR-Based Spacing - Adapts level spacing to market volatility
- Multiple Level Types - Major (250 pip), Standard (100 pip), Mid, and Intraday levels
- Smart Asset Detection - Automatically adjusts for Forex, Crypto, Indices, and CFDs
- Crypto Price Adaptation - Intelligent level spacing based on cryptocurrency price magnitude
- Distance Information Table - Real-time percentage distance to nearest levels
- Combined Level Labels - Clear identification when multiple level types coincide
- Performance Optimized - Configurable visible range and label limits
- Comprehensive Alerts - Notifications when price crosses any level type
───────────────────────────────────────
HOW IT WORKS
───────────────────────────────────────
PSYCHOLOGICAL LEVELS CONCEPT:
Psychological levels are round numbers where traders tend to place orders, creating natural support and resistance zones. These include:
- Forex: 1.0000, 1.0100, 1.0050 (pips)
- Crypto: $100, $1,000, $10,000 (whole numbers)
- Indices: 10,000, 10,500, 11,000 (points)
Why They Matter:
- Traders naturally gravitate to round numbers
- Stop losses cluster at these levels
- Take profit orders concentrate here
- Institutional algorithmic trading often targets these levels
DYNAMIC ATR-BASED SPACING:
Traditional Method:
- Fixed spacing regardless of volatility
- May be too tight in volatile markets
- May be too wide in quiet markets
Dynamic Method (Recommended):
- Uses ATR (Average True Range) to measure volatility
- Automatically adjusts level spacing
- Tighter levels in low volatility
- Wider levels in high volatility
Calculation:
1. Calculate ATR over specified period (default: 14)
2. Multiply by ATR multiplier (default: 2.0)
3. Round to nearest psychological level
4. Generate levels at dynamic intervals
Benefits:
- Adapts to market conditions
- More relevant levels in all volatility regimes
- Reduces clutter in trending markets
- Provides more detail in ranging markets
LEVEL TYPES:
Major Levels (250 pip/point):
- Highest significance
- Primary support/resistance zones
- Color: Red (default)
- Style: Solid lines
- Spacing: 2.5x standard step
Standard Levels (100 pip/point):
- Secondary importance
- Common psychological barriers
- Color: Blue (default)
- Style: Dashed lines
- Spacing: Standard step
Mid Levels (50% between major):
- Optional intermediate levels
- Halfway between major levels
- Color: Gray (default)
- Style: Dotted lines
- Usage: Additional confluence points
Intraday Levels (sub-100 pip):
- For intraday traders
- Fine-grained precision
- Color: Yellow (default)
- Style: Dotted lines
- Only shown on intraday timeframes
SMART ASSET DETECTION:
Forex Pairs:
- Detects major currency pairs automatically
- Uses pip-based calculations
- Standard: 100 pips (0.0100)
- Major: 250 pips (0.0250)
- Intraday: 20, 50, 80 pip subdivisions
Cryptocurrencies:
- Automatic price magnitude detection
- Adaptive spacing based on price:
* Under $0.10: Levels at $0.01, $0.05
* $0.10-$1: Levels at $0.10, $0.50
* $1-$10: Levels at $1, $5
* $10-$100: Levels at $10, $50
* $100-$1,000: Levels at $100, $500
* $1,000-$10,000: Levels at $1,000, $5,000
* Over $10,000: Levels at $5,000, $10,000
Indices & CFDs:
- Fixed point-based system
- Major: 500 point intervals (with 250 sub-levels)
- Standard: 100 point intervals
- Suitable for stock indices like SPX, NASDAQ
COMBINED LEVEL LABELS:
When multiple level types coincide at the same price:
- Single line drawn (highest priority color)
- Combined label shows all types
- Priority: Major > Standard > Mid > Intraday
Example Label Formats:
- "1.1000 Major" - Major level only
- "1.1000 Std + Major" - Both standard and major
- "50000 Intra + Mid + Std" - Three levels coincide
Benefits:
- Cleaner chart appearance
- Clear identification of confluence
- Reduced visual clutter
- Easy to spot high-importance levels
DISTANCE INFORMATION TABLE:
Real-time tracking of nearest levels:
Table Contents:
- Nearest major level above (price and % distance)
- Nearest standard level above (price and % distance)
- Nearest standard level below (price and % distance)
Display:
- Top right corner (configurable)
- Color-coded by level type
- Real-time percentage calculations
- Helpful for position management
Usage:
- Identify proximity to key levels
- Set realistic profit targets
- Gauge potential move magnitude
- Monitor approaching resistance/support
ALERT SYSTEM:
Comprehensive crossing alerts:
Alert Types:
- Major Level Crosses
- Standard Level Crosses
- Intraday Level Crosses
Alert Modes:
- First Cross Only: Alert once when level is crossed
- All Crosses: Alert every time level is crossed
Alert Information:
- Level type crossed
- Specific price level
- Direction (above/below)
- One alert per bar to prevent spam
Configuration:
- Enable/disable by level type
- Choose alert frequency
- Customize for your trading style
───────────────────────────────────────
HOW TO USE
───────────────────────────────────────
INITIAL SETUP:
General Settings:
1. Enable "Use Dynamic ATR-Based Spacing" (recommended)
2. Set ATR Period (14 is standard)
3. Adjust ATR Multiplier (2.0 is balanced)
Visibility Settings:
1. Set Visible Range % (10% recommended for clarity)
2. Adjust Label Offset for readability
3. Configure performance limits if needed
Level Selection:
1. Enable/disable level types based on trading style
2. Adjust line counts for each type
3. Choose line styles and colors for visibility
TRADING STRATEGIES:
Breakout Trading:
1. Wait for price to approach major or standard level
2. Monitor for consolidation near level
3. Enter on confirmed break above/beyond level
4. Stop loss just beyond the broken level
5. Target: Next major or standard level
Rejection Trading:
1. Identify major psychological level
2. Wait for price to test the level
3. Look for rejection signals (wicks, bearish/bullish candles)
4. Enter in direction of rejection
5. Stop beyond the level
6. Target: Previous level or mid-level
Range Trading:
1. Identify range between two major levels
2. Buy at lower psychological level
3. Sell at upper psychological level
4. Use standard and mid-levels for position management
5. Exit if major level breaks with volume
Confluence Trading:
1. Look for combined levels (Std + Major)
2. These represent high-probability zones
3. Use as primary support/resistance
4. Increase position size at confluence
5. Expect stronger reactions at these levels
Session-Based Trading:
1. Note opening level at session start (Asian/London/NY)
2. Trade breakouts of major levels during high-volume sessions
3. London/NY sessions: More likely to break levels
4. Asian session: More likely to respect levels (range trading)
RISK MANAGEMENT WITH PSYCHOLOGICAL LEVELS:
Stop Loss Placement:
- Place stops just beyond psychological levels
- Add buffer (5-10 pips for forex)
- Avoid exact round numbers (stop hunting risk)
- Use previous major level as maximum stop
Take Profit Strategy:
- First target: Next standard level (partial profit)
- Second target: Next major level (remaining position)
- Trail stops to breakeven at first target
- Use distance table to calculate risk/reward
Position Sizing:
- Larger positions at major levels (higher probability)
- Smaller positions at intraday levels (lower probability)
- Scale in at standard levels between major levels
- Reduce size when multiple levels are close together
TIMEFRAME CONSIDERATIONS:
Higher Timeframes (4H, Daily, Weekly):
- Focus on Major and Standard levels only
- Disable Intraday and Mid levels
- Wider level spacing expected
- Use for swing trading and position trading
Lower Timeframes (5m, 15m, 1H):
- Enable all level types
- Use Intraday levels for precision
- Tighter level spacing acceptable
- Good for day trading and scalping
Multi-Timeframe Approach:
- Identify major levels on Daily/4H charts
- Refine entries using 15m/1H intraday levels
- Trade in direction of higher timeframe bias
- Use lower timeframe levels for position management
───────────────────────────────────────
CONFIGURATION GUIDE
───────────────────────────────────────
GENERAL SETTINGS:
Dynamic ATR-Based Spacing:
- Enabled: Recommended for most markets
- Disabled: Fixed psychological levels
- ATR Period: 14 (standard), 10 (responsive), 20 (smooth)
- ATR Multiplier: 1.0-5.0 (2.0 is balanced)
VISIBILITY SETTINGS:
Visible Range %:
- 5%: Very tight range, minimal clutter
- 10%: Balanced view (recommended)
- 20%: Wide range, more context
- 50%: Maximum range, all levels visible
Label Offset:
- 10-20 bars: Close to current price
- 30-50 bars: Moderate distance
- 50-100 bars: Far from price action
Performance Limits:
- Max Historical Bars: Reduce if indicator loads slowly
- Max Labels: Reduce for cleaner chart (20-30 recommended)
LEVEL CUSTOMIZATION:
Line Count:
- Lower (1-3): Cleaner chart, fewer levels
- Medium (4-6): Balanced view
- Higher (7-10): More context, busier chart
Line Styles:
- Solid: High importance, easy to see
- Dashed: Medium importance, clear but subtle
- Dotted: Low importance, minimal visual weight
Colors:
- Use contrasting colors for different level types
- Red/Blue/Yellow default works well
- Adjust based on chart background and personal preference
DISTANCE TABLE:
Position:
- Top Right: Doesn't interfere with price action
- Top Left: Good for right-side price scale
- Bottom positions: Less common but available
Colors:
- Default (white text, dark background) works for most charts
- Match your chart theme for consistency
- Ensure text is readable against background
ALERT CONFIGURATION:
Alert by Level Type:
- Major: Most important, fewer false signals
- Standard: Balance of frequency and importance
- Intraday: Many signals, best for active traders
Alert Frequency:
- First Cross Only: Cleaner, less noise (recommended for swing trading)
- All Crosses: Every touch, good for scalping
Alert Setup in TradingView:
1. Configure desired alert types in indicator settings
2. Right-click chart → Add Alert
3. Select this indicator
4. Choose "Any alert() function call"
5. Set delivery method (mobile, email, webhook)
───────────────────────────────────────
ASSET-SPECIFIC TIPS
───────────────────────────────────────
FOREX (EUR/USD, GBP/USD, etc.):
- Major levels at x.x000, x.x500
- Standard levels at x.xx00
- Intraday levels at 20/50/80 pips
- Most effective during London/NY sessions
- Watch for "figure" levels (1.0000, 1.1000)
CRYPTOCURRENCIES (BTC, ETH, etc.):
- Enable dynamic spacing for volatile markets
- Levels adjust automatically based on price
- Watch major $1,000 increments for BTC
- $100 levels important for ETH
- Smaller caps: Use standard levels
- High volatility: Increase ATR multiplier to 3.0
STOCK INDICES (SPX, NASDAQ, etc.):
- 100-point levels most important
- 500-point levels for major S/R
- 50-point mid-levels for refinement
- Watch end-of-day for level reactions
- Futures often lead spot on level breaks
GOLD/COMMODITIES:
- Major levels at $50 increments ($1,900, $1,950)
- Standard levels at $10 increments
- Very reactive to psychological levels
- Watch for false breaks during low volume
- Best reactions during active trading hours
───────────────────────────────────────
BEST PRACTICES
───────────────────────────────────────
Chart Setup:
- Use clean price action charts
- Avoid too many indicators
- Ensure psychological levels are clearly visible
- Match colors to your chart theme
Level Selection:
- Start with Major and Standard levels only
- Add Mid and Intraday as needed
- Less is more - avoid chart clutter
- Adjust based on timeframe
Combining with Other Tools:
- Volume profile for confluence
- Trendlines intersecting psychological levels
- Moving averages near round numbers
- Fibonacci levels coinciding with psychological levels
Common Mistakes to Avoid:
- Trading every level touch (be selective)
- Ignoring volume confirmation
- Setting stops exactly at levels (stop hunting)
- Forgetting to adjust for different assets
- Over-relying on levels without price action confirmation
Performance Optimization:
- Reduce visible range for faster loading
- Lower max historical bars on lower timeframes
- Limit labels to 30-50 for clarity
- Disable unused level types
───────────────────────────────────────
EDUCATIONAL DISCLAIMER
───────────────────────────────────────
This indicator identifies psychological price levels based on round numbers that tend to act as support and resistance. The methodology includes:
- Round number detection algorithms
- ATR-based dynamic spacing calculations
- Asset-specific level determination
- Distance percentage calculations
Psychological levels are a recognized concept in technical analysis, studied by traders and institutions. However, they do not guarantee price reactions and should be used as part of a comprehensive trading strategy including proper risk management, volume analysis, and price action confirmation.
───────────────────────────────────────
USAGE DISCLAIMER
───────────────────────────────────────
This tool is for educational and analytical purposes. Psychological levels can act as support or resistance but price reactions are not guaranteed. Dynamic spacing may generate different levels in different market conditions. Always conduct independent analysis, use proper risk management, and never risk capital you cannot afford to lose. Past performance does not indicate future results.
───────────────────────────────────────
CREDITS & ATTRIBUTION
───────────────────────────────────────
Original Concept: Sonar Lab

Opening Range Breakout with Multi-Timeframe Liquidity]═══════════════════════════════════════
OPENING RANGE BREAKOUT WITH MULTI-TIMEFRAME LIQUIDITY
═══════════════════════════════════════
A professional Opening Range Breakout (ORB) indicator enhanced with multi-timeframe liquidity detection, trading session visualization, volume analysis, and trend confirmation tools. Designed for intraday trading with comprehensive alert system.
───────────────────────────────────────
WHAT THIS INDICATOR DOES
───────────────────────────────────────
This indicator combines multiple trading concepts:
- Opening Range Breakout (ORB) - Customizable time period detection with automatic high/low identification
- Multi-Timeframe Liquidity - HTF (Higher Timeframe) and LTF (Lower Timeframe) key level detection
- Trading Sessions - Tokyo, London, New York, and Sydney session visualization
- Volume Analysis - Volume spike detection and strength measurement
- Multi-Timeframe Confirmation - Trend bias from higher timeframes
- EMA Integration - Trend filter and dynamic support/resistance
- Smart Alerts - Quality-filtered breakout notifications
───────────────────────────────────────
HOW IT WORKS
───────────────────────────────────────
OPENING RANGE BREAKOUT (ORB):
Concept:
The Opening Range is a period at the start of a trading session where price establishes an initial high and low. Breakouts beyond this range often indicate the direction of the day's trend.
Detection Method:
- Default: 15-minute opening range (configurable)
- Custom Range: Set specific session times with timezone support
- Automatically identifies ORH (Opening Range High) and ORL (Opening Range Low)
- Tracks ORB mid-point for reference
Range Establishment:
1. Session starts (or custom time begins)
2. Tracks highest high and lowest low during the period
3. Range confirmed at end of opening period
4. Levels extend throughout the session
Breakout Detection:
- Bullish Breakout: Close above ORH
- Bearish Breakout: Close below ORL
- Mid-point acts as bias indicator
Visual Display:
- Shaded box during range formation
- Horizontal lines for ORH, ORL, and mid-point
- Labels showing level values
- Color-coded fills based on selected method
Fill Color Methods:
1. Session Comparison:
- Green: Current OR mid > Previous OR mid
- Red: Current OR mid < Previous OR mid
- Gray: Equal or first session
- Shows day-over-day momentum
2. Breakout Direction (Recommended):
- Green: Price currently above ORH (bullish breakout)
- Red: Price currently below ORL (bearish breakout)
- Gray: Price inside range (no breakout)
- Real-time breakout status
MULTI-TIMEFRAME LIQUIDITY:
Two-Tier System for comprehensive level identification:
HTF (Higher Timeframe) Key Liquidity:
- Default: 4H timeframe (configurable to Daily, Weekly)
- Identifies major institutional levels
- Uses pivot detection with adjustable parameters
- Suitable for swing highs/lows where large orders rest
LTF (Lower Timeframe) Key Liquidity:
- Default: 1H timeframe (configurable)
- Provides precision entry/exit levels
- Finer granularity for intraday trading
- Captures minor swing points
Calculation Method:
- Pivot high/low detection algorithm
- Configurable left bars (lookback) and right bars (confirmation)
- Timeframe multiplier for accurate multi-timeframe detection
- Automatic level extension
Mitigation System:
- Tracks when levels are swept (broken)
- Configurable mitigation type: Wick or Close-based
- Option to remove or show mitigated levels
- Display limit prevents chart clutter
Asset-Specific Optimization:
The indicator includes quick reference settings for different assets:
- Major Forex (EUR/USD, GBP/USD): Default settings optimal
- Crypto (BTC/ETH): Left=12, Right=4, Display=7
- Gold: HTF=1D, Left=20
TRADING SESSIONS:
Four Major Sessions with Full Customization:
Tokyo Session:
- Default: 04:00-13:00 UTC+4
- Asian trading hours
- Often sets daily range
London Session:
- Default: 11:00-20:00 UTC+4
- Highest liquidity period
- Major institutional activity
New York Session:
- Default: 16:00-01:00 UTC+4
- US market hours
- High-impact news events
Sydney Session:
- Default: 01:00-10:00 UTC+4
- Earliest Asian activity
- Lower volatility
Session Features:
- Shaded background boxes
- Session name labels
- Optional open/close lines
- Session high/low tracking with colored lines
- Each session has independent color settings
- Fully customizable times and timezones
VOLUME ANALYSIS:
Volume-Based Trade Confirmation:
Volume MA:
- Configurable period (default: 20)
- Establishes average volume baseline
- Used for spike detection
Volume Spike Detection:
- Identifies when volume exceeds MA * multiplier
- Default: 1.5x average volume
- Confirms breakout strength
Volume Strength Measurement:
- Calculates current volume as percentage of average
- Shows relative volume intensity
- Used in alert quality filtering
High Volume Bars:
- Identifies bars above 50th percentile
- Additional confirmation layer
- Indicates institutional participation
MULTI-TIMEFRAME CONFIRMATION:
Trend Bias from Higher Timeframes:
HTF 1 (Trend):
- Default: 1H timeframe
- Uses EMA to determine intermediate trend
- Compares current timeframe EMA to HTF EMA
HTF 2 (Bias):
- Default: 4H timeframe
- Uses 50 EMA for longer-term bias
- Confirms overall market direction
Bias Classifications:
- Bullish Bias: HTF close > HTF 50 EMA AND Current EMA > HTF1 EMA
- Bearish Bias: HTF close < HTF 50 EMA AND Current EMA < HTF1 EMA
- Neutral Bias: Mixed signals between timeframes
EMA Stack Analysis:
- Compares EMA alignment across timeframes
- +1: Bullish stack (lower TF EMA > higher TF EMA)
- -1: Bearish stack (lower TF EMA < higher TF EMA)
- 0: Neutral/crossed
Usage:
- Filters false breakouts
- Confirms trend direction
- Improves trade quality
EMA INTEGRATION:
Dynamic EMA for Trend Reference:
Features:
- Configurable period (default: 20)
- Customizable color and width
- Acts as dynamic support/resistance
- Trend filter for ORB trades
Application:
- Above EMA: Favor long breakouts
- Below EMA: Favor short breakouts
- EMA cross: Potential trend change
- Distance from EMA: Momentum gauge
SMART ALERT SYSTEM:
Quality-Filtered Breakout Notifications:
Alert Types:
1. Standard ORB Breakout
2. High Quality ORB Breakout
Quality Criteria:
- Volume Confirmation: Volume > 1.2x average
- MTF Confirmation: Bias aligned with breakout direction
Standard Alert:
- Basic breakout detection
- Price crosses ORH or ORL
- Icon: 🚀 (bullish) or 🔻 (bearish)
High Quality Alert:
- Both volume AND MTF confirmed
- Stronger probability setup
- Icon: 🚀⭐ (bullish) or 🔻⭐ (bearish)
Alert Information Includes:
- Alert quality rating
- Breakout level and current price
- Volume strength percentage (if enabled)
- MTF bias status (if enabled)
- Recommended action
One Alert Per Bar:
- Prevents alert spam
- Uses flag system to track sent alerts
- Resets on new ORB session
───────────────────────────────────────
HOW TO USE
───────────────────────────────────────
OPENING RANGE SETUP:
Basic Configuration:
1. Select time period for opening range (default: 15 minutes)
2. Choose fill color method (Breakout Direction recommended)
3. Enable historical data display if needed
Custom Range (Advanced):
1. Enable Custom Range toggle
2. Set specific session time (e.g., 0930-0945)
3. Select appropriate timezone
4. Useful for specific market opens (NYSE, LSE, etc.)
LIQUIDITY LEVELS SETUP:
Quick Configuration by Asset:
- Forex: Use default settings (Left=15, Right=5)
- Crypto: Set Left=12, Right=4, Display=7
- Gold: Set HTF=1D, Left=20
HTF Liquidity:
- Purpose: Major support/resistance levels
- Recommended: 4H for day trading, 1D for swing trading
- Use as profit targets or reversal zones
LTF Liquidity:
- Purpose: Entry/exit refinement
- Recommended: 1H for day trading, 4H for swing trading
- Use for position management
Mitigation Settings:
- Wick-based: More sensitive (default)
- Close-based: More conservative
- Remove or Show mitigated levels based on preference
TRADING SESSIONS SETUP:
Enable/Disable Sessions:
- Master toggle for all sessions
- Individual session controls
- Show/hide session names
Session High/Low Lines:
- Enable to see session extremes
- Each session has custom colors
- Useful for range trading
Customization:
- Adjust session times for your broker
- Set timezone to match your location
- Customize colors for visibility
VOLUME ANALYSIS SETUP:
Enable Volume Analysis:
1. Toggle on Volume Analysis
2. Set MA length (20 recommended)
3. Adjust spike multiplier (1.5 typical)
Usage:
- Confirm breakouts with volume
- Identify climactic moves
- Filter false signals
MULTI-TIMEFRAME SETUP:
HTF Selection:
- HTF 1 (Trend): 1H for day trading, 4H for swing
- HTF 2 (Bias): 4H for day trading, 1D for swing
Interpretation:
- Trade only with bias alignment
- Neutral bias: Be cautious
- Bias changes: Potential reversals
EMA SETUP:
Configuration:
- Period: 20 for responsive, 50 for smoother
- Color: Choose contrasting color
- Width: 1-2 for visibility
Usage:
- Filter trades: Long above, Short below
- Dynamic support/resistance reference
- Trend confirmation
ALERT SETUP:
TradingView Alert Creation:
1. Enable alerts in indicator settings
2. Enable ORB Breakout Alerts
3. Right-click chart → Add Alert
4. Select this indicator
5. Choose "Any alert() function call"
6. Configure delivery method (mobile, email, webhook)
Alert Filtering:
- All alerts include quality rating
- High Quality alerts = Volume + MTF confirmed
- Standard alerts = Basic breakout only
───────────────────────────────────────
TRADING STRATEGIES
───────────────────────────────────────
CLASSIC ORB STRATEGY:
Setup:
1. Wait for opening range to complete
2. Price breaks and closes above ORH or below ORL
3. Volume > average (if enabled)
4. MTF bias aligned (if enabled)
Entry:
- Bullish: Buy on break above ORH
- Bearish: Sell on break below ORL
- Consider retest entries for better risk/reward
Stop Loss:
- Bullish: Below ORL or range mid-point
- Bearish: Above ORH or range mid-point
- Adjust based on volatility
Targets:
- Initial: Range width extension (ORH + range width)
- Secondary: HTF liquidity levels
- Final: Session high/low or major support/resistance
ORB + LIQUIDITY CONFLUENCE:
Enhanced Setup:
1. Opening range established
2. HTF liquidity level near or beyond ORH/ORL
3. Breakout occurs with volume
4. Price targets the liquidity level
Entry:
- Enter on ORB breakout
- Target the HTF liquidity level
- Use LTF liquidity for position management
Management:
- Partial profits at ORB + range width
- Move stop to breakeven at LTF liquidity
- Final exit at HTF liquidity sweep
ORB REJECTION STRATEGY (Counter-Trend):
Setup:
1. Price breaks above ORH or below ORL
2. Weak volume (below average)
3. MTF bias opposite to breakout
4. Price closes back inside range
Entry:
- Failed bullish break: Short below ORH
- Failed bearish break: Long above ORL
Stop Loss:
- Beyond the failed breakout level
- Or beyond session extreme
Target:
- Opposite end of opening range
- Range mid-point for partial profit
SESSION-BASED ORB TRADING:
Tokyo Session:
- Typically narrower ranges
- Good for range trading
- Wait for London open breakout
London Session:
- Highest volume and volatility
- Strong ORB setups
- Major liquidity sweeps common
New York Session:
- Strong trending moves
- News-driven volatility
- Good for momentum trades
Sydney Session:
- Quieter conditions
- Suitable for range strategies
- Sets up Tokyo session
EMA-FILTERED ORB:
Rules:
- Only take bullish breaks if price > EMA
- Only take bearish breaks if price < EMA
- Ignore counter-trend breaks
Benefits:
- Reduces false signals
- Aligns with larger trend
- Improves win rate
───────────────────────────────────────
CONFIGURATION GUIDE
───────────────────────────────────────
OPENING RANGE SETTINGS:
Time Period:
- 15 min: Standard for most markets
- 30 min: Wider range, fewer breakouts
- 60 min: For slower markets or swing trades
Custom Range:
- Use for specific market opens
- NYSE: 0930-1000 EST
- LSE: 0800-0830 GMT
- Set timezone to match exchange
Historical Display:
- Enable: See all previous session data
- Disable: Cleaner chart, current session only
LIQUIDITY SETTINGS:
Left Bars (5-30):
- Lower: More frequent, sensitive levels
- Higher: Fewer, more significant levels
- Recommended: 15 for most markets
Right Bars (1-25):
- Confirmation period
- Higher: More reliable, less frequent
- Recommended: 5 for balance
Display Limit (1-20):
- Number of active levels shown
- Higher: More context, busier chart
- Recommended: 7 for clarity
Extension Options:
- Short: Levels visible near formation
- Current: Extended to current bar (recommended)
- Max: Extended indefinitely
VOLUME SETTINGS:
MA Length (5-50):
- Shorter: More responsive to spikes
- Longer: Smoother baseline
- Recommended: 20 for balance
Spike Multiplier (1.0-3.0):
- Lower: More sensitive spike detection
- Higher: Only extreme spikes
- Recommended: 1.5 for day trading
MULTI-TIMEFRAME SETTINGS:
HTF 1 (Trend):
- 5m chart: Use 15m or 1H
- 15m chart: Use 1H or 4H
- 1H chart: Use 4H or 1D
HTF 2 (Bias):
- One level higher than HTF 1
- Provides longer-term context
- Don't use same as HTF 1
EMA SETTINGS:
Length:
- 20: Responsive, more signals
- 50: Smoother, stronger filter
- 200: Long-term trend only
Style:
- Choose contrasting color
- Width 1-2 for visibility
- Match your trading style
───────────────────────────────────────
BEST PRACTICES
───────────────────────────────────────
Chart Timeframe Selection:
- ORB Trading: Use 5m or 15m charts
- Session Review: Use 1H or 4H charts
- Swing Trading: Use 1H or 4H charts
Quality Over Quantity:
- Wait for high-quality alerts (volume + MTF)
- Avoid trading every breakout
- Focus on confluence setups
Risk Management:
- Position size based on range width
- Wider ranges = smaller positions
- Use stop losses always
- Take partial profits at targets
Market Conditions:
- Best results in trending markets
- Reduce position size in choppy conditions
- Consider session overlaps for volatility
- Avoid trading near major news if inexperienced
Continuous Improvement:
- Track win rate by session
- Note which confluence factors work best
- Adjust settings based on market volatility
- Review performance weekly
───────────────────────────────────────
PERFORMANCE OPTIMIZATION
───────────────────────────────────────
This indicator is optimized with:
- max_bars_back declarations for efficient processing
- Conditional calculations based on enabled features
- Proper memory management for drawing objects
- Minimal recalculation on each bar
Best Practices:
- Disable unused features (sessions, MTF, volume)
- Limit historical display to reduce rendering
- Use appropriate timeframe for your strategy
- Clear old drawing objects periodically
───────────────────────────────────────
EDUCATIONAL DISCLAIMER
───────────────────────────────────────
This indicator combines established trading concepts:
- Opening Range Breakout theory (price action)
- Liquidity level detection (pivot analysis)
- Session-based trading (time-of-day patterns)
- Volume analysis (confirmation technique)
- Multi-timeframe analysis (trend alignment)
All calculations use standard technical analysis methods:
- Pivot high/low detection algorithms
- Moving averages for trend and volume
- Session time filtering
- Timeframe security functions
The indicator identifies potential trading setups but does not predict future price movements. Success requires proper application within a complete trading strategy including risk management, position sizing, and market context.
───────────────────────────────────────
USAGE DISCLAIMER
───────────────────────────────────────
This tool is for educational and analytical purposes. Opening Range Breakout trading involves substantial risk. The alert system and quality filters are designed to identify potential setups but do not guarantee profitability. Always conduct independent analysis, use proper risk management, and never risk capital you cannot afford to lose. Past performance does not indicate future results. Trading intraday breakouts requires experience and discipline.
───────────────────────────────────────
CREDITS & ATTRIBUTION
───────────────────────────────────────
ORIGINAL SOURCE:
This indicator builds upon concepts from LuxAlgo's-ORB

Luxy Adaptive MA Cloud - Trend Strength & Signal Tracker V2Luxy Adaptive MA Cloud - Professional Trend Strength & Signal Tracker
Next-generation moving average cloud indicator combining ultra-smooth gradient visualization with intelligent momentum detection. Built for traders who demand clarity, precision, and actionable insights.
═══════════════════════════════════════════════
WHAT MAKES THIS INDICATOR SPECIAL?
═══════════════════════════════════════════════
Unlike traditional MA indicators that show static lines, Luxy Adaptive MA Cloud creates a living, breathing visualization of market momentum. Here's what sets it apart:
Exponential Gradient Technology
This isn't just a simple fill between two lines. It's a professionally engineered gradient system with 26 precision layers using exponential density distribution. The result? An organic, cloud-like appearance where the center is dramatically darker (15% transparency - where crossovers and price action occur), while edges fade gracefully (75% transparency). Think of it as a visual "heat map" of trend strength.
Dynamic Momentum Intelligence
Most MA clouds only show structure (which MA is on top). This indicator shows momentum strength in real-time through four intelligent states:
- 🟢 Bright Green = Explosive bullish momentum (both MAs rising strongly)
- 🔵 Blue = Weakening bullish (structure intact, but momentum fading)
- 🟠 Orange = Caution zone (bearish structure forming, weak momentum)
- 🔴 Deep Red = Strong bearish momentum (both MAs falling)
The cloud literally tells you when trends are accelerating or losing steam.
Conditional Performance Architecture
Every calculation is optimized for speed. Disable a feature? It stops calculating entirely—not just hidden, but not computed . The 26-layer gradient only renders when enabled. Toggle signals off? Those crossover checks don't run. This makes it one of the most efficient cloud indicators available, even with its advanced visual system.
Zero Repaint Guarantee
All signals and momentum states are based on confirmed bar data only . What you see in historical data is exactly what you would have seen trading live. No lookahead bias. No repainting tricks. No signals that "magically" appear perfect in hindsight. If a signal shows in history, it would have triggered in real-time at that exact moment.
Educational by Design
Every single input includes comprehensive tooltips with:
- Clear explanations of what each parameter does
- Practical examples of when to use different settings
- Recommended configurations for scalping, day trading, and swing trading
- Real-world trading impact ("This affects entry timing" vs "This is visual only")
You're not just getting an indicator—you're learning how to use it effectively .
═══════════════════════════════════════════════
THE GRADIENT CLOUD - TECHNICAL DETAILS
═══════════════════════════════════════════════
Architecture:
26 precision layers for silk-smooth transitions
Exponential density curve - layers packed tightly near center (where crossovers happen), spread wider at edges
75%-15% transparency range - center is highly opaque (15%), edges fade gracefully (75%)
V-Gradient design - emphasizes the action zone between Fast and Medium MAs
The Four Momentum States:
🟢 GREEN - Strong Bullish
Fast MA above Medium MA
Both MAs rising with momentum > 0.02%
Action: Enter/hold LONG positions, strong uptrend confirmed
🔵 BLUE - Weak Bullish
Fast MA above Medium MA
Weak or flat momentum
Action: Caution - bullish structure but losing strength, consider trailing stops
🟠 ORANGE - Weak Bearish
Medium MA above Fast MA
Weak or flat momentum
Action: Warning - bearish structure developing, consider exits
🔴 RED - Strong Bearish
Medium MA above Fast MA
Both MAs falling with momentum < -0.02%
Action: Enter/hold SHORT positions, strong downtrend confirmed
Smooth Transitions: The momentum score is smoothed using an 8-bar EMA to eliminate noise and prevent whipsaws. You see the true trend , not every minor fluctuation.
═══════════════════════════════════════════════
FLEXIBLE MOVING AVERAGE SYSTEM
═══════════════════════════════════════════════
Three Customizable MAs:
Fast MA (default: EMA 10) - Reacts quickly to price changes, defines short-term momentum
Medium MA (default: EMA 20) - Balances responsiveness with stability, core trend reference
Slow MA (default: SMA 200, optional) - Long-term trend filter, major support/resistance
Six MA Types Available:
EMA - Exponential; faster response, ideal for momentum and day trading
SMA - Simple; smooth and stable, best for swing trading and trend following
WMA - Weighted; middle ground between EMA and SMA
VWMA - Volume-weighted; reflects market participation, useful for liquid markets
RMA - Wilder's smoothing; used in RSI/ADX, excellent for trend filters
HMA - Hull; extremely responsive with minimal lag, aggressive option
Recommended Settings by Trading Style:
Scalping (1m-5m):
Fast: EMA(5-8)
Medium: EMA(10-15)
Slow: Not needed or EMA(50)
Day Trading (5m-1h):
Fast: EMA(10-12)
Medium: EMA(20-21)
Slow: SMA(200) for bias
Swing Trading (4h-1D):
Fast: EMA(10-20)
Medium: EMA(34-50)
Slow: SMA(200)
Pro Tip: Start with Fast < Medium < Slow lengths. The gradient works best when there's clear separation between Fast and Medium MAs.
═══════════════════════════════════════════════
CROSSOVER SIGNALS - CLEAN & RELIABLE
═══════════════════════════════════════════════
Golden Cross ⬆ LONG Signal
Fast MA crosses above Medium MA
Classic bullish reversal or trend continuation signal
Most reliable when accompanied by GREEN cloud (strong momentum)
Death Cross ⬇ SHORT Signal
Fast MA crosses below Medium MA
Classic bearish reversal or trend continuation signal
Most reliable when accompanied by RED cloud (strong momentum)
Signal Intelligence:
Anti-spam filter - Minimum 5 bars between signals prevents noise
Clean labels - Placed precisely at crossover points
Alert-ready - Built-in ALERTS for automated trading systems
No repainting - Signals based on confirmed bars only
Signal Quality Assessment:
High-Quality Entry:
Golden Cross + GREEN cloud + Price above both MAs
= Strong bullish setup ✓
Low-Quality Entry (skip or wait):
Golden Cross + ORANGE cloud + Choppy price action
= Weak bullish setup, likely whipsaw ✗
═══════════════════════════════════════════════
REAL-TIME INFO PANEL
═══════════════════════════════════════════════
An at-a-glance dashboard showing:
Trend Strength Indicator:
Visual display of current momentum state
Color-coded header matching cloud color
Instant recognition of market bias
MA Distance Table:
Shows percentage distance of price from each enabled MA:
Green rows : Price ABOVE MA (bullish)
Red rows : Price BELOW MA (bearish)
Gray rows : Price AT MA (rare, decision point)
Distance Interpretation:
+2% to +5%: Healthy uptrend
+5% to +10%: Getting extended, caution
+10%+: Overextended, expect pullback
-2% to -5%: Testing support
-5% to -10%: Oversold zone
-10%+: Deep correction or downtrend
Customization:
4 corner positions
5 font sizes (Tiny to Huge)
Toggle visibility on/off
═══════════════════════════════════════════════
HOW TO USE - PRACTICAL TRADING GUIDE
═══════════════════════════════════════════════
STRATEGY 1: Trend Following
Identify trend : Wait for GREEN (bullish) or RED (bearish) cloud
Enter on signal : Golden Cross in GREEN cloud = LONG, Death Cross in RED cloud = SHORT
Hold position : While cloud maintains color
Exit signals :
• Cloud turns ORANGE/BLUE = momentum weakening, tighten stops
• Opposite crossover = close position
• Cloud turns opposite color = full reversal
STRATEGY 2: Pullback Entries
Confirm trend : GREEN cloud established (bullish bias)
Wait for pullback : Price touches or crosses below Fast MA
Enter when : Price rebounds back above Fast MA with cloud still GREEN
Stop loss : Below Medium MA or recent swing low
Target : Previous high or when cloud weakens
STRATEGY 3: Momentum Confirmation
Your setup triggers : (e.g., chart pattern, support/resistance)
Check cloud color :
• GREEN = proceed with LONG
• RED = proceed with SHORT
• BLUE/ORANGE = skip or reduce size
Use gradient as confluence : Not as primary signal, but as momentum filter
Risk Management Tips:
Never enter against the cloud color (don't LONG in RED cloud)
Reduce position size during BLUE/ORANGE (transition periods)
Place stops beyond Medium MA for swing trades
Use Slow MA (200) as final trend filter - don't SHORT above it in uptrends
═══════════════════════════════════════════════
PERFORMANCE & OPTIMIZATION
═══════════════════════════════════════════════
Tested On:
Crypto: BTC, ETH, major altcoins
Stocks: SPY, AAPL, TSLA, QQQ
Forex: EUR/USD, GBP/USD, USD/JPY
Indices: S&P 500, NASDAQ, DJI
═══════════════════════════════════════════════
TRANSPARENCY & RELIABILITY
═══════════════════════════════════════════════
Educational Focus:
Detailed tooltips on every input
Clear documentation of methodology
Practical examples in descriptions
Teaches you why , not just what
Open Logic:
Momentum calculation: (Fast slope + Medium slope) / 2
Smoothing: 8-bar EMA to reduce noise
Thresholds: ±0.02% for strong momentum classification
Everything is transparent and explainable
═══════════════════════════════════════════════
COMPLETE FEATURE LIST
═══════════════════════════════════════════════
Visual Components:
26-layer exponential gradient cloud
3 customizable moving average lines
Golden Cross / Death Cross labels
Real-time info panel with trend strength
MA distance table
Calculation Features:
6 MA types (EMA, SMA, WMA, VWMA, RMA, HMA)
Momentum-based cloud coloring
Smoothed trend strength scoring
Conditional performance optimization
Customization Options:
All MA lengths adjustable
All colors customizable (when gradient disabled)
Panel position (4 corners)
Font sizes (5 options)
Toggle any feature on/off
Signal Features:
Anti-spam filter (configurable gap)
Clean, non-overlapping labels
Built-in alert conditions
No repainting guarantee
═══════════════════════════════════════════════
IMPORTANT DISCLAIMERS
═══════════════════════════════════════════════
This indicator is for educational and informational purposes only
Not financial advice - always do your own research
Past performance does not guarantee future results
Use proper risk management - never risk more than you can afford to lose
Test on paper/demo accounts before using with real money
Combine with other analysis methods - no single indicator is perfect
Works best in trending markets; less effective in choppy/sideways conditions
Signals may perform differently in different timeframes and market conditions
The indicator uses historical data for MA calculations - allow sufficient lookback period
═══════════════════════════════════════════════
CREDITS & TECHNICAL INFO
═══════════════════════════════════════════════
Version: 2.0
Release: October 2025
Special Thanks:
TradingView community for feedback and testing
Pine Script documentation for technical reference
═══════════════════════════════════════════════
SUPPORT & UPDATES
═══════════════════════════════════════════════
Found a bug? Comment below with:
Ticker symbol
Timeframe
Screenshot if possible
Steps to reproduce
Feature requests? I'm always looking to improve! Share your ideas in the comments.
Questions? Check the tooltips first (hover over any input) - most answers are there. If still stuck, ask in comments.
═══════════════════════════════════════════════
Happy Trading!
Remember: The best indicator is the one you understand and use consistently. Take time to learn how the cloud behaves in different market conditions. Practice on paper before going live. Trade smart, manage risk, and may the trends be with you! 🚀

ZS Game Changer Pump & Dump DetectorZS GAME CHANGER PUMP AND DUMP DETECTOR - TOP 2 MOMENTUM TRACKER
Created by Zakaria Safri
An intelligent indicator specifically designed to identify and highlight the two most significant pump and dump candles within your selected lookback period. Perfect for traders who want to focus on the game-changing moves that truly matter in volatile markets like cryptocurrency, stocks, and forex.
CORE FEATURES
AUTOMATIC GAME CHANGER DETECTION
The indicator continuously scans your specified lookback period and automatically identifies the top 2 strongest pump candles and top 2 strongest dump candles. These game-changing candles are highlighted with distinctive gold labels and horizontal reference lines, making them instantly visible on your chart. Unlike other indicators that show every small move, this focuses exclusively on the market-moving moments that define trends and create opportunities.
INTELLIGENT PUMP AND DUMP CLASSIFICATION
Uses advanced percentage-based calculations to classify candles as pumps when price surges significantly upward and dumps when price plunges sharply downward. The detection system accounts for candle body size, wick proportions, and volume confirmation to ensure only legitimate momentum moves trigger signals. Customizable thresholds allow adaptation to any market volatility profile from calm stocks to wild altcoins.
ADVANCED WICK EXCLUSION FILTER
Eliminates false signals caused by candles with large wicks and small bodies. This filter focuses analysis exclusively on candles with substantial body sizes that indicate genuine directional conviction rather than temporary spikes followed by rejection. The body to candle ratio is fully adjustable to match your preferred signal quality standards.
VOLUME CONFIRMATION SYSTEM
Optional volume filter ensures detected pumps and dumps are backed by real market participation. The indicator compares current volume against a moving average and only triggers signals when volume exceeds your specified multiplier threshold. This eliminates low-volume noise and focuses on moves supported by institutional or crowd participation.
RALLY SEQUENCE DETECTION
Identifies and highlights consecutive sequences of pump or dump candles with colored background overlays. Green background indicates sustained buying pressure across multiple candles while red background shows sustained selling pressure. The rally detection system includes an optional one-miss allowance that prevents the sequence from breaking due to a single neutral candle.
HORIZONTAL REFERENCE LINES
Draws dashed lines from each game changer candle extending to the current bar, providing constant visual reference to the most significant support and resistance levels created by extreme momentum. The top game changer gets a thick dashed line while the second gets a dotted line for easy differentiation. Labels on the right side display the exact percentage move.
COMPREHENSIVE STATISTICS DASHBOARD
Real-time information panel showing current market status as pumping, dumping, or neutral along with the current candle percentage change. Displays the exact percentage values for top pump number 1, top pump number 2, top dump number 1, and top dump number 2. Shows running totals of all pumps and dumps detected since chart load. Tracks consecutive candle counts during active rally sequences.
TESTING AND VERIFICATION MODE
Built-in debug mode displays percentage change directly on each qualifying pump and dump candle, allowing instant verification that calculations are accurate. Shows which filters are currently active with a simple code in the dashboard. Helps traders understand exactly why certain candles qualified as game changers.
HOW THE GAME CHANGER DETECTION WORKS
SCANNING ALGORITHM
Every bar close, the indicator scans backward through your specified lookback period examining every candle's percentage change from its previous close. For bullish moves, it identifies the two candles with the largest positive percentage change that meet your threshold requirements. For bearish moves, it identifies the two candles with the largest negative percentage change meeting threshold requirements.
RANKING SYSTEM
Candles are ranked purely by their percentage move magnitude. The number 1 game changer is always the single strongest move in the lookback period. The number 2 game changer is the second strongest move. Rankings update dynamically as new candles form and old candles exit the lookback window.
VISUAL IDENTIFICATION
Game changer number 1 for both pumps and dumps receives a large gold label reading GAME CHANGER NUMBER 1 with zero transparency for maximum visibility. Game changer number 2 receives a slightly smaller gold label with partial transparency. The candle bars themselves are colored in gold instead of the standard green or red. Horizontal lines extend from the game changer price level to current bar.
FILTER APPLICATION
Only candles that pass your configured filters qualify for game changer consideration. If wick exclusion is enabled, candles with large wicks and small bodies are ignored. If volume confirmation is enabled, only candles with above-average volume qualify. This ensures game changers represent legitimate market moves rather than aberrations.
PRACTICAL APPLICATIONS
FOR CRYPTOCURRENCY TRADERS
Crypto markets experience extreme volatility with occasional massive pump and dump candles that define entire trends. This indicator instantly identifies which candles represent true market structure shifts versus normal noise. Use the game changer levels as key support and resistance for entries, exits, and stop placement. The top pump often marks the local high to watch for breakouts while the top dump marks the local low for reversal trades.
FOR DAY TRADERS
Intraday charts contain hundreds of candles but only a few truly matter for the session outcome. Game changer detection filters out 98 percent of candles to show you the 2 percent that drove the actual price movement. Enter trades on the side of the strongest recent game changer. Use game changer levels as magnet prices where algorithmic trading often returns.
FOR SWING TRADERS
On daily and four-hour timeframes, game changers represent major institutional activity or news-driven moves. The top dump often marks capitulation selling that creates reversal opportunities. The top pump often marks FOMO buying that creates resistance levels. Swing traders can build positions knowing these levels will be defended or tested multiple times.
FOR VOLATILITY ANALYSIS
Understanding which candles created the most volatility helps assess market risk. Multiple game changers clustered together indicate unstable choppy conditions. Game changers separated by many neutral candles indicate trending stable conditions. Use this context to adjust position sizing and stop distances appropriately.
FOR SUPPORT AND RESISTANCE TRADING
Game changer candles create the strongest support and resistance levels because they represent prices where massive volume transacted in short time periods. These levels have higher probability of holding on retest compared to arbitrary moving averages or pivot points. Trade bounces off game changer levels or breakouts through them.
RECOMMENDED SETTINGS BY MARKET
CRYPTOCURRENCY 15-MINUTE TO 1-HOUR CHARTS
Candle Size Threshold: 2.0 percent
Body to Candle Ratio: 0.5
Volume Multiplier: 1.5 times average
Game Changer Lookback: 100 bars
Extreme Threshold: 3.5 percent
Enable Wick Filter: Yes
Enable Volume Confirmation: Yes
Minimum Rally Candles: 3
STOCKS DAILY CHARTS
Candle Size Threshold: 1.0 percent
Body to Candle Ratio: 0.6
Volume Multiplier: 2.0 times average
Game Changer Lookback: 50 bars
Extreme Threshold: 2.5 percent
Enable Wick Filter: Yes
Enable Volume Confirmation: Yes
Minimum Rally Candles: 2
FOREX 1-HOUR TO 4-HOUR CHARTS
Candle Size Threshold: 0.5 percent
Body to Candle Ratio: 0.5
Volume Multiplier: Not applicable
Game Changer Lookback: 80 bars
Extreme Threshold: 1.0 percent
Enable Wick Filter: Yes
Enable Volume Confirmation: No
Minimum Rally Candles: 3
SCALPING 1-MINUTE TO 5-MINUTE CHARTS
Candle Size Threshold: 0.8 percent
Body to Candle Ratio: 0.4
Volume Multiplier: 1.2 times average
Game Changer Lookback: 50 bars
Extreme Threshold: 1.5 percent
Enable Wick Filter: No
Enable Volume Confirmation: Yes
Minimum Rally Candles: 2
WHAT IS INCLUDED
Automatic identification of top 2 pump candles
Automatic identification of top 2 dump candles
Gold colored game changer labels with size differentiation
Gold colored candle bars for game changers
Horizontal reference lines from game changers to current price
Regular pump and dump detection with green and red candles
Rally sequence detection with background highlighting
Extreme move detection and labeling system
Real-time statistics dashboard with all key metrics
Percentage change debug mode for verification
Volume confirmation filter with adjustable multiplier
Wick exclusion filter with adjustable body ratio
Customizable lookback period from 20 to 500 bars
Consecutive candle counter for rally tracking
Alert system for game changers, pumps, dumps, and rallies
Works on all timeframes from 1 minute to monthly
Compatible with stocks, forex, cryptocurrency, and futures
UNDERSTANDING GAME CHANGERS
WHAT MAKES A CANDLE A GAME CHANGER
A game changer is not just a large move but the largest move within context. In a volatile crypto market, a 5 percent pump might not rank in the top 2. In a stable stock, a 2 percent pump could be the number 1 game changer. The indicator adapts to your specific instrument and timeframe to find what truly matters in that context.
WHY FOCUS ON TOP 2 ONLY
Markets are driven by a small number of significant moves rather than the average of all moves. By focusing exclusively on the top 2 in each direction, traders can ignore noise and concentrate on the price levels that actually matter for support, resistance, and momentum. This creates clarity in decision making.
GAME CHANGERS AS MARKET STRUCTURE
The top pump often marks the recent high that bulls must break to continue uptrend. The top dump often marks the recent low that bears must break to continue downtrend. These become the key levels around which all other price action rotates. Understanding this structure is essential for profitable trading.
GAME CHANGERS AS SENTIMENT INDICATORS
Consecutive pump game changers signal strong bullish sentiment and FOMO conditions. Consecutive dump game changers signal fear and capitulation. Alternating pump and dump game changers signal indecision and range conditions. Read the pattern of game changers to gauge market psychology.
VERIFICATION AND TESTING
HOW TO VERIFY ACCURACY
Enable Show Debug Info on Chart in the Testing and Debug settings group. This displays the percentage change calculation directly on every qualifying pump and dump candle. Manually verify by calculating open minus close divided by close multiplied by 100. The debug percentage should match your manual calculation exactly.
HOW TO TEST FILTERS
Toggle wick exclusion filter on and off while watching how many candles qualify. With filter on, candles with long wicks and small bodies should disappear. Toggle volume confirmation on and off to see how low-volume candles get excluded. Adjust the thresholds and watch the real-time impact on signal count.
HOW TO VERIFY GAME CHANGERS
Look at your chart and visually identify which candle had the biggest green body in the lookback period. The game changer number 1 pump label should be on that exact candle. Repeat for the biggest red candle to verify game changer number 1 dump. The rankings should match your visual assessment.
LOOKBACK PERIOD EFFECTS
Decrease the lookback period to 20 bars and watch game changers update to only recent moves. Increase to 500 bars and watch game changers potentially change to older historic moves. The optimal lookback balances recency with significance. Too short misses important levels, too long includes irrelevant history.
DASHBOARD INFORMATION GUIDE
STATUS ROW
Shows PUMPING when current candle qualifies as a pump, DUMPING when current candle qualifies as a dump, or NEUTRAL when current candle does not meet threshold requirements. This updates in real-time on every bar close.
CURRENT CHANGE ROW
Displays the percentage change of the current candle from its previous close. Positive percentages indicate bullish candle, negative indicate bearish candle. This number may or may not meet your threshold to qualify as pump or dump.
TOP PUMP NUMBER 1
The highest positive percentage change found in your lookback period. This candle is marked with the large gold GAME CHANGER NUMBER 1 label below it. Shows N/A if no pumps exist in the lookback period.
TOP PUMP NUMBER 2
The second highest positive percentage change found in your lookback period. Marked with smaller gold GAME CHANGER NUMBER 2 label. Shows N/A if only one or zero pumps exist.
TOP DUMP NUMBER 1
The highest negative percentage change magnitude found in your lookback period. This candle is marked with the large gold GAME CHANGER NUMBER 1 label above it. Shows N/A if no dumps exist.
TOP DUMP NUMBER 2
The second highest negative percentage change magnitude found in your lookback period. Marked with smaller gold GAME CHANGER NUMBER 2 label. Shows N/A if only one or zero dumps exist.
TOTAL PUMPS
Running count of all pump candles detected since you loaded the indicator on this chart. This number continuously increases as new qualifying pumps form. Resets when you reload the chart.
TOTAL DUMPS
Running count of all dump candles detected since chart load. Increases as new qualifying dumps form and resets on chart reload.
CONSECUTIVE
Shows the current count of consecutive pump or dump candles during an active rally. Displays 3 UP during a 3-candle pump rally or 5 DN during a 5-candle dump rally. Shows 0 when no rally is active.
ALERT SYSTEM
GAME CHANGER DETECTED ALERT
Triggers whenever the current candle becomes one of the top 2 pumps or top 2 dumps. This is the highest priority alert indicating a market-moving event just occurred. Use this alert for immediate notification of significant opportunities.
PUMP DETECTED ALERT
Triggers on every candle that qualifies as a pump according to your threshold and filter settings. This includes regular pumps and extreme pumps but excludes game changers which have their separate alert. Use for general upward momentum monitoring.
DUMP DETECTED ALERT
Triggers on every candle that qualifies as a dump according to your settings. Includes regular and extreme dumps but excludes game changers. Use for general downward momentum monitoring.
PUMP RALLY STARTED ALERT
Triggers when consecutive pump candles reach your minimum rally threshold. Indicates the beginning of a sustained upward movement sequence. Use to catch trends early.
DUMP RALLY STARTED ALERT
Triggers when consecutive dump candles reach your minimum rally threshold. Indicates the beginning of a sustained downward movement sequence. Use for trend following or reversal timing.
ALERT MESSAGE FORMAT
All alerts include the ticker symbol and current price using TradingView placeholders. Messages are descriptive and specify which type of signal triggered. Alerts work with TradingView notification system including email, SMS, webhook, and app notifications.
TECHNICAL SPECIFICATIONS
CALCULATION METHODOLOGY
Percentage change calculated as current close minus previous close divided by previous close multiplied by 100. Body ratio calculated as absolute value of close minus open divided by high minus low. Volume elevation calculated as current volume divided by 20-period simple moving average of volume. Game changer ranking uses absolute value comparison across entire lookback array.
PERFORMANCE CHARACTERISTICS
Lightweight calculations optimized for speed on all timeframes. No repainting of signals ensuring all triggers are final on bar close. Variables properly scoped with var keyword for memory efficiency. Maximum bars back set to 500 to prevent excessive historical loading. Updates in real-time on every bar close without lag.
COMPATIBILITY
Works on all TradingView plans including free, pro, and premium. Compatible with stocks, forex, cryptocurrency, futures, indices, and commodities. Functions correctly on all timeframes from 1 second to monthly. No external data requests ensuring fast loading. Overlay true setting places directly on price chart.
RISK DISCLAIMER
This indicator is a technical analysis tool for identifying momentum and should not be used as the sole basis for trading decisions. Game changer levels can be broken during strong trends and are not guaranteed support or resistance. Pump and dump detection does not predict future price direction. Always use proper risk management with stop losses on every trade. Combine this indicator with other forms of analysis including fundamentals, market context, and risk assessment. Practice on demo accounts before live trading. Past performance of game changer signals does not guarantee future results. Trading carries substantial risk of loss and is not suitable for all investors. The creator is not responsible for trading losses incurred while using this tool.
SUPPORT AND UPDATES
Regular updates based on user feedback and market evolution. Built following PineCoders industry standards and best practices for code quality. Clean well-documented code structure for transparency and auditability. Optimized performance across all timeframes and instruments. Active development with continuous improvements and feature additions.
WHY CHOOSE ZS GAME CHANGER PUMP AND DUMP DETECTOR
Focuses on what matters by highlighting only the top 2 moves in each direction instead of cluttering your chart with every small fluctuation. Saves time by automatically identifying the most significant candles rather than requiring manual scanning. Provides clarity through visual gold labels and reference lines that make game changers unmistakable. Adapts to any market with customizable thresholds for volatility and volume. Eliminates noise with advanced wick and volume filters ensuring signal quality. Offers verification through debug mode proving calculations are accurate and trustworthy. Includes comprehensive statistics showing exact percentages and counts. Works everywhere across all markets, timeframes, and instruments without modification.
Transform your chart analysis by focusing exclusively on the game-changing moments that define trends and create opportunities.
Version 1.1 | Created by Zakaria Safri | Pine Script Version 5 | PineCoders Compliant

TwistedHWAY Oracle - Intelligent Level Detection System═════════════════════════════════════════════════════════════════════════
🎯 TwistedHWAY Oracle™ - Intelligent Level Detection System
═════════════════════════════════════════════════════════════════════════
OVERVIEW
TwistedHWAY Oracle™ combines six independent calculation engines to identify high-probability support and resistance levels. The indicator uses adaptive market regime detection and confluence analysis to automatically rank levels by confidence score, helping traders identify key reaction zones where price is likely to find support or resistance.
KEY FEATURES
The indicator provides comprehensive level detection through:
Six Detection Engines — Each engine operates independently with its own alert system
Confluence Analysis — Automatically awards bonus confidence when multiple engines identify the same level
Adaptive Intelligence — Market volatility detection adjusts parameters in real-time
Confidence Scoring — Every level is ranked and displayed with a numerical confidence score
Individual Alerts — Separate alert controls for each detection method
DETECTION ENGINES
1 — Pivot Points Engine
Calculates daily pivot levels including PP, R1-R3, and S1-S3 using previous day's high, low, and close.
2 — Swing Detector
Identifies significant swing highs and lows using prominence filtering to eliminate noise.
3 — Psychological Matrix
Detects round number levels at three configurable increments (default: 10, 25, 50).
4 — Fibonacci Engine
Calculates retracement levels (23.6%, 38.2%, 50%, 61.8%, 78.6%) from major swings.
5 — VWAP System
Generates volume-weighted average price levels at three different periods.
6 — Confluence Analyzer
Awards bonus confidence points when multiple engines identify the same level.
HOW TO USE
Reading the Levels
Levels above current price = Resistance (red by default)
Levels below current price = Support (green by default)
Numbers in brackets show confidence score
Higher confidence = stronger level
Levels with score > 2.0 indicate extreme confluences
Trading Strategies
Bounce Trading — Enter positions when price approaches high-confidence levels expecting reversal
Breakout Trading — Trade breakouts through levels, using broken level as stop-loss
Confluence Zones — Focus on areas where multiple engines agree
SETTINGS GUIDE
Oracle Settings
Validation Mode — Conservative parameters for more reliable signals
Max Levels — Number of levels to display (10-50)
Level Extension — Line extension direction (None/Left/Right/Both)
Individual Engine Controls
Each engine can be toggled on/off with separate alert controls:
Pivot Engine (daily pivots)
Swing Detector (historical swings)
Psychological Matrix (round numbers)
Fibonacci Engine (retracements)
VWAP System (volume-weighted levels)
Visual Settings
Individual color selection for each level type
Label display toggle with size options
Line style preferences (Solid/Dashed/Dotted)
Alert Configuration
Alert Distance % — Proximity threshold (default: 0.5%)
Alert Cooldown — Minimum bars between alerts (default: 60)
Individual alert toggles for each engine
ADAPTIVE PARAMETERS
The indicator automatically adjusts to market conditions:
High Volatility Mode — Wider swing detection, stricter prominence filters
Normal Mode — Balanced parameters for typical market conditions
Validation Mode — Most conservative settings for reliable signals
Market regime is detected using 100-period volatility measurement with automatic threshold adjustment.
ALERTS
Five alert types plus special confluence alerts:
🎯 Pivot Alerts — Daily pivot level approaches
🌊 Swing Alerts — Historical swing level tests
🧠 Psychological Alerts — Round number approaches
🌀 Fibonacci Alerts — Retracement level tests
📉 VWAP Alerts — Volume-weighted level approaches
⚡ Critical Alerts — Ultra-high confidence levels (score ≥ 2.0)
Alerts include price level, confidence score, and source information.
BEST PRACTICES
Timeframe Selection
Works on all timeframes (optimized for 5min to Daily)
Higher timeframes = more reliable levels
Use multi-timeframe analysis for confirmation
Optimization by Instrument
Forex:
Psychological increments: 0.0010, 0.0050, 0.0100
Stocks (Low-priced):
Psychological increments: 1, 5, 10
Stocks (High-priced):
Psychological increments: 10, 25, 50
Crypto:
Adjust based on price range and volatility
LIMITATIONS
Calculation intensive on last bar (may cause slight delays)
Maximum 50 levels can be displayed simultaneously
Swing detection requires minimum 25 bars of history
VWAP calculations use price range as volume proxy when volume unavailable
NOTES
Levels are recalculated on each bar close
Confidence scores update dynamically with market conditions
Colors automatically adjust based on price position
All settings are saved with chart layout
═════════════════════════════════════════════════════════════════════════
Version: 3.0 | Build 2025.10
License: GNU GPL v3.0
© 2025 TwistedHWAY
═════════════════════════════════════════════════════════════════════════
Triple SuperTrend + RSI + Fib BBTriple SuperTrend + RSI + Fibonacci Bollinger Bands Strategy
📊 Overview
This advanced trading strategy combines the power of three SuperTrend indicators with RSI confirmation and Fibonacci Bollinger Bands to generate high-probability trade signals. The strategy is designed to capture strong trending moves while filtering out false signals through multi-indicator confluence.
🔧 Core Components
Three SuperTrend Indicators
The strategy uses three SuperTrend indicators with progressively longer periods and multipliers:
SuperTrend 1: 10-period ATR, 1.0 multiplier (fastest, most sensitive)
SuperTrend 2: 11-period ATR, 2.0 multiplier (medium sensitivity)
SuperTrend 3: 12-period ATR, 3.0 multiplier (slowest, most stable)
This layered approach ensures that all three timeframe perspectives align before generating a signal, significantly reducing false entries.
RSI Confirmation (7-period)
The Relative Strength Index acts as a momentum filter:
Long signals require RSI > 50 (bullish momentum)
Short signals require RSI < 50 (bearish momentum)
This prevents entries during weak or divergent price action.
Fibonacci Bollinger Bands (200, 2.618)
Uses a 200-period Simple Moving Average with 2.618 standard deviation bands (Fibonacci ratio). These bands serve dual purposes:
Visual representation of price extremes
Automatic exit trigger when price reaches overextended levels
📈 Entry Logic
LONG Entry (BUY Signal)
A LONG position is opened when ALL of the following conditions are met simultaneously:
All three SuperTrend indicators turn green (bullish)
RSI(7) is above 50
This is the first bar where all conditions align (no repainting)
SHORT Entry (SELL Signal)
A SHORT position is opened when ALL of the following conditions are met simultaneously:
All three SuperTrend indicators turn red (bearish)
RSI(7) is below 50
This is the first bar where all conditions align (no repainting)
🚪 Exit Logic
Positions are automatically closed when ANY of these conditions occur:
SuperTrend Color Change: Any one of the three SuperTrend indicators changes direction
Fibonacci BB Touch: Price reaches or exceeds the upper or lower Fibonacci Bollinger Band (2.618 standard deviations)
This dual-exit approach protects profits by:
Exiting quickly when trend momentum shifts (SuperTrend change)
Taking profits at statistical price extremes (Fib BB touch)
🎨 Visual Features
Signal Arrows
Green Up Arrow (BUY): Appears below the bar when long entry conditions are met
Red Down Arrow (SELL): Appears above the bar when short entry conditions are met
Yellow Down Arrow (EXIT): Appears above the bar when exit conditions are met
Background Coloring
Light Green Tint: All three SuperTrends are bullish (uptrend environment)
Light Red Tint: All three SuperTrends are bearish (downtrend environment)
SuperTrend Lines
Three colored lines plotted with varying opacity:
Solid line (ST1): Most responsive to price changes
Semi-transparent (ST2): Medium-term trend
Most transparent (ST3): Long-term trend structure
Dashboard
Real-time information panel showing:
Individual SuperTrend status (UP/DOWN)
Current RSI value and color-coded status
Current position (LONG/SHORT/FLAT)
Net Profit/Loss
⚙️ Customizable Parameters
SuperTrend Settings
ATR periods for each SuperTrend (default: 10, 11, 12)
Multipliers for each SuperTrend (default: 1.0, 2.0, 3.0)
RSI Settings
RSI length (default: 7)
RSI source (default: close)
Fibonacci Bollinger Bands
BB length (default: 200)
BB multiplier (default: 2.618)
Strategy Options
Enable/disable long trades
Enable/disable short trades
Initial capital
Position sizing
Commission settings
💡 Strategy Philosophy
This strategy is built on the principle of confluence trading - waiting for multiple independent indicators to align before taking a position. By requiring three SuperTrend indicators AND RSI confirmation, the strategy filters out the majority of low-probability setups.
The multi-timeframe SuperTrend approach ensures that short-term, medium-term, and longer-term trends are all in agreement, which typically occurs during strong, sustainable price moves.
The exit strategy is equally important, using both trend-following logic (SuperTrend changes) and mean-reversion logic (Fibonacci BB touches) to adapt to different market conditions.
📊 Best Use Cases
Trending Markets: Works best in markets with clear directional bias
Higher Timeframes: Designed for 15-minute to daily charts
Volatile Assets: SuperTrend indicators excel in assets with clear trends
Swing Trading: Hold times typically range from hours to days
⚠️ Important Notes
No Repainting: All signals are confirmed and will not change on historical bars
One Signal Per Setup: The strategy prevents duplicate signals on consecutive bars
Exit Protection: Always exits before potentially taking an opposite position
Visual Clarity: All three SuperTrend lines are visible simultaneously for transparency
🎯 Recommended Settings
While default parameters are optimized for general use, consider:
Crypto/Volatile Markets: May benefit from slightly higher multipliers
Forex: Default settings work well for major pairs
Stocks: Consider longer BB periods (250-300) for daily charts
Lower Timeframes: Reduce all periods proportionally for scalping
📝 Alerts
Built-in alert conditions for:
BUY signal triggered
SELL signal triggered
EXIT signal triggered
Set up notifications to never miss a trade opportunity!
Disclaimer: This strategy is for educational and informational purposes only. Past performance does not guarantee future results. Always backtest thoroughly and practice proper risk management before live trading.

Hilega Milega v6 - Pure EMA/SMA (Nitesh Kumar) + Full BacktestHilega to milega
he Hilega Milega Strategy, inspired by the technique of Nitesh Kumar, is designed for intraday and swing traders who want structured entries and exits with clear demand–supply logic.
🔑 Core Features
Demand & Supply Zones – Automatically plots potential strong buying and selling zones for high-probability trades.
Trend Identification – Uses a blend of EMAs/SMA crossovers to identify bullish and bearish market bias.
Buy & Sell Signals – Generates real-time visual signals based on “Hilega Milega” rules for quick decision-making.
Risk Management – Suggested stop-loss levels are derived from recent demand–supply areas to minimize drawdowns.
Backtesting Enabled – Traders can test the performance across multiple assets (stocks, forex, crypto, commodities).
📊 How It Works
Buy Signal → When price action confirms a bullish zone with supporting trend filters.
Sell Signal → When price action confirms a bearish zone or reversal pattern.
Flat/Exit → Position closed when opposite signal triggers or demand–supply imbalance fades.
⚡ Best Use Cases
Intraday trading (5m, 15m, 1H charts).
Swing trading (4H, Daily charts).
Works across stocks, crypto, commodities, and forex.
⚠️ Disclaimer: This strategy is for educational purposes. Backtest thoroughly and apply proper risk management before live trading.

Hurst Momentum Oscillator | AlphaNattHurst Momentum Oscillator | AlphaNatt
An adaptive oscillator that combines the Hurst Exponent - which identifies whether markets are trending or mean-reverting - with momentum analysis to create signals that automatically adjust to market regime.
"The Hurst Exponent reveals a hidden truth: markets aren't always trending. This oscillator knows when to ride momentum and when to fade it."
━━━━━━━━━━━━━━━━━━━━━━━━━━━━━━━━━━━━━━━━
📐 THE MATHEMATICS
Hurst Exponent (H):
Measures the long-term memory of time series:
H > 0.5: Trending (persistent) behavior
H = 0.5: Random walk
H < 0.5: Mean-reverting behavior
Originally developed for analyzing Nile river flooding patterns, now used in:
Fractal market analysis
Network traffic prediction
Climate modeling
Financial markets
The Innovation:
This oscillator multiplies momentum by the Hurst coefficient:
When trending (H > 0.5): Momentum is amplified
When mean-reverting (H < 0.5): Momentum is reduced
Result: Adaptive signals based on market regime
━━━━━━━━━━━━━━━━━━━━━━━━━━━━━━━━━━━━━━━━
💎 KEY ADVANTAGES
Regime Adaptive: Automatically adjusts to trending vs ranging markets
False Signal Reduction: Reduces momentum signals in mean-reverting markets
Trend Amplification: Stronger signals when trends are persistent
Mathematical Edge: Based on fractal dimension analysis
No Repainting: All calculations on historical data
━━━━━━━━━━━━━━━━━━━━━━━━━━━━━━━━━━━━━━━━
📊 TRADING SIGNALS
Visual Interpretation:
Cyan zones: Bullish momentum in trending market
Magenta zones: Bearish momentum or mean reversion
Background tint: Blue = trending, Pink = mean-reverting
Gradient intensity: Signal strength
Trading Strategies:
1. Trend Following:
Trade momentum signals when background is blue (trending)
2. Mean Reversion:
Fade extreme readings when background is pink
3. Regime Transition:
Watch for background color changes as early warning
━━━━━━━━━━━━━━━━━━━━━━━━━━━━━━━━━━━━━━━━
🎯 OPTIMAL USAGE
Best Conditions:
Strong trending markets (crypto bull runs)
Clear ranging markets (forex sessions)
Regime transitions
Multi-timeframe analysis
Market Applications:
Crypto: Excellent for identifying trend persistence
Forex: Detects when pairs are ranging
Stocks: Identifies momentum stocks
Commodities: Catches persistent trends
━━━━━━━━━━━━━━━━━━━━━━━━━━━━━━━━━━━━━━━━
Developed by AlphaNatt | Fractal Market Analysis
Version: 1.0
Classification: Adaptive Regime Oscillator
Not financial advice. Always DYOR.

Advanced Price Ranges ICTThis indicator automatically divides price into fixed ranges (configurable in points or pips) and plots important reference levels such as the high, low, 50% midpoint, and 25%/75% quarters. It is designed to help traders visualize structured price movement, spot confluence zones, and frame their trading bias around clean range-based levels.
🔹 Key Features
Custom Range Size: Define ranges in points (e.g., 100, 50, 25, 10) or in Forex pips.
Forex Mode: Automatically adapts pip size (0.0001 or 0.01 for JPY pairs).
Dynamic Anchoring: Price ranges automatically align to the current price, snapping into blocks.
Multiple Ranges: Option to extend visualization above and below the current active block for a complete grid.
Level Types:
High / Low of the range
50% midpoint
25% and 75% quarters
Custom Styling: Adjustable line colors and widths for each level type.
Labels: Optional right-edge labels showing level type and exact price.
Alerts: Built-in alerts for when price crosses the range high, low, or 50% midpoint.
🔹 Use Cases
Quickly map out 100/50/25/10 point structures like Zeussy’s advanced price range method.
Identify key reaction levels where liquidity is often built or swept.
Support ICT-style concepts like range-based bias, fair value gaps, and liquidity pools.
Works for indices, futures, crypto, and forex.
🔹 Customization
Range increments can be set to any size (default 100).
Toggle which levels are shown (High/Low, Midpoint, Quarters).
Adjustable line widths, colors, and label visibility.
Extend ranges above and below for broader market context.

Pure Price Zone Flow🔎 What this indicator is
It’s a price-action-based zone indicator. Unlike moving average systems, this one relies only on:
1. Swing Highs & Swing Lows → The highest and lowest points within a recent lookback period (like "mini support & resistance").
2. ATR (Average True Range) → A volatility measure that expands the zone, making it more adaptive to different market conditions.
3. Breakouts & Retests → When price breaks above a swing high (bullish) or below a swing low (bearish), the indicator marks it and highlights the new trend.
👉 The goal is to spot clean structure shifts and define clear trend zones where traders can position themselves.
________________________________________
⚙️ How it is calculated
1. Swing High & Swing Low
o We look back len candles (default 20).
o Find the highest high (swingHigh) and the lowest low (swingLow) in that window.
o This forms the price range zone.
2. ATR Expansion
o We calculate ATR over the same len.
o Add/subtract it (multiplied by atrMult) to the zone edges to expand them.
o This ensures the zones breathe with volatility (tight in quiet markets, wide in choppy ones).
3. Mid-Zone
o Simply the average of swingHigh and swingLow.
o If price is above mid → bullish bias.
o If below mid → bearish bias.
o This gives us the trend color for candles.
4. Breakouts
o If the close crosses above swingHigh, we mark a bullish breakout with a label.
o If the close crosses below swingLow, we mark a bearish breakdown.
________________________________________
📊 How it helps traders
This indicator helps by:
1. Identifying Structure Shifts
o Many traders watch swing highs/lows for breakouts or reversals.
o This automates the process and visually confirms when structure is broken.
2. Dynamic Zone Trading
o Instead of fixed support/resistance, the ATR expansion adapts to volatility.
o This avoids false signals in high-volatility conditions.
3. Trend Bias at a Glance
o Candle coloring instantly tells you whether price is in bullish or bearish territory relative to the mid-zone.
4. Breakout Confirmation
o The labels show when a breakout has occurred, so traders can react quickly (e.g., enter with trend, wait for retest, or avoid fading moves).
________________________________________
🌍 Markets it works best in
• Crypto (Bitcoin, Ethereum, etc.): Very effective since crypto is breakout-driven and respects swing levels.
• Forex: Good for volatility-adaptive structure analysis, especially in trending pairs.
• Indices (SPX, NASDAQ, DAX, NIFTY): Useful for breakout trading during session opens or key news events.
• Commodities (Gold, Oil, Silver): Works well to define intraday ranges and breakout levels.
⚠️ Less useful in low-volatility, mean-reverting assets (like some penny stocks or sideways ranges), because breakouts may be rare or fake.
________________________________________
💡 How it adds value
• Strips away unnecessary complexity (no lagging averages).
• Focuses directly on what price is doing structurally.
• Adaptive → works across different markets & timeframes.
• Easy visualization → zones, trend coloring, breakout markers.
• Helps traders trade with the flow of the market, instead of guessing tops/bottoms.
________________________________________
👉 In short:
This indicator turns raw price action into clear, actionable zones.
It highlights when the market shifts from balance to breakout, so traders can align with momentum rather than fighting it.

MJBFX-Strategy (Futures Optimized)The MJBFX-Strategy is a complete market mapping tool designed to give traders a clear view of liquidity, session dynamics, and premium/discount levels. It loads automatically on any chart, fully optimized for futures and forex trading.
🔑 Key Features
Asian Session Range
Highlights the previous Asian session with a shaded box
Fixed until London open for precise reference
VWAP from Asian Session
Plots the VWAP of the previous Asian session
Dynamic fair value benchmark for intraday trading
Liquidity Sweeps (Optimized)
Detects sweeps of the Asian session high/low
Shown only on 30m, 1h, and 4h charts to reduce noise
Clean, minimal labels for clarity
Automatic Fibonacci Zone
Draws a shaded retracement zone (38.2%–61.8%) of the Asian range
Transparent fill makes it easy to read price action
Killzones
Highlights London (07:00–10:00) and New York (13:00–16:00) killzones
Semi-opaque shading to keep charts clean
Auto Trade Box (Risk/Reward)
On sweep confirmation, plots a 2R target box
Auto stop loss and take profit levels based on futures tick size
🎯 Why Use It?
The MJBFX-Strategy removes the need for manual drawing.It automatically maps:
Session highs and lows
Liquidity sweeps
VWAP and fib retracement zones
Key killzones
Perfect for session-based intraday trading in both futures and forex.
⚡ No manual settings required.Just load it onto your chart for an instant institutional view of the market.

Advanced Correlation Monitor📊 Advanced Correlation Monitor - Pine Script v6
🎯 What does this indicator do?
Monitors real-time correlations between 13 different asset pairs and alerts you when historically strong correlations break, indicating potential trading opportunities or changes in market dynamics.
🚀 Key Features
✨ Multi-Market Monitoring
7 Forex Pairs (GBPUSD/DXY, EURUSD/GBPUSD, etc.)
6 Index/Stock Pairs (SPY/S&P500, DAX/NASDAQ, TSLA/NVDA, etc.)
Fully configurable - change any pair from inputs
📈 Dual Correlation Analysis
Long Period (90 bars): Identifies historically strong correlations
Short Period (6 bars): Detects recent breakdowns
Pearson Correlation using Pine Script v6 native functions
🎨 Intuitive Visualization
Real-time table with 6 information columns
Color coding: Green (correlated), Red (broken), Gray (normal)
Visual states: 🟢 OK, 🔴 BROKEN, ⚫ NORMAL
🚨 Smart Alert System
Only alerts previously correlated pairs (>80% historical)
Detects breakdowns when short correlation <80%
Consolidated alert with all affected pairs
🛠️ Flexible Configuration
Adjustable Parameters:
📅 Periods: Long (30-500), Short (2-50)
🎯 Threshold: 50%-99% (default 80%)
🎨 Table: Configurable position and size
📊 Symbols: All pairs are configurable
Default Pairs:
FOREX: INDICES/STOCKS:
- GBPUSD vs DXY • SPY vs S&P500
- EURUSD vs GBPUSD • DAX vs S&P500
- EURUSD vs DXY • DAX vs NASDAQ
- USDCHF vs DXY • TSLA vs NVDA
- GBPUSD vs USDCHF • MSFT vs NVDA
- EURUSD vs USDCHF • AAPL vs NVDA
- EURUSD vs EURCAD
💡 Practical Use Cases
🔄 Pairs Trading
Detects when strong correlations break for:
Statistical arbitrage
Mean reversion trading
Divergence opportunities
🛡️ Risk Management
Identifies when "safe" assets start moving independently:
Portfolio diversification
Smart hedging
Regime change detection
📊 Market Analysis
Understand underlying market structure:
Forex/DXY correlations
Tech sector rotation
Regional market disconnection
🎓 Results Interpretation
Reading Example:
EURUSD vs DXY: -98.57% → -98.27% | 🟢 OK
└─ Perfect negative correlation maintained (EUR rises when DXY falls)
TSLA vs NVDA: 78.12% → 0% | ⚫ NORMAL
└─ Lost tech correlation (divergence opportunity)
Trading Signals:
🟢 → 🔴: Broken correlation = Possible opportunity
Large difference: Indicates correlation tension
Multiple breaks: Market regime change

Drunken Bird Inspiration for the support and resistance plateau lines came from AnotherDAPTrader.
The TSL Drunken Bird is an enhanced technical analysis tool for swing traders on TradingView, based on the original Accurate Swing Trading System by ceyhun. It generates buy and sell signals when price crosses a dynamic Trailing Stop Loss (TSL) level derived from recent highs and lows. This version introduces plateau detection for support and resistance lines, dynamic label expiration to reduce clutter, customizable line styles and decay, and improved HTF confluence for trend-aligned trading. Visual elements include signal labels, horizontal lines, a colored TSL plot, and optional bar/background coloring. Alerts are available for buy/sell crossovers, making it suitable for assets like NASDAQ E-mini futures, stocks, forex, and more.
This script adapts and expands upon ceyhun's original codetradingview.com, adding significant features such as tolerance-based plateau identification for support/resistance, label management with timeframe-aware expiration (~7 days), cross-count decay for lines, and expanded customization options. Inspiration for the support and resistance plateau lines came from AnotherDAPTrader. Released under the Mozilla Public License 2.0.Key
Features
Swing Signals: "BUY" and "SELL" labels on price crossovers/crossunders of the TSL, with a user-defined lookback (default 3).
HTF Confluence: Filters signals based on higher timeframe trend (e.g., "EXIT LONG" instead of "SELL" if HTF is bullish); toggleable.
HTF Options: Select from 5m, 15m, 30m, 1h, 4h, Daily, Weekly, or Monthly.
Plateau Detection: Identifies flat highs/lows (with tolerance) for resistance/support lines, plotted as dotted/solid/dashed with customizable colors, thickness, and decay after crosses (default 2).
Horizontal Lines: Green (buy) and red (sell) lines at signal closes, extending right until crossed; toggle between short (no extension limit) or long visualization.
TSL Visualization: Colored line (green if close >= TSL, red otherwise) for dynamic levels.
Bar/Background Coloring: Optional green/red coloring based on price vs. TSL.
Label Expiration: All labels (signals and plateaus) auto-delete after ~7 days (timeframe-adjusted, default 1008 bars).
Alerts: Triggers for "Buy Signal" and "Sell Signal" on crossovers.
How to Use
Add to Chart: Paste the Pine Script into TradingView's editor and add to your chart.
Configure Settings:
Swing: Lookback for highs/lows (min 1).
Plateau Tolerance: Flatness allowance (default 0.0).
Use HTF Confluence: Enable for trend filtering.
Higher Time Frame: Choose timeframe string.
Barcolor/Bgcolor: Toggle coloring.
Show Plateau Lines: Enable support/resistance.
Line Styles/Colors/Thickness: Customize buy/sell and plateau visuals.
Plateau Line Decay: Crosses before stopping extension.
Label Expiration: Bars for auto-deletion (~7 days).
Interpret Elements:
Labels: "BUY"/"SELL" (green/red), "EXIT SHORT"/"EXIT LONG" (orange) on signals; "Res"/"Sup" on plateaus.
Lines: Extend right until conditions met (cross for buy/sell, decay threshold for plateaus).
TSL Plot: Monitors trend shifts.
Set Alerts: Use "Buy Signal" or "Sell Signal" conditions for notifications.
Testing: Apply to volatile assets; adjust Swing for signal frequency, tolerance for plateau sensitivity.
Ideal Use Cases
Swing trading on 1m–1h charts for entries/exits aligned with HTF trends.
Identifying support/resistance in ranging markets via plateaus.
Scalping with short lookbacks or longer swings with HTF enabled.
Manual or alert-based trading on futures, stocks, or forex.
Why It's Valuable
This indicator builds on ceyhun's core TSL logic with practical enhancements for modern trading: clutter reduction via expiration/decay, visual customization, and plateau-based S/R for better context. It promotes disciplined, trend-aware decisions while maintaining simplicity.
Note: Optimized for any timeframe/asset; test in demo. Not financial advice—use with risk management.

Rolling VWAP LevelsRolling VWAP Levels Indicator
Overview
Dynamic horizontal lines showing rolling Volume Weighted Average Price (VWAP) levels for multiple timeframes (7D, 30D, 90D, 365D) that update in real-time as new bars form.
Who This Is For
Day traders using VWAP as support/resistance
Swing traders analyzing multi-timeframe price structure
Scalpers looking for mean reversion entries
Options traders needing volatility bands for strike selection
Institutional traders tracking volume-weighted fair value
Risk managers requiring dynamic stop levels
How To Trade With It
Mean Reversion Strategies:
Buy when price is below VWAP and showing bullish divergence
Sell when price is above VWAP and showing bearish signals
Use multiple timeframes - enter on shorter, confirm on longer
Target opposite VWAP level for profit taking
Breakout Trading:
Watch for price breaking above/below key VWAP levels with volume
Use 7D VWAP for intraday breakouts
Use 30D/90D VWAP for swing trade breakouts
Confirm breakout with move beyond first standard deviation band
Support/Resistance Trading:
VWAP levels act as dynamic support in uptrends
VWAP levels act as dynamic resistance in downtrends
Multiple timeframe VWAP confluence creates stronger levels
Use standard deviation bands as additional S/R zones
Risk Management:
Place stops beyond next VWAP level
Use standard deviation bands for position sizing
Exit partial positions at VWAP levels
Monitor distance table for overextended moves
Key Features
Real-time Updates: Lines move and extend as new bars form
Individual Styling: Custom colors, widths, styles for each timeframe
Standard Deviation Bands: Optional volatility bands with custom multipliers
Smart Labels: Positioned above, below, or diagonally relative to lines
Distance Table: Shows percentage distance from each VWAP level
Alert System: Get notified when price crosses VWAP levels
Memory Efficient: Automatically cleans up old drawing objects
Settings Explained
Display Group: Show/hide labels, font size, line transparency, positioning
Individual VWAP Groups: Color, line width (1-5), line style for each timeframe
Standard Deviation Bands: Enable bands with custom multipliers (0.5, 1.0, 1.5, 2.0, etc.)
Labels Group: Position (8 options including diagonal), custom text, price display
Additional Info: Distance table, alert conditions
Technical Implementation
Uses rolling arrays to maintain sliding windows of price*volume data. The core calculation function processes both VWAP and standard deviation efficiently. Lines are created dynamically and updated every bar. Memory management prevents object accumulation through automatic cleanup.
Best Practices
Start with 7D and 30D VWAP for most strategies
Add 90D/365D for longer-term context
Use standard deviation bands when volatility matters
Position labels to avoid chart clutter
Enable distance table during high volatility periods
Set alerts for key VWAP level breaks
Market Applications
Forex: Major pairs during London/NY sessions
Stocks: Large cap names with good volume
Crypto: Bitcoin, Ethereum, major altcoins
Futures: ES, NQ, CL, GC with continuous volume
Options: Use SD bands for strike selection and volatility assessment

[Mustang Algo] Channel Strategy# Mustang Algo Channel Strategy - Universal Market Sentiment Oscillator
## 🎯 ORIGINAL CONCEPT
This strategy employs a unique market sentiment oscillator that works on ALL financial assets. It uses Bitcoin supply dynamics combined with stablecoin market capitalization as a macro sentiment indicator to generate universal timing signals across stocks, forex, commodities, indices, and cryptocurrencies.
## 🌐 UNIVERSAL APPLICATION
- **Any Asset Class:** Stocks, Forex, Commodities, Indices, Crypto, Bonds
- **Market-Wide Timing:** BTC/Stablecoin ratio serves as a global risk sentiment gauge
- **Cross-Market Signals:** Trade any instrument using macro liquidity conditions
- **Ecosystem Approach:** One oscillator for all financial markets
## 🧮 METHODOLOGY
**Core Calculation:** BTC Supply / (Combined Stablecoin Market Cap / BTC Price)
- **Data Sources:** DAI + USDT + USDC market capitalizations
- **Signal Generation:** RSI(14) applied to the ratio, double-smoothed with WMA
- **Timing Logic:** Crossover signals filtered by overbought/oversold zones
- **Multi-Timeframe:** Configurable timeframe analysis (default: Daily)
## 📈 TRADING STRATEGY
**LONG Entries:** Bullish crossover when market sentiment is oversold (<48)
**SHORT Entries:** Bearish crossover when market sentiment is overbought (>55)
**Universal Timing:** These macro signals apply to trading any financial instrument
## ⚙️ FLEXIBLE RISK MANAGEMENT
**Three SL/TP Calculation Modes:**
- **Percentage Mode:** Traditional % based (4% SL, 12% TP default)
- **Ticks Mode:** Precise tick-based calculation (50/150 ticks default)
- **Pips Mode:** Forex-style pip calculation (50/150 pips default)
**Realistic Parameters:**
- Commission: 0.1% (adjustable for different asset classes)
- Slippage: 2 ticks
- Position sizing: 10% of equity (conservative)
- No pyramiding (single position management)
## 📊 KEY ADVANTAGES
✅ **Universal Application:** One strategy for all asset classes
✅ **Macro Foundation:** Based on global liquidity and risk sentiment
✅ **False Signal Filtering:** Overbought/oversold zones reduce noise
✅ **Flexible Risk Management:** Multiple SL/TP calculation methods
✅ **No Lookahead Bias:** Clean backtesting with realistic results
✅ **Cross-Market Correlation:** Captures broad market risk cycles
## 🎛️ CONFIGURATION GUIDE
1. **Asset Selection:** Apply to stocks, forex, commodities, indices, crypto
2. **Timeframe Setup:** Daily recommended for swing trading
3. **Sentiment Bounds:** Adjust 48/55 levels based on market volatility
4. **Risk Management:** Choose appropriate SL/TP mode for your asset class
5. **Direction Filter:** Select Long Only, Short Only, or Both
## 📋 BACKTESTING STANDARDS
**Compliant with TradingView Guidelines:**
- ✅ Realistic commission structure (0.1% default)
- ✅ Appropriate slippage modeling (2 ticks)
- ✅ Conservative position sizing (10% equity)
- ✅ Sustainable risk ratios (1:3 SL/TP)
- ✅ No lookahead bias (proper historical simulation)
- ✅ Sufficient sample size potential (100+ trades possible)
## 🔬 ORIGINAL RESEARCH
This strategy introduces a revolutionary approach to financial markets by treating the BTC/Stablecoin ratio as a global risk sentiment gauge. Unlike traditional indicators that analyze individual asset price action, this oscillator captures macro liquidity flows that affect ALL financial markets - from stocks to forex to commodities.
## 🎯 MARKET APPLICATIONS
**Stocks & Indices:** Risk-on/risk-off sentiment timing
**Forex:** Global liquidity flow analysis for major pairs
**Commodities:** Risk appetite for inflation hedges
**Bonds:** Flight-to-safety vs. risk-seeking behavior
**Crypto:** Native application with direct correlation
## ⚠️ RISK DISCLOSURE
- Designed for intermediate to long-term trading across all timeframes
- Market sentiment can remain extreme longer than expected
- Always use appropriate position sizing for your specific asset class
- Adjust commission and slippage settings for different markets
- Past performance does not guarantee future results
## 🚀 INNOVATION SUMMARY
**What makes this strategy unique:**
- First to use BTC/Stablecoin ratio as universal market sentiment indicator
- Applies macro-economic principles to technical analysis across all assets
- Single oscillator provides timing signals for entire financial ecosystem
- Bridges traditional finance with digital asset insights
- Combines fundamental liquidity analysis with technical precision

DeltaStrike — Aggressive Candle Detector by Chaitu50cDeltaStrike — Aggressive Candle Detector
by Chaitu50c
DeltaStrike is a simple and effective tool designed to help traders identify the most aggressive candles on the chart in real time. It works purely on price action and internal candle dynamics, with no reliance on lagging indicators.
The indicator combines delta (directional strength), candle range, and volume to compute an overall aggressiveness score for each candle. When this score exceeds a dynamic threshold based on recent market behavior, the candle is marked as an aggressive move.
Aggressive bullish candles are plotted as green diamonds below the candle, while aggressive bearish candles are plotted as red diamonds above the candle. The goal is to help traders visually spot moments of strong directional pressure, where potential trends or reversals may emerge.
The detection logic adapts automatically to changing market volatility and volume, making it suitable for all instruments and timeframes, including index futures, equities, and forex.
An integrated dashboard on the chart displays live readings of the key components contributing to each candle’s aggressiveness score: delta ratio, range ratio, and volume ratio. This helps traders understand the internal structure of each aggressive move.
Features:
Dynamic aggressiveness detection based on delta, range, and volume
Adaptive threshold for consistent behavior across timeframes and instruments
Clean chart output with clear diamond markers only on selected candles
Live dashboard with internal metrics for advanced analysis
Simple, lightweight, and optimized for intraday and swing trading
Works with any instrument: index, equity, forex, commodity
DeltaStrike is intended as an objective visual aid to help traders focus on genuine moments of strong market intent, filtering out ordinary or passive price movement. It can be used standalone or in combination with your existing trading strategy.

Trailing Stop Loss [TradingFinder] 4 Machine Learning Methods🔵 Introduction
The trailing stop indicator dynamically adjusts stop-loss (SL) levels to lock in profits as price moves favorably. It uses pivot levels and ATR to set optimal SL points, balancing risk and reward.
Trade confirmation filters, a key feature, ensure entries align with market conditions, reducing false signals. In 2023 a study showed filtered entries improve win rates by 15% in forex. This enhances trade precision.
SL settings, ranging from very tight to very wide, adapt to volatility via ATR calculations. These settings anchor SL to previous pivot levels, ensuring alignment with market structure. This caters to diverse trading styles, from scalping to swing trading.
The indicator colors the profit zone between the entry point (EP) and SL, using light green for buy trades and light red for sell trades. This visual cue highlights profit potential. It’s ideal for traders seeking dynamic risk management.
A table displays real-time trade details, including EP, SL, and profit/loss (PNL). Backtests show trailing stops cut losses by 20% in trending markets. This transparency aids decision-making.
🔵 How to Use
🟣 SL Levels
The trailing stop indicator sets SL based on pivot levels and ATR, offering four options: very tight, tight, wide, or very wide. Very tight SLs suit scalpers, while wide SLs fit swing traders. Select the base level to match your strategy.
If price hits the SL, the trade closes, and the indicator evaluates the next trade using the selected filter. This ensures disciplined trade management. The cycle restarts with a new confirmed entry.
Very tight SLs, set near recent pivots, trigger exits early to minimize risk but limit profits in volatile markets. Wide SLs, shown as farther lines, allow more price movement but increase exposure to losses. Adjust based on ATR and conditions, noting SL breaches open new positions.
🟣 Visualization
The indicator’s visual cues, like colored profit zones, simplify monitoring, with light green showing the profit area from EP to trailed SL. Dashed lines mark entry points, while solid lines track the trailed SL, triggering new positions when breached.
When price moves into profit, the area between EP and SL is colored—light green for longs, light red for shorts. This highlights the profit zone visually. The SL trails price, locking in gains as the trade progresses.
🟣 Filters
Upon trade entry, the indicator requires confirmation via filters like SMA 2x or ADX to validate momentum. Filters reduce false entries, though no guarantee exists for improved outcomes. Monitor price action post-entry for trade validity.
Filters like Momentum or ADX assess trend strength before entry. For example, ADX above 25 confirms strong trends. Choose “none” for unfiltered entries.
🟣 Bullish Alert
For a bullish trade, the indicator opens a long position with a green SL Line (after optional filters), trailing the SL below price. Set alerts to On in the settings for notifications, or Off to monitor manually.
🟣 Bearish Alert
In a bearish trade, the indicator opens a short position with a red SL Line post-confirmation, trailing the SL above price. With alerts On in the settings, it notifies the potential reversal.
🟣 Panel
A table displays all trades’ details, including Win Rates, PNL, and trade status. This real-time data aids in tracking performance. Check the table to assess trade outcomes instantly.
Review the table regularly to evaluate trade performance and adjust settings. Consistent monitoring ensures alignment with market dynamics. This maximizes the indicator’s effectiveness.
🔵 Settings
Length (Default: 10) : Sets the pivot period for calculating SL levels, balancing sensitivity and reliability.
Base Level : Options (“Very tight,” “Tight,” “Wide,” “Very wide”) adjust SL distance via ATR.
Show EP Checkbox : Toggles visibility of the entry point on the chart.
Show PNL : Displays profit/loss data for active and closed trades.
Filter : Options (“none,” “SMA 2x,” “Momentum,” “ADX”) validate trade entries.
🔵 Conclusion
The trailing stop indicator, a dynamic risk management tool, adjusts SLs using pivot levels and ATR. Its confirmation filters reduce false entries, boosting precision. Backtests show 20% loss reduction in trending markets.
Customizable SL settings and visual profit zones enhance usability across trading styles. The real-time table provides clear trade insights, streamlining analysis. It’s ideal for forex, stocks, or crypto.
While filters like ADX improve entry accuracy, no setup guarantees success in all conditions. Contextual analysis, like trend strength, is key. This indicator empowers disciplined, data-driven trading.

5m Gold Strategy - Session Break + Previous Day High/LowHere is your complete Pine Script v5 code for TradingView that:
Implements your 5-minute Gold breakout strategy.
Uses previous day high/low levels.
Confirms entry based on 15-minute SMA trend (SMA 9 > SMA 21).
Marks session time.
Filters news time (pause trading 15 minutes before/after major red news from ForexFactory).

VOLD Ratio Histogram [Th16rry]How to Use the VOLD Ratio Histogram Indicator
The VOLD Ratio Histogram Indicator is a powerful tool for identifying buying and selling volume dominance over a selected period. It provides traders with visual cues about volume pressure in the market, helping them make more informed trading decisions.
How to Read the Indicator:
1. Green Bars (Positive Histogram):
- Indicates that buying volume is stronger than selling volume.
- Higher green bars suggest increasing bullish pressure.
- Useful for confirming uptrends or identifying potential accumulation phases.
2. Red Bars (Negative Histogram):
- Indicates that selling volume is stronger than buying volume.
- Lower red bars suggest increasing bearish pressure.
- Useful for confirming downtrends or identifying potential distribution phases.
3. Zero Line (Gray Line):
- Acts as a neutral reference point where buying and selling volumes are balanced.
- Crossing above zero suggests buying dominance; crossing below zero suggests selling dominance.
How to Use It:
1. Confirming Trends:
- A strong positive histogram during an uptrend supports bullish momentum.
- A strong negative histogram during a downtrend supports bearish momentum.
2. Detecting Reversals:
- Monitor for changes from positive (green) to negative (red) or vice versa as potential reversal signals.
- Divergences between price action and histogram direction can indicate weakening trends.
3. Identifying Volume Surges:
- Sharp spikes in the histogram may indicate strong buying or selling interest.
- Use these spikes to investigate potential breakout or breakdown scenarios.
4. Filtering Noise:
- Adjust the period length to control sensitivity:
- Shorter periods (e.g., 10) are more responsive but may produce more noise.
- Longer periods (e.g., 50) provide smoother signals, better for identifying broader trends.
Recommended Markets:
- Cryptocurrencies: Works effectively with real volume data from exchanges.
- Forex: Useful with tick volume, though interpretation may vary.
- Stocks & Commodities: Particularly effective for analyzing high-volume assets.
Best Practices:
- Combine the VOLD Ratio Histogram with other indicators like moving averages or RSI for confirmation.
- Use different period lengths depending on your trading style (scalping, swing trading, long-term investing).
- Observe volume spikes and divergences to anticipate potential market moves.
The VOLD Ratio Histogram Indicator is ideal for traders looking to enhance their volume analysis and gain a deeper understanding of market dynamics.

TimeMapTimeMap is a visual price-reference indicator designed to help traders rapidly visualize how current price levels relate to significant historical closing prices. It overlays your chart with reference lines representing past weekly, monthly, quarterly (3-month), semi-annual (6-month), and annual closing prices. By clearly plotting these historical price references, TimeMap helps traders quickly gauge price position relative to historical market structure, aiding in the identification of trends, support/resistance levels, and potential reversals.
How it Works:
The indicator calculates the precise number of historical bars corresponding to weekly, monthly, quarterly, semi-annual, and annual intervals, dynamically adjusting according to your chart’s timeframe (intraday, daily, weekly, monthly) and chosen market type (Stocks US, Crypto, Forex, or Futures). Historical closing prices from these periods are plotted directly on your chart as horizontal reference lines.
For intraday traders, the script accurately calculates historical offsets considering regular and extended trading sessions (e.g., pre-market and after-hours sessions for US stocks), ensuring correct positioning of historical lines.
User-Configurable Inputs Explained in Detail:
Market Type:
Allows you to specify your trading instrument type, automatically adjusting calculations for:
- Stocks US (default): 390 minutes per regular session (780 minutes if extended hours enabled), 5 trading days/week.
- Crypto: 1440 minutes/day, 7 trading days/week.
- Forex: 1440 minutes/day, 5 trading days/week.
- Futures: 1320 minutes/day, 5 trading days/week.
Show Weekly Close:
When enabled, plots a line at the exact closing price from one week ago. Provides short-term context and helps identify recent price momentum.
Show Monthly Close:
When enabled, plots a line at the exact closing price from one month ago. Helpful for evaluating medium-term price positioning and monthly trend strength.
Show 3-Month Close:
When enabled, plots a line at the exact closing price from three months ago. Useful for assessing quarterly market shifts, intermediate trend changes, and broader market sentiment.
Show 6-Month Close:
When enabled, plots a line at the exact closing price from six months ago. Useful for identifying semi-annual trends, significant price pivots, and longer-term support/resistance levels.
Show 1-Year Close:
When enabled, plots a line at the exact closing price from one year ago. Excellent for assessing long-term market direction and key annual price levels.
Enable Smoothing:
Activates a Simple Moving Average (SMA) smoothing of historical reference lines, reducing volatility and providing clearer visual references. Recommended for traders preferring less volatile reference levels.
Smoothing Length:
Determines the number of bars used in calculating the SMA smoothing of historical lines. Higher values result in smoother but slightly delayed reference lines; lower values offer more immediate yet more volatile levels.
Use Extended Hours (Intraday Only):
When enabled (only applicable for Stocks US), it accounts for pre-market and after-hours trading sessions, providing accurate intraday historical line calculations based on extended sessions (typically 780 minutes/day total).
Important Notes and Compliance:
- This indicator does not provide trading signals, recommendations, or predictions. It serves purely as a visual analytical tool to supplement traders’ existing methods.
- Historical lines plotted are strictly based on past available price data; the indicator never accesses future data or data outside the scope of Pine Script’s standard capabilities.
- The script incorporates built-in logic to avoid runtime errors if insufficient historical data exists for a selected timeframe, ensuring robustness even with limited historical bars.
- TimeMap is original work developed exclusively by Julien Eche (@Julien_Eche). It does not reuse or replicate third-party or existing open-source scripts.
Recommended Best Practices:
- Use TimeMap as a complementary analytical reference, not as a standalone strategy or trade decision-making tool.
- Adapt displayed historical periods and smoothing settings based on your trading style and market approach.
- Default plot colors are optimized for readability on dark-background charts; adjust as necessary according to your preference and chart color scheme.
This script is published open-source to benefit the entire TradingView community and fully complies with all TradingView script publishing rules and guidelines.

Adaptive Regression Channel [MissouriTim]The Adaptive Regression Channel (ARC) is a technical indicator designed to empower traders with a clear, adaptable, and precise view of market trends and price boundaries. By blending advanced statistical techniques with real-time market data, ARC delivers a comprehensive tool that dynamically adjusts to price action, volatility, volume, and momentum. Whether you’re navigating the fast-paced world of cryptocurrencies, the steady trends of stocks, or the intricate movements of FOREX pairs, ARC provides a robust framework for identifying opportunities and managing risk.
Core Components
1. Color-Coded Regression Line
ARC’s centerpiece is a linear regression line derived from a Weighted Moving Average (WMA) of closing prices. This line adapts its calculation period based on market volatility (via ATR) and is capped between a minimum of 20 bars and a maximum of 1.5 times the user-defined base length (default 100). Visually, it shifts colors to reflect trend direction: green for an upward slope (bullish) and red for a downward slope (bearish), offering an instant snapshot of market sentiment.
2. Dynamic Residual Channels
Surrounding the regression line are upper (red) and lower (green) channels, calculated using the standard deviation of residuals—the difference between actual closing prices and the regression line. This approach ensures the channels precisely track how closely prices follow the trend, rather than relying solely on overall price volatility. The channel width is dynamically adjusted by a multiplier that factors in:
Volatility: Measured through the Average True Range (ATR), widening channels during turbulent markets.
Trend Strength: Based on the regression slope, expanding channels in strong trends and contracting them in consolidation phases.
3. Volume-Weighted Moving Average (VWMA)
Plotted in orange, the VWMA overlays a volume-weighted price trend, emphasizing movements backed by significant trading activity. This complements the regression line, providing additional confirmation of trend validity and potential breakout strength.
4. Scaled RSI Overlay
ARC features a Relative Strength Index (RSI) overlay, plotted in purple and scaled to hover closely around the regression line. This compact display reflects momentum shifts within the trend’s context, keeping RSI visible on the price chart without excessive swings. User-defined overbought (default 70) and oversold (default 30) levels offer reference points for momentum analysis."
Technical Highlights
ARC leverages a volatility-adjusted lookback period, residual-based channel construction, and multi-indicator integration to achieve high accuracy. Its parameters—such as base length, channel width, ATR period, and RSI length—are fully customizable, allowing traders to tailor it to their specific needs.
Why Choose ARC?
ARC stands out for its adaptability and precision. The residual-based channels offer tighter, more relevant support and resistance levels compared to standard volatility measures, while the dynamic adjustments ensure it performs well in both trending and ranging markets. The inclusion of VWMA and scaled RSI adds depth, merging trend, volume, and momentum into a single, cohesive overlay. For traders seeking a versatile, all-in-one indicator, ARC delivers actionable insights with minimal noise.
Best Ways to Use the Adaptive Regression Channel (ARC)
The Adaptive Regression Channel (ARC) is a flexible tool that supports a variety of trading strategies, from trend-following to breakout detection. Below are the most effective ways to use ARC, along with practical tips for maximizing its potential. Adjustments to its settings may be necessary depending on the timeframe (e.g., intraday vs. daily) and the asset being traded (e.g., stocks, FOREX, cryptocurrencies), as each market exhibits unique volatility and behavior.
1. Trend Following
• How to Use: Rely on the regression line’s color to guide your trades. A green line (upward slope) signals a bullish trend—consider entering or holding long positions. A red line (downward slope) indicates a bearish trend—look to short or exit longs.
• Best Practice: Confirm the trend with the VWMA (orange line). Price above the VWMA in a green uptrend strengthens the bullish case; price below in a red downtrend reinforces bearish momentum.
• Adjustment: For short timeframes like 15-minute crypto charts, lower the Base Regression Length (e.g., to 50) for quicker trend detection. For weekly stock charts, increase it (e.g., to 200) to capture broader movements.
2. Channel-Based Trades
• How to Use: Use the upper channel (red) as resistance and the lower channel (green) as support. Buy when the price bounces off the lower channel in an uptrend, and sell or short when it rejects the upper channel in a downtrend.
• Best Practice: Check the scaled RSI (purple line) for momentum cues. A low RSI (e.g., near 30) at the lower channel suggests a stronger buy signal; a high RSI (e.g., near 70) at the upper channel supports a sell.
• Adjustment: In volatile crypto markets, widen the Base Channel Width Coefficient (e.g., to 2.5) to reduce false signals. For stable FOREX pairs (e.g., EUR/USD), a narrower width (e.g., 1.5) may work better.
3. Breakout Detection
• How to Use: Watch for price breaking above the upper channel (bullish breakout) or below the lower channel (bearish breakout). These moves often signal strong momentum shifts.
• Best Practice: Validate breakouts with VWMA position—price above VWMA for bullish breaks, below for bearish—and ensure the regression line’s slope aligns (green for up, red for down).
• Adjustment: For fast-moving assets like crypto on 1-hour charts, shorten ATR Length (e.g., to 7) to make channels more reactive. For stocks on daily charts, keep it at 14 or higher for reliability.
4. Momentum Analysis
• How to Use: The scaled RSI overlay shows momentum relative to the regression line. Rising RSI in a green uptrend confirms bullish strength; falling RSI in a red downtrend supports bearish pressure.
• Best Practice: Look for RSI divergences—e.g., price hitting new highs at the upper channel while RSI flattens or drops could signal an impending reversal.
• Adjustment: Reduce RSI Length (e.g., to 7) for intraday trading in FOREX or crypto to catch short-term momentum shifts. Increase it (e.g., to 21) for longer-term stock trades.
5. Range Trading
• How to Use: When the regression line’s slope is near zero (flat) and channels are tight, ARC indicates a ranging market. Buy near the lower channel and sell near the upper channel, targeting the regression line as the mean price.
• Best Practice: Ensure VWMA hovers close to the regression line to confirm the range-bound state.
• Adjustment: For low-volatility stocks on daily charts, use a moderate Base Regression Length (e.g., 100) and tight Base Channel Width (e.g., 1.5). For choppy crypto markets, test shorter settings.
Optimization Strategies
• Timeframe Customization: Adjust ARC’s parameters to match your trading horizon. Short timeframes (e.g., 1-minute to 1-hour) benefit from lower Base Regression Length (20–50) and ATR Length (7–10) for agility, while longer timeframes (e.g., daily, weekly) favor higher values (100–200 and 14–21) for stability.
• Asset-Specific Tuning:
○ Stocks: Use longer lengths (e.g., 100–200) and moderate widths (e.g., 1.8) for stable equities; tweak ATR Length based on sector volatility (shorter for tech, longer for utilities).
○ FOREX: Set Base Regression Length to 50–100 and Base Channel Width to 1.5–2.0 for smoother trends; adjust RSI Length (e.g., 10–14) based on pair volatility.
○ Crypto: Opt for shorter lengths (e.g., 20–50) and wider widths (e.g., 2.0–3.0) to handle rapid price swings; use a shorter ATR Length (e.g., 7) for quick adaptation.
• Backtesting: Test ARC on historical data for your asset and timeframe to optimize settings. Evaluate how often price respects channels and whether breakouts yield profitable trades.
• Enhancements: Pair ARC with volume surges, key support/resistance levels, or candlestick patterns (e.g., doji at channel edges) for higher-probability setups.
Practical Considerations
ARC’s adaptability makes it suitable for diverse markets, but its performance hinges on proper calibration. Cryptocurrencies, with their high volatility, may require shorter, wider settings to capture rapid moves, while stocks on longer timeframes benefit from broader, smoother configurations. FOREX pairs often fall in between, depending on their inherent volatility. Experiment with the adjustable parameters to align ARC with your trading style and market conditions, ensuring it delivers the precision and reliability you need.

TJR SEEK AND DESTROYTJR SEEK AND DESTROY – Intraday ICT Trading Tool
Built for day traders, TJR SEEK AND DESTROY combines Smart Money concepts like order blocks, fair value gaps, and liquidity sweeps with structure breaks and daily bias to pinpoint high-probability trades during US market hours (9:30–16:00). Ideal for scalping or intraday strategies on stocks, futures, or forex.
What Makes It Unique?
Unlike standalone ICT indicators, this script integrates:
Order Blocks with volume and range filters for precise support/resistance zones.
Fair Value Gaps (FVG) to spot pre-market price imbalances.
Break of Structure (BOS) and Liquidity Sweeps for trend and reversal signals.
A 1H MA-based Bias to align trades with the day’s direction.
BUY/SELL Labels triggered only when bias, BOS, and sweeps align, reducing noise.
How Does It Work?
Order Blocks: Marks zones with high volume (>1.5x 20-period SMA) and low range (<0.5x ATR20) as teal boxes—potential reversal points.
Fair Value Gap: Compares the prior day’s close to the current open (pre- or post-9:30), shown as a purple line and label (e.g., "FVG: 0.005").
Pivot Point: Calculates (prevHigh + prevLow + prevClose) / 3 from the prior day, plotted as an orange line for equilibrium.
Break of Structure: Detects crossovers of 5-bar highs/lows (gray lines), marked with red triangles.
Liquidity Sweeps: Tracks breaches of the prior day’s high/low (yellow lines), marked with yellow triangles.
Daily Bias: Uses 1H close vs. 20-period MA (blue line) for bullish (green background), bearish (red), or neutral (gray) context.
Signals: BUY (green label) when bias is bullish, price breaks up, and sweeps the prior high; SELL (red label) when bias is bearish, price breaks down, and sweeps the prior low.
How to Use It
Setup: Apply to 1M–15M charts for US session trading (9:30–16:00 EST).
Trading:
Wait for a BUY label after a yellow sweep triangle above the prior day’s high in a green (bullish) background.
Wait for a SELL label after a yellow sweep triangle below the prior day’s low in a red (bearish) background.
Use order blocks (teal boxes) as support/resistance for stop-loss or take-profit.
Markets: Best for SPY, ES futures, or forex pairs with US session volatility.
Underlying Concepts
Order Blocks: High-volume, low-range bars suggest institutional activity.
FVG: Gaps between close and open indicate imbalance to be filled.
BOS & Sweeps: Price breaking key levels signals momentum or stop-hunting.
Bias: 1H MA filters trades by broader trend.
Chart Setup
Displays order blocks (teal boxes), pivot (orange), open (purple), bias (colored background), BOS/sweeps (triangles), and signals (labels). Keep other indicators off for clarity.
