Implied Fair Value Gap (IFVG) ICT [TradingFinder] Hidden FVG OTE🔵 Introduction
The Implied Fair Value Gap (IFVG) is distinctive due to its unique three-candlestick formation, which differentiates it from conventional Fair Value Gaps.
Implied fair value represents an estimated worth of an asset—often a business or its goodwill—based on the price likely to be received in a structured transaction between market participants at a specific point in time.
In the ever-evolving world of technical analysis, pinpointing price reversal points and market anomalies can significantly enhance trading strategies and decision-making for traders and investors. Among the advanced concepts gaining traction in this field is the Implied Fair Value Gap (IFVG), introduced by the renowned analyst Inner Circle Trader (ICT).
This tool has proven to be an effective method for identifying hidden supply and demand zones in financial markets, offering a unique edge to traders looking for high-probability setups.
Unlike traditional gaps that are visible on price charts, IFVG is a hidden gap that doesn’t appear explicitly on the chart and thus requires specialized technical analysis tools for accurate identification.
This hidden gap can signal potential price reversals and offers traders insight into high-liquidity areas where price is likely to react. This article will guide you through using the ICT Implied Fair Value Gap Indicator effectively, covering its settings, usage strategies, and key features to help you make informed decisions in the market.
🟣 Bullish Implied FVG
🟣 Bearish Implied FVG
🔵 How to Use
The IFVG indicator is designed to assist traders in recognizing hidden support and resistance zones by identifying Bullish and Bearish IFVG patterns. With this tool, traders can make better-informed decisions about suitable entry and exit points for their trades based on these patterns.
🟣 Bullish Implied Fair Value Gap
This pattern occurs in an uptrend when a large bullish candlestick forms, with the wicks of the previous and following candles overlapping the body of the central candlestick.
This overlap creates a demand zone or a hidden support level, which can act as an ideal entry point for buy trades. Often, when the price returns to this area, it is likely to resume its upward trend, presenting a profitable buying opportunity.
🟣 Bearish Implied Fair Value Gap
This pattern is similar but forms in downtrends. Here, a large bearish candlestick appears on the chart, with the wicks of adjacent candles overlapping its body. This overlap defines a supply zone or a hidden resistance level and serves as a signal for potential sell trades.
When the price returns to this zone, it often continues its downward trend, providing an optimal point for entering sell trades.
The IFVG indicator also includes various filters that traders can use to refine their analysis based on market conditions. These filters, including Very Aggressive, Aggressive, Defensive, and Very Defensive, allow users to customize the IFVG zones' width, offering flexibility according to the trader’s risk tolerance and trading style.
🟣 Example Trading Scenarios
Suppose you’re in a strong uptrend and the IFVG indicator identifies a Bullish IFVG zone. In this scenario, you could consider entering a buy trade when the price retraces to this zone, expecting the uptrend to resume. Conversely, in a downtrend, a Bearish IFVG zone can signal a favorable entry point for short trades when the price revisits this area.
🔵 Settings
Implied Block Validity Period: This parameter specifies the validity period of each identified block, taking into account the number of bars that have passed since its formation. Proper adjustment of this period helps traders focus only on relevant zones, increasing the accuracy of the analysis.
Mitigation Level OB : This option defines the mitigation level for supply and demand blocks (Order Blocks), with settings including Proximal, 50% OB, and Distal.
Depending on the selected level, the indicator will focus on closer, mid-range, or farther points for block identification, allowing traders to adjust for the level of precision required.
Implied Filter : Activating this filter allows traders to apply conditions based on the width of the IFVG zones. With options like Very Aggressive and Very Defensive, traders can control the width of IFVG zones to suit their risk management strategy—whether they prefer high-risk setups or low-risk setups.
Display and Color Settings : This section enables users to customize the appearance of the IFVG zones on their charts. Traders can set different colors for Bullish and Bearish zones, allowing for easier distinction and improved visualization.
Alert Settings : One of the standout features of the IFVG indicator is the alert system. By setting up alerts, users can be notified whenever the price approaches a demand or supply zone.
Alerts can be customized to trigger Once Per Bar (one alert per bar) or Per Bar Close (alert at the close of each bar), ensuring that traders stay updated on critical price movements without needing to monitor the chart continuously.
🔵 Conclusion
The ICT Implied Fair Value Gap (IFVG) indicator is a powerful and sophisticated tool in technical analysis, allowing professional traders to identify hidden supply and demand zones and use them as entry and exit points for buy and sell trades.
This indicator’s automatic detection of IFVG zones helps traders uncover hidden trading opportunities that can enhance their analysis.
While the IFVG indicator offers numerous advantages, it is important to use it in conjunction with other technical analysis tools and sound risk management practices.
IFVG alone does not guarantee profitability in trading; it works best when combined with other indicators such as volume analysis and trend-following indicators for a comprehensive trading strategy.
ابحث في النصوص البرمجية عن "fvg"

Fair Value Gaps (FVG) [UAlgo]A fair value gap is especially popular among price action traders and occurs when there are inefficiencies or imbalances in the market, or when the buying and selling are not equal. Fair value gaps can become a magnet for the price before continuing in the same direction.
🔶 Key Features :
Fair Value Gap Identification:
Bullish fair value gaps occur when the current market price exceeds the previous high. The indicator identifies bullish gaps by comparing the low of the current candle with the high of the candle two candles ago . If the low of the current candle is higher than the high two candles ago and the closing price of the previous candle is also higher than the high two candles ago, a bullish fair value gap is detected.
Bearish fair value gaps occur when the current market price falls below the previous low. The indicator identifies bearish gaps by comparing the high of the current candle with the low of the candle two candles ago. If the high of the current candle is lower than the low two periods ago and the closing price of the previous candle is also lower than the low two candles ago, a bearish fair value gap is detected.
Fair Value Gap Filter :
ATR measures market volatility by analyzing the range of price movements over a specified period. It provides insights into the average price range that a security experiences within a given timeframe. After the ATR is calculated, a Simple Moving Average (SMA) is computed for the ATR values. This moving average smoothens out the ATR data, providing a clearer indication of the average volatility levels over time.
When the filter is active, fair value gaps are identified only if they occur during periods of relatively higher volatility, as indicated by the ATR being greater than the SMA. This helps in refining and obtaining the detection of stronger fair value gaps
An example with FVG filtering off:
An example with FVG filtering on:
Customizable Settings: Users have the flexibility to customize various parameters to suit their trading preferences. They can adjust settings such as the number of fair value gaps displayed, mitigation method (either based on closing prices or wicks), and apply filters based on Average True Range (ATR) to refine gap detection.
🔶 Disclaimer :
Use with Caution: Trading involves significant risk, and this indicator should be used with caution. While it can help identify potential trading opportunities, it does not guarantee profits and may sometimes provide false signals.
Not Financial Advice: The information provided by the Fair Value Gaps indicator is for educational and informational purposes only and should not be considered as financial advice. Traders should conduct their own research and consult with financial professionals before making any trading decisions.
Past Performance: Past performance is not indicative of future results. Historical price movements analyzed by the indicator may not accurately predict future market behavior.

HTF FVG and Wick Fill trackingImbalances in the charts are some of the clearest and most traded price areas. Two of the best and most used are fair value gaps FVGs and large candle wicks. In both of these price appears to move in such a way that most are left behind having 'missed' the move. But in reality price will often come back to these price points to re-balance and absorb the liquidity that was left behind.
This indicator takes these areas and makes viewing and tracking them clearer than ever. It does this, by first allowing the user to overlay a higher timeframe candle on the current chart. This in itself provides an in depth look at a higher timeframe candle both as it forms and in its final form.
Next the indicator identifies either the FVG or large wicks, on the chosen higher timeframe, all while the chart remains on a lower timeframe. As seen here the fair value gaps are clearly highlighted, taken from a 4 hour timeframe, while the actual chart is on 15 minutes. This allows the user even greater accuracy in identifying their key trading areas.
Utilizing the indicators unique feature, these areas can optionally be extended forward to the current timeframe and 'filled' in realtime. Areas that are filled to the users defined level, will be removed from the chart.
With supplementary settings for how much history to show, how large of a wick should be highlighted and complete control over the colour scheme, users will be able to track and understand the filling of imbalances like never before.

Displacement (Two FVGs)A simple indicator that attempts to identify displacement in price by alerting you when two simultaneous Fair Value Gaps (FVGs) occur.
When two fair value gaps occur, the indicator will print a green bar (if bullish) or a red bar (if bearish). If you right click on the indicator you can turn on alerts that will pop up every time a dual FVG occurs.
Fair Value Gaps are most commonly used amongst price action traders and are defined as instances in which there are inefficiencies, or imbalances, in the market.
The concept for this indicator is very simple. Apply it to your chart and enable alerts on the instruments and timeframe you trade. When you get an alert, it could indicate larger players getting involved.
This is NOT a trading strategy. Its intention is to save time by alerting you to large imbalances in price on the instruments you trade.

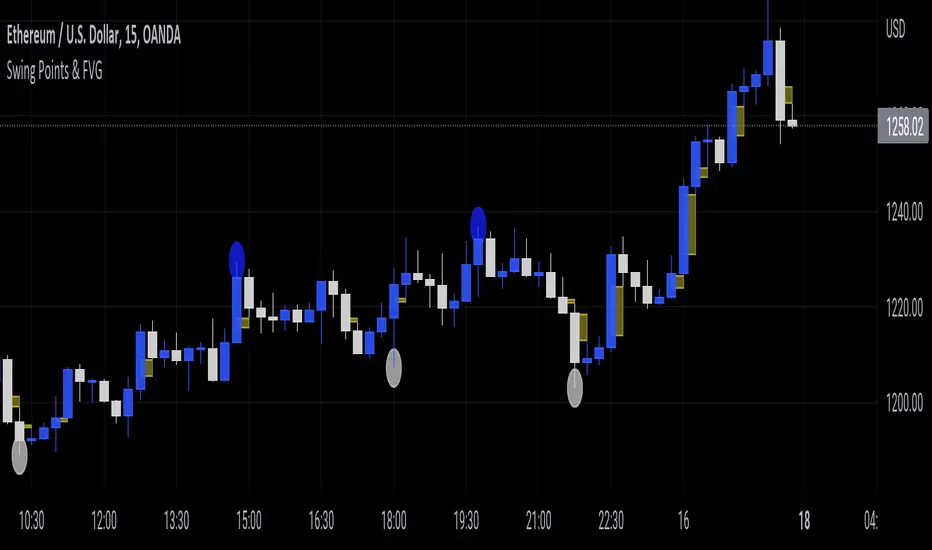
Swing Points & FVGClassic ITH/ITL
Intermediate Term High - High that has short term high on either of it's side.
Intermediate Term Low - Low that has short term low on either of it's side.
FVG
The indicator also marks Fair Value Gaps which is a very important concept in price action trading. FVGs are formed when there is ineffeciency,or imbalance, in the market.
Rebalanced ITH/ITL
Rebalanced ITH - A short term high that rebalanced the ineffeciency in price can be considered as an Intermediate Term High.
Rebalanced ITL - A short term low that rebalanced the ineffeciency in price can be considered as an Intermediate Term Low.
Use the ITH and ITL points marked by the indicator to determine the structure of the market.
Indicator repaints only when it tries to identify the latest ITH/ITL.
Fractal Break Imbalance / Fair Value Gap (FVG) / Liquidity VoidFractal Break Imbalance / Fair Value Gap (FVG) / Liquidity Void
Order imbalances in either direction, either excess buy or sell orders, reduce liquidity. The market will seek to fill gaps sooner or later. The script marks an imbalance / FVG after a fractal break. It also marks any other imbalance.
Default Colours:
Green - Imbalance after fractal break to the upside
Red - Imbalance after fractal break to the downside
Yellow - Other imbalances
How To Use:
Gaps can be used to determine possible entries and targets. Those familiar with liquidity raids, supply and demand, and ICT concepts may realise it's potential.
Indicator in use:

Super OrderBlock / FVG / BoS Tools by makuchaku & eFeThis super indicator is a Swiss army knife for Smart Money traders for OrderBlocks / FVG / BoS
It provides many options for drawing (non-repainting) boxes for OrderBlocks, Fair Value Gaps (FVG) and Break of Structures. The boxes are extended into the future, until the first retest/mitigation.
Some of the additional options (not explained in the diagrams above)
PPDD OB : An order block which is formed after interacting with Liquidity (old low/high, fractal low/high, etc). Since these OB's are in the most premium or most discount, they are Premium Premium Discount Discount OB's (PPDD OB)
HVB Bars : When the volume of any bar is higher than the average volume of last N bars, it could mean something important (in the right context). Hence, the indicator allows for coloring them differently.
This indicator was built as a collaboration between @makuchaku & eFe
Pro tip : This indicator is a simply a tool to visualize trading concepts on the candle stick chart. It is the job of the trader to sequence these effectively into a profitable trade.
If you come across any bug or have a question on how to effectively use the indicator, please don't hesitate to ask questions.
Good luck & good trading!

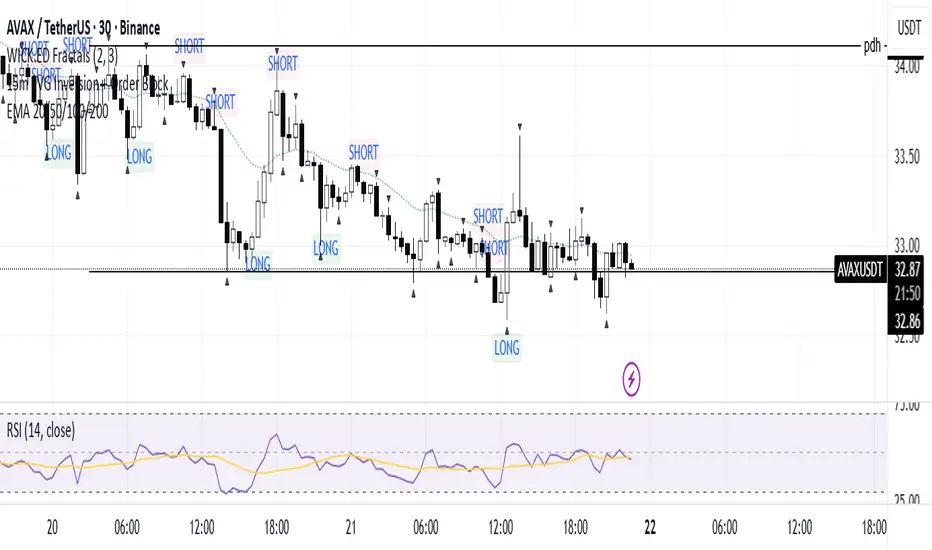
15m FVG Inversion + Order BlockThe indicator finds the inversion of the FVG 15 minutes and the order block, after which it gives an entry signal.
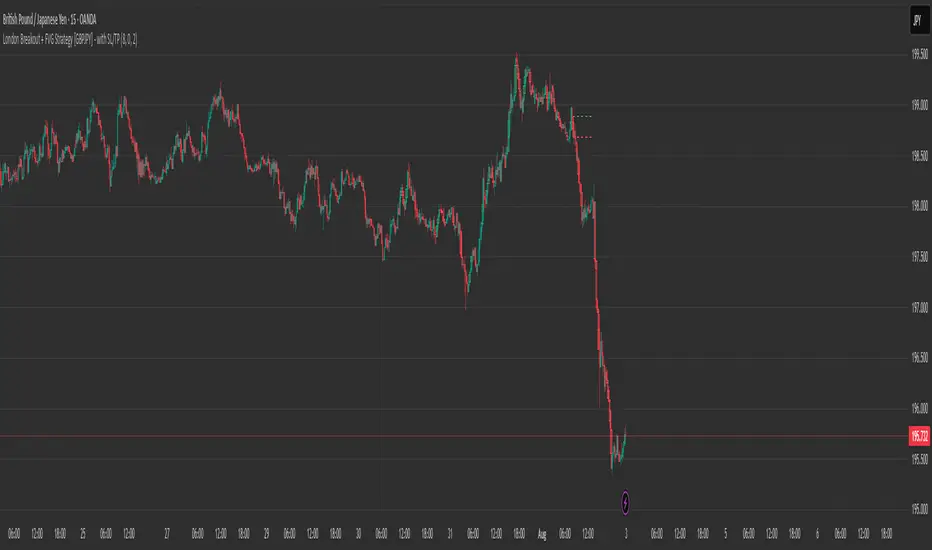
London Breakout + FVG Strategy [GBPJPY] - with SL/TPMarks the London open high and low on 15 min time frame, ads fvg on 5 min for orders
Liquidity Voids (FVG) [LuxAlgo]The Liquidity Voids (FVG) indicator is designed to detect liquidity voids/imbalances derived from the fair value gaps and highlight the distribution of the liquidity voids at specific price levels.
Fair value gaps and liquidity voids are both indicators of sell-side and buy-side imbalance in trading. The only difference is how they are represented in the trading chart. Liquidity voids occur when the price moves sharply in one direction forming long-range candles that have little trading activity, whilst a fair value is a gap in price.
🔶 USAGE
Liquidity can help you to determine where the price is likely to head next. In conjunction with higher timeframe market structure, and supply and demand, liquidity can give you insights into potential price movement. It's essential to practice using liquidity alongside trend analysis and supply and demand to read market conditions effectively.
The peculiar thing about liquidity voids is that they almost always fill up. And by “filling”, we mean the price returns to the origin of the gap. The reason for this is that during the gap, an imbalance is created in the asset that has to be made up for. The erasure of this gap is what we call the filling of the void. And while some voids waste no time in filling, some others take multiple periods before they get filled.
🔶 SETTINGS
The script takes into account user-defined parameters and detects the liquidity voids based on them, where detailed usage for each user-defined input parameter in indicator settings is provided with the related input's tooltip.
🔹 Liquidity Detection
Liquidity Voids Threshold: Act as a filter while detecting the Liquidity Voids. When set to 0 basically means no filtering is applied, increasing the value causes the script to check the width of the void compared to a fixed-length ATR value
Bullish: Color customization option for Bullish Liquidity Voids
Bearish: Color customization option for Bearish Liquidity Voids
Labels: Toggles the visibility of the Liquidity Void label
Filled Liquidity Voids: Toggles the visibility of the Filled Liquidity Voids
🔹 Display Options
Mode: Controls the lookback length of detection and visualization
# Bars: Lookback length customization, in case Mode is set to Present
🔶 RELATED SCRIPTS
Buyside-Sellside-Liquidity
Fair-Value-Gaps

FVG & SMA @danciFVG zones with 200 SMA & daily dividers for intraday analysis, customizable and clear.

FVG Zones with Signals█ OVERVIEW
"FVG Zones with Signals" is a technical analysis tool that identifies Fair Value Gaps (FVG) on the chart and draws customizable zones in the form of boxes. It is ideal for traders using price action and market structure strategies, helping to identify potential imbalance zones and trading opportunities based on breakout and exit signals. With flexible size filter settings, box styles, and signal options, the indicator ensures clarity and precision on the chart.
█ CONCEPTS
The indicator is designed to identify potential entry points for trades based on FVG breakouts or retests. For chart clarity, a size filter for FVGs is included, based on a multiplier of the average candle size over a specified period.
Why are FVGs important? FVG zones represent areas of market imbalance, often attracting price back to "fill" the gap. Larger gaps (with a higher size multiplier) have a greater chance of being retested, as they indicate deeper imbalances—leaving more unexecuted orders in those zones, which attracts liquidity. Market makers and institutions often return to these levels to "refresh" liquidity before further moves. However, not every large FVG is retested quickly—in strong trends, smaller imbalances may be ignored, and the location (e.g., near swing highs/lows) is critical for retest probability.
█ FEATURES
- FVG Detection: Identifies bullish and bearish FVGs based on size filters (Candle Size Period and FVG Size Multiplier), with automatic initialization of historical gaps up to 500 candles back.
- Customizable Boxes: Draws FVG boxes with adjustable border colors, background gradients, border styles (solid, dashed, dotted), border widths, and transparency for both the background and the 50% FVG midline.
- Breakout and Exit Signals: Generates "Break" signals (green upward triangle for breakouts above bearish FVG, red downward triangle for breakouts below bullish FVG) and "Exit" signals (circles for exiting the zone), with options to select signal types (Break, Exit, or Both). A break signal causes the box to disappear, leaving a triangle as a trace of the breakout, which may serve as a signal to open a position. Exit signals (circles) may also indicate entry opportunities but require additional confirmation, such as alignment with the main trend.
- Midline: Automatically draws a dashed line at the 50% FVG level with adjustable transparency, aiding in assessing price reactions within the zone.
- Box Limitation: Automatically removes old or inactive FVGs after 500 candles to avoid chart clutter.
- Alerts: Built-in alerts for all signal types, including price and FVG type descriptions.
█ HOW TO USE
Add to Chart: Apply the indicator to your TradingView chart via the Pine Editor or Indicators menu.
Configure Settings:
- FVG Settings: Adjust Candle Size Period (default 20) and FVG Size Multiplier (default 1) to filter out small gaps—higher values generate fewer but more significant FVGs.
- Box Settings: Configure colors and styles for bullish (green) and bearish (red) boxes, including background transparency (default 80) and midline transparency.
- Signal Settings: Select signal types (Break, Exit, or Both) in Signal Type. Breakout signals appear after a candle closes outside the zone, while exit signals appear when exiting an FVG without a full breakout.
- Styling: Customize signal colors (green for buy/up, red for sell/down) and shape sizes.
Interpreting Signals:
- Break Up Signal: A green triangle below the bar indicates a breakout above a bearish FVG, suggesting potential continuation of an uptrend.
- Break Down Signal: A red triangle above the bar indicates a breakout below a bullish FVG, suggesting potential continuation of a downtrend.
- Exit Up/Down Signal: A green/red circle indicates an exit from an FVG without a full breakout, which may signal the end of a correction or preparation for a reversal.
- FVG Zones: If the price returns to an FVG and fills the gap, it may indicate equilibrium; an unfilled gap often leads to a retest.
- Use signals in conjunction with other technical analysis tools for confirmation, such as RSI (to identify overbought/oversold conditions) or MACD (to confirm momentum). Analyze FVGs from higher timeframes—these zones act as stronger imbalance levels and carry greater structural significance.
Exit signals (retests without breakouts) tend to be most effective when traded in line with the current trend.
█ APPLICATIONS
- Price Action Trading: Use FVG zones as dynamic support and resistance levels. In an uptrend, look for buying opportunities in bullish FVGs, where price often tests the gap before continuing. Combining with RSI, MACD, or Fibonacci levels enhances the significance of zones.
- Breakout Strategies: Trade based on breakout signals from FVGs. A buy signal after breaking a bearish FVG may indicate a strong upward impulse, especially when supported by a rising MACD or RSI exiting oversold conditions.
Larger FVG gaps (higher multiplier) have a greater chance of retest, as they indicate deeper imbalances.
█ NOTES
- Test the indicator across different timeframes and markets (stocks, forex, crypto) to optimize size filters for your trading style.
- The indicator initializes historical FVGs up to 500 candles back, which may slow loading on longer charts.
- For best results, use on high-liquidity markets where FVGs are more frequently retested.
- In consolidation zones, the indicator may generate more false signals, so additional confirmation is recommended.

FVG Reversal Sentinel🔵 FVG Reversal Sentinel – Multi-Timeframe Fair Value Gap Indicator
The FVG Reversal Sentinel is a powerful TradingView indicator designed to help traders identify and track Fair Value Gaps (FVGs) across multiple timeframes, all within a single chart.
This tool allows you to select up to five separate timeframes, ensuring you never miss key market shifts, whether you are scalping, day trading, or swing trading. You can use this indicator in any asset (Cryptos, Futures, Indices, Forex Pairs, etc.).
🔵 - Key Features -
Multi-Timeframe FVG Tracking – Select and display up to five different timeframes on one chart, providing a comprehensive view of market structure.
Customizable Colors – Adjust bullish and bearish FVG colors to match your chart theme for a seamless trading experience.
Enhanced Market Context – Quickly identify key liquidity zones and refine your entries and exits with precision.
Hide the lower timeframes FVGs to get a clear view in a custom timeframe.
Show or hide mitigated FVGs to declutter the chart.
FVGs boxes are going to be displayed only when the candle bar closes
FVGs are going to be mitigated only when the body of the candle closes above or below the FVG area.
No repainting
Whether you're looking to fine-tune your entries or gain a broader market perspective, the FVG Reversal Sentinel indicator ensures you have the tools to stay ahead of price action and capitalize on market inefficiencies.
🔵 - Customization-
You can change the indicator settings as you see fit to achieve the best results for your use case.
TIMEFRAMES
This indicator provides the ability to select up to 5 timeframes. These timeframes are based on the trader's timeframes including any custom timeframes.
Select the desired timeframe from the options list.
Add the label text you would like to show for the selected timeframe.
Check or uncheck the box to display or hide the timeframe from your chart.
FVG SETTINGS
Length of boxes: allows you to select the length of the box that is going to be displayed for the FVGs.
Delete boxes after fill?: allows you to show or hide mitigated FVGs on your chart.
Hide FVGs lower than enabled timeframes?: allows you to show or hide lower timeframe FVGs on your chart. Example - You are in a 15 minutes timeframe chart, if you choose to hide lower timeframe FVGs you will not be able to see 5 minutes FVG defined in your Timeframes Settings, only 15 minutes or higher timeframe FVGs will be displayed on your chart.
BOX VISUALS
Bullish FVG box color: the color and opacity of the box for the bullish FVGs.
Bearish FVG box color: the color and opacity of the box for the bearish FVGs.
LABELS VISUALS
Bullish FVG labels color: the color for bullish labels.
Bearish FVG labels color: the color for bearish labels.
Labels size: the size of the text displayed in the labels.
Labels position: the position of the label inside the FVGs boxes (right, left or center).
BORDER VISUALS
Border width: the width of the border (the thickness).
Bullish FVG border color: the color and the opacity of the bullish box border.
Bearish FVG border color: the color and the opacity of the bearish box border.
🔵 - How to use the indicator -
Just add the indicator in your chart and click in the settings option to customize it.
Make sure you select the desired timeframes and set the colors and opacity for the FVGs boxes.
This indicator can be used in many trading strategies, such as:
SILVER BULLET
iFVG
iFVG RETEST
These strategies are based on the use of FVGs, this tool can help you analyze the market and make the right decision.
🔵 - How was the indicator designed? -
I have spent a lot of time testing other open source indicators from the community. All of these indicators do a great job, but they have a problem, they not only mitigate FVGs when a candle closes above or below the FVG, they also mitigate FVGs when the candle closes exactly to the tick (not above or below the FVG). This is a problem for many strategies that rely on FVGs mitigation.
What makes this indicator different is that it focuses on just mitigating imbalances at the right time for these strategies.
I have taken ideas and some pieces of code from many community indicator developers, such as:
@twingall
@tflab
@marktools
@nacho-fx
@pmk07
... and many other people, to whom I thank for their valuable work and have allowed me to create this tool by making modifications to their source code.
🔵 - Disclaimer -
This tool is intended solely for informational and educational purposes and should not be regarded as financial, investment, or trading advice. It's not designed to predict market movements or offer specific recommendations. Users should be aware that past performance is not indicative of future results and should not rely on any indicator for financial decisions.

MTF Fair Value Gap Indicator ULTRAFVG Fair Value Gap Indicator
FVG's commonly known as Fair Value Gaps are mostly in use for forex trading, however it’s been widely used in price action trading, even on regular large cap stocks. Think of it as an imbalance area where the price of the stock may actually be under/over valued due to many orders being injected in a short amount of time, ie . a gap caused by an impulse created by the speed of the price movement. In essence, the FVG can become a kind of magnet drawing the price back to that level to attempt to balance out the orders (when? we don't know). Please do research to understand the concept of FVG's.
You can look for an opportunity as price approaches the FVG for entry either long/short because after all, it is an "Area of Interest" so the price will either bounce or blow through the area. No indicator works 100% of the time so take in context as just another indicator. It tends work on larger time frames best.
IMPORTANT TV RELATED LIMITATIONS: You should take the time to understand the following. A MAXIMUM of 500 boxes and labels are allowed, thus if you elect to display many different time frames of FVGs and/or select to not auto delete old Daily FVGs, the oldest FVGs will be deleted and not be seen. Additionally if you are on a smaller chart time frame (1 min), you may not see older FVGs such as Daily ones that occurred and still exist from long ago. This is due to TV limitation of 20,000 candles of history in each chart timeframe. Example: A 1 minute chart supports approximately 14 days worth of data so looking for Daily FVGs would only go back that far, whereas if your chart was set to 5 minutes you'd be able to see 5 times as many, ie . 60 days worth of Daily FVG's. Obviously setting your chart and looking for Daily FVG's would support up to 20,000 days worth.
The Indicator Provides many different features:
*Creation of FVG's for all hours or just during market hours. Currently you can enable FVG’s for the following timeframes: Current chart timeframe, 5Min, 10Min, 15Min, 1Hr, 4Hr, 8Hr, Daily, Weekly, Monthly.
*Text label displays overlaying FVG bands including creation timestamps.
* Bands reflecting FVG's in action (created/deleted) for the current chart time frame, 15min, 1hr, 4hr, 8hr and daily time frames. The FVG's will be overlayed on the chart if enabled.
*Mitigation Action - Normal - When FVG is balanced out by price action, the FVG will disappear. Dynamic - The FVG band will decrease as the price movement eats into it thus only showing the remaining imbalance. None - For those that wish to retain FVG's even if they were mitigated. Half - FVG’s disappear when the price intrudes 50% of the overall FVG band zone.
*Mitigation Type - The elimination or balancing of the FVG is caused by either the candle wick or body passing completely through the FVG.
*Maximum FVGs - A maximum number of FVGs are created for each different enabled time frame (be aware setting a large number could impact system performance).
*All FVG band colors can be customized by the user.
* All FVG bands auto extend to the right.
* Intrusion Alerts - Trading View alerts are supported. You can use the indicator settings to enable an alert if the price intrudes into the FVG zone by a certain percentage. This is not related to mitigation or removal of the FVG, just a warning that price has reached the area of interest.

FVG - MTF Confirmed Tracker [JP/EN]Indicator Description: FVG MTF Concluded Bar Tracker
This indicator is a highly functional tool that identifies FVG for the currently displayed bar or a higher-level bar (MTF) and determines its "resolution" when the candlestick is resolved.
Its most notable feature is that it only displays history (gray) on the chart and sends an alert when a "significant level that has been continuously observed for a certain period of time" is resolved.
1. Timeframe Settings
Base Timeframe: Select the timeframe on which to detect FVG. Select "Same as chart" to use the current bar, or select another bar (1-hour, 4-hour, etc.) to project the FVG of the higher-level bar onto the current chart.
2. Active FVG Settings
Sets the currently active support/resistance area that has not yet been filled by price.
Show Bull/Bear: Individually toggles whether to display bull (buy) and bear (sell) FVG.
Color: Specifies the color of the box for the unresolved state.
Extend Right (Active): When enabled, the box will continue to extend indefinitely toward the right edge of the chart until the FVG is resolved.
Max Active FVG: This sets the maximum number of unresolved boxes to display on the chart. When a new FVG is detected, the oldest unresolved box will be automatically deleted if it exceeds this limit, saving resources.
3. Filled FVG Settings (Resolved, Grayed Out, Determination Logic)
These are very important settings for displaying history when the price fills an FVG.
Show Filled: Select whether to leave resolved FVGs grayed out (default color) as "history."
Color: Specifies the color of boxes that have been resolved (Filled).
Extend Right (Filled): When this is turned off, the box extension will stop at the candlestick where the resolution is confirmed, making the resolution point clear.
Max Filled FVG: This sets the maximum number of grayed out boxes to display as history. When the limit is reached, the oldest history will be deleted.
Min Bars to Keep & Alert (Important): This is the threshold for the number of bars elapsed between the occurrence of an FVG and its resolution.
If the threshold is not met: The event is considered a temporary reaction, and no alert will be sounded. The event will also be deleted without being recorded in the history (gray).
If the threshold is met or exceeded: The event is considered a significant market event, and the box will turn gray and an alert will be sent.
4. Alert Settings (Alert Notification Logic)
Alerts are executed in perfect sync with the "resolution of significant levels (graying out)."
Alert when Bull / Bear turns Gray: A notification will be sent the moment a bullish or bearish FVG is resolved after meeting the threshold and turning gray.
Execution Timing: A notification will only be sent when the candlestick is confirmed. It will not be triggered if the candlestick is only momentarily touched by the wick midway through the candlestick. This allows you to know for sure that the event was resolved at the time of closing.
インジケーター解説:FVG MTF 確定足トラッカー
このインジケーターは、現在表示している足、または上位足(MTF)のFVGを特定し、その「解消」をローソク足の確定時に判定する高機能ツールです。
最大の特徴は、**「一定期間意識され続けた重要な水準」**が解消された時のみ、チャートに履歴(グレー)を残し、アラートを通知する設計にあります。
1. Timeframe Settings(時間足設定)
Base Timeframe / 基準にする時間足: FVGを検知する時間足を選択します。「Same as chart(チャートと同じ)」を選べば現在の足、それ以外(1時間足、4時間足など)を選べば上位足のFVGを現在のチャートに投影します。
2. Active FVG Settings(未解消時の設定ロジック)
まだ価格に埋められていない、現在有効なサポート・レジスタンス領域の設定です。
Show Bull / Bear: ブル(買い)およびベア(売り)のFVGを表示するかどうかを個別に切り替えます。
Color: 未解消状態のボックスの色を指定します。
Extend Right (Active): 有効にすると、FVGが解消されるまでボックスをチャートの右端に向かって無制限に延長し続けます。
Max Active FVG: チャート上に表示する未解消ボックスの最大数です。新しいFVGが検知された際、この上限を超えていると最も古い未解消ボックスが自動的に削除され、リソースを節約します。
3. Filled FVG Settings(解消済み・グレー化・判定本数ロジック)
価格がFVGを埋めた際の、履歴表示に関する非常に重要な設定項目です。
Show Filled: 解消されたFVGを「履歴」としてグレー表示(デフォルト色)で残すかどうかを選択します。
Color: 解消済み(Filled)状態になったボックスの色を指定します。
Extend Right (Filled): これをOFFにすると、解消が確定したローソク足の位置でボックスの延長が止まり、解消地点が明確になります。
Max Filled FVG: 履歴として残すグレーボックスの最大数です。上限に達すると、古い履歴から順に削除されます。
Min Bars to Keep & Alert (重要): FVGが発生してから解消されるまでの「経過本数」の閾値です。
判定本数に満たない場合: 一時的な反応とみなし、アラートを鳴らさず、履歴(グレー)にも残さず削除します。
判定本数以上の場合: 市場で十分に意識された「重要な水準」とみなし、ボックスをグレーに変更し、アラートを通知します。
4. Alert Settings(アラート通知ロジック)
アラートは「重要水準の解消(グレー化)」と完全に同期して実行されます。
Alert when Bull / Bear turns Grey: ブル/ベアそれぞれのFVGが、上記の「判定本数」を満たした状態で解消され、グレーに変化した瞬間に通知を送ります。
実行タイミング: ローソク足の確定時にのみ通知されます。足の途中のヒゲで一時的に触れただけでは鳴りません。これにより、クローズ時点で確実に解消されたことのみを把握できます。

BuLLzEyE_MNQ FVG/IFVG SystemFVG Boxes
These are the main trading zones. The indicator automatically detects Fair Value Gaps and draws boxes on your chart:
• GREEN boxes = Bullish FVG (potential buy zone)
• RED boxes = Bearish FVG (potential sell zone)
• YELLOW boxes = IFVG (Inverse FVG - filled gaps that now act as support/resistance)
• GRAY boxes = Mitigated FVG (gap has been filled)
• WHITE dashed line = 50% level (optimal entry point within the FVG)
Session Boxes
Session boxes show you the high/low range of each major trading session. This helps identify where liquidity sits:
• PURPLE = Asia Session (6:00 PM - 3:00 AM ET)
• BLUE = London Session (3:00 AM - 12:00 PM ET)
• ORANGE = New York Session (9:30 AM - 4:00 PM ET)
• TEAL = Sydney Session (5:00 PM - 2:00 AM ET)
• LIME GREEN = Kill Zone / London-NY Overlap (8:00 AM - 11:00 AM ET) - BEST TRADING TIME
Entry Signals
• GREEN triangle pointing UP = Long entry signal at a Bullish FVG (not 100% reliable)
• RED triangle pointing DOWN = Short entry signal at a Bearish FVG (not 100% reliable)
Liquidity Sweeps
• RED X with 'SWEEP' = Previous Day High (PDH) was swept
• GREEN X with 'SWEEP' = Previous Day Low (PDL) was swept
• Dotted lines = PDH (red) and PDL (green) levels
Information Tables
HTF Bias Table (Top Right): Shows whether the higher timeframe (default 15m) is bullish or bearish, the number of active FVGs, and whether you're in the trading session.
Risk Calculator Table (Bottom Right): Shows your risk amount and calculates how many contracts you can trade for different stop loss sizes (5pt, 10pt, 15pt).
How It Works
What is a Fair Value Gap?
A Fair Value Gap (FVG) is a 3-candle pattern where aggressive buying or selling creates a price void. Specifically, it's when the wick of the first candle doesn't overlap with the wick of the third candle, leaving a gap in between. Price tends to return to these gaps to 'rebalance' before continuing in the original direction.
What is an Inverse FVG?
When an FVG gets filled (price returns and closes through the gap), it becomes an Inverse FVG (IFVG). These zones flip their polarity - a filled Bullish FVG becomes resistance, and a filled Bearish FVG becomes support. The indicator automatically converts mitigated FVGs to yellow IFVG boxes.
The 50% Entry Level
The dashed white line in each FVG represents the 50% level (also called Consequent Encroachment). This is considered the optimal entry point - it's the middle of the imbalance where price is most likely to react.
Suggested Trading Strategy
1. Check HTF Bias (top right table) - only trade in that direction
2. Wait for a liquidity sweep (SWEEP label appears)
3. Look for an FVG to form AFTER the sweep
4. Enter when price returns to the 50% level (dashed line)
5. Place stop loss below/above the FVG (add 2 ticks buffer)
6. Take profit at 1:2 or 1:3 risk-to-reward ratio
Settings Explained
FVG Settings
• Min FVG Size: Minimum gap size in points to be considered valid (default: 2.0)
• Max FVG Age: How many bars until an FVG is removed from chart (default: 50)
• Show 50% Entry Level: Toggle the dashed entry line on/off
Session Settings
• Show Session Boxes: Toggle all session boxes on/off
• Max Sessions to Show: How many historical sessions to display (default: 5)
• Individual Session Toggles: Turn each session (Asia/London/NY/Sydney/Kill Zone) on or off
Risk Calculator Settings
• Account Size: Your trading account balance
• Risk Per Trade: Percentage of account to risk per trade (default: 0.5%)
• Tick Value/Size: Contract specifications for MNQ ($0.50 per tick, 0.25 point tick size)
Tips for Best Results
1. Trade during the Kill Zone (8:00-11:00 AM ET) for best volatility and liquidity
2. Always align trades with HTF bias - don't fight the trend
3. Wait for liquidity sweeps before entering - this confirms smart money activity
4. Use the 50% level for entries - it offers the best risk-to-reward
5. Watch for IFVG zones as additional confluence for entries
6. Use the risk calculator to size positions properly - never risk more than you can afford
7. Session boxes help identify where stops are clustered - sweeps of these levels often precede reversals
Available Alerts
• New FVG Formed (Bullish or Bearish)
• Price Touching 50% Entry Level
• FVG Mitigated (gap filled)
• Long Entry Signal
• Short Entry Signal
• PDH/PDL Liquidity Sweep
─────────────────────────────────────
Created by BullyTrading
Designed for MNQ Prop Firm Trading

FVG Radar [Mr_Rakun]The FVG Radar indicator is designed to automatically detect Fair Value Gaps (FVG) on your TradingView chart. It visually highlights bullish and bearish gaps with colored boxes and provides alerts when specific conditions are met.
How It Works
Fair Value Gap (FVG) Detection:
The script identifies gaps based on previous price action. A bullish FVG is recognized when there is a gap below a higher low candle, and a bearish FVG when there is a gap above a lower high candle.
Radar Area:
A yellow “Radar Area” box is drawn on the chart using upper and lower bands defined as a percentage above and below the current price. This area helps you visualize where the price is relative to these bands.
Alerts:
Alerts are triggered based on user-defined conditions:
When price crosses half of the gap (if the "Clear FVG When Price Reaches Half" option is enabled).
When price fully fills the gap (if the option is disabled).
The alert will only be activated after waiting a specified number of bars post-gap formation (as set by the "Wait X Bars After FVG Formation" parameter).
Input Parameters
Radar Upper Band (%):
Sets the upper threshold percentage relative to the current price for the radar area.
Radar Lower Band (%):
Sets the lower threshold percentage relative to the current price for the radar area.
Minimum FVG Size (%):
Determines the minimum size (as a percentage) for a gap to be recognized as a valid FVG.
Clear FVG When Price Reaches Half:
If enabled, the FVG will be cleared when the price reaches the midpoint of the gap. If disabled, the entire gap must be filled before it is cleared.
Wait X Bars After FVG Formation:
Specifies the number of bars to wait after an FVG is detected before triggering an alert. This delay helps to avoid premature alerts.
Bullish and Bearish FVG Colors and Opacity:
Customize the appearance of the FVG boxes for bullish (green) and bearish (red) gaps, including the opacity of these visual elements.
How to Use
Add the Indicator:
Load the FVG Radar indicator on your TradingView chart.
Customize Settings:
Adjust the input parameters based on your trading style and the market’s volatility. The radar area settings help you set your own visual reference for price deviations.
Monitor the Chart:
Watch for the colored boxes that represent FVGs. The boxes will display the size of the gap as a percentage.
Respond to Alerts:
When an alert is triggered after the specified number of bars, it indicates that the price has interacted with the gap. Use this information to guide your trading decisions.
Türkçe --------------------------------------------
FVG Radar göstergesi, TradingView grafiğinizde Fair Value Gap (FVG) – yani adil değer boşluklarını – otomatik olarak tespit etmek için tasarlanmıştır. Bu boşluklar, yükseliş ve düşüş boşluklarını farklı renkli kutularla vurgular ve belirli koşullar sağlandığında uyarılar verir.
Nasıl Çalışır
Fair Value Gap (FVG) Tespiti:
Gösterge, önceki fiyat hareketlerine dayalı olarak boşlukları belirler. Yükseliş boşluğu, düşük seviyenin yukarıdaki mumun altındaki boşlukla oluştuğu durumlarda; düşüş boşluğu ise, yüksek seviyenin aşağıdaki mumun üstünde boşluk oluştuğunda tespit edilir.
Radar Alanı:
Grafikte, mevcut fiyata göre belirlenen üst ve alt yüzde bantlarına dayalı olarak sarı renkte “Radar Alanı” kutusu çizilir. Bu alan, fiyatın bu bantlara göre nerede olduğunu görsel olarak anlamanıza yardımcı olur.
Uyarılar:
Kullanıcının belirlediği koşullara göre uyarılar verilir:
Fiyat, boşluğun yarısına ulaştığında (eğer "FVG'nin yarısına ulaştığında temizle" seçeneği etkinse).
Fiyat boşluğu tamamen doldurduğunda (seçenek devre dışı bırakıldığında).
Uyarı, boşluk oluşumundan sonra belirlenen bar sayısı kadar bekledikten sonra tetiklenir ("FVG Oluşumundan Sonra X Bar Bekle" parametresi).
Giriş Parametreleri
Radar Upper Band (%):
Mevcut fiyata göre radar alanı için üst eşik yüzdesini ayarlar.
Radar Lower Band (%):
Mevcut fiyata göre radar alanı için alt eşik yüzdesini ayarlar.
Minimum FVG Size (%):
Bir boşluğun geçerli bir FVG olarak tanınabilmesi için gereken minimum boyutu (yüzde olarak) belirler.
FVG'nin yarısına ulaştığında temizle:
Etkinse, fiyat boşluğun orta noktasına ulaştığında boşluk temizlenir. Devre dışı bırakılırsa, boşluğun tamamen doldurulması gerekir.
FVG Oluşumundan Sonra X Bar Bekle:
Bir FVG tespit edildikten sonra uyarı tetiklenmeden önce beklenmesi gereken bar sayısını belirler. Bu gecikme, erken uyarıların önüne geçmeyi amaçlar.
Yükseliş ve Düşüş FVG Renkleri ve Opaklık:
Yükseliş boşlukları (yeşil) ve düşüş boşlukları (kırmızı) için kutuların görünümünü ve opaklığını özelleştirmenize olanak tanır.
Nasıl Kullanılır
Göstergeyi Ekleyin:
FVG Radar göstergesini TradingView grafiğinize ekleyin.
Ayarları Özelleştirin:
Ticaret tarzınıza ve piyasanın oynaklığına göre giriş parametrelerini ayarlayın. Radar alanı ayarları, fiyat sapmalarını kendi görsel referansınızla tanımlamanıza yardımcı olur.
Grafiği İzleyin:
FVG’leri temsil eden renkli kutuları takip edin. Kutular, boşluğun yüzdelik büyüklüğünü gösterecektir.
Uyarılara Tepki Verin:
Belirlenen bar sayısı sonrasında tetiklenen uyarı, fiyatın boşluk ile etkileşime girdiğini gösterir. Bu bilgiyi, ticaret kararlarınızı yönlendirmek için kullanın.

FVG Visual Trading ToolHow to Use the FVG Tool
1. Identify the FVG Zone
Bullish FVG: Look for green boxes that represent potential support zones. These are areas where price is likely to retrace before continuing upward.
Bearish FVG: Look for red boxes that represent potential resistance zones. These are areas where price is likely to retrace before continuing downward.
2. Set Up Your Trade
Entry: Place a limit order at the retracement zone (inside the FVG box). This ensures you enter the trade when the price retraces into the imbalance.
Stop-Loss (SL): Place your stop-loss just below the FVG box for bullish trades or just above the FVG box for bearish trades. The tool provides a suggested SL level.
Take-Profit (TP): Set your take-profit level at a 2:1 risk-reward ratio (or higher). The tool provides a suggested target level.
3. Let the Trade Run
Once your trade is set up, let it play out. Avoid micromanaging the trade unless market conditions change drastically.
Step-by-Step Example
Bullish FVG Trade
Identify the FVG:
A green box appears, indicating a bullish FVG.
The tool provides the target price (e.g., 0.6371) and the stop-loss level (e.g., 0.6339).
Set Up the Trade:
Place a limit buy order at the retracement zone (inside the green box).
Set your stop-loss just below the FVG box (e.g., 0.6339).
Set your take-profit at a 2:1 risk-reward ratio or the suggested target (e.g., 0.6371).
Monitor the Trade:
Wait for the price to retrace into the FVG zone and trigger your limit order.
Let the trade run until it hits the take-profit or stop-loss.
Bearish FVG Trade
Identify the FVG:
A red box appears, indicating a bearish FVG.
The tool provides the target price and the stop-loss level.
Set Up the Trade:
Place a limit sell order at the retracement zone (inside the red box).
Set your stop-loss just above the FVG box.
Set your take-profit at a 2:1 risk-reward ratio or the suggested target.
Monitor the Trade:
Wait for the price to retrace into the FVG zone and trigger your limit order.
Let the trade run until it hits the take-profit or stop-loss.
Key Features of the Tool in Action
Visual Clarity:
The green and red boxes clearly show the FVG zones, making it easy to identify potential trade setups.
Labels provide the target price and stop-loss level for quick decision-making.
Risk-Reward Management:
The tool encourages disciplined trading by providing predefined SL and TP levels.
A 2:1 risk-reward ratio ensures that profitable trades outweigh losses.
Hands-Off Execution:
By placing limit orders, you can let the trade execute automatically without needing to monitor the market constantly.
Best Practices
Trade in the Direction of the Trend:
Use higher timeframes (e.g., 4-hour or daily) to identify the overall trend.
Focus on bullish FVGs in an uptrend and bearish FVGs in a downtrend.
Combine with Confirmation Signals:
Look for additional confirmation, such as candlestick patterns (e.g., engulfing candles) or indicator signals (e.g., RSI, MACD).
Adjust Parameters for Volatility:
For highly volatile markets, consider increasing the stop-loss percentage to avoid being stopped out prematurely.
Avoid Overtrading:
Not every FVG is a good trading opportunity. Be selective and only trade setups that align with your strategy.
Backtest and Optimize:
Use historical data to test the tool and refine your approach before trading live.
Common Mistakes to Avoid
Entering Without Confirmation:
Wait for price to retrace into the FVG zone before entering a trade.
Avoid chasing trades that have already moved away from the zone.
Ignoring Risk Management:
Always use a stop-loss to protect your account.
Stick to a consistent risk-reward ratio.
Trading Against the Trend:
Avoid taking trades that go against the prevailing market trend unless there is strong evidence of a reversal.
Final Thoughts
The FVG Visual Trading Tool is a powerful aid for identifying high-probability trade setups. By following the steps outlined above, you can use the tool to trade with confidence and discipline. Remember, no tool guarantees success, so always combine it with sound trading principles and proper risk management

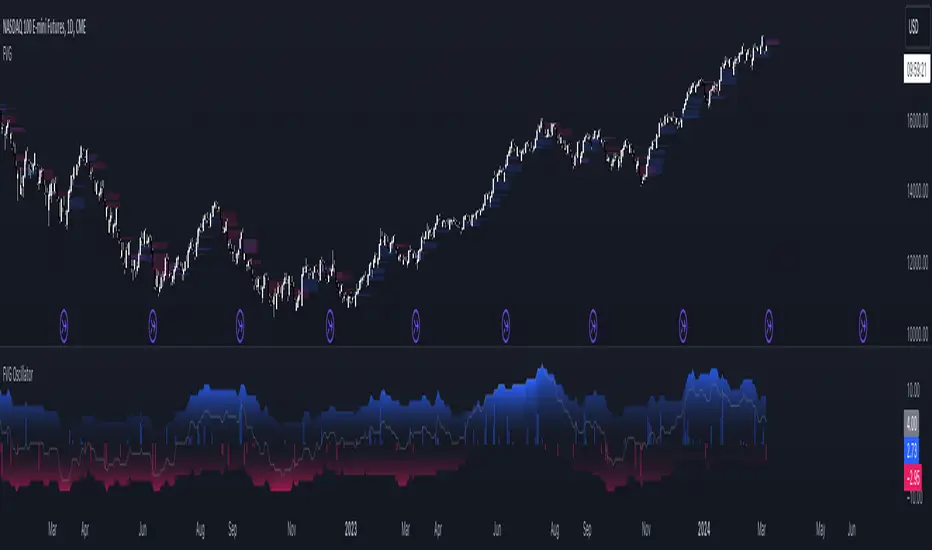
FVG OscillatorThe FVG Oscillator, developed by OmegaTools and available on TradingView, is a specialized analytical tool designed to offer traders insight into the market's potential direction through the lens of Fair Value Gaps (FVGs). This script combines traditional oscillator functionality with a unique focus on FVGs, providing a nuanced approach to understanding market dynamics.
Understanding FVGs and Their Importance:
Fair Value Gaps (FVGs) are identified when there's a discrepancy between the high price of one session and the low of the subsequent session (or vice versa), indicating areas where price movements have skipped over, creating a gap. These gaps often signal potential price movement areas, as markets may move to "fill" these gaps. The FVG Oscillator is designed to quantify these occurrences and their potential impact on market direction.
Key Features of the FVG Oscillator:
- Adjustable Lookback Period: Traders can set the number of bars back (defaulted at 50) to adjust the sensitivity of the oscillator to recent market activity.
- Visual Area Representation: The option to display areas of positive and negative FVG occurrences provides a visual representation of market sentiment over the selected period.
- Color Customisation: Users can personalize the oscillator's appearance with color selections for positive and negative movements, enhancing readability and analysis.
- Volume and ATR Confirmation: Incorporates volume data and Average True Range (ATR) filtering to verify FVG occurrences, adding a layer of validation to the identified gaps.
Operational Mechanism:
The oscillator tallies bullish FVG occurrences as positive values and bearish FVG occurrences as negative values over the specified lookback period. It then applies volume and ATR criteria to confirm the significance of these gaps. The final output is an oscillator line that reflects the net value of bullish versus bearish FVGs, alongside histograms that show the width (or significance) of long and short patterns based on confirmed FVGs.
How to Use the FVG Oscillator:
- After adding the FVG Oscillator to your TradingView chart, adjust the 'Bars Back' input to tailor the oscillator's sensitivity to your trading strategy.
- Use the net value line to gauge the overall market sentiment based on FVG occurrences; a higher net value suggests bullish sentiment, while a lower value indicates bearish sentiment.
- The histograms provide an additional layer of insight, highlighting the relative strength and significance of confirmed bullish and bearish FVGs.
Application in Trading:
The FVG Oscillator is intended as an analytical tool to complement your existing trading strategy. By offering a unique perspective on FVG occurrences and their potential market implications, the oscillator can help inform your trading decisions. However, traders are encouraged to combine this tool with other forms of analysis and employ sound risk management practices.
Originality and Usefulness:
This oscillator is original in its integration of FVG analysis with traditional oscillator metrics, offering traders a novel tool for market analysis. Its usefulness lies in its ability to provide a quantitative and visual representation of FVGs, aiding traders in identifying potential market movements.
Disclaimer:
It is important for traders to understand that the financial markets are inherently unpredictable, and the FVG Oscillator is not a predictive tool nor does it guarantee trading success. It should be used as part of a comprehensive trading strategy, incorporating additional market analysis and risk management practices. Remember, past performance does not necessarily predict future results, and trading involves risks, including the potential loss of capital.
FVG Maxing - Fair Value Gaps, Equilibrium, and Candle Patterns
What this script does
This open-source indicator highlights 3-candle fair value gaps (FVGs) on the active chart timeframe, draws their midpoint ("equilibrium") line, tracks when each gap is mitigated, and optionally marks simple candle patterns (engulfing and doji) for confluence. It is intended as an educational tool to study how price interacts with imbalances.
3-candle bullish and bearish FVG zones drawn as forward-extending boxes.
Equilibrium line at 50% of each gap.
Different styling for mitigated vs unmitigated gaps.
Compact statistics panel showing how many gaps are currently active and filled.
Optional overlays for bullish/bearish engulfing patterns and doji candles.
1. FVG logic (3-candle gaps)
The script focuses on a strict 3-candle definition of a fair value gap:
Three consecutive candles with the same body direction.
The wick of candle 3 is separated from the wick of candle 1 (no overlap).
A bullish gap is created when price moves up fast enough to leave a gap between candle 1 and 3. A bearish gap is the mirror case to the downside.
In Pine, the core detection looks like this:
// Three candles with the same body direction
bull_seq = close > open and close > open and close > open
bear_seq = close < open and close < open and close < open
// Wick gap between candle 1 and candle 3
bull_gap = bull_seq and low > high
bear_gap = bear_seq and high < low
// Final FVG flags
is_bull_fvg = bull_gap
is_bear_fvg = bear_gap
For each detected FVG:
Bullish FVG range: from high up to low (gap below current price).
Bearish FVG range: from low down to high (gap above current price).
Each zone is stored in a custom FVGData structure so it can be updated when price later trades back inside it.
2. Equilibrium line (0.5 of the gap)
Every FVG box gets an optional equilibrium line plotted at the midpoint between its top and bottom:
eq_level = (top + bottom) / 2.0
right_index = extend_boxes ? bar_index + extend_length_bars : bar_index
bx = box.new(bar_index - 2, top, right_index, bottom)
eq_ln = line.new(bar_index - 2, eq_level, right_index, eq_level)
line.set_style(eq_ln, line.style_dashed)
line.set_color(eq_ln, eq_color)
You can use this line as a neutral “fair value” reference inside the zone, or as a simple way to think in terms of premium/discount within each gap.
3. Mitigation rules and styling
Each FVG stays active until price trades back into the gap:
Bullish FVG is considered mitigated when the low touches or moves below the top of the gap.
Bearish FVG is considered mitigated when the high touches or moves above the bottom of the gap.
When that happens, the script:
Marks the internal FVGData entry as mitigated.
Softens the box fill and border colors.
Optionally updates the label text from "BULL EQ / BEAR EQ" to "BULL FILLED / BEAR FILLED".
Can hide mitigated zones almost completely if you only want to see unfilled imbalances.
This allows you to distinguish between current areas of interest and zones that have already been traded through.
4. Candle pattern overlays (engulfing and doji)
For additional confluence, the script can mark simple candle patterns on top of the FVG view:
Bullish engulfing — current candle body fully wraps the previous bearish body and is larger in size.
Bearish engulfing — current candle body fully wraps the previous bullish body and is larger in size.
Doji — candles where the real body is small relative to the full range (high–low).
The detection is based on basic body and range geometry:
curr_body = math.abs(close - open)
prev_body = math.abs(close - open )
curr_range = high - low
body_ratio = curr_range > 0 ? curr_body / curr_range : 1.0
bull_engulfing = close > open and close < open and open <= close and close >= open and curr_body > prev_body
bear_engulfing = close < open and close > open and open >= close and close <= open and curr_body > prev_body
is_doji = curr_range > 0 and body_ratio <= doji_body_ratio
On the chart, they appear as:
Small triangle markers below bullish engulfing candles.
Small triangle markers above bearish engulfing candles.
Small circles above doji candles.
All three overlays are optional and can be turned on or off and recolored in the CANDLE PATTERNS group of inputs.
5. Inputs overview
The script organizes settings into clear groups:
DISPLAY SETTINGS : Show bullish/bearish FVGs, show/hide mitigated zones, box extension length, box border width, and maximum number of boxes.
EQUILIBRIUM : Toggle equilibrium lines, color, and line width.
LABELS : Enable labels, choose whether to label unmitigated and/or mitigated zones, and select label size.
BULLISH COLORS / BEARISH COLORS : Separate fill and border colors for bullish and bearish gaps.
MITIGATED STYLE : Opacity used when a gap is marked as mitigated.
STATISTICS : Toggle the on-chart FVG statistics panel.
CANDLE PATTERNS : Show engulfing patterns, show dojis, colors, and the body-to-range threshold that defines a doji.
6. Statistics panel
An optional table in the corner of the chart summarizes the current state of all tracked gaps:
Total number of FVGs still being tracked.
Number of bullish vs bearish FVGs.
Number of unfilled vs mitigated FVGs.
Simple fill rate: percentage of tracked FVGs that have been marked as mitigated.
This can help you study how a particular market tends to treat gaps over time.
7. How you might use it (examples)
These are usage ideas only, not recommendations:
Study how often your symbol mitigates gaps and where inside the zone price tends to react.
Use higher-timeframe context and then refine entries near the equilibrium line on your trading timeframe.
Combine FVG zones with basic candle patterns (engulfing/doji) as an extra visual anchor, if that fits your process.
Hope you enjoy, give your feedback in the comments!
- officialjackofalltrades

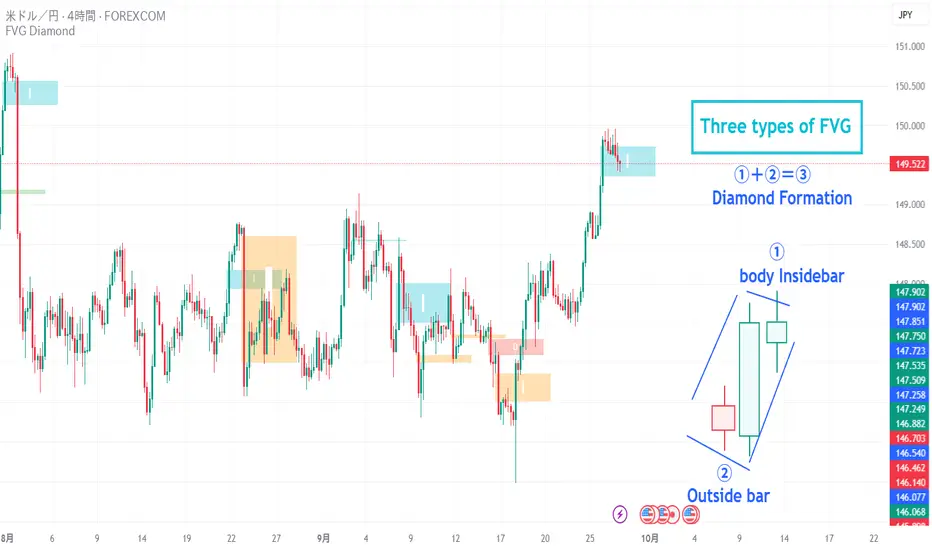
FVG Diamond📊 Overview
FVG Diamond is an advanced indicator that detects three specific price action patterns: Inside Bar, Outside Bar, and Diamond Formation. Unlike basic FVG tools, it focuses on these higher-level setups for more precise analysis.
✨ Key Features
🎯 Detection of 3 Advanced FVG Pattern Types
Independent on/off toggle for each pattern
Inside FVG (Inside Bar / Harami): The body of the 3rd candle forms an inside bar relative to the 2nd candle
Outside FVG (Outside Bar / Engulfing): The body of the 1st candle forms an outside bar relative to the 2nd candle
Diamond FVG (Diamond Formation): A unique pattern that satisfies both Inside and Outside conditions
🎯 Mitigation Feature
ON: FVG boxes are automatically removed once price fully fills the FVG zone (keeps the chart clean by showing only active FVGs)
OFF: FVG boxes remain on the chart indefinitely (allows full historical review of all FVGs)
🎨 Visual Features
Color Coding: Assign unique colors to each pattern type
Transparency Control: Default 70% transparency for optimal readability
Extension Display: Extend the right edge of FVG boxes for any number of bars
⚙️ Advanced Configuration
Threshold Settings
Manual Threshold: Define a minimum gap size by percentage
Auto Threshold: Dynamically adjusts based on market volatility
Mitigation Tools
Real-Time Mitigation: Automatic removal when price fills an FVG zone
Mitigation Levels: Display filled FVG levels with dashed lines
🔔 Alerts
Notification on new Bullish/Bearish FVG detection
Notification when an FVG is mitigated (filled)
Works with all FVG types
📈 How to Use
Add the indicator to your chart
The three advanced FVG patterns will be detected and displayed automatically
Set your preferred threshold (0% = detect all gaps)
⚠️ Note: This indicator is designed as an analysis support tool. Trading decisions should be made in combination with other methods of technical and fundamental analysis.
Author: omochi_
Version: 1.0
Last Updated: September 28, 2025
FVG Breakout Lite by tradingbauhausExplanation of "FVG Breakout Lite by tradingbauhaus"
This script is a trading strategy built for TradingView that helps you spot and trade "Fair Value Gaps" (FVGs)—price areas where the market moved quickly, leaving a gap that might act as support or resistance later. It’s designed to catch breakout opportunities when the price moves strongly in one direction, with extra filters to make trades more reliable. Here’s how it works and how you can use it:
What It Does
1. Finds Fair Value Gaps (FVGs):
A "Bullish FVG" happens when the price jumps up quickly, leaving a gap below where it didn’t trade much (e.g., today’s low is higher than the high from two bars ago).
A "Bearish FVG" is the opposite: the price drops fast, leaving a gap above (e.g., today’s high is lower than the low from two bars ago).
The script draws colored boxes on your chart to show these gaps: green for bullish, red for bearish.
2. Spots Breakouts:
It looks for "strong" FVGs by comparing them to a trend (based on the highest highs and lowest lows over a set period).
If a bullish gap forms above the recent highs, or a bearish gap below the recent lows, it’s marked as a breakout opportunity.
3. Adds a Volume Check:
Trades only happen if the market’s volume is higher than usual (e.g., 1.2x the average volume over the last 20 bars). This helps ensure the breakout has real momentum behind it.
4. Trades Automatically:
Long Trades (Buy): If a bullish breakout FVG forms and volume is high, it buys at the current price.
Short Trades (Sell): If a bearish breakout FVG forms with high volume, it sells short.
Each trade comes with a stop loss (to limit losses) and a take profit (to lock in gains), both adjustable by you.
5. Shows Mitigation Lines (Optional):
If you turn on "Display Mitigation Zones," it draws lines at the edge of each breakout FVG. These lines show where the price might return to "fill" the gap later, helping you see key levels.
6. Includes Webull Costs:
The script factors in real trading fees from Webull, like tiny SEC and FINRA fees for selling, and a daily margin cost if you’re borrowing money to trade. These don’t show up on the chart but affect the strategy’s performance in backtesting.
How to Use It
1. Add to Your Chart:
Copy the script into TradingView’s Pine Editor, click "Add to Chart," and it’ll start drawing FVGs and running the strategy.
2. Customize Settings:
Trend Period (Default: 25): How many bars it looks back to define the trend. Longer periods mean fewer but stronger signals.
Volume Lookback (Default: 20) & Volume Threshold (Default: 1.2): Adjust how it measures "high volume." Increase the threshold for stricter trades.
Stop Loss % (Default: 1.5%) & Take Profit % (Default: 3%): Set how much you’re willing to lose or aim to gain per trade.
Margin Rate % (Default: 8.74%): Webull’s rate for borrowing money—lower it if your account qualifies for a better rate.
Display Mitigation Zones (Default: On): Toggle this to see or hide the gap lines.
Colors: Change the green (bullish) and red (bearish) shades to suit your chart.
3. Backtest It:
Go to the "Strategy Tester" tab in TradingView to see how it performs on past data. It’ll show trades, profits, losses, and Webull fees included.
4. Watch It Work:
Green boxes mean bullish FVGs; red boxes mean bearish FVGs. If volume spikes and the price breaks out, you’ll see trades happen automatically.
What to Expect
Visuals: You’ll see colored boxes for FVGs and optional lines showing where they start. These help you spot key price zones even if you’re not trading.
Trades: It’s selective—only trades when FVGs align with a breakout and volume confirms it. Expect fewer trades but with higher potential.
Risk: The stop loss keeps losses in check, while the take profit aims for a 2:1 reward-to-risk ratio by default (3% gain vs. 1.5% loss).
Costs: Webull’s fees are small but baked into the results, so you’re seeing a realistic picture of profits.
Tips for Users
Test it on a small timeframe (like 5-minute charts) for day trading or a larger one (like daily) for swing trading.
Play with the volume threshold—if you get too few trades, lower it (e.g., 1.1); if too many, raise it (e.g., 1.5).
Watch how price reacts to the mitigation lines—they’re often support or resistance zones traders target.
This strategy is lightweight, focused, and built for traders who like breakouts with a bit of confirmation. It’s not foolproof (no strategy is!), but it gives you a clear way to trade FVGs with some smart filters.

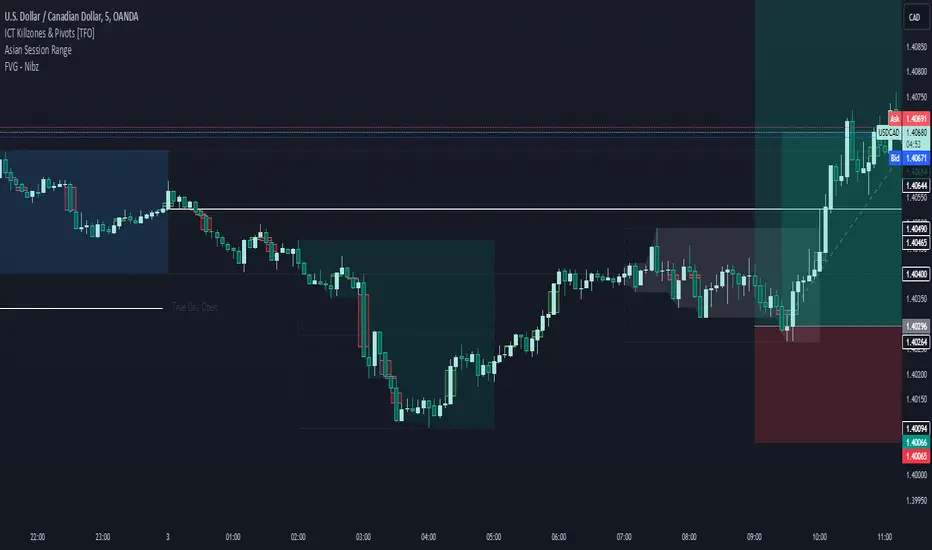
FVG - NibzDescription: Fair Value Gap (FVG) Indicator - Nibz
This Pine Script identifies and visualizes Fair Value Gaps (FVGs) on your TradingView chart. FVGs are price inefficiencies left behind when the market moves too quickly, skipping price levels that might not be tested. These gaps often act as magnets, attracting price for potential reversals or continuations.
The script works by detecting upward (bullish) and downward (bearish) price imbalances based on specific candlestick criteria and then marks these zones on your chart using customizable shaded boxes. This tool is essential for traders looking to identify key areas of market inefficiency that could signify support/resistance levels, potential reversal zones, or areas to monitor for market rebalancing.
How It Works
1. Bullish FVG Detection
The script identifies an upward imbalance when:
The low of the candlestick two bars back is less than or equal to the open of the previous bar.
The high of the current candlestick is greater than or equal to the close of the previous bar.
When this condition is met and the size of the imbalance is greater than zero, a green box is drawn from the low of the second candlestick back to the high of the current candlestick.
2. Bearish FVG Detection
The script identifies a downward imbalance when:
The high of the candlestick two bars back is greater than or equal to the open of the previous bar.
The low of the current candlestick is less than or equal to the close of the previous bar.
When this condition is met and the size of the imbalance is greater than zero, a red box is drawn from the low of the current candlestick to the high of the second candlestick back.
Customization Options
This script is highly customizable, allowing you to tailor the appearance of the FVG boxes to suit your trading style and chart aesthetics:
Bullish FVG:
Fill color and transparency.
Border color and transparency.
Bearish FVG:
Fill color and transparency.
Border color and transparency.
The settings are user-friendly, with intuitive sliders for transparency and color pickers for customization.
How to Use the Indicator
Adding the Script:
Add the indicator to your chart, and it will automatically mark bullish (green) and bearish (red) FVGs.
Interpreting FVGs:
Bullish FVGs (green zones): These often act as support or areas of potential price rebalancing on retracement.
Bearish FVGs (red zones): These often act as resistance or areas of interest for short entries.
Trade Ideas:
Use FVG zones to confirm other trade signals or strategies.
Watch for price interaction with these zones to time entries and exits.
Key Features
Automated detection of Fair Value Gaps.
Customizable visual representation to match your chart preferences.
Enhances trading precision by identifying price inefficiencies.
Suitable for scalping, day trading, or swing trading strategies.
This script provides a powerful tool to highlight important price levels and inefficiencies in the market, enabling traders to make informed decisions. Whether you're using it as a standalone indicator or combining it with other tools, the 'FVG - Nibz' indicator is a valuable addition to any trader's toolkit!