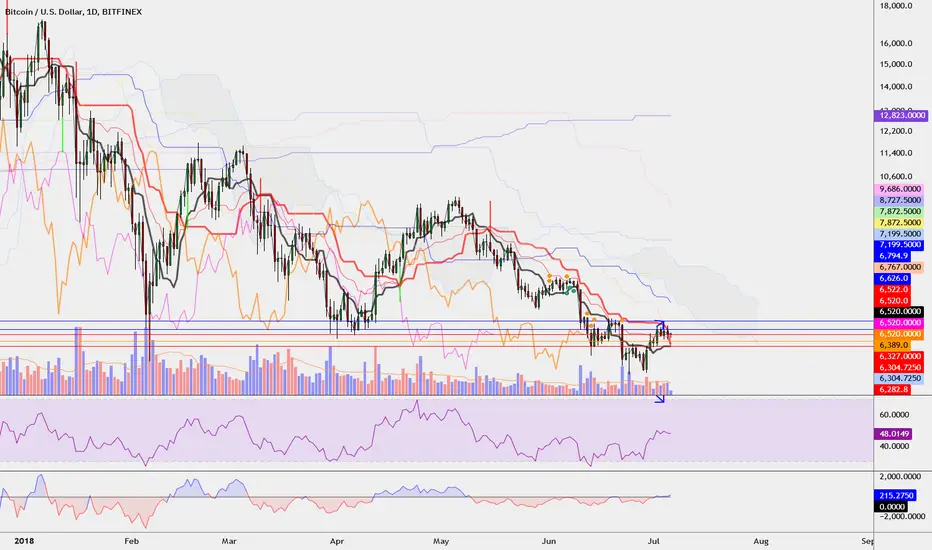
Covengers Ichimoku Cloud Easy 0.1
This is Covengers Ichimoku Cloud's EASY VERSION.
This is for you who don't know about Ichimoku,
to describe "Time tiktok & Price tiktok Trading".
☆Time tiktok & Price tiktok Trading☆
IF 1. DON'T CARE ABOUT LOWEST PRICE.
IF 2. DON'T CARD ABOUT HIGHER PRICE.
BUY IF 1. IS "CLOSE" BROKE THROUGH BASE LINE?
BUY IF 2. IS "CLOSE " SUPPORTED BY BASE LINE?
-> THEN BUY !
At this time, Base line should be STOP LOSS line.
SELL IF 1. IS "CLOSE" BROKE THROUGH BASE LINE?
SELL IF 2. IS "CLOSE" RESISTED BY BASE LINE?
SELL IF 3. IS "CLOSE" BROKE THROUGH ICHIMOKU CLOUD?
-> THEN SELL !
Buy conservatively, Sell aggressively.
"less LOSS" better than "much PROFIT"
-
Covengers Ichimoku Cloud의 EASY 버전입니다.
차트를 하나도 모르는 당신에게
임운자재를 설명하기 위해 만들었습니다.
☆임운자재 매매법☆
절대 조건 1. 바닥에는 관심을 두지 않는다.
절대 조건 2. 천장에는 관심을 두지 않는다.
매수 조건 1. 종가가 기준선을 돌파하였는가?
매수 조건 2. 종가가 기준선의 지지를 받는가?
-> 매수
이 때, 손절라인은 기준선이 된다.
매도 조건 1. 종가가 기준선을 돌파하였는가?
-> 매도
매도 조건 2. 종가가 기준선의 저항을 받는가?
-> 매도
매도 조건 3. 종가가 구름대를 돌파하였는가?
-> 매도
매수는 보수적으로, 매도는 공격적으로.
많이 따는 것보다, 잃지 않는 것이 중요하다.
ابحث في النصوص البرمجية عن "ichimoku"
Crypto IchimokuIchimoku Cloud with settings recommended for crypto by trader IAmSatoshi. Includes a handy checkbox to double inputs, and alerts that can be set for when the price crosses the bottom or top of the cloud.
This script also includes an ichimoku signal count. The signal count is an UNWEIGHTED sum of positive or negative ichimoku signals with the greatest total being shown in either green(long>short) or red(short>long) or white(0, long==short). The signal count is only shown when their is a new signal or a signal is no longer valid.
If you use a major portion of the code please cite me. If you like the script and make a bunch of money using it, feel free to donate using the crypto addresses below.
BTC: 34uVepgjGJAKqf9i3mfdq8AG1dzTthjCgb
ETH: 0x71B15Beb6AF985853B5fC80205ddb3595C51B63e
LTC: MVzvSu53K5qPfjiQn4nk9D6WVLJKCMzXHJ
DASH: XoKVDBnhiyPvJeyRdpHjcWu1WtVjCbhP68
XMR: 46jnYGp7v5vCSAV8pzGXPbWM7YFiZNB4eaFCHsezitQ46KM1E6FgPM9ZaYJEfDVk5zdKoPQ7vw27ke34jMxERogvJDQhfQW

Ichimoku BoxIntroducing Ichimoku Box Indicator:
Key Features:
Customizable Box Periods: Adjustable box periods with default settings of 9, 26, and 52.
Shifted Span A and Span B Points: Easily adjustable shifts and colors.
Additional Box Option: Capability to add an extra box for more detailed analysis.
High and Low Markers: Identifies the highest and lowest candle within each box with distinct markers.
Candle Countdown Timer: Displays the remaining candles before a box loses its high or low.
Drag-and-Drop Functionality: Move boxes to any position on the chart with a vertical line.
Automatic Box Drawing: When the indicator is first applied, a vertical line appears on the mouse cursor, and clicking on any point automatically draws the boxes.
How It Works:
The indicator allows users to visualize Ichimoku periods as boxes, highlighting key price levels and shifts in market structure. It simplifies the analysis process by providing visual cues and customizable settings for enhanced flexibility.

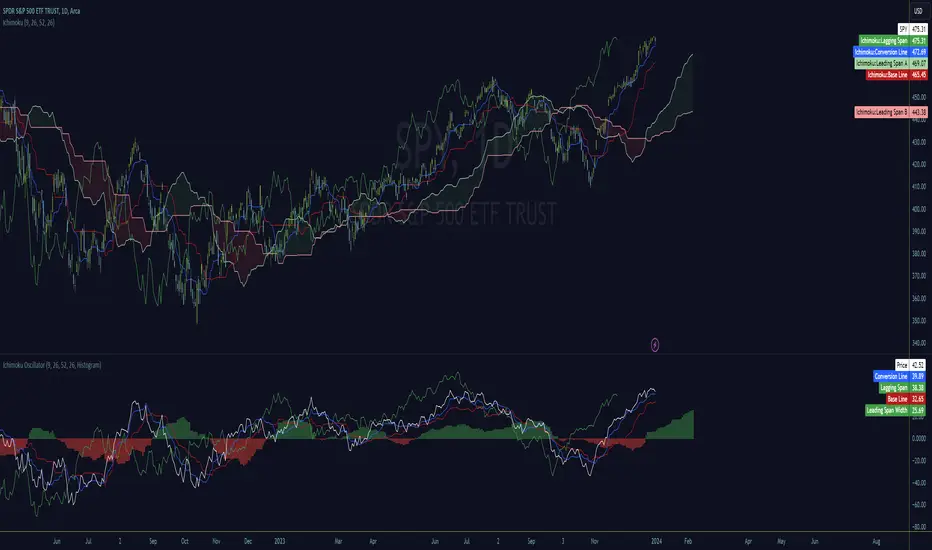
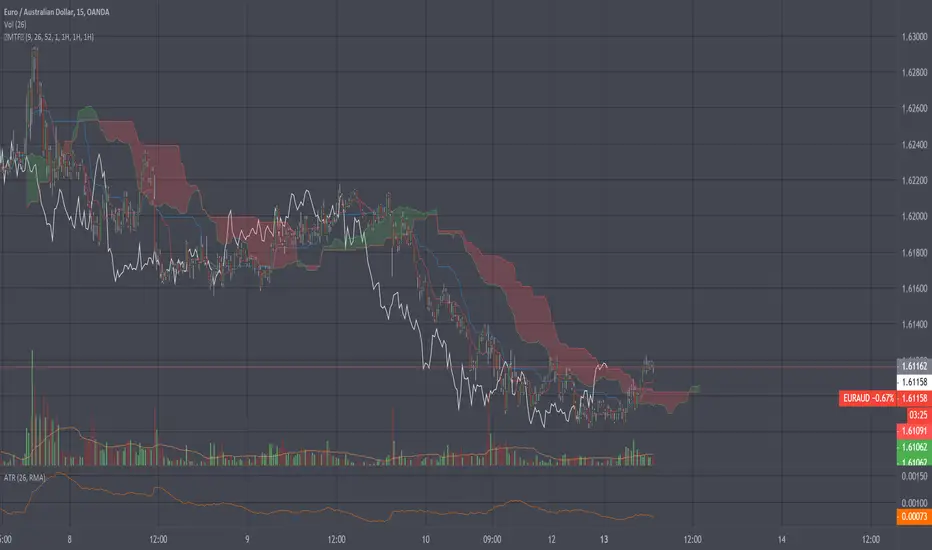
Ichimoku OscillatorHello All,
This is Ichimoku Oscillator that creates different oscillator layers, calculates the trend and possible entry/exit levels by using Ichimoku Cloud features.
There are four layer:
First layer is the distance between closing price and cloud (min or max, depending on the main trend)
Second layer is the distance between Lagging and Cloud X bars ago (X: the displacement)
Third layer is the distance between Conversion and Base lines
Fourth layer is the distance between both Leadlines
If all layers are visible maning that positive according to the main trend, you can take long/short position and when main trend changed then you should close the position. so it doesn't mean you can take position when main trend changed, you need to wait for all other conditions met (all layers(
there is take profit partially option. if Conversion and base lines cross then you can take profit partially. Optionally you can take profit partially when EMA line crosses Fourth layer.
Optionally ATR (average true range) is used for Conversion and baseline for protection from whipsaws. you can use it to stay on the trend longer time.
I added options to enable/disable the alert and customize alert messages. You can change alert messages as you wish. if you use ' close ' in the alert message then you can get closing price in the alert message when the alert was triggered.
There is an option Bounce Off Support/Resistance , if there is trend and if the price bounce off Support/Resistance zone then a tiny triangle is shown.
There are many other options for coloring, alerts etc.
Some screenshots:
Main trend:
Taking/closing positions:
Example alert messages:
Bounce off:
Colors:
Colors:
Colors:
Non-colored background:
P.S. For a few months I haven't published any new script because of some health issues. hope to be healthy and create new scripts in 2024 :)
Enjoy!

Ichimoku OscillatorFans of the Ichimoku cloud indicator may enjoy this lower study version.
It's all the exact same representation but the cloud is converted to an oscillation in histogram or classic cloud fill formats.
All of the original lines, except Kumo cloud lines, are provided but adjusted to be positionally accurate to the oscillation values.
The oscillation value is calculated simply by absolute subtraction of span a and b lines and as such become an additional width detection mechanism in what I consider to be a slightly cleaner display.
Since the entire cloud can be removed from the main chart, it's necessary to understand price location relative to the values which is calculated and displayed as the 'Price' plot. It is positionally accurate to the oscillation and cross signals can be observed.
My hope is that this serves as a foundation for others to create interesting Ichimoku lower study indicators, and to provide relief to traders looking for cleaner main charts.
I've done my best to ensure accuracy but if any issues are found please let me know.
Feedback and suggestions are welcome, enjoy.
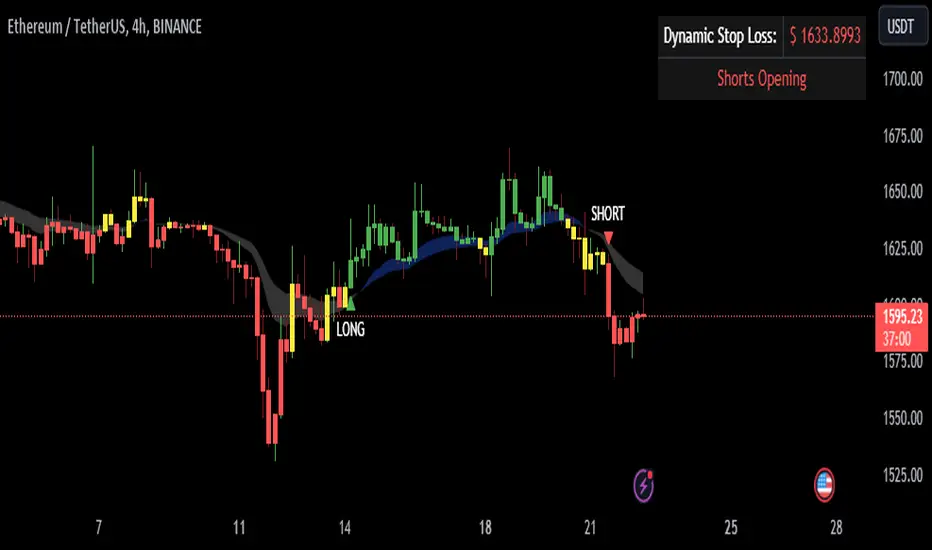
Ichimoku MA BandsThis indicator is based on the price average of the Ichimoku Strategy taking into account the last twenty five bars.
The blue band represents an upward momentum whereas the white band represents a downward momentum.
The red line is the 50 EMA which is used as a dynamic support resistance level for this strategy.
This indicator also has alerts that can be enabled by the user.
Disclaimer :
The current script should be used in confluence with other trading strategies and not in isolation. The scripts works best on 5M and 15M Timeframes and should be used with caution on lower timeframes.
This indicator is not intended to give exact entry or exit points for a trade but to provide a general idea of the trend & determine a good range for entering or exiting the trade. Please DYOR
Credit & References :
This script uses the default technical analysis reference library provided by PineScript (denoted as ta)
Ichimoku Kinko Hyo1) Plot up to 8 moving averages or donchian channels.
2) Moving average types include SMA, EMA, Double EMA, Triple EMA, Quadruple EMA, Pentuple EMA, Zero-Lag EMA, Tillson's T3, Hull's MA, Smoothed MA, Weighted MA, Volume-Weighted MA.
3) Donchian channels can be plotted for a user specified period with upper and lower lines based on either A) highest and lowest prices or B) highest candle body (open/close) and lowest candle body (open/close) over a specified period.
4) Plot 2 arithmetic means averaging any 2 to 8 of the previously mentioned moving averages or donchian median lines.
5) Display 2 fills/clouds between any of the previously mentioned plots.
6) Enough flexibility in the script to utilize Ichimoku Kinko Hyo with correctly adjusted offsets.
7) Ichimoku Kinko Hyo is the default settings. Display additional moving averages or donchian channels for comparison.
"One Half" color scheme by Son A. Pham

Ichimoku CrossThis is a trend analysis indicator based on Ichimoku
this indicator splits the chart into :
"Buy Phase" where KijunSen > TenkanSen with "Green color"
"Sell Phase" where KijunSen < TenkanSen with "Red color"
"Cross Phase" where KijunSen = TenkanSen
Close of each candle above or below KijunSen and TenkanSen determine the strength of the trend
and is shown by 3 different green colors for Bullish Trends and 3 different red colors for Bearish Trends .


Ichimoku Kinko Hyo SignalsIchimoku Kinko Hyo Signals
This script show signals based on my understanding in Ichimoku Kinko Hyo.
/!\ Please do not follow signals blindly and always make your own analysis /!\
Buy : Han Ne lines are up, price is up, and also stochastic (K=30, D=10) is up
Strong Buy : Is a Sanyaku Kouten and can show a potential reverse in current tendance and Buy Signal conditions
Sell : Han Ne lines are down, price is down, and also stochastic (K=30, D=10) is down
Strong Sell : Is a Sanyaku Gyakuten and can show a potential reverse in current tendance and Sell Signal conditions
Exit : Show a potential time to take profit based on previous Sell, Strong Sell, Buy, or Strong Buy signal

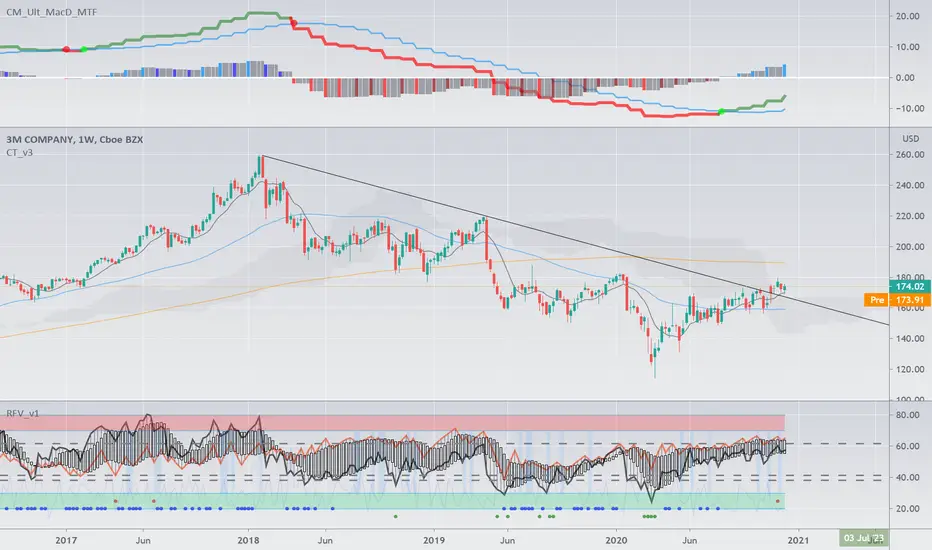
Ichimoku Kinko Hyo and moreI am publishing my updated Ichimoku ++ study with a more suitable title. Future updates will take place with this version.
Description:
The intention of this script is to build/provide a kind of work station / work bench for analysing markets and especially Bitcoin . Another goal is to get maximum market information while maintaining a good chart overview. A chart overloaded with indicators is useless because the structure of the chart is more difficult to see. The chart should be clear and market structure should be easy to see. The script allows you to add indicators and signals in different visualizations to better assess the quality of signals and the sentiment of the market.
A general advise:
Use the included indicators and signals in a confluent way to get stoploss, buy and sell entry points. SR clusters can be identified for use in conjunction with Fractals and other indicators as entry and exit pints. My other scripts can also help. Prefer 4 hours, daily and a longer time frame. There is no "Holy Grail" :).

Ichimoku Candles V1Candles breakout use numbers ichimoku 9 17 26 52 65 129
+ candles up is white
+ candles up is yellow
+ symbol & number 17 ,52, 129 breakout HL zone (the previous candles)
+ symbol & no number breakout HL zone (the previous candles 9 ,26, 65 )
+ xcross top & bottom is 9 , 17
+ triangleup top candles is 26 , 52
+ flag bottom candles is 65 , 129
Best when combined with Ichimoku for Crypto , FX.....
Ichimoku ++ public v0.9Description:
The intention of this script is to build/provide a kind of work station / work bench for analysing markets and especially Bitcoin . Another goal is to get maximum market information while maintaining a good chart overview. A chart overloaded with indicators is useless because it obscures the view of the chart as the most important indicator. The chart should be clear and market structure should be easy to see. In addition, some indicator signals can be activated to better assess the quality of signals from the past. The chart environment or the chart context is important for the quality of a signal.
The intention of this script is not to teach someone how to trade or how to use these Indicators but to provide a tool to analyse markets better and to help to draw conclusions of market behaviour in a higher quality.
A general advise:
Use the included indicators and signals in a confluent way to get stoploss, buy and sell entry points. SR clusters can be identified for use in conjunction with fractals as entry and exit pints. My other scripts can also help. Prefer 4 hours, daily and a longer time frame. There is no "Holy Grail" :).
If someone is new to trading you should learn about the indicators first. Definitely learn about Ichimoku Cloud Indicator.
Integrated indicators are:
Ichimoku Cloud and signals
Parabolic SAR and signal
ATR stop
Bollinger Bands
EMA / SMA and background color as signal
Williams Fractals and signal
Puell Multiple signal

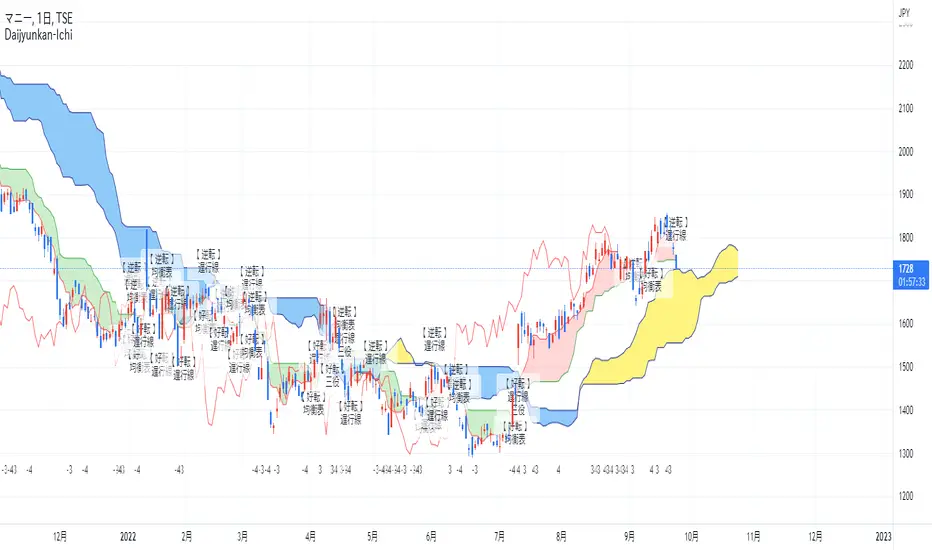
Kojirokousi Daijyunkan Stochastics for Ichimoku-Kinko-HyoKojirokousi Daijyunkan Stochastics
Original indicator by Kojirokousi
Evolution of stochastics
Indicator to use with the Ichimoku-kinko-hyo
Checking each lines of the Ichimoku-kinko-hyo with an oscillator.
小次郎講師 大循環ストキャスティクス for 一目均衡表(大スト for ichi)
小次郎講師によるオリジナルのインジケーター
ストキャスティクスを発展させたもの
一目均衡表と一緒に使うためのインジケーター
一目均衡表の各線をオシレーターで確認する

Kojirokousi Daijyunkan Ichimoku-Kinko-HyoKojirokousi Daijyunkan Ichimoku-Kinko-Hyo
Correct one day gap.
9 levels of rating in relation to each line.
Show rating (4, 3, -3, -4)
Color coding of rating (4, 3, -3, -4)
Ichimoku-Kinko-Hyo for use with Daijyunkan EMA.
Added the wave-line detecting in percent, ATR, price.
Added the Sora (Umi).
小次郎講師 一目均衡表
1日のずれを修正
「三役好転」「三役逆転」の表示
各線の関係で9段階の評価
評価:4,3,ー3,ー4を表示
評価:4,3,ー3,ー4の色分け
大循環EMAと併用するための一目均衡表
%、ATR、価格で検出する波動ラインを実装
空(海)の追加
Best Ichimoku ScreenerHello traders
Continuing deeper and stronger with the screeners' educational series one more time
I - Concept
This screener detects whether the price goes above, below or stays in between the Ichimoku cloud
II - How did I set the screener
The visual signals are as follow:
- square: Above or Below
Then the colors are:
- green when above the cloud
- red when below the cloud
- orange when in the cloud
Best regards,
Dave

Ichimoku Kinkō hyō Keizen 改善
The script is not finnished yet and show's an other interpretation of how it could be scripted
Step -1 is complete... Basic Ichimoku with asjutable length and editable lines colors and visibilities.
Step -2 in progress... Adding ability to une multiple Spans, sens and Kumo on higher and lower timeframe.
Your Step : Like and Share ;) have a good year 2020 !
2020-01-06 /--------/ -R.V.
RSI CANDLE ICHIMOKU v1.0This indicator plots RSI candles with Ichimoku cloud and lines.
So you can get buy or sell signals like Ichimoku strategy system.
Your comments and suggestions will be greatly appreciated.
Good Luck,

Ichimoku Trinh PhatThis is a customized version of Ichimoku Kinko Hyo.
There are two Kijun of last 65 and 129 bars as strong support/resistance levels.
Some vertical lines are added at starting point of Tenkan, Kijun ...

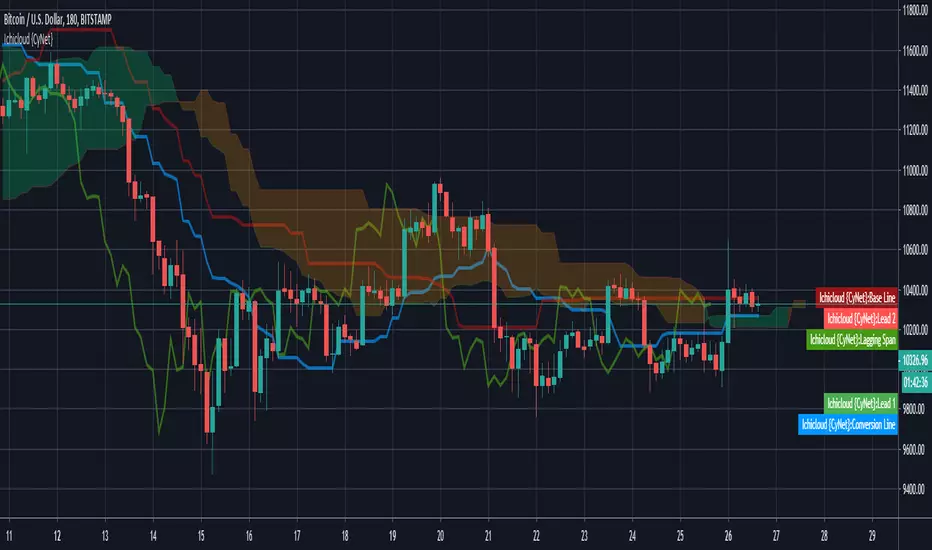
Ichimoku Cloud {Cybernetwork}Ichimoku Cloud with parameters optimized for Crypto.
~ * ~ * ~ * ~ * ~ * ~ * ~ * ~ * ~ * ~ * ~ * ~ * ~ * ~ * ~ * ~ * ~ * ~ * ~ * ~ * ~
Taken from: school.stockcharts.com (Aug 2019)
Bullish Signals:
Price moves above cloud (trend)
Cloud turns from red to green (ebb-flow within trend)
Price Moves above the Base Line (momentum)
Conversion Line moves above Base Line (momentum)
Bearish Signals:
Price moves below cloud (trend)
Cloud turns from green to red (ebb-flow within trend)
Price Moves below Base Line (momentum)
Conversion Line moves below Base Line (momentum)
~ * ~ * ~ * ~ * ~ * ~ * ~ * ~ * ~ * ~ * ~ * ~ * ~ * ~ * ~ * ~ * ~ * ~ * ~ * ~ * ~
Please check out my other indicators sets and series, e.g.
LIVIDITIUM (dynamic levels),
AEONDRIFT (standard deviation bands),
FUSIONGAPS (MA based oscillators),
MAJESTIC (Momentum/Acceleration/Jerk Oscillators),
PRISM (PSAR based oscillator, with RSI/StochRSI as well as Momentum/Acceleration/Jerk indicators),
and more to come.
Constructive feedback and suggestions are welcome.
~ JuniAiko
(=^~^=)v~
Ichimoku Double Cloud + AutoFibCombined indicator using an ichimoku double cloud derivative.
Ideal use is option swings, using traditional ichimoku rules, targets are adjusted to the current ATR.
Appropriate strikes closest to one of these lines for assisted price targeting.
OBV-Ichimoku [by: Bijan Ajdary]This indicator adds Tenkansen and 3 types of Kijunsen and ChikouSpan and Kumo to the OBV chart.
Just like the Ichimoku indicator, only with the difference that, OBV was used instead of the price,
And making it highly efficient for professional traders and Analyzers.
Email: bj.ajdary@gmail.com
Telegram Id: @The_Last_Savior

Ichimoku A/D Breakoutthis is basically a clone of the super a/d indicator but we're using a standard ichimoku as the source for the trend instead of the supertrend indicator
