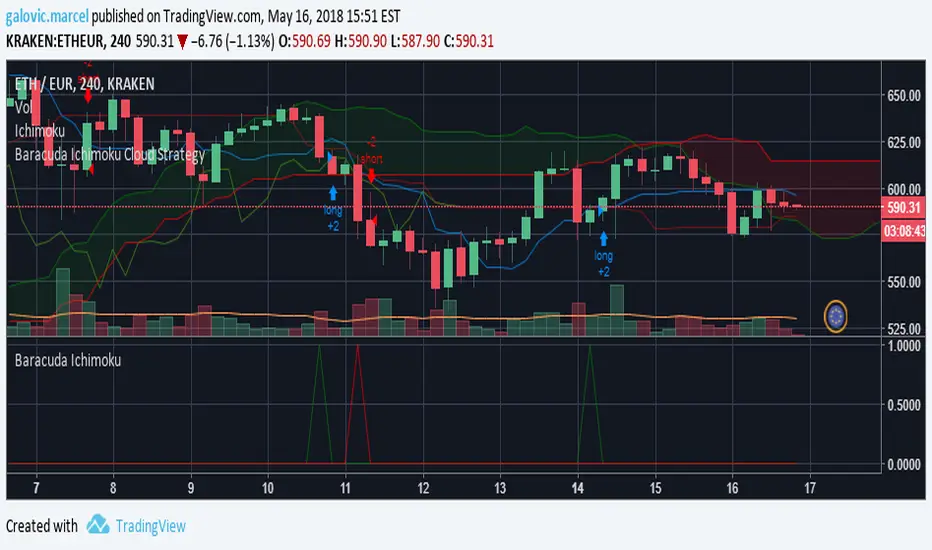
TRADING VIEW INDICATOR - PINE TUTORIAL 5After a long gap, I have written the 5th tutorial for the pine script. You can find the others below, if you read through all of these you should be good to do your own writing.
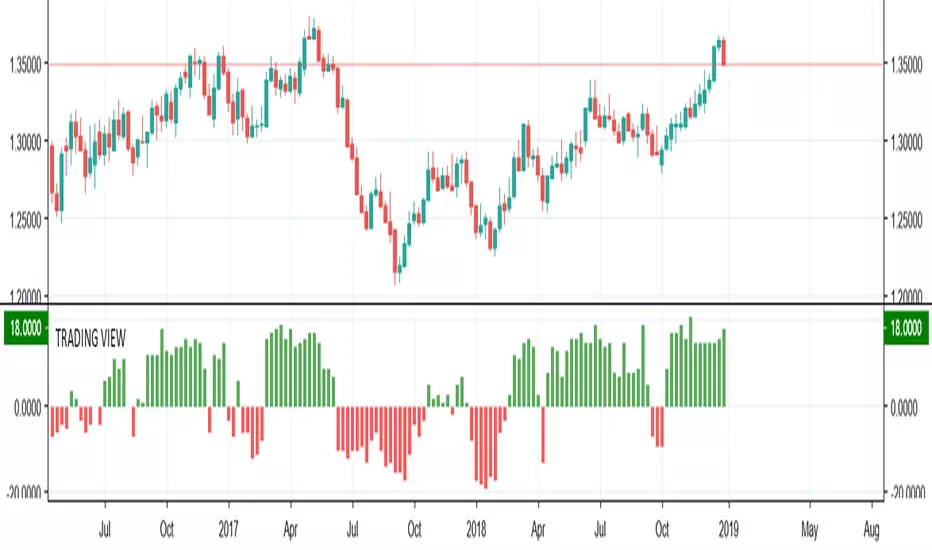
This script mimics the Trading View Indicator . For example this one below.
www.tradingview.com
It shows the net result of the 28 indicator, either as buy or sell. I have worked hard to make sure it matches the trading view results but I am not in hundred percent agreement with tradingView on SMA, EMA and Ichimoku indicator.
There are many commented plots because I needed to check separately if each indicator is working correctly.
Someone else wrote this code but they did not make it public. It took me about 3 weeks to write this and to be honest it could be cleaner and better commented.
If you find any mistake please let me know. I hope it will be useful in your learning.
ابحث في النصوص البرمجية عن "ichimoku"
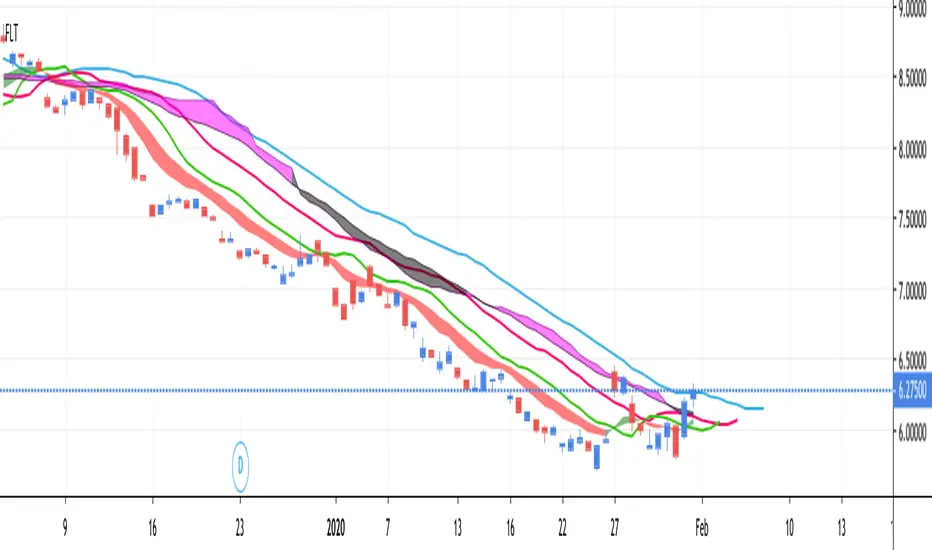
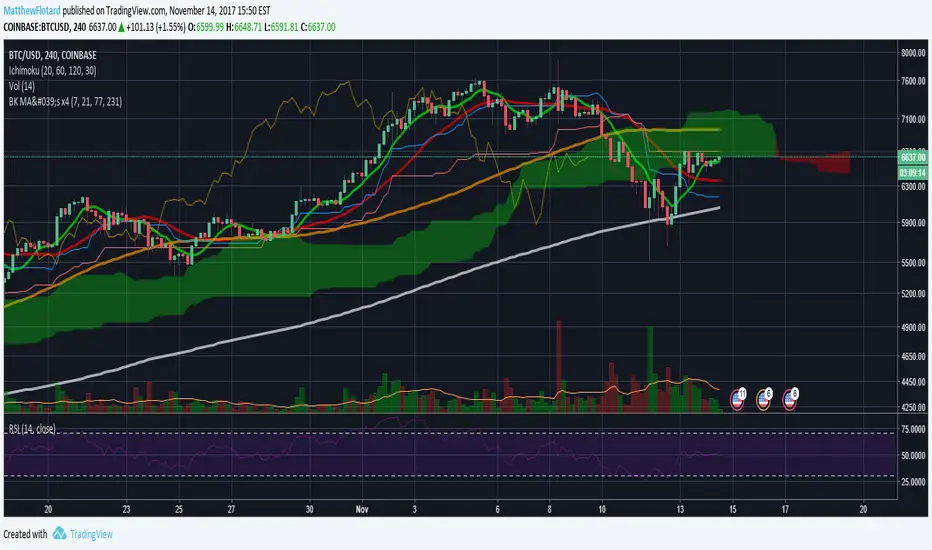
FLT - Fully Loaded TacoThis is a very full indicator.
NOTICE: By default, ALL indicators are turned off in the settings, except for the Bollinger Band, in order to facilitate faster load times.
Features can easily be turned on/off in the settings. You can have as many or as few as you want.
FEATURE LIST:
3 SMAs (Fast, Medium, Slow)
3 EMAs (Fast, Medium, Slow)
Support & Resistance Lines (Lime Color)
Parabolic Support & Resistance (Red dots above, Blue dots below)
Keltner Channel (purple channel lines)
Bollinger Band (Blue Cloud; Center & Borders hidden by default)
TTM Squeeze (Purple Background Color on Chart)
VWAP (Vibrant Blue Glowing Line, Intraday Only)
Fibonacci Retracement (Multicolor, Intraday Only)
Ichimoku Cloud (Standard Colors)

All-In-One EMA Boll Cross SignalsThis one combines many commonly used indicators and signals into one.
1. EMA lines
2. SMA lines
3. Bolling Bands (EMA based)
4. Ichimoku cloud
5. 3/8, 10/20 EMA crosses
6. 5/10 SMA crosses
7. MACD crosses

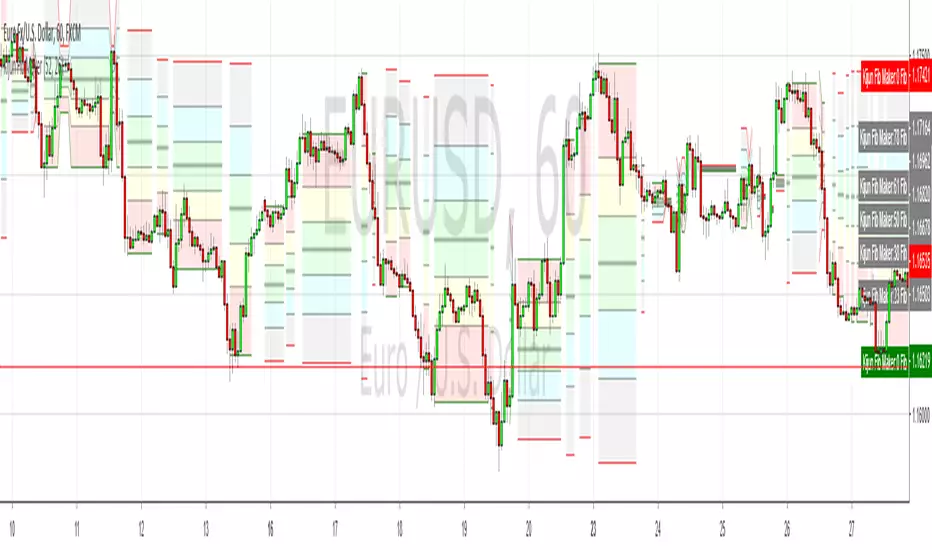
Kijun-based Fib Retracement MakerI noticed a while back that Ichimoku's Kijun line is generally the same as the 50% fib, particular when it's flat, so I coded this to draw fibs from that point. Obviously it draws too many (and maybe someone has a solution for this?) but I think it's a cool idea so here it is
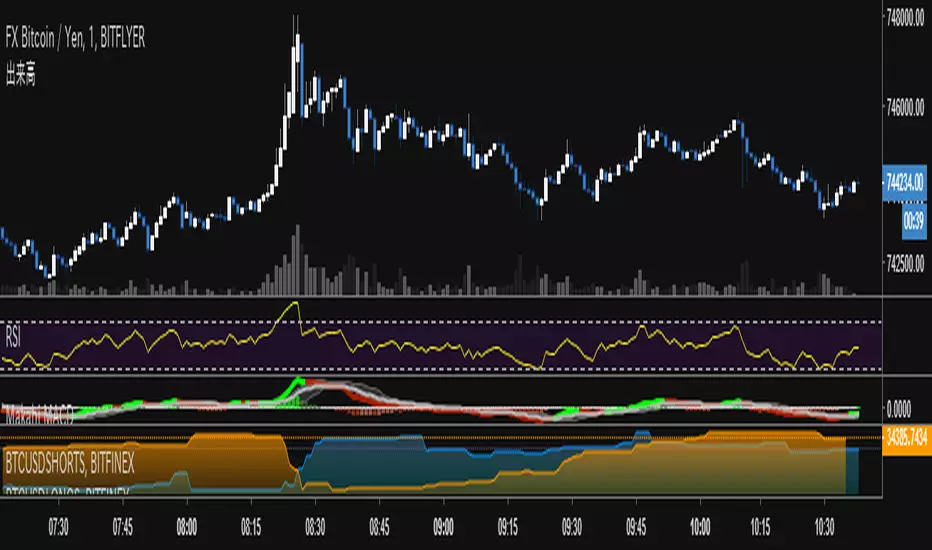
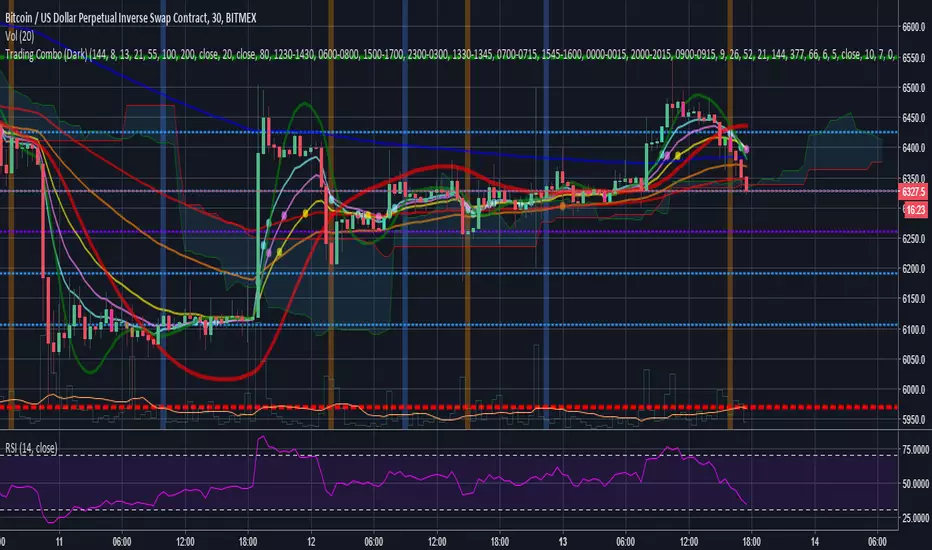
Trading Combo (Dark)This is a combo of many indicators including :
Ichimoku Cloud (With Buy and Sell Signals)
EMA
MA
HULL MA
Fibonacci Lines
Bitcoin 0.57% Kill Zones(Turned off by Default)
MA Turning Points
Reversal(Pin) Bars and Upshaved and Downshaved Bars(Inside and Outside Bars Disabled By default)
Credits to revanchdg for creating the script!
Credits for the source code go to:
Lazybear
ChrisMoody
100kiwi
Gesundheit
Updates:
- Removed all black colors so the script also works fine on the Dark theme
- Changed EMA9 to EMA8 and added EMA13
- Updated some labels for ease of configuration
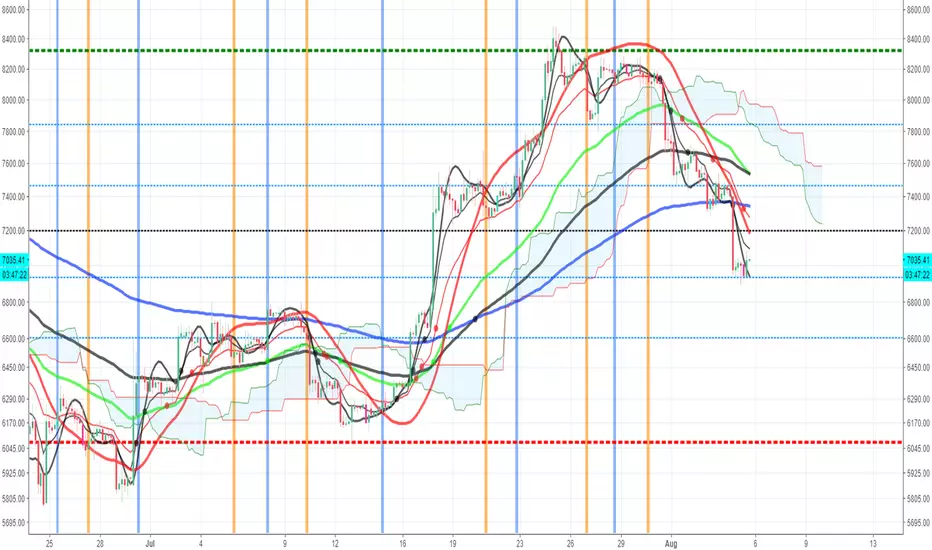
Trading ComboThis is a combo of many indicators including :
Ichimoku Cloud(With Buy and Sell Signals)
EMA
MA
HULL MA
Fibonacci Lines
Bitcoin Kill Zones(Turned off by Default)
MA Turning Points
Reversal(Pin) Bars and Upshaved and Downshaved Bars(Inside and Outside Bars Disabled By default)
Credits to for the source code:
Lazybear
ChrisMoody
100kiwi
Gesundheit
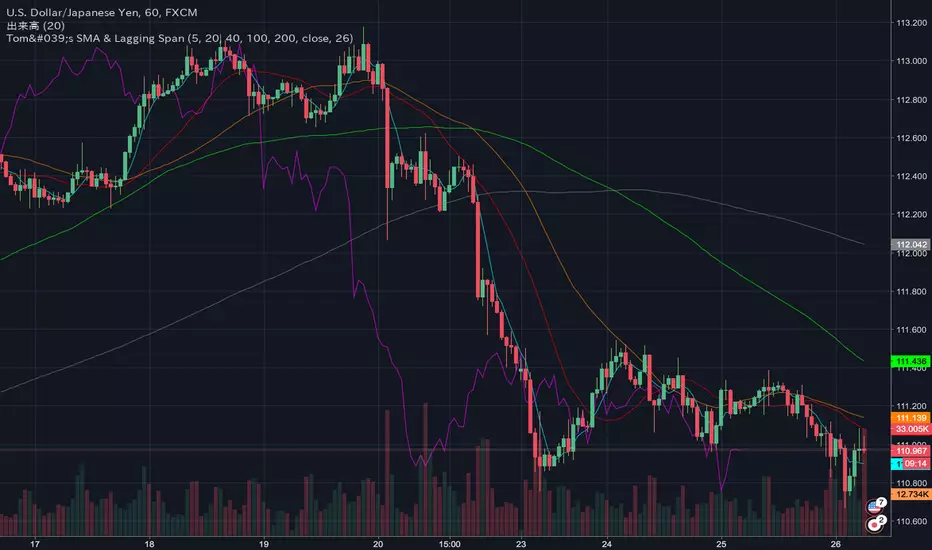
Tom's Moving Average & Lagging SpanSinple Moving Average 5 / 20 / 40 / 100 / 200
Ichimoku Lagging Span
tom_btcfx_fx setting

2BB + 5MA+ 3EMA+Ichikumothis chart show the sma lines, ichimoku, ema lines, ma lines, and bolinger bands


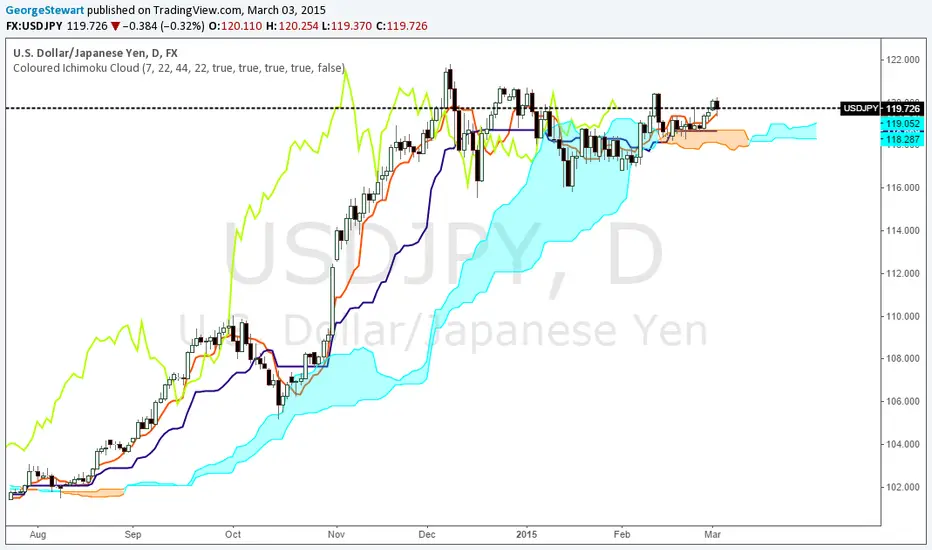
Crypto-Optimized Ichimoku Cloud [Public]Made public and open since I didn't really do anything unique here.
Uses 'Double Crypto' ichimokou settings, and adds a couple new visual features over regular ichimokou.
Made the leading spans' cloud much more visible, and added a new cloud between the base and conversion lines hinting at the trend as well as resistance/support.


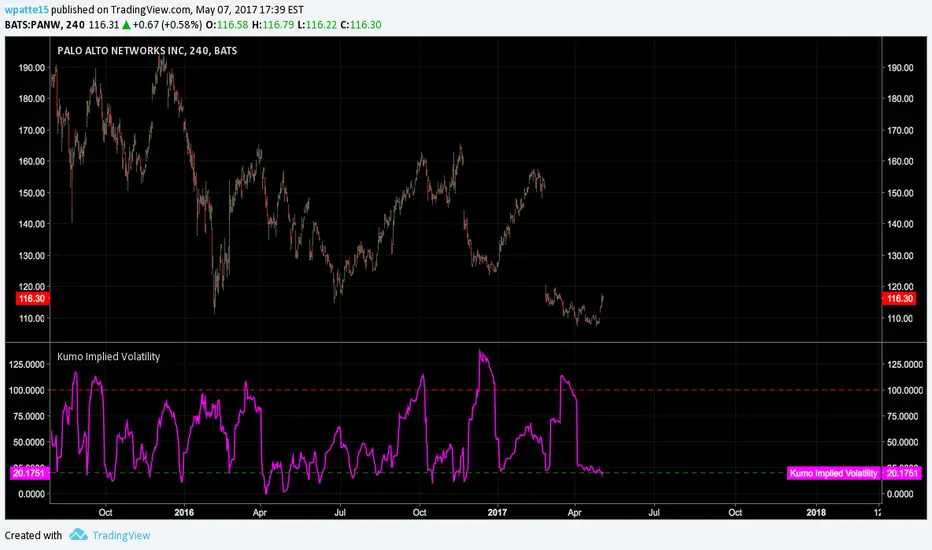
Kumo Implied VolatilityFrom ProRealCode www.prorealcode.com
"In my pursuit to quantify the Ichimoku indicator, I have tried to quantify implied volatility by measuring the Kumo thickness. Firstly, I took the absolute value of the distance between SpanA and SpanB, I then normalized the value and created standard deviation bands. Now I can compare the Kumo thickness with the average thickness over 200 periods. When the value goes above 100, it implies that the Kumo is thicker than 2 standard deviations of the average (there is therefore only a 5% chance that this happens). A reading over 100 might indicate trend exhaustion and a reading below 20 indicates low volatility and Kumo twists (I chose 20 only by observation and not statistical significance). Interestingly, this indicator sometime gives similar information to ADX. So far, the best use for this indicator is as a setup indicator for trend exhaustion or low volatility breakouts from Kumo twists. Extreme readings before Kumo breakouts looks interesting."
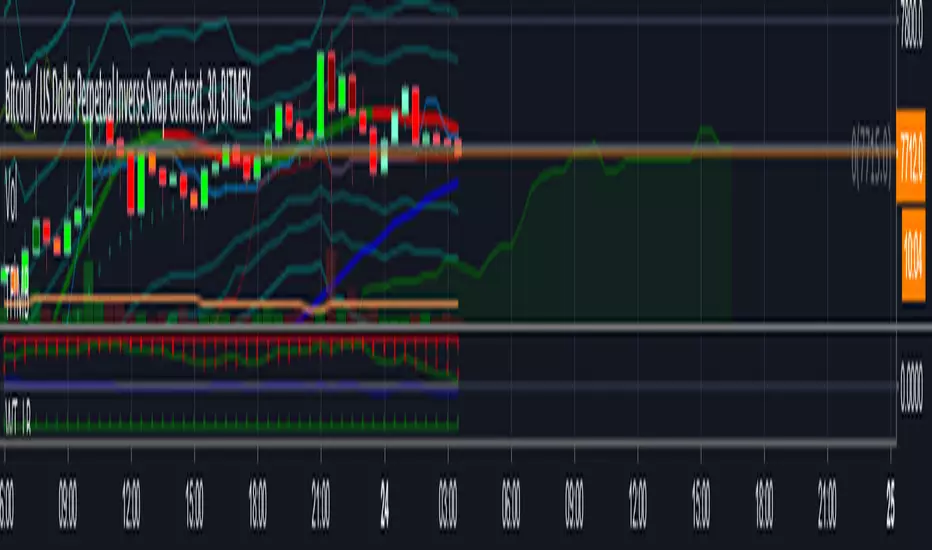
Simple Strategy Code StubThis is a very basic strategy implementation
Use as a code stub for your strategy code. I wrote it because I could not find one.
This particular strategy goes long on Tuesdays at 10 am and goes short at 3 pm on Thursdays.
Because US markets open at 9:30 you have to have your chart in 30 minute or less resolution for trades to fire.
You can gut that code and replace it with your own to start testing your own indicators and strategies.
If you build a strategy that doesn't use "hour" like I have this resolution requirement won't apply.
For giggles, compare its performance to other strategies. Weird, huh? About 53% effective on most equities and indexes.
This strategy does the minimum needed to get a strategy working
and uses default position sizes and buys at market with no stops.
Again, it is the minimal code stub needed to test an indicator/rule based strategy.
A great code reference for building more sophisticated strategies can be
found here =>
The code is written by @greatwolf and is very well structured for anyone looking to fully utilize
strategy features for position sizing, limit orders, stops and cancellations.

Fibline GlanceThis is a set of three indicators combined into one script. The source of the three indicators comes from the tradingview user fibline (www.tradingview.com). The lines remind me of ichimoku, because at a glance, you can tell what the stock is up to. To me, the orange line does an excellent job of showing support and resistance. I'd be happy to add more to the script if anyone has any ideas.
See one of his charts:
