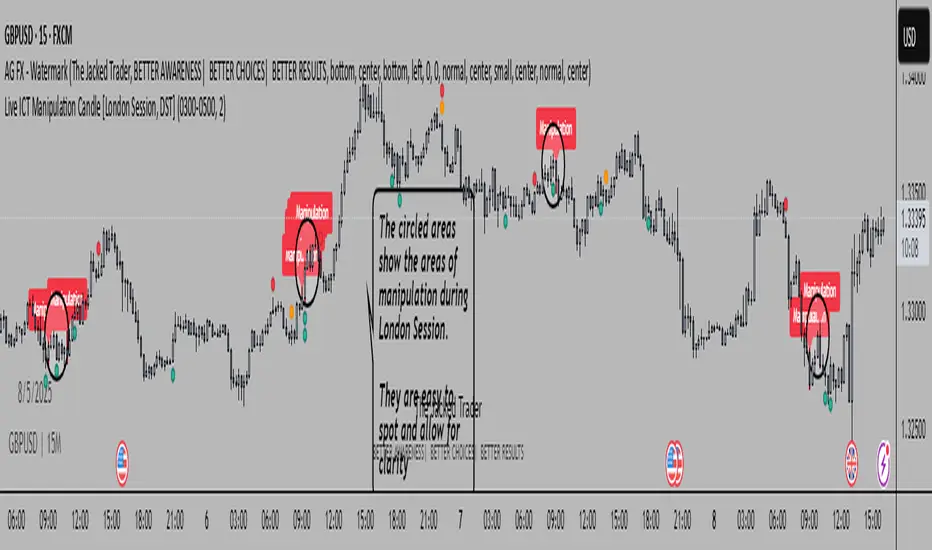
Live ICT Manipulation Candle [London Session, DST]📌 Live ICT Manipulation Candle
🔍 What This Script Does:
This indicator highlights the most volatile ( manipulative ) candle during the London session, based on range and volume, in real-time. It is designed specifically for intraday traders who follow ICT ( Inner Circle Trader ) concepts.
Key Features:
Tracks and highlights the manipulation candle between 3:00 AM to 5:00 AM NY time, adjusted for daylight savings (DST).
Displays a colored box around the manipulation candle and optionally shows a "Manipulation" label ( see chart below ).
Works on 1m, 5m, or 15m charts only — ensures high accuracy and alignment with ICT intraday concepts.
Designed for clarity during live session development.
⚠️ Disclaimer & Transparency:
This script was previously removed by TradingView due to being published with protected ( closed ) source code. I apologize for that oversight.
If you're studying ICT concepts or trading the London session volatility, this script can help you visually anchor the key manipulation point each day!
The indicator doesn't put the circles on. I put them to show the key manipulation areas per London session.
Happy trading and stay sharp!
@TJT_Pro
ابحث في النصوص البرمجية عن "ict"
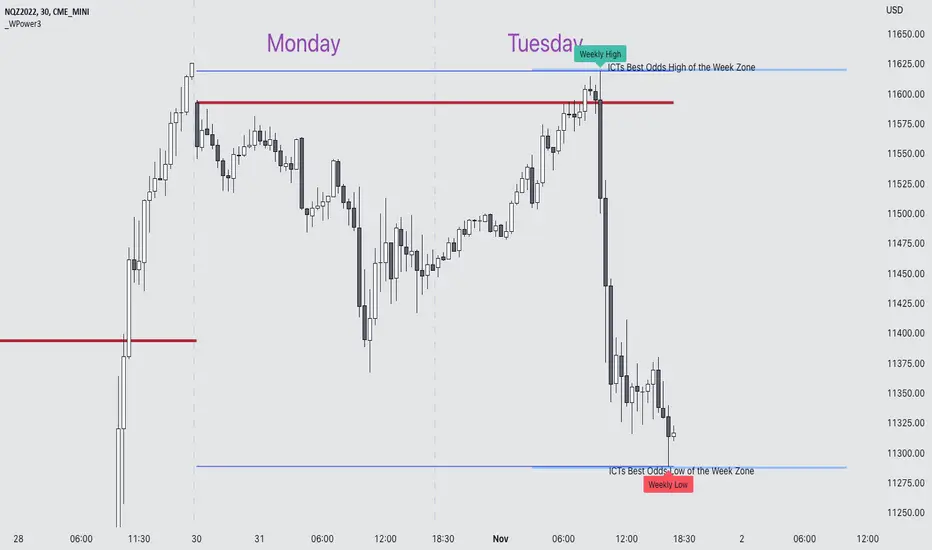
Weekly Power 3Did you know there is a simple line you can place on your chart to immediately make the weeks price action more understandable? Its called the Weekly Open Line. And its the opening price of the trading week. It was created by The Inner Circle Trader (ICT) and incorporates another one of his concepts called Power 3.
The Weekly Power 3 indicator takes the idea of the Weekly Open Line and builds a suite of intelligent and dynamic tools around it that will immediately help the user to start understanding how price moves within the trading week context.
Features
Static Weekly Open Line
Intelligent Days of the Week Text
Dynamic Weekly High Line
Dynamic Weekly Low Line
Weekly High Candle Label (highest candle of the week)
Weekly Low Candle Label (lowest candle of the week)
Best Odds High of the Week Zone Line & Text
Best Odds Low of the Week Zone Line & Text
Components
The primary feature is a line that forms on the weekly open price and grows as the week progresses. Additionally, lines are created for the highest and lowest prices of the week so the weekly profile can be easily recognized. A dynamic label marks each weeks highest and lowest point. This will automatically move as prices expand throughout the week.
A very useful component of the Weekly Power 3 indicator is the Days of the Week text. Each Day of the Week text is displayed in the middle of each trading day and also the user can specify in the Settings whether to position the text at the high or low of the weeks price range. Additionally, there is a Buffer setting that allows the user to move the Days of the Week text up or down to prevent chart overlapping.
To help the user visualize the span of time with the best odds of forming the weekly highs or weekly lows, according to ICT, this indicator adds at static line and optional label into the charts future that projects the span from Tuesday’s London Open to Wednesday’s New York. Having a static line out in the future on your chart really helps to picture where price could be drawn to based solely around time of the week.
Premise
ICT says that the weekly open price is the most important level that price reacts to across the five days of a trading week. If the week profile is expected to be bullish then price many times goes below the weekly open line at the beginning of the week and above it later in the week (a.k.a Bullish Power 3). Consequently, if the week is anticipated to be a bearish week, price often times starts the week high and then goes lower throughout the week (a.k.a Bearish Power 3).
ICT always specifies that the weekly high or weekly low have the best odds of forming between the Tuesday’s London Open and Wednesday’s New York Open.
Inputs and Style
Like all scripts publish by Infinity Trading, everything in the indicator is customizable by the user. Every label, line, or text can be individually toggled ON or OFF so the user has complete control over the elements they want displayed on their chart. All of the lines can be individually adjusted by color, line style, or line width. The color and text color on the high and low of the week labels can be individually changed. The text in the chart (day of the week & best odds zones text) each have a “buffer” value. This allows the user to individually move the text up or down on the chart to declutter the chart. And lastly, the day of the week text can be positioned above or below the weeks price action and the text will dynamically move higher or lower as price expands throughout the week.
Previous weeks have all of the Weekly Power 3 markups so it's easy to study past price action and identify trends.
Gallery
View the weeks price action
View multiple weeks price action
Visualize future price action
Auto Supply and Demand and ICT ExecutionsAuto Supply and Demand and ICT Executions is a professional-grade technical analysis suite designed to automate the visualization of institutional market structure and "Smart Money" execution signals. By combining automated Supply/Demand zoning with key ICT (Inner Circle Trader) concepts, this indicator provides a complete roadmap for identifying high-probability reversal and continuation setups on any timeframe.
Core Features:
Auto Supply & Demand Zones:
Automatically identifies and plots active Supply (Red) and Demand (Green) zones based on significant market structure pivots.
Persistent Logic: Zones remain active on the chart until price "mitigates" (closes beyond) them, ensuring you never miss a retest of a key level.
ATR Clutter Filter: Uses an Average True Range (ATR) algorithm to prevent zones from overlapping, keeping your chart clean and readable.
ICT Execution Signals (MSS):
Market Structure Shifts (MSS): Automatically detects valid shifts in market structure when price breaks a key structural high or low following a liquidity sweep.
Instant Signal Labels: clearly labels breakout points with "MSS ↑" (Bullish) or "MSS ↓" (Bearish) tags.
Auto Risk/Reward Projections:
Upon detecting an MSS signal, the indicator instantly projects a Risk/Reward (R:R) Box (default 1:2) anchored to the breakout candle.
This provides immediate, visual Take Profit (Green) and Stop Loss (Red) targets, allowing for instant trade assessment without manual measuring.
Multi-Timeframe (MTF) Confluence:
Projects Higher Timeframe (HTF) Zones (default: 15-minute) directly onto your current chart.
This allows you to align your lower-timeframe entries (e.g., 1-minute) with the dominant institutional trend without switching screens.
Institutional Concepts:
Liquidity Sweeps: Highlights "Stop Hunt" pivots where price briefly breaches a recent swing high/low to trap traders before reversing.
Fair Value Gaps (FVG): Visualizes historical price imbalances (gaps) where aggressive institutional buying or selling occurred.
Silver Bullet Session: Automatically highlights the high-probability 10:00 AM - 11:00 AM NY trading window.
How to Trade with This Indicator:
Identify Structure: Wait for price to approach a Supply or Demand Zone (especially if it overlaps with an MTF Zone).
Confirm the Sweep: Look for the "Sweep" label, indicating liquidity has been grabbed.
Execute on Signal: Enter the trade when the "MSS" label appears, confirming the reversal.
Manage the Trade: Use the automated R:R Box to set your Stop Loss and Take Profit levels.

DuoBlocks - ICT Order Block detectorDuoBlocks (ICT Order Block Detector)
(An ICT(Inner Circle Trading)-style Order Block(OB) tool that highlights only the most relevant and recent Demand/Supply zones using FVG and Engulfing based OB sources.)
Overview
DuoBlocks is an ICT-inspired Order Block detector that uses the mostly used two major order block types: FVG(Fair Value Gap) or Engulfing. There are many Order Block indicators out there, but I couldn’t find one that consistently highlights the most relevant, most recent OB relative to the current price without making the chart a mess and that's why so I built this script.
FVG-based OB (FVG-OB): OBs derived from 3-candle fair value gap logic.
Engulfing-based OB (Engulfing-OB): OBs derived from strong 2-candle reversal/displacement (engulf) logic.
Usage
FVG-OB (Fair Value Gap Order Blocks)
This script finds bullish/bearish FVGs and draws an Order Block zone from the candle that created the move. Think of these zones as your potential next support (bullish) and resistance (bearish) levels.
Engulfing-OB (Engulfing Order Blocks)
This script also finds strong bullish/bearish engulfing candles and draws an Order Block zone from the candle that got engulfed.
Same idea: treat them as potential next support (bullish) and resistance (bearish) levels.
**Use these zones like “next level” support/resistance areas. Don’t blindly buy/sell—wait for your own confirmation and manage risk properly.
Settings
Show FVG-OB
Toggle display of the selected FVG-based bullish/bearish OB (one per side).
Show Engulfing-OB
Toggle display of the selected Engulfing-based bullish/bearish OB (one per side).
Max Invalidation Attempts (FVG OB or Engulf OB)
Controls how many separate breach events a stored OB can absorb before it is marked invalid (discarded). The counting happens when either of below occurs.
Bullish OB: price prints a low below the OB bottom.
Bearish OB: price prints a high above the OB top.
Each time this happens, the OB’s invalidation counter increments by +1.
Once the counter reaches your Max Attempts, that OB is flagged as no longer live, so it will stop being eligible for selection. Then the script automatically falls through to the next best/next nearest valid OB in memory.
Right Extend (bars)
How far to extend the selected OB boxes to the right.
Lookback bars
Maximum historical bars scanned for detection. Lower values = faster/cleaner, higher values = more history retained.
Max stored OB per side
Maximum stored bullish and bearish OBs in memory (per source).
Bullish/Bearish OB Color
Controls border/midline coloring for bullish and bearish zones.
Disclaimer
This script is for educational and informational purposes only and does not constitute financial advice or investment recommendations. Trading cryptocurrencies and other financial instruments involves significant risk, and you are solely responsible for your own decisions based on your financial situation, objectives, and risk tolerance. The author assumes no liability for losses arising from the use of this indicator.

🟡 GOLD 4H HUD v8.9 — Loose ICT OB + Strong/Weak + FVG/HVN/LVNGOLD 4H HUD v8.9 is a clean, structured Smart Money Concepts (SMC)–based analysis tool designed exclusively for XAUUSD on the 4-hour timeframe.
It focuses on the three most important elements for institutional orderflow analysis:
✔ Loose ICT Order Blocks (Demand/Supply)
✔ Fair Value Gaps (FVG)
✔ Volume Profile Zones (HVN/LVN/POC)
The script builds a professional-style HUD that displays the key institutional regions and structural levels that matter most for gold traders.
📌 Key Features
1 — Market Structure Engine (HH/HL & BOS)
The indicator detects:
Minor swing Highs and Lows
Last confirmed HH / HL levels
Break of Structure (BOS) for directional bias
EMA-200 trend filter (UP / DOWN / NEUTRAL)
This gives traders a clean structural read without clutter or noise.
2 — Loose FVG Engine (Tolerance-Based ICT Gaps)
A soft-threshold FVG engine detects “loose” Fair Value Gaps using a 0.1% price tolerance.
This method ensures:
Fewer missed imbalances
Cleaner OB/FVG alignment
Higher accuracy on 4H gold displacement legs
FVGs automatically shift to the right side of the chart for clean visualization.
3 — Order Block Engine (Demand/Supply + Strong/Weak Classification)
A simplified ICT-style OB engine scans the past few candles whenever BOS is detected.
It identifies:
Demand OB during bullish BOS
Supply OB during bearish BOS
Strong OB if fully nested inside an active FVG
Weak OB otherwise
OB boxes include:
Clear color coding (strong vs. weak)
Price range labels inside each box
Automatic right-shift for visual clarity
4 — Volume Profile Engine (POC / HVN / LVN / VAH / VAL)
Based on a rolling window (default 120 bars), the script builds a lightweight volume distribution.
It displays:
POC (Point of Control)
HVN (High Volume Node)
LVN (Low Volume Node)
Value Area High / Low
HVN/LVN zones are shown as right-shifted colored boxes with price labels.
These zones help identify:
Institutional accumulation
Low-liquidity rejection points
Areas where price tends to react strongly
5 — Support / Resistance Mapping
The script automatically generates:
OB-based support/resistance
Swing-high/swing-low levels
HVN/LVN structural levels
These are displayed in the HUD for fast reference.
6 — Professional HUD Panel
A compact, easy-to-read HUD summarizes:
Trend direction
Latest HH/HL
OB ranges (Strong/Weak)
HVN/LVN price zones
POC
Multi-layer support & resistance
This turns the script into a fully functional analysis dashboard.
📌 What This Indicator Is NOT
To avoid misunderstanding:
It does not take entries or generate buy/sell signals
It does not auto-detect CHOCH, MSS, SMT, or sweeps
It is not a trading bot
This tool is designed as an institutional-style map and analysis HUD, not a strategy.
📌 Best Use Case
This indicator is ideal for traders who want to:
Read institutional structure on XAUUSD
Identify clean Demand/Supply zones
Visualize FVG/OB/HVN interactions
Track high-value liquidity levels
Build directional bias on 4H before dropping to execution timeframes
⚠ Important Note
This tool is designed exclusively for the 4H timeframe.
Using it on lower timeframes will display a warning.

Equinox Wolf - ICT MacrosEquinox Wolf – ICT Macros plots the key ICT session macro windows on your chart so you can focus on how price behaves inside each time range. The script anchors every session to America/New_York time, updates live or in backtesting, and only keeps the current trading day on screen, avoiding clutter from prior sessions. Each window can be toggled individually, the box fill, borders, and high/low/equilibrium levels share global color and style controls, and the levels extend forward until the next macro begins. Use it to highlight the ICT LND, NYAM, lunch, afternoon, and final-hour ranges and monitor how price reacts around their highs, lows, and midpoints.

DTLLC Time & PriceDTLLC Time and Price with Signals
This indicator is built for traders who understand ICT concepts and want a structured, visual way to align time-based price action with key market levels. By combining customizable trading windows, breakout logic, and daily reference points, it helps you identify high-probability trade opportunities while filtering out market noise.
Key Features
1. Dual Custom Time Ranges (Kill Zones)
Set two independent time ranges per day (start/end hour and minute).
Each range identifies the highest high and lowest low within its window.
Built-in breakout detection generates buy/sell signals when price moves beyond these levels.
2. Volatility Filtering
Adjustable volatility threshold based on True Range relative to ATR.
Filters out low-quality signals during choppy, low-volatility conditions.
3. ATR-Based Stop Loss
Custom ATR length and stop-loss multiplier settings.
Automatically plots ATR-based stop levels for triggered trades.
4. Daily Key Levels
Plots Previous Day High, Previous Day Low, and Midnight Open continuously on the chart.
Useful for spotting breakout and reversal opportunities in line with ICT market structure concepts.
5. Liquidity & Engulfing Candle Highlights
Highlights potential liquidity grab zones (yellow candles) when significant highs/lows are set within your lookback period.
Detects bullish (green) and bearish (red) engulfing patterns for added confluence.
6. Visual & Signal Tools
Buy/Sell signals plotted directly on chart (separate colors for Range 1 and Range 2). Continuous plotting of reference levels to maintain market context throughout the session.
Example Use Case:
A common ICT-inspired reversal setup:
Wait for price to sweep the Previous Day’s High or Low during your chosen time range.
Look for a buy or sell signal with volatility confirmation.
Manage risk using the ATR-based stop-loss plot.
Disclaimer: This script is for educational purposes only and is not financial advice. Trade responsibly and always test strategies before applying them in live markets.

Contrarian with 5 Levels5 Levels application was inspired and adapted from Predictive Ranges indicator developed by Lux Algo. So much credit to their work.
Indicator Description: Contrarian with 5 Levels
Overview
The "Contrarian with 5 Levels" indicator is a powerful tool designed for traders seeking to identify potential reversal points in the market by combining contrarian trading principles with dynamic support and resistance levels. This indicator overlays a Simple Moving Average (SMA) shadow and five adaptive price levels, integrating Institutional Concepts of Structure (ICT) such as Break of Structure (BOS) and Market Structure Shift (MSS) to provide clear buy and sell signals. It is ideal for traders looking to capitalize on overextended price movements, particularly on the daily timeframe, though it is adaptable to other timeframes with proper testing.
How It Works
The indicator operates on two core components:
Contrarian SMA Shadow: A shaded region between the SMA of highs and lows (default length: 100) acts as a dynamic zone to identify overbought or oversold conditions. When the price moves significantly outside this shadow, it signals potential exhaustion, aligning with contrarian trading principles.
Five Adaptive Levels: Using a modified ATR-based calculation, the indicator plots five key levels (two resistance, one average, and two support) that adjust dynamically to market volatility. These levels serve as critical zones for potential reversals.
ICT Structure Analysis: The indicator incorporates BOS and MSS logic to detect shifts in market structure, plotting bullish and bearish breaks with customizable colors for clarity.
Buy and sell signals are generated when the price crosses key levels while outside the SMA shadow, indicating potential reversal opportunities. The signals are visualized as small circles above (sell) or below (buy) the price bars, making them easy to interpret.
Mathematical Concepts
SMA Shadow: The indicator calculates the SMA of the highest highs and lowest lows over a user-defined period (default: 100). This creates a dynamic range that highlights extreme price movements, which contrarian traders often target for reversals.
Five Levels Calculation: The five levels are derived using a volatility-adjusted formula based on the Average True Range (ATR). The average level (central pivot) is calculated as a smoothed price, with two upper (resistance) and two lower (support) levels offset by a multiple of the ATR (default multiplier: 6.0). This adaptive approach ensures the levels remain relevant across varying market conditions.
ICT BOS/MSS Logic: The indicator identifies pivot highs and lows on a user-defined timeframe (default: daily) to detect structural breaks. A BOS occurs when the price breaks a prior pivot high (bullish) or low (bearish), while an MSS signals a shift in market direction, providing context for potential reversals.
Entry and Exit Rules
Buy Signal (Blue Dot Below Bar): Triggered when the closing price is below both the SMA shadow (smaLow) and the average level (avg), and the price crosses under either the first or second support level (prS1 or prS2). This suggests the market may be oversold, indicating a potential reversal upward.
Sell Signal (White Dot Above Bar): Triggered when the closing price is above both the SMA shadow (smaHigh) and the average level (avg), and the price crosses over either the first or second resistance level (prR1 or prR2). This suggests the market may be overbought, indicating a potential reversal downward.
Recommended Usage
This indicator is optimized for the daily timeframe, where it has been designed to capture significant reversal opportunities in trending or ranging markets. However, it can be adapted to other timeframes (e.g., 1H, 4H, 15M) with proper testing of settings such as SMA length, ATR multiplier, and structure timeframe. Users are encouraged to backtest and optimize parameters to suit their trading style and asset class.
Customization Options
SMA Length: Adjust the SMA period (default: 100) to control the sensitivity of the shadow.
Five Levels Length and Multiplier: Modify the length (default: 200) and ATR multiplier (default: 6.0) to fine-tune the support/resistance levels.
Timeframe Settings: Set separate timeframes for structure analysis and five levels to align with your trading strategy.
Color and Signal Display: Customize colors for BOS/MSS lines and toggle buy/sell signals on or off for a cleaner chart.
Why Use This Indicator?
The "Contrarian with 5 Levels" indicator combines the power of contrarian trading with dynamic levels and market structure analysis, offering a unique perspective for identifying high-probability reversal setups. Its intuitive design, customizable settings, and clear signal visualization make it suitable for both novice and experienced traders. Whether you're trading forex, stocks, or cryptocurrencies, this indicator provides a robust framework for spotting potential turning points in the market.
We hope you find the "Contrarian with 5 Levels" indicator a valuable addition to your trading toolkit! Happy trading!
Please leave feedback in the comments section.

TradeJorno - Time + Price Levels
Tired of manually drawing and updating important ICT or SMC time and price levels on your charts every day?
Here’s an indicator to draw important TIME and PRICE levels automatically.
Here’s what you can highlight in realtime on your charts:
1. Previous major highs and lows
⁃ Previous daily and weekly highs and low
- Weekly dividing lines
2. Session highs/lows
⁃ Plot the high and low of Asia and London sessions.
⁃ Customise the timeframe and appearance on the chart.
- Previous session settlement price.
3. Various price levels
⁃ Pre-market opening prices : midnight, 7:30 and 8:30
⁃ Regular market opening prices: 9:30, 10:00, 14:00
- end of session settlement prices
4. Market opening range high and low
⁃ Lines extending throughout the current session
⁃ Customise the timeframe and appearance on the chart.
5. ICT Macro times
- Draw customisable vertical lines and labels to indicate the start of each ICT macro
period.
Let us know in the comments below if there’s anything else we need to add!

FVG [TakingProphets]🧠 Purpose
This indicator is built for traders applying Inner Circle Trader (ICT) methodology. It detects and manages Fair Value Gaps (FVGs) — price imbalances that often act as future reaction zones. It also highlights New Day Opening Gaps (NDOGs) and New Week Opening Gaps (NWOGs) that frequently play a role in early-session price behavior.
📚 What is a Fair Value Gap?
A Fair Value Gap forms when price moves rapidly, skipping over a portion of the chart between three candles — typically between the high of the first candle and the low of the third. These zones are considered inefficient, meaning institutions may return to them later to:
-Rebalance unfilled orders
-Enter or scale into positions
-Engineer liquidity with minimal slippage
In ICT methodology, FVGs are seen as both entry zones and targets, depending on market structure and context.
⚙️ How It Works
-This script automatically identifies and manages valid FVGs using the following logic:
-Bullish FVGs: When the low of the current candle is above the high from two candles ago
-Bearish FVGs: When the high of the current candle is below the body of two candles ago
-Minimum Gap Filter: Gaps must be larger than 0.05% of price
-Combine Consecutive Gaps (optional): Merges adjacent gaps of the same type
-Consequent Encroachment Line (optional): Plots the midpoint of each gap
-NDOG/NWOG Tracking: Labels gaps created during the 5–6 PM session transition
-Automatic Invalidation: Gaps are removed once price closes beyond their boundary
🎯 Practical Use
-Use unmitigated FVGs as potential entry points or targets
-Monitor NDOG and NWOG for context around daily or weekly opens
-Apply the midpoint (encroachment) line for precise execution decisions
-Let the script handle cleanup — only active, relevant zones remain visible
🎨 Customization
-Control colors for bullish, bearish, and opening gaps
-Toggle FVG borders and midpoint lines
-Enable or disable combining of consecutive gaps
-Fully automated zone management, no manual intervention required
✅ Summary
This tool offers a clear, rules-based approach to identifying price inefficiencies rooted in ICT methodology. Whether used for intraday or swing trading, it helps traders stay focused on valid, active Fair Value Gaps while filtering out noise and maintaining chart clarity.

CISD [TakingProphets]🧠 Indicator Purpose:
The "CISD - Change in State of Delivery" is a precision tool designed for traders utilizing ICT (Inner Circle Trader) conecpets. It detects critical shifts in delivery conditions after liquidity sweeps — helping you spot true smart money activity and optimal trade opportunities. This script is especially valuable for traders applying liquidity concepts, displacement recognition, and market structure shifts at both intraday and swing levels.
🌟 What Makes This Indicator Unique:
Unlike basic trend-following or scalping tools, CISD operates through a two-phase smart money logic:
Liquidity Sweep Detection (sweeping Buyside or Sellside Liquidity).
State of Delivery Change Identification (through bearish or bullish displacement after the sweep).
It intelligently tracks candle sequences and only signals a CISD event after true displacement — offering a much deeper context than ordinary indicators.
⚙️ How the Indicator Works:
Swing Point Detection: Identifies recent pivot highs/lows to map Buyside Liquidity (BSL) and Sellside Liquidity (SSL) zones.
Liquidity Sweeps: Watches for price breaches of these liquidity points to detect institutional stop hunts.
Sequence Recognition: Finds series of same-direction candles before sweeps to mark institutional accumulation/distribution.
Change of Delivery Confirmation: Confirms CISD only after significant displacement moves price against the initial candle sequence.
Visual Markings: Automatically plots CISD lines and optional labels, customizable in color, style, and size.
🎯 How to Use It:
Identify Liquidity Sweeps: Watch for CISD levels plotted after a liquidity sweep event.
Plan Entries: Look for retracements into CISD lines for high-probability entries.
Manage Risk: Use CISD levels to refine your stop-loss and profit-taking zones.
Best Application:
After stop hunts during Killzones (London Open, New York AM).
As part of the Flow State Model: identify higher timeframe PD Arrays ➔ wait for lower timeframe CISD confirmation.
🔎 Underlying Concepts:
Liquidity Pools: Highs and lows cluster stop orders, attracting institutional sweeps.
Displacement: Powerful price moves post-sweep confirm smart money involvement.
Market Structure: CISD frequently precedes major Change of Character (CHoCH) or Break of Structure (BOS) shifts.
🎨 Customization Options:
Adjustable line color, width, and style (solid, dashed, dotted).
Optional label display with customizable color and sizing.
Line extension settings to keep CISD zones visible for future reference.
✅ Recommended for:
Traders studying ICT Smart Money Concepts.
Intraday scalpers and higher timeframe swing traders.
Traders who want to improve entries around liquidity sweeps and institutional displacement moves.
🚀 Bonus Tip:
For maximum confluence, pair this with the HTF POI, ICT Liquidity Levels, and HTF Market Structure indicators available at TakingProphets.com! 🔥

Range Projections [TFO]The purpose of this indicator is to see how often price reached certain standard deviations from a selected time range. The inspiration for this was to study ICT (Inner Circle Trader) concepts regarding the Central Bank Dealer’s Range (CBDR), which is 2:00 pm - 8:00 pm New York local time according to ICT Core Content. However, the idea and data collection could certainly be applied to any range of time.
The main settings of this indicator are session time, range type, and the standard deviation filter. The session time is the window of price that will be utilized for range projections. The range type can be either body or wick (on the current timeframe). The standard deviation filter is used to eliminate sessions whose ranges (from high to low) are greater than the desired/input number of standard deviations from all available session ranges.
In this example, the time range is set to 16:00 - 20:00, or the time between the New York session close and the Asia session open. Our standard deviations are set to 1, 2, 2.5, and 4. Now, by taking this session’s price range and extrapolating these extensions from the initial range, we can use these levels to see if and how price interacts with them before the next 16:00 - 20:00 session.
Furthermore, we can enable the Data Table to analyze how often price trades to these levels for the sessions that are deemed valid (determined by the standard deviation filter). This time our standard deviations are set to 1, 2, 3, and 4.
This concept can theoretically be applied to any window of time. ICT has mentioned that, in instances where the CBDR is too large, the Asia range may be used instead. We can observe that the indicator behaves the same way when we change the session to the Asia range, 20:00 - 00:00.

Liquidity Engulfing & Displacement [MsF]Japanese below / 日本語説明は英文の後にあります。
-------------------------
*This indicator is based on upslidedown's "Liquidity Engulfing Candles ". It's a very cool indicator. thank you.
It has 2 functions: show the Liquidity Engulfing on HTF and candle color change when displacement occurs.
=== Function description ===
1. Liquidity Engulfing on HTF
This indicator gives Liquidity Engulfing signals not only for the current candle, but also for H4 and H1 on HTF.
You can use that a bullish engulfing on H1 is a BOS on m5 and on H4 is a BOS on m15. It uses the theory of stop hunt from ICT.
Also, It's possible to fire alert.
2. Displacement
Change the color display of the candlesticks when a bullish candleStick or bearish candleStick is attached. Furthermore, by enabling the "Require FVG" option, you can easily discover the FVG (Fair Value Gap). It is a very useful function for ICT trading.
When H1 candle takes liquidity from one side and moves with an explosive move to the other side of the previous candle (displacement), it creates break of market structure on M5. Entry on discount FVG or OTE with stop loss at or below the stop hunt wick.
=== Parameter description ===
- Liquidity engulfing candles(LEC) SETTING
- Show H1 LEC … Whether to show LEC for H1
- Show H4 LEC … Whether to show LEC for H4
- Show Current LEC … Whether to show LEC for current timeframe
- Apply Stop Hunt Wick Filter … Require candle wick into prior candle retracement zone
- Apply Close Filter … Require LL/HH on candle in order to print a valid engulfing signal
- DISPLACEMENT SETTING
- Require FVG … Draw only when FVG occurs
- Displacement Type … Displacement from open to close? or from high to low?
- Displacement Length … Period over which to calculate the standard deviation
- Displacement Strength … The larger the number, the stronger the displacement detected
-------------------------
2つの機能があります: 上位足のLiquidity engulfing(流動性獲得)を表示することと、大きな変位が発生したときにローソク足の色を変更することです。
=== 機能説明 ===
1. 上位足のLiquidity engulfing
このインジケーターは、現在のローソク足だけでなく、上位足の H4 および H1 に対してもLiquidity engulfingシグナルを提供します。
H1はm5、H4はm15での使用を推奨します。これはICTのストップハント理論を活用しています。また、アラートを発することも可能です。
2. 変位(DISPLACEMENT)
大きな陽線、陰線を付けた場合に、そのローソク足をカラー表示を変更します。
さらに"Require FVG"オプションを有効にすることで、FVG(Fair Value Gap)を容易に発見することができます。ICTトレードにを行うにあたり大変有用な機能となっています。
=== パラメータの説明 ===
- Liquidity engulfing candles(LEC) SETTING
- Show H1 LEC … H1のLECを表示するかどうか
- Show H4 LEC … H4のLECを表示するかどうか
- Show Current LEC … 現在の期間の LEC を表示するかどうか
- Apply Stop Hunt Wick Filter … ハラミ足、もしくは包み足になっている場合のみに検知させる
- Apply Close Filter … 1つ前のローソクよりも終値で超えていた場合のみに検知させる
- DISPLACEMENT SETTING
- Require FVG … FVG発生時のみ描画する
- Displacement Type … openからcloseまでの変位か?highからlowまでの変位か?
- Displacement Length … 標準偏差を計算する期間
- Displacement Strength … 変位の強さ(数字が大きいほど強い変位を検出)

AsianRange and KillZonesAsia Range Shadow Box and ICT Killzones
If you watch ICT on youtube you will know what to do with this :-)
I had found a lot of great ideas but none of them completely had what I was personally looking for so I put all of the great ideas I had found and added my own twist to it.
I wanted a easily customizable indicator that did the following
- Showed the Asia Range (customizable time)
- Allowed Asia range high and low to be extended
- Fill the asia range or just have it outlined
- The ability to have 4 customizable zones (default to ICT kill zones) but you can make them whatever you want
- Ability to turn off various zones if you want (Maybe you just want a New York Session and thats it)
I also place a "Max timeframe to display" - Personally I don't want this showing on anything over a 60min chart so you can adjust that parameter (in minutes) to your liking.
This was also fully converted to pine v4
I hope in a future revision to take use of the new "box" feature to get a cleaner box around Asia session.
Smart Money Sessions + Liquidity + FVGSmart Money Sessions + Liquidity + Fair Value Gap is a clean and professional price-action based indicator designed for Gold (XAUUSD) and Forex traders who follow Smart Money Concepts (SMC) and ICT methodology.
This indicator focuses on where liquidity is taken, when structure shifts, and where imbalance (FVG) is created, without cluttering the chart or repainting signals.
🔍 Key Features
🕒 Session High & Low (Killzones)
Automatically plots Asia, London, and New York session highs and lows
Helps identify:
Asia range manipulation
London fakeouts
New York continuations
💧 Liquidity Sweep Detection
Detects wick-based liquidity grabs
Highlights areas where stop-losses are likely taken
Ideal for spotting smart money entries
🔁 Market Structure Shift (MSS)
Simple and clean bullish & bearish structure shifts
Helps confirm trend continuation or reversal
Non-repainting logic
📦 Fair Value Gap (FVG)
Uses true 3-candle imbalance logic
Highlights bullish and bearish FVG zones
Clean visualization without over-plotting
✅ Why This Indicator?
❌ No repainting
❌ No lagging indicators
❌ No unnecessary colors
✅ Based purely on price action
✅ Beginner-friendly & professional-grade
✅ Optimized for Gold (XAUUSD)
🎯 Best Use Cases
Gold scalping & intraday trading
London & New York session trades
Liquidity-based entries
ICT / Smart Money strategies
⚠️ Disclaimer
This indicator is a visual analysis tool, not a buy/sell signal generator.
Always combine it with proper risk management and your own trading plan.

NQ ICT NY Session ChecklistNQ ICT NY Session Checklist
A manual, on-chart checklist indicator designed to enforce ICT execution rules during the New York session on Nasdaq (NQ). The script displays a step-by-step confirmation panel for higher-timeframe bias, liquidity identification, liquidity sweep, market structure shift, fair value gap entry, and risk/reward validation. It helps prevent early entries, FOMO, and overtrading by clearly indicating when all conditions are met and the trader is ready to execute.

TTP IFVG Signals With EMA /ICT Gold scalpingThis script uses original logic and alerting rules. in Japan
finding ICT IFVG and EMA conditions.
#IFVG, Forex, ICT, EMA, Scalping, Indicator
This indicator automatically finds IFVG (Imbalance / Fair Value Gap) zones and gives you a buy or sell signal when price comes back and breaks out through that gap.
It also draws a colored box over the gap so you can see the zone visually, and it raises alerts when a new signal appears.
High-level logic:
On every bar, the script looks back up to “IFVG_GapBars” bars.
For each offset i it checks a 3-candle pattern:
– If the low of the newer candle is above the high of the older candle: bullish FVG (price jumped up, leaving a gap).
– If the high of the newer candle is below the low of the older candle: bearish FVG (price jumped down, leaving a gap).
When a valid FVG is found:
– For a bullish FVG it looks for a later close that breaks down through that gap (sell signal).
– For a bearish FVG it looks for a later close that breaks up through that gap (buy signal).
– A moving-average trend filter must agree (downtrend for sells, uptrend for buys).
– It checks that price has not already “filled” the gap before the breakout.
If all conditions are satisfied, it:
– Sets signal_dir = 1 for a buy, or -1 for a sell.
– Draws a box from the original FVG bar to the bar just before the breakout (extended a bit to the right), between the gap high and gap low.
– Plots an ▲ label for buys or ▼ label for sells.
– Triggers the corresponding alert conditions.
Now the parameters:
PipSizeMultilier (PipSizeManual)
Multiplies the symbol’s minimum tick size (syminfo.mintick).
It is used when converting “MinFVG_Pips” into an actual price distance.
If you feel the indicator is too sensitive (too many small gaps), you can increase this multiplier to effectively require a larger price difference.
TickSize
Internal value = syminfo.mintick * PipSizeMultiplier.
This is the actual price step the script uses as a “pip” when checking minimum gap size.
FVG Search Lookback (IFVG_GapBars)
How many bars back from the current bar the script will scan for a 3-candle FVG pattern.
Larger value = it can find older FVGs, but loop cost is higher.
Min FVG Size (Pips/Points) (MinFVG_Pips)
Minimum allowed size of the gap, measured in “pips/points” using TickSize.
If the vertical distance between the gap high and gap low is smaller than this, the gap is ignored.
0.0 means “no size filter” (every FVG is allowed).
FVG Epsilon (Price Units) (FVG_EpsPoints)
Tolerance for the FVG detection.
It is subtracted/added in the condition that checks “low > old high” or “high < old low”.
0.0 means strict gap (no overlap at all). A small positive epsilon allows tiny overlaps to still count as a gap.
Show IFVG Zones (ShowZones)
If true, the script draws a box over the IFVG zone when a signal is confirmed.
If false, no boxes are drawn; you only see the ▲ / ▼ markers and alerts.
Buy Zone Color (ZoneColorBuy)
Fill color and border color for boxes created from bearish FVGs that later produce a buy signal.
Sell Zone Color (ZoneColorSell)
Fill color and border color for boxes created from bullish FVGs that later produce a sell signal.
Box Extension (Bars) (BoxExtension)
How many extra bars to extend the right side of the box beyond the breakout bar.
The internal right coordinate is “bar_index - 1 + BoxExtension”.
Increase this if you want the zone to visually extend further into the future.
MA Period (MA_Period)
Lookback length of the moving average used as a trend filter.
MA Type (MA_Kind)
Type of moving average: “SMA” or “EMA”.
If SMA is chosen, the script uses ta.sma; if EMA, it uses ta.ema.
Moving-average filter behavior:
For sell signals (from bullish FVG): MA must be sloping down (MA < MA ) and price must be below MA.
For buy signals (from bearish FVG): MA must be sloping up (MA > MA ) and price must be above MA.
If these conditions are not satisfied, the FVG is ignored even if the gap and breakout conditions are met.
Signals and alerts:
signal_dir = 1 → buy signal, ▲ label below the bar, “IFVG Buy Alert” / “IFVG Buy/Sell Alert” can fire.
signal_dir = -1 → sell signal, ▼ label above the bar, “IFVG Sell Alert” / “IFVG Buy/Sell Alert” can fire.
signal_dir = 0 → no new signal on this bar.
In short:
This indicator finds 3-candle IFVG gaps, filters them by size and trend, waits for a clean breakout through the gap, draws a box on the original gap zone, and gives you a clear buy or sell signal plus alerts.

Đại Ka 3 ATR BandsĐại Ka 3 ATR Bands – The ultimate single-slot indicator that replaces three separate ATR plots.
Designed specifically for ICT/SMC traders in 2025:
• Light red band (±0.5 ATR) → fake moves, Judas Swing, Turtle Soup zone
• Gray band (±1.0 ATR) → normal price action
• Light green band (±2.0 ATR) → real displacement zone → Silver Bullet, SFT, high-probability entries
How to use:
– Price stuck inside red band → expect reversal/fakeout
– Price breaks and closes outside green band + volume spike → enter aggressively in that direction (85%+ win-rate inside Killzones)
Default ATR(14), subtle fills for instant visual filtering of real vs fake moves.
Perfect companion for Order Blocks, FVG, Breaker Blocks and NY/London Killzones.
Free forever – coded with love by Đại Ka & Vietnamese ICT crew.

Custom Horizontal Lines | Trade Symmetry📊 Custom Horizontal Lines
🔍 Overview
The Custom Horizontal Lines is a precision utility designed for traders who perform manual higher-timeframe analysis and want to preserve their marked price levels directly on the chart.
It doesn’t calculate or detect anything automatically — instead, it acts as your personal level memory, preserving your analyzed zones and reference prices throughout the session.
Ideal for traders who manually mark the High, Low, Open, Close, Mean Thresholds, and Quarter Levels of Order Blocks, Fair Value Gaps, Inversion Fair Value Gaps and Wicks before the trading day begins.
⚙️ Key Features
✅ Manual Level Entry — Input your analyzed price levels (OB, FVG, WICK,etc) directly into the indicator settings.
✅ Preserved Levels — Once entered, your lines stay visible and consistent — even after switching symbols, timeframes, or reloading the chart.
✅ Supports All Level Types — Store any kind of manually defined level: OB highs/lows, FVG boundaries, Wicks, Mean Thresholds, Quarter levels, or custom reference prices.
✅ Clean Visualization — Customize line color, style, and labels for easy visual organization.
✅ Session-Ready Workflow — Built for pre-market preparation — enter your HTF levels once, and trade around them all day.
✅ No Auto Calculations — 100% manual by design — ensuring only your analyzed levels are shown, exactly as you defined them.
💡 How to Use
Open the indicator’s settings and manually enter those price values.
The indicator will plot and preserve those exact levels on your chart.
Switch to your lower timeframe and observe how price reacts around them — without ever needing to redraw.
🎯 Why It’s Useful
Keeps your HTF levels organized and persistent across sessions.
Saves time by avoiding redrawing.
Fits perfectly into ICT / Smart Money trading workflows.
Ensures full manual control and precision over what’s displayed on your chart.
🧩 Ideal For
ICT and Smart Money traders
Institutional-style manual analysts
Traders marking Mean Thresholds, or Quarter Levels of OBs, FVGs, Wicks etc
Anyone who wants a clean, reliable way to preserve their manual analysis

Bardhi's ICT Killzone & PivotsThis indicator is a complete ICT-style session and liquidity toolkit designed for precision trading. It automatically marks the most important trading windows (“Killzones”) and provides powerful tools for tracking price action around them.
Key Features:
Killzones: Automatically plots Asia, London, and New York (AM, Lunch, PM) sessions with customizable colors, transparency, and labels.
Session Highs, Lows & Midpoints: Dynamic lines for killzone highs/lows, optional midpoints, and alerts when levels are broken.
Range Statistics: Displays the real-time range of each session plus rolling averages in a customizable table.
Day / Week / Month Levels: Plots opens, highs, lows, and separators for higher-timeframe reference points with optional alerts.
Custom Opening Prices: Define up to 8 custom open lines (e.g., True Day Open, 06:00, 10:00) with cutoff times.
Vertical Timestamp Lines: Highlight important intraday times such as news events or personal strategy triggers.
Day-of-Week Labels: Clean labels for each day, with the option to hide weekends.
Full Customization: Adjustable label sizes, colors, line styles, transparency, and drawing limits.
Why Use It?
This tool combines killzone sessions, pivots, higher-timeframe opens/highs/lows, and range statistics into one clean, automated package. It saves time drawing manually, keeps charts organized, and helps traders apply ICT concepts consistently.

STOCK EXCHANGE + SILVER BULLET FRAMESThis script is an updated version of the " NY/LDN/TOK Stock Exchange Opening Hours " script.
Objective
Displays global stock exchange sessions (New York, London, Tokyo) with session frames, highs/lows, and opening lines. Includes ICT Silver Bullet windows (NY, London, Tokyo) with configurable shading. Past sessions are frozen at close, ongoing sessions update dynamically until closure, and upcoming sessions are pre-drawn. Fully customizable with options for weekends, labels, padding, opacity, and individual session toggles.
It is designed to help traders quickly interpret market context, liquidity zones, and session-based price behavior.
Main Features
Past sessions (historical data)
• Session Frames:
• Each box is frozen at the session’s close.
• The left edge aligns with the opening time, while the right edge is fixed at the closing time.
• The top and bottom reflect the highest and lowest prices during the session.
• Session Labels:
• Names (NY, LDN, TOK) displayed above the frame, aligned left, in the same color as the frame.
• Opening Lines:
• Vertical dotted lines mark the start of each session.
Ongoing and upcoming sessions (live market)
• Dynamic Session Frames:
• The right edge is locked at the future close time.
• The top and bottom update in real time as new highs and lows form.
• Labels and Lines:
• The session label is visible above the active frame.
• Opening lines are drawn as soon as the session begins.
Silver Bullet Time Windows (ICT concept)
• Highlights key liquidity windows within sessions:
• New York: 10:00–11:00 and 14:00–15:00
• London: 08:00–09:00
• Tokyo: 09:00–10:00
• Silver Bullet zones are shaded with configurable opacity (default 5%).
Customization and Options
• Enable or disable individual sessions (NY, London, Tokyo).
• Toggle weekend display (frames and Silver Bullets).
• Adjust label size, padding, and text visibility.
• Control frame opacity (default 0%).
• Optimized memory management with automatic pruning of old graphical objects.

Silver BulletSilver Bullet is a trading tool built for finding cleaner, higher-probability setups. It focuses on key windows of market movement and adds helpful tools like daily range levels and candlestick patterns.
Whether you’re trading breakouts or reversals, Silver Bullet gives you a clearer view of the market and more confidence in your setups.
⸻
🔹 Trading Setup #1: Macro Time
The Macro Time setting offers two modes: Macro Bullet and Silver Bullet. Both help traders focus on specific times when the market tends to deliver clean moves.
• Macro Bullet is based on the high and low of a full macro session. It automatically detects the session’s range and bias, then offers optimal entries for either Long or Short setups. Once the session resolves, it provides Fibonacci-based levels for entry, target, and stop loss.
• Silver Bullet is based on ICT concepts and focuses on the hourly range for London, NY AM, and NY PM sessions. It’s designed for quick time blocks and highlights key levels as the session unfolds.
To use this setup, set Macro Time to “ICT Sessions” and select your preferred mode under Bullet Mode.
⸻
🔹 Trading Setup #2: Daily Range
Enable Daily Range to draw Fibonacci levels based on either the previous day’s candle or the current day’s developing range. These levels help you identify potential support, resistance, and midpoint zones throughout the day.
With the current day’s range, levels automatically update in real time as new highs or lows form — keeping your chart aligned with evolving price action.
⸻
🔹 Trading Setup #3: Candlestick Patterns
Turn on Candlestick Patterns to automatically highlight clean reversal signals such as Hammers, Hanging Men, Shooting Stars, and Tweezers. Each pattern is detected using specific criteria and trend filters to reduce noise and improve reliability. They work especially well as confirmation signals around key levels or session zones.
Silver Bullet brings structure, clarity, and precision to your intraday trading. By combining time-based bias, price action levels, and pattern recognition, it helps you trade with purpose — not guesswork. Use one setup or combine all three for a complete view of the market, tailored to your style and session of choice.

SMC ICT – Simplified Daily Trend & Reversal AnalyzerThis Pine Script provides a simplified approach to analyzing daily trends and potential reversals using concepts inspired by Smart Money Concepts (SMC) and ICT (Inner Circle Trader).
What It Does:
• Detects daily uptrend and downtrend conditions by comparing the current daily high/low to the previous day’s values.
• Highlights potential bullish or bearish reversal zones when price behavior suggests a shift in sentiment.
• Automatically draws dashed lines for the previous day's high and low.
• Labels these high/low levels for quick visual reference.
How to Use:
Apply this indicator to any timeframe chart. Use the plotted trend markers to assess daily direction and potential reversal signals. The dashed lines (previous high/low) can be used as reference points for liquidity zones or break/retest entries.
User Interface:
The indicator displays labels and shapes in English. This script is intended for educational and trading workflow enhancement purposes.
Note:
This is an open-source tool designed for clarity and basic SMC/ICT application. It is best used in combination with other confluences like FVGs, order blocks, and liquidity sweeps.
