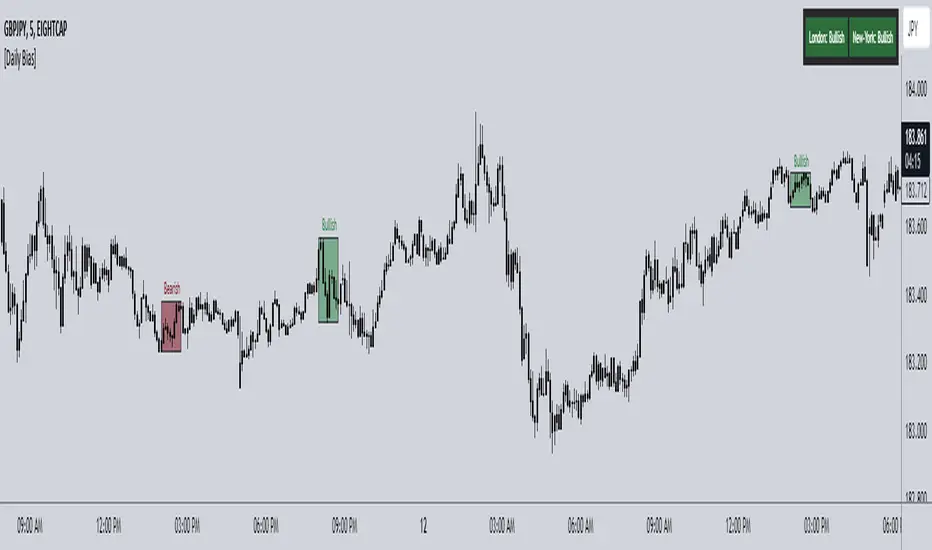
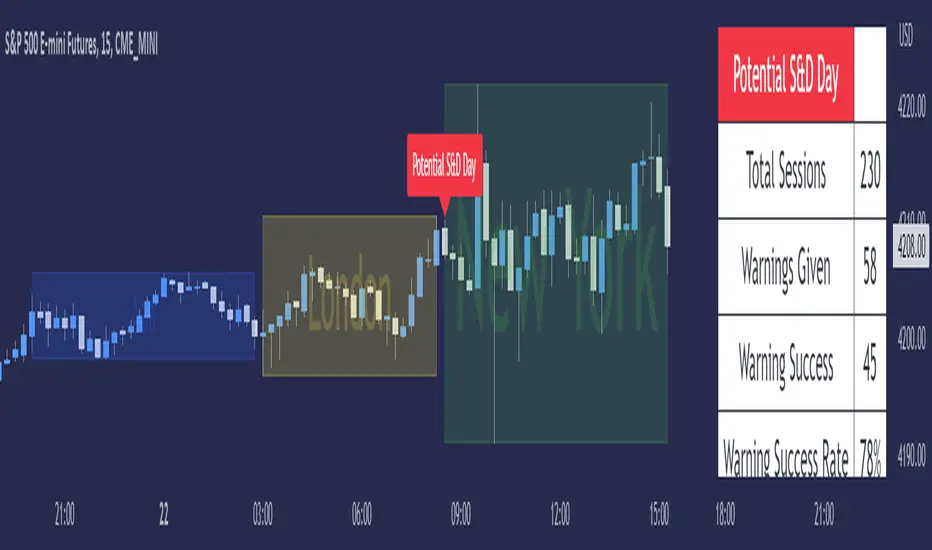
ICT CISD+FVG+OBThis script is a high-performance ICT suite designed for traders who want a professional, "noise-free" chart. It identifies core institutional patterns—Order Blocks, Fair Value Gaps, and Changes in State of Delivery (CISD)—across multiple timeframes.
The script features a proprietary Proximity Cleanup Engine that automatically deletes old or broken levels, keeping your workspace focused only on price action that is currently tradeable. It strictly follows directional delivery rules for CISD and includes a 50-candle "freshness" limit to ensure you never have to manually clear old data from your past bars.
Core Features
Intelligent CISD: Only triggers Bullish CISD on green candles and Bearish CISD on red candles.
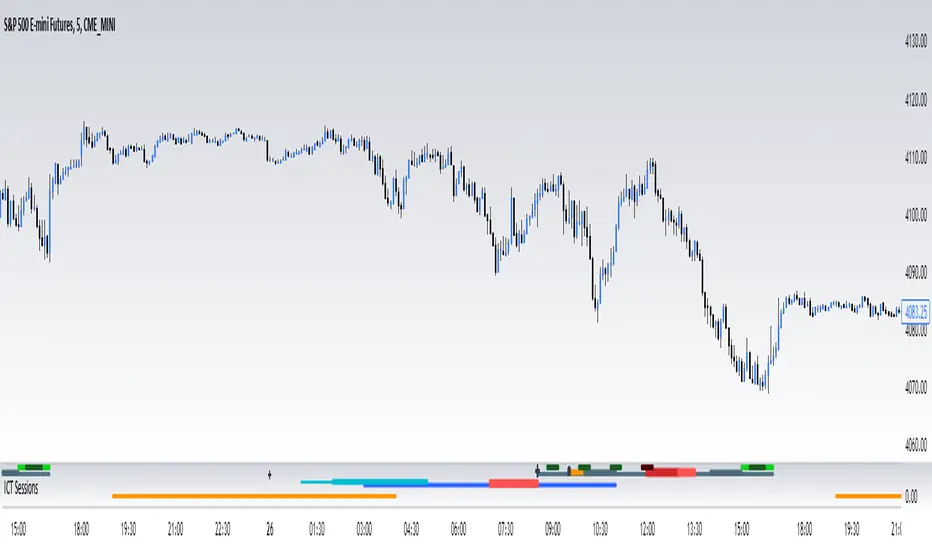
Proximity Filter: Automatically wipes away any levels that are "miles away" from the current price.
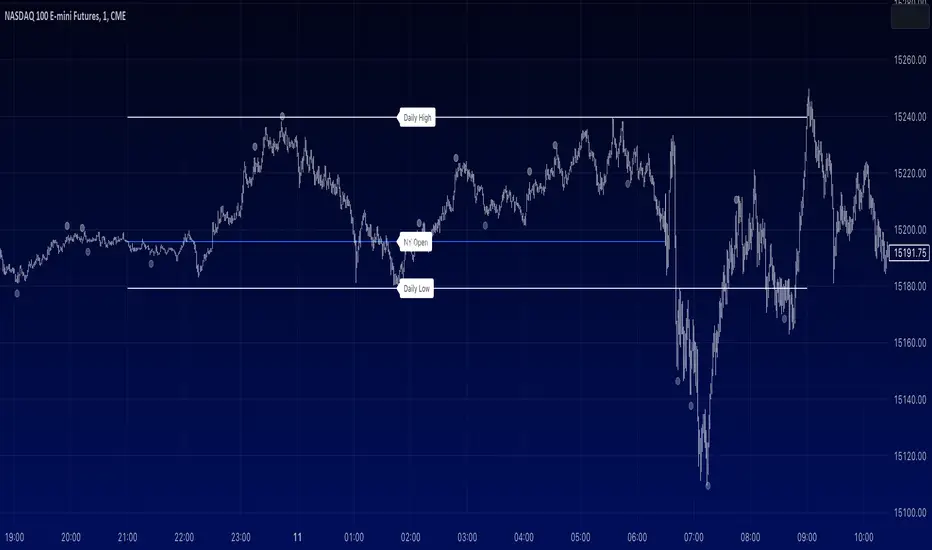
Clean Workspace: Removes broken session highs/lows and mitigated zones instantly.
Full Customization: Toggle visibility and colors for every component via the settings menu.
مؤشر Pine Script®