DR/IDR Case Study [TFO]This indicator was made to backtest the DR / IDR concept (Defining Range / Implied Defining Range). There is only one built in DR session, but it can be changed to fit whatever session you like. Just make sure that the beginning time of the Session parameter matches the end time of the Defining Range parameter.
I'm not trying to validate or invalidate the claims of the DR concept, as the sample size of the success rate from this indicator is likely significantly smaller than that of the backtests where the initial success rates were derived. I'm simply sharing this indicator to encourage others to do their own due diligence by collecting their own data before implementing new concepts in their trading. Likewise I'm also making this open source for those who wish to do different kinds of backtesting and extract more value from this concept - for example, what percentage of the time does the session actually close further from the DR after initially closing through the range? Data like this could be good to track for those looking to make a trading model out of the DR concept.
Please note that all times are set to the "America/New_York" time zone by default. Besides the fact that the input times will use New York local time, this also means that they automatically adjust for Daylight Savings (this only impacts areas that do not observe Daylight Savings).
ابحث في النصوص البرمجية عن "implied"

DR/IDR Candles [LuxAlgo]This indicator displays defining ranges (DR) and implied defining ranges (IDR) constructed from two user set sessions (RDR/ODR) as graphical candles on the chart. The script introduces additional graphical elements to the original DR/IDR concept and as such can be thought as a graphical method in addition to a technical indicator.
Additionally, this script can display various Fibonacci retracements from the constructed DR/IDR if enabled within the settings.
Settings
Regular Session: Enable/disable regular session's DR/IDR alongside setting the session time. By default, 09:30 - 10:30 am.
Overnight Session: Enable/disable overnight session's DR/IDR alongside setting the session time. By default, 03:00 - 04:00 am.
UTC Offset: UTC offset for the time zone, by default -5 (EST)
Retracements
Reverse: Inverts source range upper/lower value for constructing the retracements.
From: Source range used to construct the retracements, by default DR is used.
By default, the 0.5 retracement (average line) is displayed.
Usage
The used sessions are highlighted by a gray background. DRs are highlighted by dashed lines while IDRs are highlighted by solid ones. The maximum/minimum price between each user set session is highlighted by solid wicks.
The color of the DRs/IDRs/wicks are determined by the price position relative to the DR; if price is above the DR maximum, then a blue color is used. If price is below, then an orange color is used, and if price is within the DR range, then a gray color is used.
Additionally, the area of the DR range is used to highlight the number of time price is located within the DR, with a longer background highlighting a higher number of occurrences. This can help highlight if the DR levels were potentially useful as support/resistance.
When price is outside the IDR range, the area between the price and IDR is highlighted, in blue if price is above the IDR, and orange if it is under.
The original author of the DR/IDR concept describes 3 rules using the price position relative to the DR/IDR levels:
1.) If price on the 5-minute timeframe closes above the DR high after 10:30 AM or 04:00 AM then the DR low will likely be the low of the trading session.
2.) If price on the 5-minute timeframe closes below the DR low after 10:30 AM or 04:00 AM then the DR high will likely be the high of the trading session.
3.) If price closes above the IDR high after 10:30 AM or 04:00 AM it is an early indication that the low of the DR will be the low of the day and vice versa.
We can see that the above rules are cases of conditional probabilities.
There is no significant data supporting or regarding any statistical probability of the above rules to be true, which are more than uncertain given the stochastic nature of prices. The lack of precision of these rules is also a concern (time zone dependance, applicable markets, etc...).
Credits
Credits to trader TheMas7er who originally created the DR/IDR concept in November of 2022. This script was derived from his proposed session times & rules for trading.

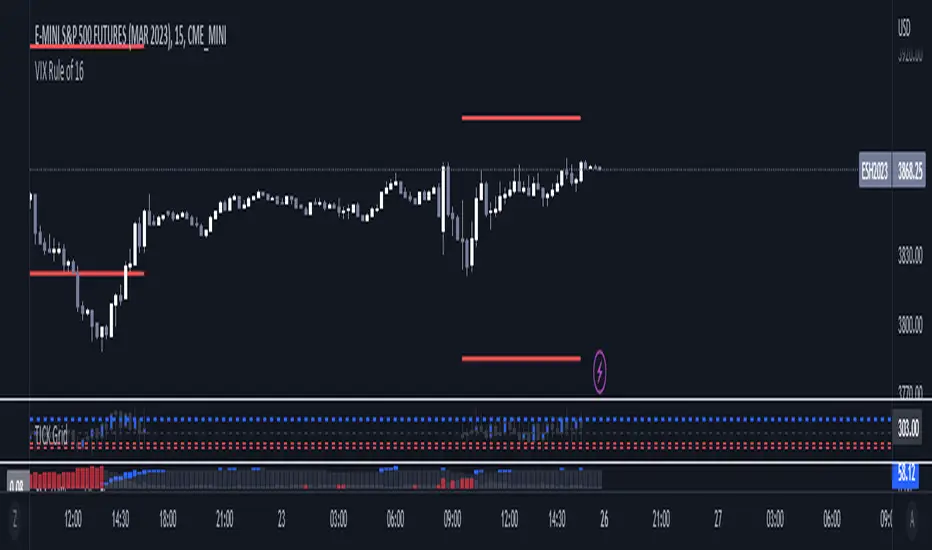
VIX Rule of 16There’s an interesting aspect of VIX that has to do with the number 16. (approximately the square root of the number of trading days in a year).
In any statistical model, 68.2% of price movement falls within one standard deviation (1 SD ). The rest falls into the “tails” outside of 1 SD .
When you divide any implied volatility (IV) reading (such as VIX ) by 16, the annualized number becomes a daily number
The essence of the “rule of 16.” Once you get it, you can do all sorts of tricks with it.
If the VIX is trading at 16, then one-third of the time, the market expects the S&P 500 Index (SPX) to trade up or down by more than 1% (because 16/16=1). A VIX at 32 suggests a move up or down of more than 2% a third of the time, and so on.
• VIX of 16 – 1/3 of the time the SPX will have a daily change of at least 1%
• VIX of 32 – 1/3 of the time the SPX will have a daily change of at least 2%
• VIX of 48 – 1/3 of the time the SPX will have a daily change of at least 3%
DR/IDR V1Defining Range DR and Implied Defining Range IDR for regular Session and overnight Session
This script is showing the IDR and DR for the regular trading session and for the overnight session based on the rules from the creator of the DR/IDR concept.
It works for all major Forex Pairs, BTC, ETH and the US Equity indices. This concept is based on rules and has a 80 % probability to be correct.
It should be applied in the 5 Min. Timeframe.
The timings for the RDR are from 09.30 - 10.30 am New York local time.
The timings for the ODR are from 03.00 - 04.00 am New York local time.
Rules:
1. If price in the 5 Min timeframe closes above the DR high after 10.30 am or 04.00 am then the DR low will be with 80 percent probability the low of the trading session. This is called confirmation.
2. If price in the 5 Min timeframe closes below the DR low after 10.30 am or 04.00 am then the DR high will be with 80 percent probability the high of the trading session. This is called confirmation.
3. If price closes above the IDR high after 10.30 am or 04.00 am it is an early indication that the low of the DR will be the low of the day and vice versa.
Credits:
This script imports the recently published (VisibleChart) library containing functions that return values calculated from the range of visible bars on the chart.
bmistiaen helped me a lot with this script. Thank you a lot.

TheMas7er scalp (US equity) 5min [promuckaj]This indicator was created according to TheMas7er's trading setup, that he reveal after 18 years of working in the industry. Claims is that this setup should give you good probability to predict the price movement for US equity.
This trading setup is only for New York equity trading session from 09:30 until 4pm. The market in which you should use it are the S&P 500 , Dow Jones, and Nasdaq. Perhaps it will work on some other but for those are good according to tests. It should not used on days with high-impact news, like CPI , FOMC, NFP and so on. The model can still work there but the probability on these days is way lower.
What is the base of this indicator, it marks what is called "The Defining Range"("DR"). This defining range is from 09:30am until 10:30am New York local time, it takes those 12 candles in the 5min chart. Indicator will mark the high and low of this range, including wicks. This will help you to already know at 10:30am, with possible good probability the high or low of the day.
There is also the "Implied Defining Range"("iDR") lines inside the "DR" range, which mark the highest body and the lowest body in the "DR" range.
*The rules (it is very simple to follow):
Chart must be set in 5min timeframe.
At 10:30am you still don't know which one will be the real high or low of the day, but only one will be true.
If price is closing on 5min chart above the "DR" it should give you good probability that the low of the "DR" is the low of the day, and vice versa - if price is closing below the "DR" it should give you good probability that the high of the "DR" is the high of the day.
"iDR" gives you an early indication about what high or low of the day should be. If price is closing above "iDR" you will have an early indication that the low of the "DR" should be the low of the day, and vice versa.
Note that about closing means really closing above or below, not just wicks.
Now, after this you can realize the magnitude of possibility.
You can use any entry model you prefer to trade, it doesn't matter if you use ICT concepts, smart money concepts, volume profile , eliot waves, braking the structure concept or whatever. There are so many possibilities for trading within this rule.
Enjoy!

Williams Vix Fix ultra complete indicator (Tartigradia)Williams VixFix is a realized volatility indicator developed by Larry Williams, and can help in finding market bottoms.
Indeed, as Williams describe in his paper, markets tend to find the lowest prices during times of highest volatility, which usually accompany times of highest fear. The VixFix is calculated as how much the current low price statistically deviates from the maximum within a given look-back period.
Although the VixFix originally only indicates market bottoms, its inverse may indicate market tops. As masa_crypto writes : "The inverse can be formulated by considering "how much the current high value statistically deviates from the minimum within a given look-back period." This transformation equates Vix_Fix_inverse. This indicator can be used for finding market tops, and therefore, is a good signal for a timing for taking a short position." However, in practice, the Inverse VixFix is much less reliable than the classical VixFix, but is nevertheless a good addition to get some additional context.
For more information on the Vix Fix, which is a strategy published under public domain:
* The VIX Fix, Larry Williams, Active Trader magazine, December 2007, web.archive.org
* Fixing the VIX: An Indicator to Beat Fear, Amber Hestla-Barnhart, Journal of Technical Analysis, March 13, 2015, ssrn.com
* Replicating the CBOE VIX using a synthetic volatility index trading algorithm, Dayne Cary and Gary van Vuuren, Cogent Economics & Finance, Volume 7, 2019, Issue 1, doi.org
Created By ChrisMoody on 12-26-2014...
V3 MAJOR Update on 1-05-2014
tista merged LazyBear's Black Dots filter in 2020:
Extended by Tartigradia in 10-2022:
* Can select a symbol different from current to calculate vixfix, allows to select SP:SPX to mimic the original VIX index.
* Inverse VixFix (from masa_crypto and web.archive.org)
* VixFix OHLC Bars plot
* Price / VixFix Candles plot (Pro Tip: draw trend lines to find good entry/exit points)
* Add ADX filtering, Minimaxis signals, Minimaxis filtering (from samgozman )
* Convert to pinescript v5
* Allow timeframe selection (MTF)
* Skip off days (more accurate reproduction of original VIX)
* Reorganized, cleaned up code, commented out parts, commented out or removed unused code (eg, some of the KC calculations)
* Changed default Bollinger Band settings to reduce false positives in crypto markets.
Set Index symbol to SPX, and index_current = false, and timeframe Weekly, to reproduce the original VIX as close as possible by the VIXFIX (use the Add Symbol option, because you want to plot CBOE:VIX on the same timeframe as the current chart, which may include extended session / weekends). With the Weekly timeframe, off days / extended session days should not change much, but with lower timeframes this is important, because nights and weekends can change how the graph appears and seemingly make them different because of timing misalignment when in reality they are not when properly aligned.

VIX Implied rangeVIX Range, the difference between this and VIX range estimate Is that this Is using calendar days(how options are priced) rather than trading days.
vol_coneDraws a volatility cone on the chart, using the contract's realized volatility (rv). The inputs are:
- window: the number of past periods to use for computing the realized volatility. VIX uses 30 calendar days, which is 21 trading days, so 21 is the default.
- stdevs: the number of standard deviations that the cone will cover.
- periods to project: the length of the volatility cone.
- periods per year: the number of periods in a year. for a daily chart, this is 252. for a thirty minute chart on a contract that trades 23 hours a day, this is 23 * 2 * 252 = 11592. for an accurate cone, this input must be set correctly, according to the chart's time frame.
- history: show the lagged projections. in other words, if the cone is set to project 21 periods in the future, the lines drawn show the top and bottom edges of the cone from 23 periods ago.
- rate: the current interest or discount rate. this is used to compute the forward price of the underlying contract. using an accurate forward price allows you to compare the realized volatility projection to the implied volatility projections derived from options prices.
Example settings for a 30 minute chart of a contract that trades 23 hours per day, with 1 standard deviation, a 21 day rv calculation, and half a day projected:
- stdevs: 1
- periods to project: 23
- window: 23 * 2 * 21 = 966
- periods per year: 23 * 2 * 252 = 11592
Additionally, a table is drawn in the upper right hand corner, with several values:
- rv: the contract's current realized volatility.
- rnk: the rv's percentile rank, compared to the rv values on past bars.
- acc: the proportion of times price settled inside, versus outside, the volatility cone, "periods to project" into the future. this should be around 65-70% for most contracts when the cone is set to 1 standard deviation.
- up: the upper bound of the cone for the projection period.
- dn: the lower bound of the cone for the projection period.
Limitations:
- pinescript only seems to be able to draw a limited distance into the future. If you choose too many "periods to project", the cone will start drawing vertically at some limit.
- the cone is not totally smooth owing to the facts a) it is comprised of a limited number of lines and b) each bar does not represent the same amount of time in pinescript, as some cross weekends, session gaps, etc.

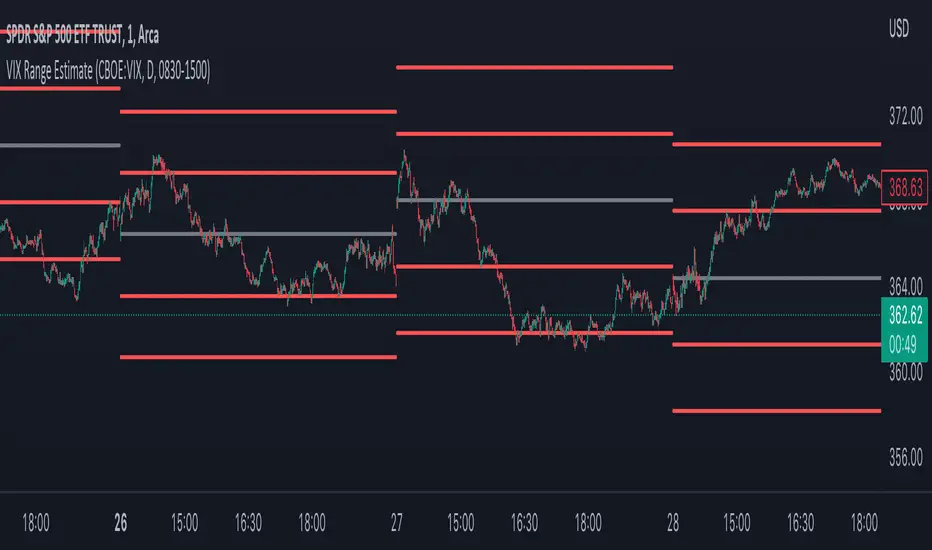
Daily/Weekly ExtremesBACKGROUND
This indicator calculates the daily and weekly +-1 standard deviation of the S&P 500 based on 2 methodologies:
1. VIX - Using the market's expectation of forward volatility, one can calculate the daily expectation by dividing the VIX by the square root of 252 (the number of trading days in a year) - also know as the "rule of 16." Similarly, dividing by the square root of 50 will give you the weekly expected range based on the VIX.
2. ATR - We also provide expected weekly and daily ranges based on 5 day/week ATR.
HOW TO USE
- This indicator only has 1 option in the settings: choosing the ATR (default) or the VIX to plot the +-1 standard deviation range.
- This indicator WILL ONLY display these ranges if you are looking at the SPX or ES futures. The ranges will not be displayed if you are looking at any other symbols
- The boundaries displayed on the chart should not be used on their own as bounce/reject levels. They are simply to provide a frame of reference as to where price is trading with respect to the market's implied expectations. It can be used as an indicator to look for signs of reversals on the tape.
- Daily and Weekly extremes are plotted on all time frames (even on lower time frames).

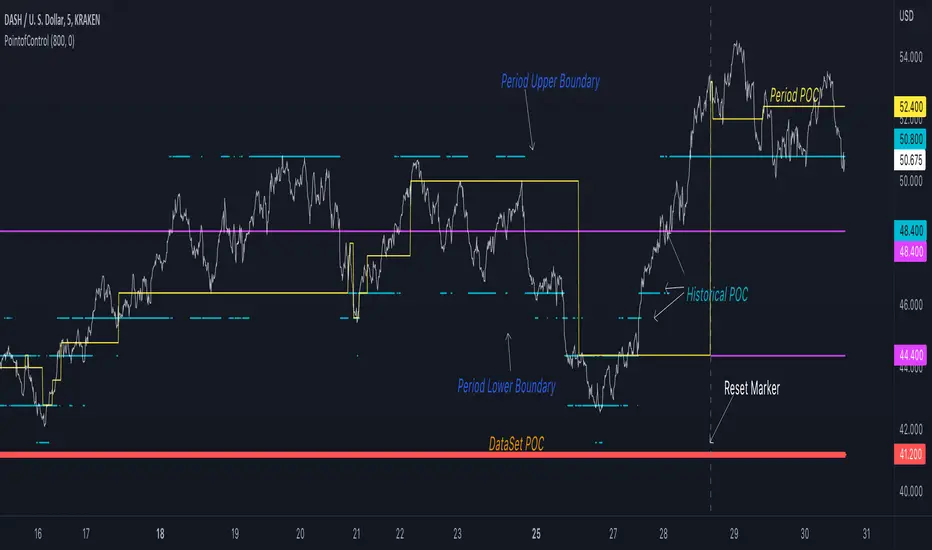
Point of Control V2 The genesis of this project was to create a POC library that would be available to deliver volume profile information via pine to other scripts of indicators and strategies.
This is a republish of an invite only script to open access
This is the indicator version of the library function.
A few points of significance:
- Allows the choice of reset of the study period, day/week or bars. This is simple enough to expand to other conditions
- Bar count resets starting from the beginning of the data set (bar index =0) vs bars back from the end of the data set
- A 'period' in this context is the time between resets - the start of the POC (eg. start of Day or Week) until it resets (for example at the beginning of a next day or week)
- Automates the determination of the increment level rather than the user specifying ticks or price brackets
- Does not allow for setting the # of rows and then calculating the implied price increment levels
- When a period is complete it is often useful to look back at the POCs of historical periods, or extend them forward.
- This script will find the historical POCs around the current price and display them rather than extend all the historical POC lines to the right
- This script also looks across all the period POCs and identifies the master POC or what I call the Grand POC, and also the next 3 runner up POCs
This indicator is also available as a library.
BINANCE:BTCUSDT NSE:NIFTY OANDA:XAUUSD NASDAQ:AAPL TVC:USOIL

PointofControlLibrary "PointofControl"
POC_f()
The genesis of this project was to create a POC library that would be available to deliver volume profile information via pine to other scripts of indicators and strategies.
This is the indicator version of the library function.
A few things that would be unique with the built in
- it allows you to choose the kind of reset of the period, day/week or bars. This is simple enough to expand to other conditions
- it resets on bar count starting from the beginning of the data set (bar index =0) vs bars back from the end of the data set
- A 'period' in this context is the time between resets - the start of the POC until it resets (for example at the beginning of a new day or week)
- it will calculate an increment level rather than the user specifying ticks or price brackets
- it does not allow for setting the # of rows and then calculating the implied price levels
- When a period is complete it is often useful to look back at the POCs of historical periods, or extend them forward.
- This script will find the historical POCs around the current price and display them rather than extend all the historical POC lines to the right
- This script also looks across all the period POCs and identifies the master POC or what I call the Grand POC, and also the next 3 runner up POCs
There is a matching indicator to this library
EuroDollar Curve Implied 3M RateChart shows the Eurodollar futures prices latest prices from Sep 22 onwards. Display logic based on LongFiats code. This needs to be readjusted manually every 3 months whenever the front-month expires. Good tool to see where professional eurodollar futures think interest rates will be over the next few years. Check regularly as sentiment changes.

Trading Made Easy Pressure OscillatorAs always, this is not financial advice and use at your own risk. Trading is risky and can cost you significant sums of money if you are not careful. Make sure you always have a proper entry and exit plan that includes defining your risk before you enter a trade.
Those who have looked at my other indicators know that I am a big fan of Dr. Alexander Elder and John Carter. This is relevant to my trading style and to this indicator in general. While I understand it goes against TradingView rules generally to display other indicators while describing a new one, I need the Bollinger Bands, Bollinger Bands Width, and a secondary directional indicator to explain the full power of this indicator. In short, if this is strongly against the rules, I will edit the post as needed.
Those of you who are aware of John Carter are going to know this already, but for those who don’t, an explanation is necessary. John Carter is a relatively famous retail-turned-institutional (sort of) trader. He is the founder of TradetheMarkets, that later turned into SimplerTrading. Him and his company have a series of YouTube videos, he has made appearances on the MoneyShow, TastyTrade, and has authored a couple of books about trading. However, he is probably most famous for his “Squeeze” indicator that was originally launched on Thinkorswim and through his website but has now been incorporated into several trading platforms and even has a few open-source versions available here. In short, the Squeeze indicator looks to identify periods of consolidation and marry that with a momentum oscillator so you can position yourself in a quiet period before a large move. This in my opinion, is one of the best indicators an option trader can have, since options are priced both on time and volatility. To do this, the Squeeze identifies when the Bollinger Bands, a measure of price standard deviation, have contracted inside the Keltner Channels (a measure of the average range of a stock). This highlights something known as “the Squeeze”, when the 2x standard deviations (95% of all likely price movement using data from the past 20 periods) is less than the 1.5x average true range (ATR) of the stock over the same number of periods. These periods are when a stock is resting and in a period of consolidation and is generally followed by another large move once it has rested long enough. The momentum oscillator is used to determine the direction of this next move.
While I think this is one of the best indicators ever made, it is not without its pitfalls. I find that the “Squeeze” periods sometimes take too long to setup (something that was addressed by John and released in a new indicator, the Squeeze Pro, but even that is still slowish) and that the momentum oscillator was also a bit slow. They used a linear regression formula to track momentum, which can lag considerably at times. Collectively, this meant that getting into moves a few candles late was not uncommon or someone solely trading squeeze setups could have missed very good trade opportunities.
To improve on this, I present, the Trading Made Easy Pressure Oscillator. This more accurately identifies when volatility is reducing and the trading range is likely to contract, increasing the “pressure” on the price. This is often marked several candles before a “Squeeze” has started. To identify these ranges, I applied a 21-period exponential moving average to the Bollinger Bands Width indicator (BBW). As mentioned above, the Bollinger Bands measure the 2x standard deviation of price, typically based on a 20-period SMA. When the BBs expand, it marks periods of high volatility, when they contract, conversely, periods of low volatility. Therefore, applying an EMA to the BBW indicator allows us to confidently mark when volatility has slowed down earlier than traditional methods. The second improvement I made was using the Absolute Price oscillator instead of a linear regression-style oscillator. The APO is very similar to a MACD, it measures the difference between two exponential moving averages, here the 8 and 21 (Fibonacci EMAs). However, I find the APO to be smoother than the MACD, yet more reactive than the linear regression-style oscillators to get you into moves earlier.
Uses:
1) Buying before a bigger than expected move. This is especially relevant for options traders since theta decay will often eat away much of our profits while we wait for a large enough price move to offset the time decay. Here, we buy a call option/shares when the momentum oscillator matches the longer-term trend (i.e. the APO crosses over the zero line when price is above the 200-day EMA, and vice versa for puts/shorting the stock). This coincides with Dr. Elder’s Triple Screen Trading System, that we are aligning ourselves with the path of least resistance. We want to do this when price is currently in an increasing pressure situation (i.e. volatility is contracting) to make sure we are buying an option when premium and Implied Volatility is low so we can get a better price and have a better risk to reward ratio. Low volatility is denoted by a purple dot, high volatility a blue dot along the midline of the indicator. A scalper or short-term swing trader may look to exit when the blue dots turn purple signalling a likely end to a move. A longer-term trend trader can look to other exit scenarios, such as a cross of the oscillator below the zero line, signalling to go short, or using a moving average as a trailing stop.
2) Sell premium after a larger than expected move has finished. After a larger than expected move has completed (a series of blue dots is followed by a purple dot), use this time to sell theta-driven options strategies such as straddles, strangles, iron condors, calendar spreads, or iron butterflies, anything that benefits from contracting volatility and stagnating prices. This is useful here since reducing volatility typically means a contraction of prices and the reduced likelihood of a move outside of the normal range.
3) Divergences. This indicator is sensitive enough to highlight divergences. I personally don’t use it as such as I prefer to trend trade vs. reversion trade. Use at your own risk, but they are there.
In summary, this indicator improves upon the famous Squeeze indicator by increasing the speed at which periods of consolidation are marked and trend identification. I hope you enjoy it.

MS VIX Bull ReversalThis script measures the rebound of the implied volatility of the S&P 500 index options from an excessive panic zone. The IV starts a reversion to the mean as soon as profit taking from the hedge begins. The assumption behind it: this rebound indicates at least the beginning of a countermovement, in uptrends the end of the correction and the trend continuation.

VolatilityDivergenceRedGreen by STTAName: VolatilityDivergenceRedGreen by STTA
- Underlying and implied volatiliy normally show negative correlated behavior (price rises, vola falls and vice versa)
- This study shows symbols in on candles in chart where Undelying and corresponding vola index show same bahvior for 1,2 or 3 consecutive bars. (price rises and vola rises and vice versa)
- This situation is called Vola Divergence. Red, when prices and vola fall; green, when price and vola rise
- This information can be used to detect possible end of Up/Down-Swings.
- User can configure if rising or falling or both price movements shall be displayed.
- This study can be used with root symbols, which provide corresponding volatility indices.
- supported Root Symbols: SPX, NDQ, DJI, RUT, CL, XLE, GC, SI, EUR, HSI, FXI, EWZ, AMZN, AAPL, GS, GOOG, IBM, DEU40
- in all other symbols, no symbols are displayed.
Inputs
- underlying displayed in chart
Settings/Parameter
- each Divergence can be switched off/on separately
- output of each displayed symbol can be configured
Outputs
- RedDiv1: first bar with rising price and rising volatility index
- GreenDiv1: first bar with falling price and falling volatility index
- RedDiv2: second bar in a row with rising price and rising volatility index
- GreenDiv2: second bar with falling price and falling volatility index
- RedDiv3: third bar in a row with rising price and rising volatility index
- GreenDiv3: third bar in a row with falling price and falling volatility index

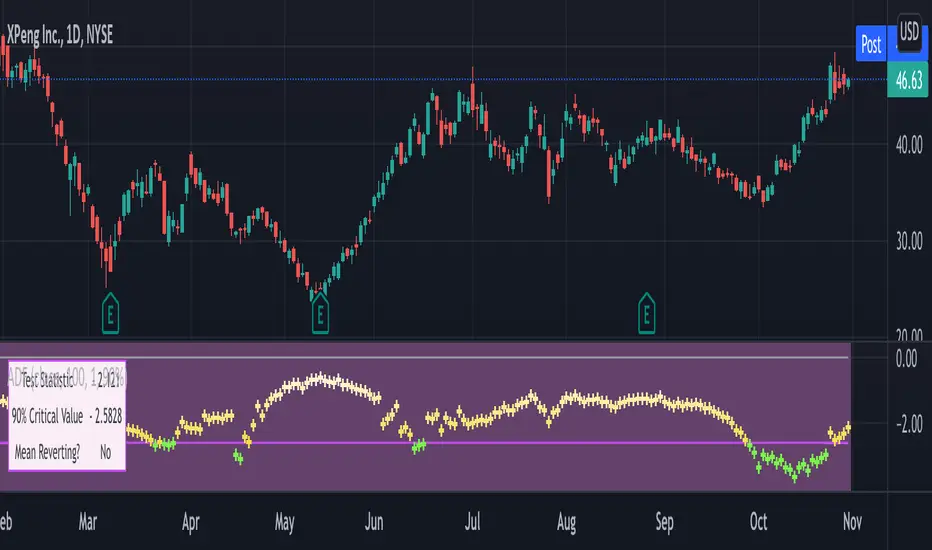
Augmented Dickey–Fuller (ADF) mean reversion testThe augmented Dickey-Fuller test (ADF) is a statistical test for the tendency of a price series sample to mean revert .
The current price of a mean-reverting series may tell us something about the next move (as opposed, for example, to a geometric Brownian motion). Thus, the ADF test allows us to spot market inefficiencies and potentially exploit this information in a trading strategy.
Mathematically, the mean reversion property means that the price change in the next time period is proportional to the difference between the average price and the current price. The purpose of the ADF test is to check if this proportionality constant is zero. Accordingly, the ADF test statistic is defined as the estimated proportionality constant divided by the corresponding standard error.
In this script, the ADF test is applied in a rolling window with a user-defined lookback length. The calculated values of the ADF test statistic are plotted as a time series. The more negative the test statistic, the stronger the rejection of the hypothesis that there is no mean reversion. If the calculated test statistic is less than the critical value calculated at a certain confidence level (90%, 95%, or 99%), then the hypothesis of a mean reversion is accepted (strictly speaking, the opposite hypothesis is rejected).
Input parameters:
Source - The source of the time series being tested.
Length - The number of points in the rolling lookback window. The larger sample length makes the ADF test results more reliable.
Maximum lag - The maximum lag included in the test, that defines the order of an autoregressive process being implied in the model. Generally, a non-zero lag allows taking into account the serial correlation of price changes. When dealing with price data, a good starting point is lag 0 or lag 1.
Confidence level - The probability level at which the critical value of the ADF test statistic is calculated. If the test statistic is below the critical value, it is concluded that the sample of the price series is mean-reverting. Confidence level is calculated based on MacKinnon (2010) .
Show Infobox - If True, the results calculated for the last price bar are displayed in a table on the left.
More formal background:
Formally, the ADF test is a test for a unit root in an autoregressive process. The model implemented in this script involves a non-zero constant and zero time trend. The zero lag corresponds to the simple case of the AR(1) process, while higher order autoregressive processes AR(p) can be approached by setting the maximum lag of p. The null hypothesis is that there is a unit root, with the alternative that there is no unit root. The presence of unit roots in an autoregressive time series is characteristic for a non-stationary process. Thus, if there is no unit root, the time series sample can be concluded to be stationary, i.e., manifesting the mean-reverting property.
A few more comments:
It should be noted that the ADF test tells us only about the properties of the price series now and in the past. It does not directly say whether the mean-reverting behavior will retain in the future.
The ADF test results don't directly reveal the direction of the next price move. It only tells wether or not a mean-reverting trading strategy can be potentially applicable at the given moment of time.
The ADF test is related to another statistical test, the Hurst exponent. The latter is available on TradingView as implemented by balipour , QuantNomad and DonovanWall .
The ADF test statistics is a negative number. However, it can take positive values, which usually corresponds to trending markets (even though there is no statistical test for this case).
Rigorously, the hypothesis about the mean reversion is accepted at a given confidence level when the value of the test statistic is below the critical value. However, for practical trading applications, the values which are low enough - but still a bit higher than the critical one - can be still used in making decisions.
Examples:
The VIX volatility index is known to exhibit mean reversion properties (volatility spikes tend to fade out quickly). Accordingly, the statistics of the ADF test tend to stay below the critical value of 90% for long time periods.
The opposite case is presented by BTCUSD. During the same time range, the bitcoin price showed strong momentum - the moves away from the mean did not follow by the counter-move immediately, even vice versa. This is reflected by the ADF test statistic that consistently stayed above the critical value (and even above 0). Thus, using a mean reversion strategy would likely lead to losses.
TradingGroundhog - Strategy & Fractal V1#-- Public Strategy - No Repaint - Fractals -- Short term
Here I come with another script, more simple than Wavetrend V1. You will love it.
#-- Synopsis --
Another simple idea, on a small time frame (15 min) we buy when the opening price goes below a Bottom fractals and sell when it goes over a Top fractals, but as this script do not use Wavetrends. You should stop by your self to use the script during long lasting downtrends.
I developed the strategy using BTC /EUR 3 MIN BINANCE but it can be applied to many other cryptos, I don't know for forex or others. You can use it for short term (to a month of uptrend) and automated trading.
#-- Graph reading --
And now, how to read it ?
Fractals:
Yellow Flags occur when the opening price goes below a Bottom fractal , it means Buy.
White Flags appear when the opening price goes over a Top fractal , it means Sell.
#-- Parameters --
*** Parameters have been intensively optimized using 10 cryptocurrency markets in order to have potent efficiency for each of them. I would recommend to only change the Can Be touch parameter. For the others, I don't recommend any modifications. The idea behind the script is to be able to switch between markets without having to optimize parameters, less work, easy to target active crypto and therefor limit the risks. ***
Can be touch :
'Filter fractals' : Activate or Disable the filtering fractal operation. If Enable, buy during less risky periods. (Activate is often better)
Can be touch but not necessary :
'VolumeMA' : The Volume corrector used by the fractals
'Extreme window' : The number of price individuals to look for if we want to remove extreme fractals.
Not to touch :
'Long Sop Loss (%)' : The minimal difference of price between a Fractal bottom and the opening price to buy.
#-- Time frame --
Should be used with the following time frames depending on the necessity:
1 MIN
3 MIN (Preferred with the parameters set)
5 MIN
#-- Last words --
The script can be set up to send Tradingview signals to 3comma just by adding comment = " " in strategy.close_all() and strategy.entry().
Good trades !
Disclaimer (As it should always be one to any script)
***
This script is intended for and only to be used for personal purposes only. No such information provided by it constitutes advice or a recommendation for any investment or trading strategy for any specific person. There is no guarantee presented or implied as to the accuracy of specific forecasts, projections, or predictive statements offered by the script. Users of the script agree that its original developer does not take responsibility for any of your investment decisions. Please seek professional advice before trading.
***
# Here are the results from the 20rst of September 2021 with 100% of equity on the BTC /EUR 3 Min and with a capital of 10 000 EUR. So almost, one month.
# As I saw, it goes from +30% to more than +160% (the great SHIB) depending on the selected crypto. It may be negative if you spot a downtrend.

TradingGroundhog - Strategy & Wavetrend V2#-- Public Strategy - No Repaint - Fractals - Wavetrend --
Here I come with another script, a nice and simple strategy based on fractals and Wavetrends.
#-- Synopsis --
A simple idea, on a small time frame (15 min) we buy when the opening price goes below a Bottom fractals and sell when it goes over a Top fractals, but in order to avoid bad and evil downtrends, we use Wavetrends based on a Daily time frame. From it, Tops and Bottoms are extracted. If the opening price goes above Wavetrend Tops, no trades will be conducted during the day. If the price goes below Wavetrend bottoms, no trades will be executed from 1 to N days, until a new Wavetrend bottom is generated.
I developed the strategy using BTC /EUR 15 MIN BINANCE but it can be applied to many other cryptos, I don't know for forex or others. You can use it for long term and automated trading, I implemented the Wavetrend indicator to do so, or for short term if you have spot a long coming uptrend. Test it, look at its profit and long or short period on your crypto of choice.
#-- Graph reading --
And now, how to read it ?
Wavetrends:
Red Backgrounds are associated to No Trade periods. These periods occur when the price goes below a Wavetrend bottom or above a Wavetrend Top. They are here to limit the loss.
Blue Gradient lines represent the past Tops. For each bar, only the increasing values of the Wavetrend tops are acquired. Going from light to dark blue based on the age of the Tops. Thus, if on line goes from dark to light, this means the price is approaching a previous Wavetrend top. In the opposite, if it darken, thus the price say 'buy buy' and go dropping.
Yellow Gradient lines represent the past Bottoms. They are based on the same principe that the blue lines.
Fractals:
Yellow Flags occur when the opening price goes below a Bottom fractal , it means Buy.
White Flags appear when the opening price goes over a Top fractal , it means Sell.
#-- Parameters --
*** Parameters have been intensively optimized using 10 cryptocurrency markets in order to have potent efficiency for each of them. I would recommend to only change the Can Be touch parameter. For the others, I don't recommend any modifications. The idea behind the script is to be able to switch between markets without having to optimize parameters, less work, easy to target active crypto and therefor limit the risks. ***
Can be touch :
'Combined Smoothness' : The number of open individuals used by the Wavetrend. (6 or 9, often 9 is better but with less volatile crypto it will be 6)
'Filter fractals' : Activate or Disable the filtering fractal operation. If Enable, buy during less risky periods. (Disable is often better)
Can be touch but not necessary :
'VolumeMA' : The Volume corrector used by the fractals
'Extreme window' : The number of price individuals to look for if we want to remove extreme fractals.
Not to touch :
'Limit_candle to look on' : Number of candles to use to compute the Wavetrend Tops and Bottoms.
'Length top bottom drawn' : Size of the lines
'Long Sop Loss (%)' : The minimal difference of price between a Fractal bottom and the opening price to buy.
#-- Time frame --
Should be used with the following time frames depending on the necessity:
1 MIN
3 MIN (Interesting for short term profit, may need some parameter ajustements)
5 MIN
15 MIN (Preferred for long term profit, the script was developed on it)
#-- Last words --
The script can be set up to send Tradingview signals to 3comma just by adding comment = " " in strategy.close_all() and strategy.entry().
Good trades !
Disclaimer (As it should always be one to any script)
***
This script is intended for and only to be used for personal purposes only. No such information provided by it constitutes advice or a recommendation for any investment or trading strategy for any specific person. There is no guarantee presented or implied as to the accuracy of specific forecasts, projections, or predictive statements offered by the script. Users of the script agree that its original developer does not take responsibility for any of your investment decisions. Please seek professional advice before trading.
***
# Here are the results from the 1rst of July 2021 with 100% of equity on the BTC /EUR 15 Min and with a capital of 1 000 EUR.
# As I saw, it goes from +20% to more than +100% depending on the selected crypto. Sometimes it's negative but it's quite rare on crypto using the EUR.

TradingGroundhog - Fundamental Analysis - Multiple RSI Ema(Script Available Version of my previous Fundamental Analysis - Multiple RSI Ema )
As the number of crypto currencies is expanding, we need to find the one which will boom in the next months, weeks or even days.
Therefore, I present to you a Fundamental Analysis tool based on RSI built in order to compare the RSI between the diverse cryptocurrencies.
When cryptocurrencies start to trend, become active, minable and especially "buyable", people are investing their money into them.
As a result,the Daily RSI rises and the price of the crypto in question increases steadily.
With "Fundamental Analysis - Multiple RSI EMA" you can :
Follow up to 20 RSI from different exchanges at the same time.
Find easily Increasing/Decreasing RSI as the lines get transparent if their RSI decrease.
You can also select market with high potential of booming as :
Booming Market : 60 < Daily RSI <= 100 (Strong green background)
Potent Market : 55 < Daily RSI <= 60 (Light green background)
Sleepy Market : 50 < Daily RSI <= 55 (Light red background)
Dying Market : 0 < Daily RSI <= 50 (Strong red background)
Futur booming crypto will go from the Potent Market to the Booming Market
Can be used with the following time frames depending on the necessity:
4H
Daily (Preferred)
Weekly
Monthly
Good trades !
Disclaimer (As it should always be one to any script)
***
This script is intended for and only to be used for personal purposes only. No such information provided by it constitutes advice or a recommendation for any investment or trading strategy for any specific person. There is no guarantee presented or implied as to the accuracy of specific forecasts, projections, or predictive statements offered by the script. Users of the script agree that its original developer does not take responsibility for any of your investment decisions. Please seek professional advice before trading.
***

Realtime 5D Profile [LucF]█ OVERVIEW
This indicator displays a realtime profile that can be configured to visualize five dimensions: volume, price, time, activity and age. For each price level in a bar or timeframe, you can display total or delta volume or ticks. The tick count measures activity on a level. The thickness of each level's line indicates its age, which helps you identify the most recent levels.
█ WARNING
The indicator only works in real time. Contrary to TradingView's line of volume profile indicators , it does not show anything on historical bars or closed markets, and it cannot display volume information if none exists for the data feed the chart is using. A realtime indicator such as this one only displays information accumulated while it is running on a chart. The information it calculates cannot be saved on charts, nor can it be recalculated from historical bars. If you refresh the chart, or the script must re-execute for some reason, as when you change inputs, the accumulated information will be lost.
Because "Realtime 5D Profile" requires time to accumulate information on the chart, it will be most useful to traders working on small timeframes who trade only one instrument and do not frequently change their chart's symbol or timeframe. Traders working on higher timeframes or constantly changing charts will be better served by TradingView's volume profiles. Before using this indicator, please see the "Limitations" section further down for other important information.
█ HOW TO USE IT
Load the indicator on an active chart (see here if you don't know how).
The default configuration displays:
• A double-sided volume profile showing at what price levels activity has occurred.
• The left side shows "down" volume, the right side shows "up" volume.
• The value corresponding to each level is displayed.
• The width of lines reflects their relative value.
• The thickness of lines reflects their age. Four thicknesses are used, with the thicker lines being the most recent.
• The total value of down/up values for the profile appears at the top.
To understand how to use profiles in your trading, please research the subject. Searches on "volume profile" or "market profile" will yield many useful results. I provide you with tools — I do not teach trading. To understand more about this indicator, read on. If you choose not to do so, please don't ask me to answer questions that are already answered here, nor to make videos; I don't.
█ CONCEPTS
Delta calculations
Volume is slotted in up or down slots depending on whether the price of each new chart update is higher or lower than the previous update's price. When price does not move between chart updates, the last known direction is used. In a perfect world, Pine scripts would have access to bid and ask levels, as this would allow us to know for sure if market orders are being filled on upticks (at the ask) or downticks (at the bid). Comparing the price of successive chart updates provides the most precise way to calculate volume delta on TradingView, but it is still a compromise. Order books are in constant movement; in some cases, order cancellations can cause sudden movements of both the bid and ask levels such that the next chart update can occur on an uptick at a lower price than the previous one (or vice versa). While this update's volume should be slotted in the up slot because a buy market order was filled, it will erroneously be slotted in the down slot because the price of the chart's update is lower than that of the previous one. Luckily, these conditions are relatively rare, so they should not adversely affect calculations.
Levels
A profile is a tool that displays information organized by price levels. You can select the maximum quantity of levels this indicator displays by using the script's "Levels" input. If the profile's height is small enough for level increments to be less than the symbol's tick size, a smaller quantity of levels is used until the profile's height grows sufficiently to allow your specified quantity of levels to be displayed. The exact position of levels is not tethered to the symbol's tick increments. Activity for one level is that which happens on either side of the level, halfway between its higher or lower levels. The lowest/highest levels in the profile thus appear higher/lower than the profile's low/high limits, which are determined by the lowest/highest points reached by price during the profile's life.
Level Values and Length
The profile's vertical structure is dynamic. As the profile's height changes with the price range, it is rebalanced and the price points of its levels may be recalculated. When this happens, past updates will be redistributed among the new profile's levels, and the level values may thus change. The new levels where updates are slotted will of course always be near past ones, but keep this fluidity in mind when watching level values evolve.
The profile's horizontal structure is also dynamic. The maximum length of level lines is controlled by the "Maximum line length" input value. This maximum length is always used for the largest level value in the profile, and the length of other levels is determined by their value relative to that maximum.
Updates vs Ticks
Strictly speaking, a tick is the record of a transaction between two parties. On TradingView, these are detected on seconds charts. On other charts, ticks are aggregated to form a chart update . I use the broader "update" term when it names both events. Note that, confusingly, tick is also used to name an instrument's minimal price increment.
Volume Quality
If you use volume, it's important to understand its nature and quality, as it varies with sectors and instruments. My Volume X-ray indicator is one way you can appraise the quality of an instrument's intraday volume.
█ FEATURES
Double-Sided Profiles
When you choose one of the first two configuration selections in the "Configuration" field's dropdown menu, you are asking the indicator to display a double-sided profile, i.e., where the down values appear on the left and the up ones on the right. In this mode, the formatting options in the top section of inputs apply to both sides of the profile.
Single-Sided Profiles
The six other selections down the "Configuration" field's dropdown menu select single-sided profiles, where one side aggregates the up/down values for either volume or ticks. In this mode, the formatting options in the top section of inputs apply to the left profile. The ones in the following "Right format" section apply to the right profile.
Calculation Mode
The "Calculation" input field allows the selection of one of two modes which applies to single-sided profiles only. Values can represent the simple total of volume or ticks at each level, or their delta. The mode has no effect when a double-sided profile is used because then, the total is represented by the sum of the left and right sides. Note that when totals are selected, all levels appear in the up color.
Age
The age of each level is always displayed as one of four line thicknesses. Thicker lines are used for the youngest levels. The age of levels is determined by averaging the times of the updates composing that level. When viewing double-sided profiles, the age of each side is calculated independently, which entails you can have a down level on the left side of the profile appear thinner than its corresponding up side level line on the right side because the updates composing the up side are more recent. When calculating the age of single-sided profiles, the age of the up/down values aggregated to calculate the side are averaged. Since they may be different, the averaged level ages will not be as responsive as when using a double-sided profile configuration, where the age of levels on each side is calculated independently and follows price action more closely. Moreover, when displaying two single-sided profiles (volume on one side and ticks on the other), the age of both sides will match because they are calculated from the same realtime updates.
Profile Resets
The profile can reset on timeframes or trend changes. The usual timeframe selections are available, including the chart's, in which case the profile will reset on each new chart bar. One of two trend detection logics can be used: Supertrend or the one used by LazyBear in his Weis Wave indicator . Settings for the trend logics are in the bottommost section of the inputs, where you can also control the display of trend changes and states. Note that the "Timeframe" field's setting also applies to the trend detection mechanism. Whatever the timeframe used for trend detection, its logic will not repaint.
Format
Formatting a profile for charts is often a challenge for traders, and this one is no exception. Varying zoom factors on your chart and the frequency of profile resets will require different profile formats. You can achieve a reasonable variety of effects by playing with the following input fields:
• "Resets on" controls how frequently new profiles are drawn. Spacing out profiles between bars can help make them more usable.
• "Levels" determines the maximum quantity of levels displayed.
• "Offset" allows you to shift the profile horizontally.
• "Profile size" affects the global size of the profile.
• Another "Size" field provides control over the size of the totals displayed above the profile.
• "Maximum line length" controls how far away from the center of the bar the lines will stretch left and right.
Colors
The color and brightness of levels and totals always allows you to determine the winning side between up and down values. On double-sided profiles, each side is always of one color, since the left side is down values and the right side, up values. However, the losing side is colored with half its brightness, so the emphasis is put on the winning side. When there is no winner, the toned-down version of each color is used for both sides. Single-sided profiles use the up and down colors in full brightness on the same side. Which one is used reflects the winning side.
Candles
The indicator can color candle bodies and borders independently. If you choose to do so, you may want to disable the chart's bars by using the eye icon near the symbol's name.
Tooltips
A tooltip showing the value of each level is available. If they do not appear when hovering over levels, select the indicator by clicking on its chart name. This should get the tooltips working.
Data Window
As usual, I provide key values in the Data Window, so you can track them. If you compare total realtime volumes for the profile and the built-in "Volume" indicator, you may see variations at some points. They are due to the different mechanisms running each program. In my experience, the values from the built-in don't always update as often as those of the profile, but they eventually catch up.
█ LIMITATIONS
• The levels do not appear exactly at the position they are calculated. They are positioned slightly lower than their actual price levels.
• Drawing a 20-level double-sided profile with totals requires 42 labels. The script will only display the last 500 labels,
so the number of levels you choose affects how many past profiles will remain visible.
• The script is quite taxing, which will sometimes make the chart's tab less responsive.
• When you first load the indicator on a chart, it will begin calculating from that moment; it will not take into account prior chart activity.
• If you let the script run long enough when using profile reset criteria that make profiles last for a long time, the script will eventually run out of memory,
as it will be tracking unmanageable amounts of chart updates. I don't know the exact quantity of updates that will cause this,
but the script can handle upwards of 60K updates per profile, which should last 1D except on the most active markets. You can follow the number of updates in the Data Window.
• The indicator's nature makes it more useful at very small timeframes, typically in the sub 15min realm.
• The Weis Wave trend detection used here has nothing to do with how David Weis detects trend changes.
LazyBear's version was a port of a port, so we are a few generations removed from the Weis technique, which uses reversals by a price unit.
I believe the version used here is useful nonetheless because it complements Supertrend rather well.
█ NOTES
The aggregated view that volume and tick profiles calculate for traders is a good example of one of the most useful things software can do for traders: look at things from a methodical, mathematical perspective, and present results in a meaningful way. Profiles are powerful because, if the volume data they use is of good enough quality, they tell us what levels are important for traders, regardless of the nature or rationality of the methods traders have used to determine those levels. Profiles don't care whether traders use the news, fundamentals, Fib numbers, pivots, or the phases of the moon to find "their" levels. They don't attempt to forecast or explain markets. They show us real stuff containing zero uncertainty, i.e., what HAS happened. I like this.
The indicator's "VPAA" chart name represents four of the five dimensions the indicator displays: volume, price, activity and age. The time dimension is implied by the fact it's a profile — and I couldn't find a proper place for a "T" in there )
I have not included alerts in the script. I may do so in the future.
For the moment, I have no plans to write a profile indicator that works on historical bars. TradingView's volume profiles already do that, and they run much faster than Pine versions could, so I don't see the point in spending efforts on a poor ersatz.
For Pine Coders
• The script uses labels that draw varying quantities of characters to break the limitation constraining other Pine plots/lines to bar boundaries.
• The code's structure was optimized for performance. When it was feasible, global arrays, "input" and other variables were used from functions,
sacrificing function readability and portability for speed. Code was also repeated in some places, to avoid the overhead of frequent function calls in high-traffic areas.
• I wrote my script using the revised recommendations in the Style Guide from the Pine v5 User Manual.
█ THANKS
• To Duyck for his function that sorts an array while keeping it in synch with another array.
The `sortTwoArrays()` function in my script is derived from the Pine Wizard 's code.
• To the one and only Maestro, RicardoSantos , the creative volcano who worked hard to write a function to produce fixed-width, figure space-padded numeric values.
A change in design made the function unnecessary in this script, but I am grateful to you nonetheless.
• To midtownskr8guy , another Pine Wizard who is also a wizard with colors. I use the colors from his Pine Color Magic and Chart Theme Simulator constantly.
• Finally, thanks to users of my earlier "Delta Volume" scripts. Comments and discussions with them encouraged me to persist in figuring out how to achieve what this indicator does.

Kaufman's Efficiency Ratio Strategy [KL]I recently published an indicator called "Kaufman's Efficiency Ratio Indicator". In the description of that script, I hypothesized about how the Efficiency Ratio could be applied to identify bullish moves in instances where price had already gone up steeply, but rests for a while, allowing for entry in expectation that price will continually rise. I decided to test out this idea with Pinescript.
About Kaufman's Efficiency Ratio ("ER")
ER was developed by a systematic trader by the name of Perry J. Kaufman.
Formula
The formula is:
= A divided by B,
where:
A = Current closing price minus the closing price at the start of the lookback period
B = Sum of differences between closing prices (in absolute terms) of consecutive bars over the lookback period
How this strategy enters a trade (Long):
- code: entry_signal_long = ER > 0 and ER_is_mid
- meaning: when ER is positive, strategy assumes price has risen. Usually ER value begins high (red), and unless it is a false move, then it should stay positive. This strategy will patiently wait until ER drops to medium (yellow), and then place a trade.
- how low/medium/high is dynamically determined: Refer to the description of my other script("Kaufman's Efficiency Ratio Indicator") for details. Trying to keep this as short as possible.
How this strategy exits a trade (Long):
- when price hits stop limit; stop limit is based on low of bars, trails upward based on ATR
- included a feature called "tightening TSL", which tries to reduce the stop-buffer during periods of high volatility implied by ER (very experimental, opening the floor for suggestions on how this can be improved)

CryptoSignalScanner - MACD Multiple Time FramesDESCRIPTION:
After receiving some multiple request to provide a MACD indicator that displays multiple timeframes at the same time I created this simple script.
You can use this script for free and adjust it as much you like.
With this script you can plot 6 MACD lines & 6 Signal lines.
• Current Timeframe MACD Line
• Current Timeframe Signal Line
• 15 minute candle MACD Line
• 15 minute candle Signal Line
• 30 minute candle MACD Line
• 30 minute candle Signal Line
• 1 hour candle MACD Line
• 1 hour candle Signal Line
• 2 hour candle MACD Line
• 2 hour candle Signal Line
• 4 hour candle MACD Line
• 4 hour candle Signal Line
HOW TO USE:
• When multiple MACD lines on an uptrend are grouped together it is time to SELL.
• When multiple MACD lines on a downtrend are grouped together it is time to BUY.
• The higher to length of the MACD lines the stronger the BUY/SELL signal.
FEATURES:
• You can show/hide the preferred MACD lines.
• You can show/hide the preferred Signal lines.
How MACD works
The MACD indicator is generated by subtracting two exponential moving averages (EMAs) to create the main line (MACD line), which is then used to calculate another EMA that represents the signal line. In addition, there is the MACD histogram, which is calculated based on the differences between those two lines. The histogram, along with the other two lines, fluctuates above and below a center line, which is also known as the zero line.
The MACD indicator consists of three elements moving around the zero line:
• The MACD line. By default the MACD line is calculated by subtracting the 26-day EMA from the 12-day EMA.
MACD line = 12d EMA - 26d EMA
• The signal line. By default the signal line is calculated from a 9-day EMA of the MACD line.
Signal line = 9d EMA of MACD line
• Histogram. The histogram is nothing more than a visual record of the relative movements of the MACD line and the signal line.
It is simply calculated as: MACD line - signal line
REMARKS:
• This advice is NOT financial advice.
• We do not provide personal investment advice and we are not a qualified licensed investment advisor.
• All information found here, including any ideas, opinions, views, predictions, forecasts, commentaries, suggestions, or stock picks, expressed or implied herein, are for informational, entertainment or educational purposes only and should not be construed as personal investment advice.
• We will not and cannot be held liable for any actions you take as a result of anything you read here.
• We only provide this information to help you make a better decision.
• While the information provided is believed to be accurate, it may include errors or inaccuracies.
Good Luck,
SEOCO

Volume using Candle RangeAnother way of finding out a rough estimate of the volume or how much bulls or bears were in control using only the range of the candlesticks in relation to the closing price. If the close is in the higher range zone then the volume is said to have been positive, if the close is in the lower range zone then the volume is said to have been negative. The close is compared to the midpoint of the candle to see how far from the midpoint the close was.
The columns bars show how far each candlestick's close price is to the midpoint of its high and low. It's possible for the column bar to be a different color than the candlestick itself if the close was above or below the midpoint. An average line is shown that takes the average of a given length amount of column bars. There is an option to show the absolute value only of the columns and the average line.
This is based on an idea I found about candlestick range bars implying volume. This is an attempt to put that theory into practice and to see if there's any truth to it. It's not exactly volume and may not always look like it, and it does not show how many trades took place but instead tries to use price in relation to the high and low range.
