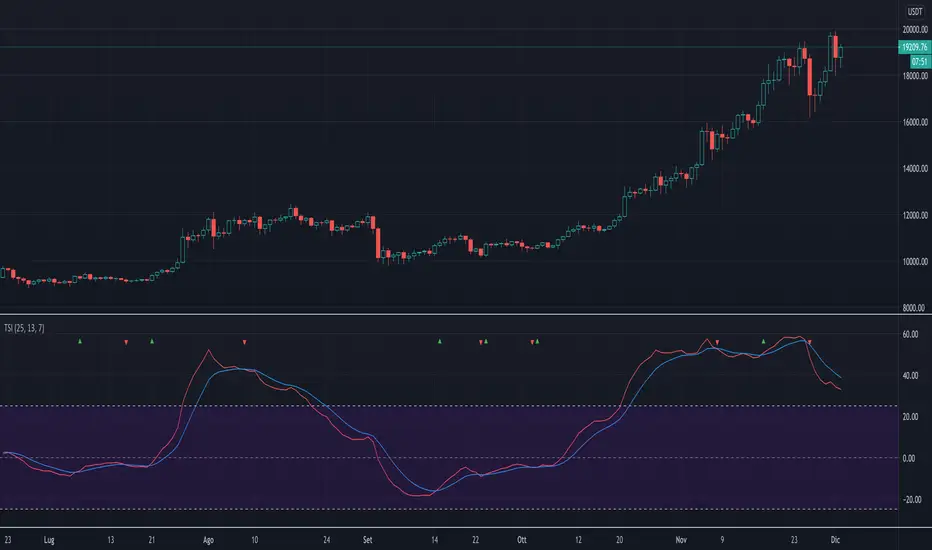
True Strength IndexThe script implements a custom version of TSI (True Strength Index). This index may be useful for determining overbought and oversold conditions, indicating potential trend direction changes via centerline or signal line crossovers, and warning of trend weakness through divergence.
The script highlights when TSI line crosses the signal line with a colored triangle, that is
when the TSI line crosses above the signal line from below, that may warrant buying, a green triangle that's pointing up is drawned;
when the TSI line crosses below the signal line from above, that may warrant selling, a red triangle that's pointing down is drawned.
Note: Signal line crossovers occur frequently, so should be utilized only in conjunction with other signals from the TSI.
The script is very easy to use and it is possible to change the following parameters:
EMA smoothing period for momentum (default value is 25)
EMA smoothing period for smoothed momentum (default value is 13)
Signal line period (default value is 7)
The type of signal line: EMA or SMA (default value is EMA)
Show or not the TSI line
Show or not the signal line
ابحث في النصوص البرمجية عن "index"
Bride Index 4.1Bride Index 4.1 is a update of Bride Index 2.0 version. It now includes non-repaiting function and transparency input for EMAs lines.
This indicator shows possibles prices for the asset in daily or weekly close price with a scale from 3% to 60% (from 0.5% to 10% each line).
Attention for the input fields:
Period - D ou W (Upper case) - This field MUST have upper case letter. If you want to put close in minutes or hours, you must put the amount of minutes of the period (eg. 30 minutes insert 30 or 2 hours insert 120 ).
Variation (0.5% to 10%) - This field changes the gap between the lines in % of the close price.

sDEFI IndexThe Synthetix Exchange provides a DeFi index that has too many components to be used as a chart ticker.
So here is an indicator to bypass the ticker limit.
From the Synthetics docs : docs.synthetix.io
DeFi Index (sDEFI)
Contract: 0xe1aFe1Fd76Fd88f78cBf599ea1846231B8bA3B6B
Token | Initial Weight
---------------------------
Aave | 15%
Synthetix Network Token | 15%
yearn.finance | 15%
Uniswap | 10%
Compound | 7.50%
Maker | 7.50%
Balancer | 5%
Curve DAO Token | 5%
Kyber Network | 5%
Ren | 5%
UMA | 5%
Wrapped Nexus Mutual | 5%
The chart shows it in comparison to FTX's DeFi index, quite a difference as you can see!

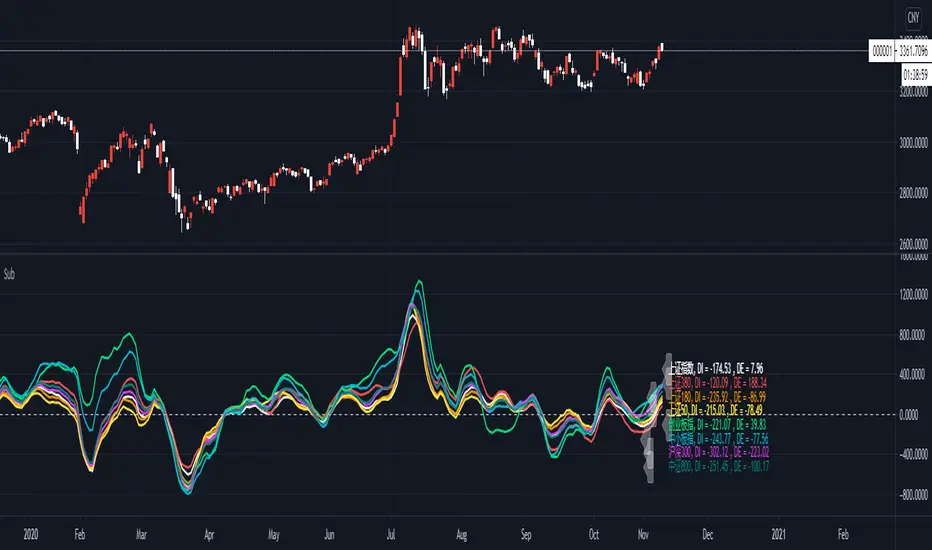
Deviation rate of Chinese stock market index// Deviation rate of Chinese stock market index
//The purpose of the indicator is to monitor the Chinese stock market index deviation rate to the 20EMA, so each major index can be observed longitudinally at the same time.
//This indicator give signal of which Index or instrument should you be focused and when should you enter the market to get a long or short position.
//The chart shows the deviation rate between the current price of each major index current price to the 20EMA.
//Also it count a deductive ratio between current price to the previous 20th bar close price to (which lead to the slope of the 20SMA)
//When using, adjust the corresponding period according to the chart period.
//The word DI (divergence) represents the deviation value between the current price and 20EMA, and DE (deduction) represents the deviation value between the current price and the 20 deduction price.
//Attention marker: The marker tells one of the moving average (EMA20 and MA20) is turning towards the opposite direction. When DE and DI one is plus , one is minus attention marker appear on the instrument title.
//Take the bull trend as an example. If the price is higher than ema20, the EMA20 is turning.If the price is higher than the close price of the bar 20 days ago , the sma20 is turning.
//When the ema20 has not turned around to opposite direction , and the ma20 is turning , the deviation rate of the moving average and the deviation rate of the deductible price are different in positive or negative.
//The marker as a reminder will appear on the instrument title.
//How to use this watchlist: You can freely replace the major indices with the instrument you are focused.
[blackcat] L2 Ehlers Relative Vigor IndexLevel: 2
Background
John F. Ehlers introuced Relative Vigor Index in his "Cybernetic Analysis for Stocks and Futures" chapter 6 on 2004.
Function
Relative Vigor Index (RVI) uses concepts dating back over three decades and also uses modern filter and digital signal processing theory to realize those concepts as a practical and useful indicator. The RVI merges the old concepts with the new technologies. The basic idea of the RVI is that prices tend to close higher than
they open in up markets and tend to close lower than they open in down markets. The vigor of the move is thus established by where the prices reside at the end of the day. To normalize the index to the daily trading range, the change in price is divided by the maximum range of prices for the day.
The RVI is an oscillator, and we are therefore only concerned with the cycle modes of the market in its use. The sharpest rate of change for a cycle is at its midpoint. Therefore, in the ascending part of the cycle we would expect the difference between the close and open to be at a maximum. This is like a derivative in calculus, where the derivative of a sinewave produces a negative cosine wave. The derivative is therefore a waveform that leads the original sinewave by a quarter cycle. Also, from calculus, integration of a sinewave over a half-cycle period results in another sinewave delayed by a quarter cycle. Summing over a half cycle is basically the same as mathematically integrating, with the result that the waveshape of the sum is delayed by a quarter wavelength relative to the input. The net result of taking the differences and summing produces an oscillator output in phase with the cyclic component of the price. It is also possible to generate a leading function if the summation window is less than a half wavelength of the Dominant Cycle. If a cycle measurement is not available, you can sum the RVI components over a fixed default period. A nominal value of 8 is suggested because this is approximately half the period of most cycles of interest.
Key Signal
RVI ---> Relative Vigor Index fast line
Trigger ---> Relative Vigor Index slow line
Pros and Cons
100% John F. Ehlers definition translation of original work, even variable names are the same. This help readers who would like to use pine to read his book. If you had read his works, then you will be quite familiar with my code style.
Remarks
The 27th script for Blackcat1402 John F. Ehlers Week publication.
Readme
In real life, I am a prolific inventor. I have successfully applied for more than 60 international and regional patents in the past 12 years. But in the past two years or so, I have tried to transfer my creativity to the development of trading strategies. Tradingview is the ideal platform for me. I am selecting and contributing some of the hundreds of scripts to publish in Tradingview community. Welcome everyone to interact with me to discuss these interesting pine scripts.
The scripts posted are categorized into 5 levels according to my efforts or manhours put into these works.
Level 1 : interesting script snippets or distinctive improvement from classic indicators or strategy. Level 1 scripts can usually appear in more complex indicators as a function module or element.
Level 2 : composite indicator/strategy. By selecting or combining several independent or dependent functions or sub indicators in proper way, the composite script exhibits a resonance phenomenon which can filter out noise or fake trading signal to enhance trading confidence level.
Level 3 : comprehensive indicator/strategy. They are simple trading systems based on my strategies. They are commonly containing several or all of entry signal, close signal, stop loss, take profit, re-entry, risk management, and position sizing techniques. Even some interesting fundamental and mass psychological aspects are incorporated.
Level 4 : script snippets or functions that do not disclose source code. Interesting element that can reveal market laws and work as raw material for indicators and strategies. If you find Level 1~2 scripts are helpful, Level 4 is a private version that took me far more efforts to develop.
Level 5 : indicator/strategy that do not disclose source code. private version of Level 3 script with my accumulated script processing skills or a large number of custom functions. I had a private function library built in past two years. Level 5 scripts use many of them to achieve private trading strategy.
[blackcat] L2 Ehlers Adaptive Commodity Channel IndexLevel: 2
Background
John F. Ehlers introucedAdaptive Commodity Channel Index in his "Rocket Science for Traders" chapter 21 on 2001.
Function
The Commodity Channel Index (CCI) computes the average of the median price of each bar over the observation period. It also computes the Mean Deviation (MD) from this average. The CCI is formed as the current deviation from the average price normalized to the MD. With a Gaussian probability distribution, 68 percent of all possible outcomes are contained within the first standard deviation from the mean. The CCI is scaled so that values above +l00 are above the upper first
standard deviation from the mean and values below -100 are below the lower first standard deviation from the mean. Multiplying the MD in the code by 0.015 implements this normalization. Many traders use this indicator as an overbought/oversold indicator with 100 or greater indicating that the market is overbought, and -100 or less that the market is oversold. Since the trading channel is being formed by the indicator, the obvious observation period is the same as the cycle length. Since the complete cycle period may not be the universal answer, Dr. Ehlers includes a CycPart input as a modifier. This input allows you to optimize the observation period for each particular situation.
Key Signal
CCI ---> Adaptive Commodity Channel Index fast line
CCI ---> Adaptive Commodity Channel Index slow line
Pros and Cons
100% John F. Ehlers definition translation of original work, even variable names are the same. This help readers who would like to use pine to read his book. If you had read his works, then you will be quite familiar with my code style.
Remarks
The 20th script for Blackcat1402 John F. Ehlers Week publication.
Readme
In real life, I am a prolific inventor. I have successfully applied for more than 60 international and regional patents in the past 12 years. But in the past two years or so, I have tried to transfer my creativity to the development of trading strategies. Tradingview is the ideal platform for me. I am selecting and contributing some of the hundreds of scripts to publish in Tradingview community. Welcome everyone to interact with me to discuss these interesting pine scripts.
The scripts posted are categorized into 5 levels according to my efforts or manhours put into these works.
Level 1 : interesting script snippets or distinctive improvement from classic indicators or strategy. Level 1 scripts can usually appear in more complex indicators as a function module or element.
Level 2 : composite indicator/strategy. By selecting or combining several independent or dependent functions or sub indicators in proper way, the composite script exhibits a resonance phenomenon which can filter out noise or fake trading signal to enhance trading confidence level.
Level 3 : comprehensive indicator/strategy. They are simple trading systems based on my strategies. They are commonly containing several or all of entry signal, close signal, stop loss, take profit, re-entry, risk management, and position sizing techniques. Even some interesting fundamental and mass psychological aspects are incorporated.
Level 4 : script snippets or functions that do not disclose source code. Interesting element that can reveal market laws and work as raw material for indicators and strategies. If you find Level 1~2 scripts are helpful, Level 4 is a private version that took me far more efforts to develop.
Level 5 : indicator/strategy that do not disclose source code. private version of Level 3 script with my accumulated script processing skills or a large number of custom functions. I had a private function library built in past two years. Level 5 scripts use many of them to achieve private trading strategy.
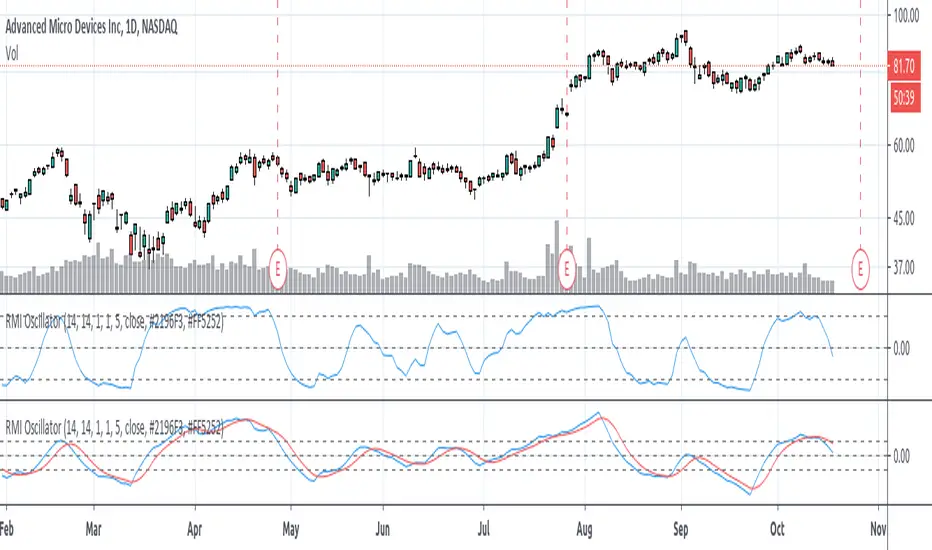
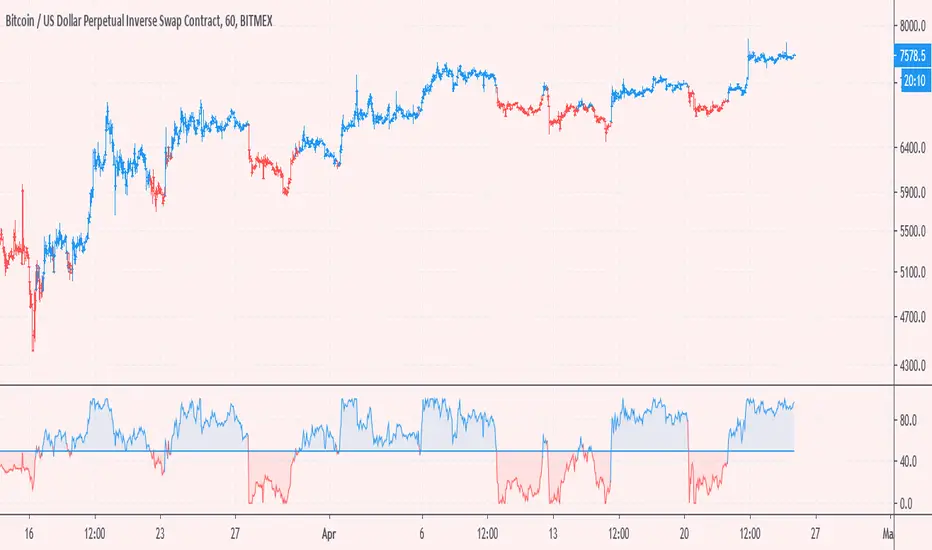
Relative Momentum Index (RMI) OscillatorThe Relative Momentum Index (RMI) is a sibling to the RSI. Where the RSI measures trend based on the average (RMA) of gains and draws over a length of time , the RMI measures based on the SUM of gains and draws . Myself and many others have found that the RMI oscillates better than the RSI does.
I paired the RMI with the oscillation method the Fisher Transformation uses to oscillate the value from -1.0 to 1.0 instead of the Stochastic way of 0 to 100. This way you can enable the Fisher transform, if desired. But I also just prefer the appearance of that.
Some options and features I have coded in-
RMI Length: This is the length of the Relative Momentum Index itself. Like the length of RSI, default 14
Oscillation Length: This is your oscillation length, like a Stochastic. If you put the length at 1 it will turn the indicator into the straight up RMI indicator. (If you select to use the Fisher Transform, the overbought/oversold lines will not show nicely)
Source Pre-Smoothing: The option of smoothing out the source, ie close, before you even run it through the RMI, oscillation, and/or transform
Oscillator Post-Smoothing: The option of smoothing the output of the script
Trailing MA: If desired, you can check the box to Use a Trailing Signal, and enter the length of lookback for a Simple Moving Average (SMA) of the RMI Osc value
Use Fill Colors on MA: If enabled, it will fill the area between the RMI Osc and the trailing MA. I chose to use colors that are similar to some educational ideas I have published, whereby nearing the bottom of the oscillation you get Green to signal Accumulation, and near the top you get Red to signal Distribution. Following red is Black, where you typically get late signal sellers that Capitulate and sell stops trigger. Blue is where traders tend to Chase price up.
The most primitive way of using this indicator would be sell when the value exceeds the overbought/top line and buy when it falls below the oversold/bottom line. You can find ways to use the fill colors, or MA crossovers, rising lows or rising highs, etc. for signals.
Here's a comparison of this indicator to the Stochastic RSI, using similar values-
Here's showing the indicator on intraday values at defaults with some pre- and post-smoothing-
Same thing, but with Fisher Transform enabled-
And an example of the fill bands in action-
Please feel free to use any part of this code as desired.
Bitcoin Bullish Percent IndexHello Traders,
This is Bitcoin Bullish Percent Index script. First lets talk about what the Bullish Percent Index and how it is calculated:
"The Bullish Percent Index (BPI) is a breadth indicator based on the number of securities on Point & Figure Buy Signals, Developed by Abe Cohen in the mid-1950s. Because a security is either on a P&F Buy or Sell Signal, there is no ambiguity when it comes to P&F charts. This makes BPI a straightforward indicator with clearly defined signals."
The calculation is straightforward and simple: (Number of securities on P&F Buy signals) / (Total number of securities)
Here you can see what the P&F buy signal is:
In this script I choose 40 cryptos that is correlated ( as I see ) with BTC (including BtcUsdt). in the first part the script creates P&F chart for each security and check if there is Buy or Sell signal and sum the buy signals if there is. in the second part it creates P&F chart by using the P&F buy/sell signals coming from the securities P&F chart. because of complicated calculation the script may need a few seconds to load.
in the first part reversal value is 3 by default but you can set different values as reversal. sometimes I got better results with reversal = 5.
in BPI part reversal = 3 is used. so each box represents 2% (each X or O is a box). And this means it takes at least a 6% move in BPI for a reversal. the Bullish Percent Index favors the bulls when above 50% and the bears when below 50%. The bulls have the edge when over 50% of stocks are on a P&F Buy Signal. BPI is also considered overbought when above 70% and oversold when below 30%. BPI can move between 0 and 100.
Because of 40 securities are used in the script and all different prices, it uses Percentage scaling only. it can calculate the Percentage automatically by using the time frame of the chart or you can set it as you wish.
The Signals coming from BPI:
Bull Alert: BPI is below 30% and then forms a new column of X's (rises)
Bear Alert: BPI is above 70% and then forms a new column of O's that decline below 70%.
Bull Confirmed: BPI is on a P&F buy signal and in a column of X's (rising).
Bear Confirmed: BPI is on a P&F sell signal and in a column of O's (falling).
Bull Correction: BPI is on a P&F buy signal, but currently falling (column of O's).
Bear Correction: BPI is on a P&F sell signal, but currently rising (column of X's).
If you are not familiar with Bullish Percent Index you better search it on the net to get more info, you can find a lot of articles and web sites about BPI.
as I remember I developed the script 6-7 months ago and today I had chance to publish it as it was
Enjoy!

Cumulative High Low IndexThis indicator tells how many days it is making new HighLowPeriod highs or lows in Lookback period.
If bar makes new HighLowPeriod high, HighLow index for that bar is +1
If bar makes new HighLowPeriod low, HighLow index for that bar is -1
Cumulative high low index is sum of HighLow index for Lookback periods.
Optional moving average can also be applied on this index

Aligned Moving Average IndexMoving averages are considered as aligned when either all faster moving averages are placed above their next slower moving averages or all faster moving averages are placed below their next slower moving averages. In this script, we are considering moving averages of 5, 10, 20, 30, 50, 100 and 200. User can select different moving average types from input : sma, ema, hma, rma, vwma, wma.
Moving average is considered as positively aligned when close > ma5 > ma10 > ma20 > ma30 > ma50 > ma100 > ma200
Moving average is considered as negatively aligned when close < ma5 < ma10 < ma20 < ma30 < ma50 < ma100 < ma200
Whenever there is positively aligned moving average, alignment value is considered as +1 and whenever there is negatively aligned moving average, alignment value is considered as -1. Aligned moving average index is sum of n periods of alignment value.
We can optionally apply another moving average on this index to see the overall direction.
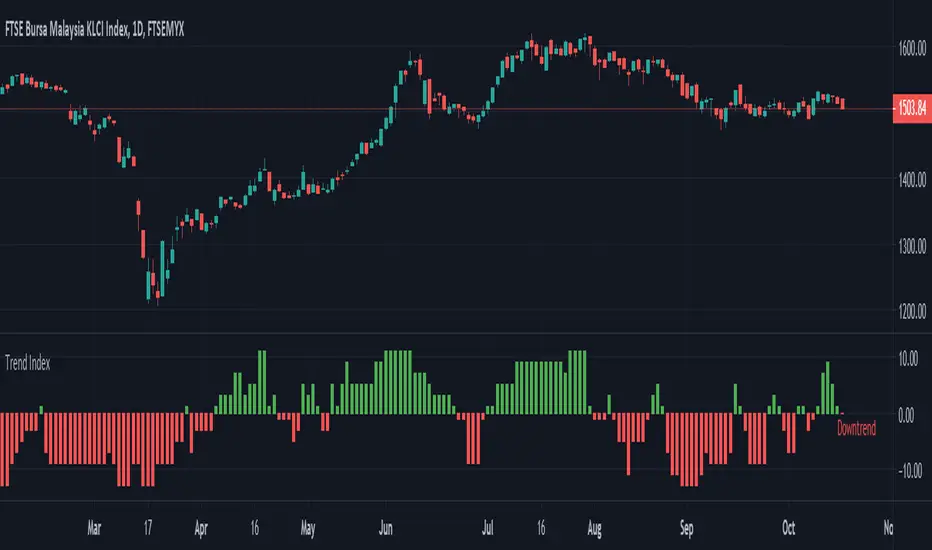
Trend Index Trend Index show trend of the instrument based on multiple indicators
- Green --> Uptrend
- Red --> Downtrend
- Gray --> No trend
Indicators used:-
Relative Strength Index (RSI)
Commodity Channel Index (CCI)
William Percent Range (WPR)
Directional Movement Index (DMI)
Elder Force Index (EFI)
Momentum
Demarker
Parabolic SAR
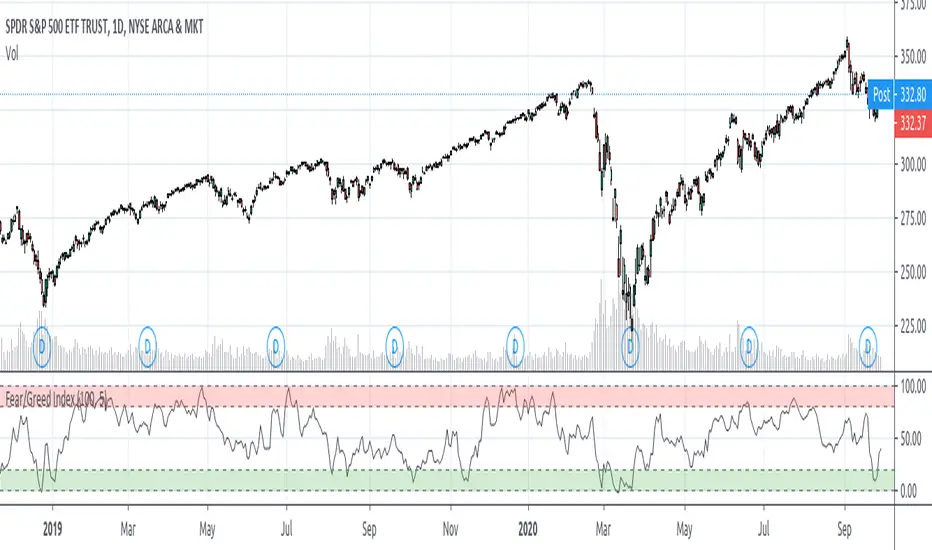
Fear/Greed IndexMy goal was to create something akin to the Fear & Greed Index ( money.cnn.com ) that CNN and others do.
A Fear/Greed Index can be used by any trader or investor but I believe it's best viewed with a contrarian's eye--
When the market appears to be signalling Extreme Fear, that is a good place to start buying from emotional players who want to sell no matter the price
When signalling Extreme Greed, that may be a good place to start taking profits off or getting hedged, as there may be too much exuberance in the air
Important to note and remember, however, is that there can often times be fear in the air for good reasons! I like to see this as if we dip into extreme fear and return shortly after, the fear may warrant constraint from buying, or returning back to extreme greed may be a very strong market extension
The script draws from several other tickers which I have read and personally observed to be decent macro correlations for the stock market (specifically the SP500). For the state of each of these metrics I gave a rating, good or bad, then added them together and put it into your standard Stochastic.
These macro correlations include--
The % of stocks in the SP500 above multiple Simple Moving Average lengths
VIX and its term-structure (contango, backwardation)
Treasury Bonds
Gold
Junk/High Yield Bonds
The Put/Call Ratio
The SP500 Options Skew
Advancing and Declining Issues
On some of these I opted to use a function for the Relative Momentum Index instead of RSI, as the RMI oscillates better (in my opinion). I also used a Band-Pass Filter/Double EMA for smoothing the results of the stochastic.
A LOT of these numbers were made to my own observation and discretion and can get out-dated over time. With that said, PLEASE feel free to revise, fine tune, modify this as you wish to optimize yours. And please let me know if I have made any mistakes here or something should be added.
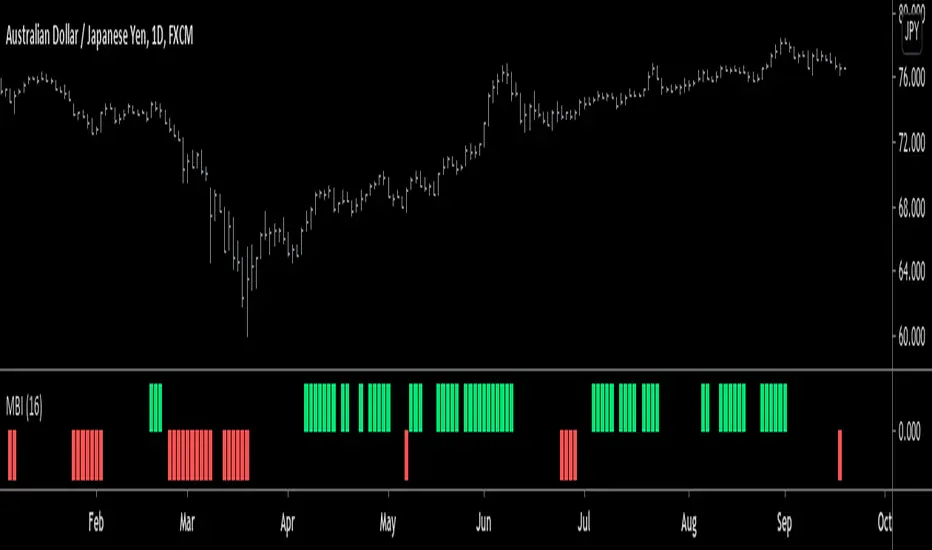
Monster Breakout Index V2Brief Description:
Monster Breakout Index V2 is a the successor to Monster Breakout Index, an indicator I published on May 13, 2020.
Like it's predecessor, MBI V2 gives high quality signals and is incredibly robust at preventing you from trading sideways/consolidating markets.
------------------------------------------------------------------------------------------------------------------------------------------------------------------
Interpreting Signals:
Green = Buy
Red = Sell
------------------------------------------------------------------------------------------------------------------------------------------------------------------
Calculation:
1) Calculate the median price of each bar over n periods. Determine the highest & lowest medians.
2) Current bar's high > highest median? -----Yes = Buy signal
3) Current bar's low < lowest median? -------Yes = Sell signal
Note: Occasionally, the indicator will simultaneously produce both a buy & sell signal. Because of this, it is recommended you use at least one other indicator in conjunction with this one...OR alternatively, ignore this double signal.
------------------------------------------------------------------------------------------------------------------------------------------------------------------
Enjoy ;)
NIFTY INDEX VS STOCK Relative StrengthRelative Index is a ratio of a stock price performance to a market average performance. It is used in technical analysis. It is not confused with RSI indicator. To calculate the relative strength of a particular stock,divide the percentage change over some period by the percentage change of a particular index over the same time period.A stock with a higher relative strength than the overall index often shows a strong investment opportunity.Relative strength is a technique used in momentum investing and identify value stock.The goal of relative strength investing is to buy high and sell even higher.

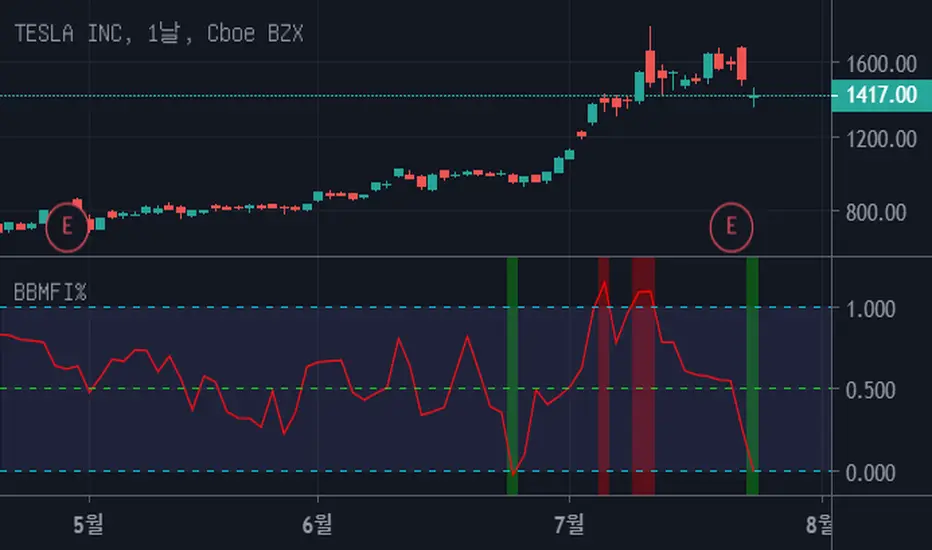
Bollinger Bands Money Flow Index %This script is similar to the previous one "Bollinger Bands Money Flow Index" but it's a little easier to interpret.
Fix the top line of the "BBMFI" to 1, and the bottom line to 0.
Indicates where "Money Flow Index" is located between the top and bottom lines.
If it's bigger than 1, it's overbuying. If it's less than 0, it's overselling.
Consider a trade if you are out of range from 0 to 1.
It's also a good trade timing to out of range and come back in.
[KY]McClellan Summation Index RSIThis script contains McClellan Summation Index(MSI) and McClellan Oscillator(MO)
(1) What is McClellan Summation Index(MSI)
McClellan Summation Index(MSI) is a breadth indicator derived the McClellan Oscillator(MO),
which is a breadth indicator based on Net Advances (advancing issues less declining issues).
The Summation Index is simply a running total of the McClellan Oscillator values.
To identify the market direction, I prefer to use the relative strength(RSI) of MSI rather than MSI itself
because MSI is a summation so it's difficult to compare with previous market patterns. So I use RSI applied MSI.
Reference: Stockcharts.com has a nice set of detailed explanation about MSI.
school.stockcharts.com
(2) How to use this script
- Add this script to your chart.
- You can choose one of two options ("MSI RSI" or "MO").
- You can also choose the market from three options ("Nasdaq", "NYSE", "Nasdaq+NYSE")
(3) "MSI RSI" or "MO"
a) "MSI RSI"
For swing trade(sevelal weeks), MSI RSI is much better to identify the broad market direction.
I backtested last several years of S&P500. The result was not symmetrical between MT bear/bull market.
For bull side, when MSI RSI curls up from the bottom(e.g. RSI 30 level), 90% of times out of them the market rallied.
For bear side, when MSI RSI rolles over to downside from the top(e.g. RSI 70 level), only 60% of times out of them the market declined.
So the market tends to hit negatively diverrgent high from advancing/declining issues perspective. Be careful to use MSI oscilator.
b) "MO"
For short term trade(intraday, 2-3 days of holding), MO is better because MSI is a summation so lags several days. MO is quick.
MO is sometimes very noisy, so you need to draw trendlines or horizontal levels to compare with the previous cases.
For beginners, I recommend to use "MSI RSI".

Monster Breakout IndexThis is the coolest indicator I have ever made to date so far.
The Monster Breakout Index is a completely original idea that I came up with.
MBI is a breakout indicator with one parameter. MBI lives up to its name because of how robust the index is. It gives very little signals, which means that the signals that it does generate are very high quality.
How to Interpret:
Green - Buy
Red - Sell
Would you like to know how this indicator works?
Of course you do! Well here it is...(in steps):
1) Calculate the median price (hl2 price) of each bar over n periods (n is the parameter).
2) Is the current bar's close higher than the highest median? Yes = Buy signal , No = proceed to step 3
3) Is the current bar's close lower than the lowest median? Yes = Sell signal , No = No signal
Recommended setting: 12
If you found this indicator, good job because its a true force to reckon with, its what I would call.....a monster.
Good luck traders, and hit the like button!

Mataf Currency IndexCalculation of Currency Index according to mataf.net
For each index, we have fixed the value 100 on 1 January 2000

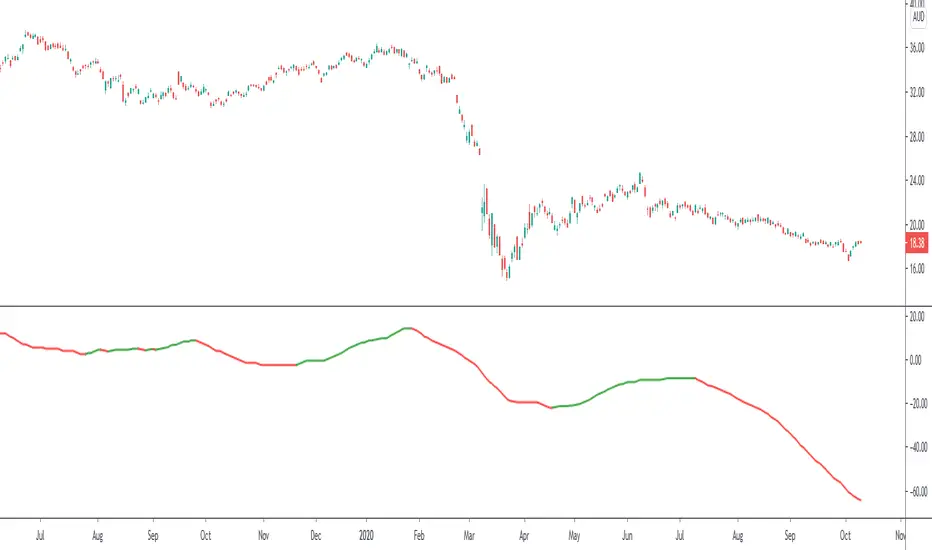
Sell Gravitation IndexThe Sell Gravitation Index was created by Howard Wang and was published in Stocks & Commodities V37:02 (36-38)
This indicator is similar to the relative strength index but the big difference is that this indicator gives early buy and sell signals which I find very helpful. Buy when it rises above its signal line and sell when it falls below its signal line.
Let me know if you would like to see me publish any other scripts!

[LunaOwl] 強度指數 (Num-Day Strength Index, NDSI)The Num-Day Strength Index was published by Mr.George Angel. low percentage represent bear, high percentage represent bull, and the 50 level is a watershed. In fact, you should adjust the length according to the market, timeframe and trading day. the default is 100 universal.
原本Num-Day Strength Index是指N日內的強度指數,由喬治安傑爾先生提出,可以衡量市場強度,根據50水平線區分多空,事實上,您應該根據自己所在的市場、時框以及每週交易日調整參數。預設值是100。
--------------------------*
Formula - 公式
NDSI =
( last close - lowest since period x ) * 100 /
( highest since period x - lowest since period )
--------------------------*
Indicator Style - 指標樣式
Take a simple and bright style at a glance.
簡潔的風格,一目了然。
--------------------------*
Market Example - 市場範例
1. TAIEX , Taiwan SE Weighted Index, 4 hour
2. EUR/USD , Forex Market, 1 hour
3. S&P 500 E-mini futures, 15 min
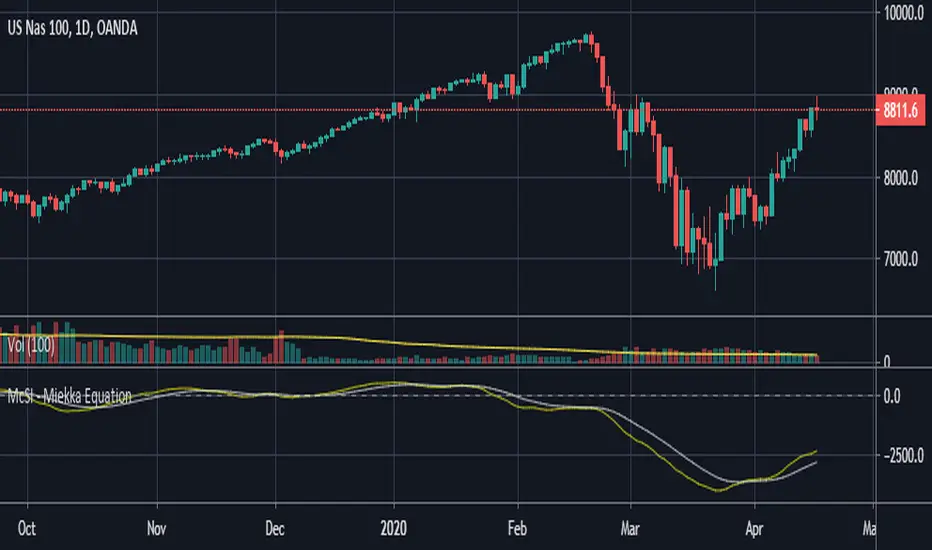
McClellan Summation Index - Miekka FormulaThis indicator is the McClellan Summation Index calculated as by Jim Miekka. Jim was a renowned mathematician who contributed immensely to the trading world by tying to develop independent mathematical indicators.
It was Jim Miekka who established the independent relationship to calculate the Summation index without calculating the cumulative of the McClellan Oscillator.
On top of the Summation Index I have added a 10 EMA to easily identify a change in trend.
I would recommend a user to read more about the Summation index and its utilities before using this indicator.
Combo Backtest 123 Reversal & Dynamic Momentum Index This is combo strategies for get a cumulative signal.
First strategy
This System was created from the Book "How I Tripled My Money In The
Futures Market" by Ulf Jensen, Page 183. This is reverse type of strategies.
The strategy buys at market, if close price is higher than the previous close
during 2 days and the meaning of 9-days Stochastic Slow Oscillator is lower than 50.
The strategy sells at market, if close price is lower than the previous close price
during 2 days and the meaning of 9-days Stochastic Fast Oscillator is higher than 50.
Second strategy
This indicator plots Dynamic Momentum Index indicator. The Dynamic Momentum
Index (DMI) was developed by Tushar Chande and Stanley Kroll. The indicator
is covered in detail in their book The New Technical Trader.
The DMI is identical to Welles Wilder`s Relative Strength Index except the
number of periods is variable rather than fixed. The variability of the time
periods used in the DMI is controlled by the recent volatility of prices.
The more volatile the prices, the more sensitive the DMI is to price changes.
In other words, the DMI will use more time periods during quiet markets, and
less during active markets. The maximum time periods the DMI can reach is 30
and the minimum is 3. This calculation method is similar to the Variable
Moving Average, also developed by Tushar Chande.
The advantage of using a variable length time period when calculating the RSI
is that it overcomes the negative effects of smoothing, which often obscure short-term moves.
The volatility index used in controlling the time periods in the DMI is based
on a calculation using a five period standard deviation and a ten period average
of the standard deviation.
WARNING:
- For purpose educate only
- This script to change bars colors.

Combo Strategy 123 Reversal & Dynamic Momentum Index This is combo strategies for get a cumulative signal.
First strategy
This System was created from the Book "How I Tripled My Money In The
Futures Market" by Ulf Jensen, Page 183. This is reverse type of strategies.
The strategy buys at market, if close price is higher than the previous close
during 2 days and the meaning of 9-days Stochastic Slow Oscillator is lower than 50.
The strategy sells at market, if close price is lower than the previous close price
during 2 days and the meaning of 9-days Stochastic Fast Oscillator is higher than 50.
Second strategy
This indicator plots Dynamic Momentum Index indicator. The Dynamic Momentum
Index (DMI) was developed by Tushar Chande and Stanley Kroll. The indicator
is covered in detail in their book The New Technical Trader.
The DMI is identical to Welles Wilder`s Relative Strength Index except the
number of periods is variable rather than fixed. The variability of the time
periods used in the DMI is controlled by the recent volatility of prices.
The more volatile the prices, the more sensitive the DMI is to price changes.
In other words, the DMI will use more time periods during quiet markets, and
less during active markets. The maximum time periods the DMI can reach is 30
and the minimum is 3. This calculation method is similar to the Variable
Moving Average, also developed by Tushar Chande.
The advantage of using a variable length time period when calculating the RSI
is that it overcomes the negative effects of smoothing, which often obscure short-term moves.
The volatility index used in controlling the time periods in the DMI is based
on a calculation using a five period standard deviation and a ten period average
of the standard deviation.
WARNING:
- For purpose educate only
- This script to change bars colors.
