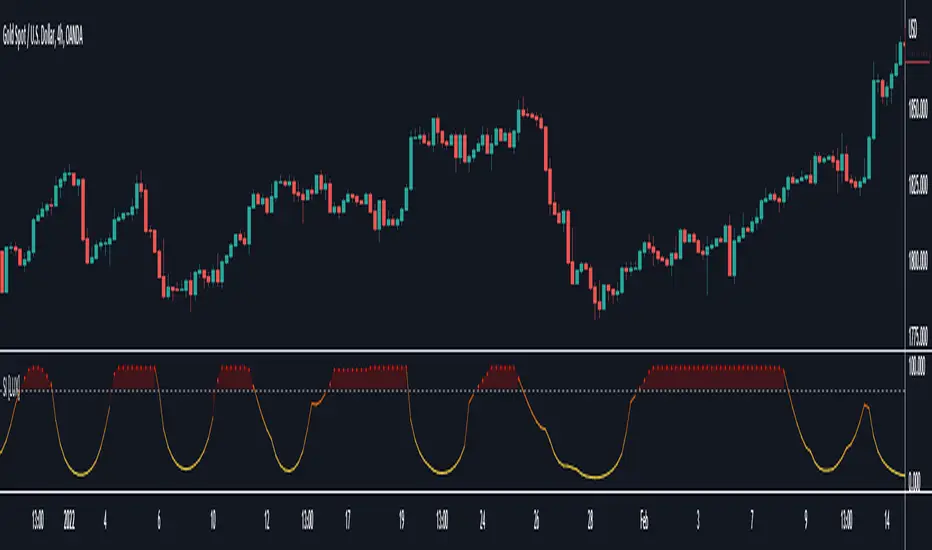
Squeeze Index [LuxAlgo]The Squeeze Index aims to measure the action of price being squeezed, and is expressed as a percentage, with higher values suggesting prices are subject to a higher degree of compression.
Settings
Convergence Factor: Convergence factor of exponential envelopes.
Length: Period of the indicator.
Src: Source input of the indicator.
Usage
Prices being squeezed refer to the action of price being compressed within a tightening area. Prices in a tight area logically indicate a period of stationarity, price breaking out of this area will generally indicate the trader whether to buy or sell depending on the breakout direction.
The convergence factor and length settings both play an important role in the returned indicator values. A convergence factor greater than the period value will detect more squeezed prices area, while a period greater than the convergence will return fewer detected squeezed areas.
We recommend using a convergence factor equal to the period setting or a convergence factor twice as high.
The above chart makes use of a convergence factor of 100 and a period of 10.
Due to the calculation method, it is possible to see retracements being interpreted as price squeezing. This effect can be emphasized with higher convergence factor values.
Details
In order to measure the effect of price being squeezed in a tighter area we refer to damping, where the oscillations amplitude of a system decrease over time. If the envelopes of a damped system can be estimated, then getting the difference between the upper and lower extremity of these envelopes would return a decreasing series of values.
This approach is used here. First the difference between the exponential envelopes extremities is obtained, the logarithm of this difference if obtained due to the extremities converging exponentially toward their input.
We then use the correlation oscillator to get a scaled measurement.
ابحث في النصوص البرمجية عن "index"
NSE Paper Stocks IndexThis is the script to create a custom index of NSE paper stocks. in this example 11 stocks are selected

Directional Index Macro IndicatorWhat is This For?
The default settings for this indicator are for BINANCE:BTCUSDT and intended to be used on the 3D timeframe to identify market trends. This indicator does a great job identifying whether the market is bullish, bearish, or consolidating. This can also work well on lower time frames to help identify when a trend is strong or when it's reversing.
Directional Index Rate of Change
Core to this indicator is the rate at which DI+ and DI- are moving away or towards each other. This is called The Rate of Change (ROC). "The ROC length dictates how many bars back you want to compare to the current bar to see how much it has changed. It is calculated like this:
(source - source /source ) * 100"
The rate of change is smoothed using an EMA. A shorter EMA length will cause the ROC to flip back and forth between positive and negative while a larger EMA length will cause the ROC to change less often. Since the rate of change is used to indicate periods of 'consolidation', you want to find a setting that doesn't flip back and forth too often. Between the DI+ and DI- is a blue centerline. Offset from this centerline is a channel that is used to filter out false crosses of the DI+ and DI-. Sometimes, the DI+ and DI- lines will come together in this channel and cross momentarily before resuming the direction prior to the cross. When this happens, you don't want to flip your bias too soon. The wider the channel, the later the indicator will signal a DI reversal. A narrower channel will call it sooner but risks being more choppy and indicating a false cross.
Indicator Status Line
This indicator has 4 values in the status line (in order):
DI+
DI-
Distance between DI+ and DI-
DI Rate of Change ( how quickly are DI+ and DI- moving away or towards center )
Indicator Plots
This indicator plots DI+ (green), DI- (red), and a center channel between DI- and DI+. Across the top of the indicator, red and green triangles indicate the market trend while the background changes to show whether the price is in an impulse wave or consolidating. This makes up 4 possible scenarios:
Bullish impulse wave ( green triangle up + green background )
Bullish consolidation ( green triangle up + yellow background )
Bearish impulse wave ( red triangle down + red background )
Bearish consolidation ( red triangle down + yellow background )
Summary
Combined with support and resistance levels, volume, and your other favorite indicators, this can be a useful tool for validating that your entries are not going against the trend.
Disclaimer
This is not financial advice. Do not take trades only based on the DI+ and DI- crossing. Always use multiple indicators to validate your entries and never take a trade when you aren’t emotionally grounded. Have a plan. Stick to the plan.
The screenshot for this strategy is of a manual historical review of BTC on the 3 day chart. The indicator was built to try and mimic the chart above. You’ll see that it nails it sometimes, is a little late sometimes, and chops around between consolidation and impulse waves when it should stay in consolidation. Share your settings if you are able to improve the choppiness without sacrificing catching the reversals early.

Stock Strength Index by zdmreThe basic idea behind indicators is "to buy the strong one and to sell the weak one". This indicator yield entry and exit signals for stock trading.
You can view the STRENGTH INDEX for the symbol you want in this indicator.
Formula
(X - ((RMA(t-1) * (n-1)) + X(t)) / n) / X * 100
n = The length of the Moving Average (defval = 200)
X = Price
t = Timeframe
#DYOR

RAS.V2 Strength Index OscillatorHeavily modified version of my previous "Relative Aggregate Strength Oscillator" -Added high/low lines, alma curves,, lrc bands, changed candle calculations + other small things. Replaces the standard RSI indicator with something a bit more insightful.
Credits to @wolneyyy - 'Mean Deviation Detector - Throw Out All Other Indicators ' And @algomojo - 'Responsive Coppock Curve'
And the default Relative Strength Index
The candles are the average of the MFI ,CCI ,MOM and RSI candles, they seemed similar enough in style to me so I created candles out of each and the took the sum of all the candle's OHLC values and divided by 4 to get an average, same as v1 but with some tweaks. Previous Peaks and Potholes visible with the blue horizontal lines which adjust when a new boundary is established. Toggle alma waves or smalrc curves or both to your liking. This indicator is great for calling out peaks and troughs in realtime, although is best when combined with other trusted indicators to get a consensus.

Relative Volume Force IndexThis indicator can anticipate the market movements. Its posible because it calculates how much force (volume) it's necessary to move the price up or down. If it's necessary a lot of volume to move the price a little it's a reversion signal, but if a little volume could change the price whit elevate volatility, it's signal of reversion too. The indicator plots red if the market is down, and green if it's up, the size and the color of the bars cand demonstrate the movement relative force. Does it by the configurable averages. Not works well whit poor liquidity.

VIDYA (Variable Index Dynamic Average) [Loxx]Variable Index Dynamic Average Technical Indicator (VIDYA) was developed by Tushar Chande. It is an original method of calculating the Exponential Moving Average (EMA) with the dynamically changing period of averaging.
This is an exact clone of the VIDYA MT4 indicator
**Future updates
I might change the way it calculates trend direction so its less choppy

Education: INDEXThis is an INDEX page where educational links/scripts are sorted in the script itself (see below)
For example:
- where is the link of the 'var' article/idea?
-> search in the script comments below for Keywords -> var -> look for the date ->
now you will find the link at the date of update

LS Volatility Index█ OVERVIEW
This indicator serves to measure the volatility of the price in relation to the average.
It serves four purposes:
1. Identify abnormal prices, extremely stretched in relation to an average;
2. Identify acceptable prices in the context of the main trend;
3. Identify market crashes;
4. Identify divergences.
█ CONCEPTS
The LS Volatility Index was originally described by Brazilian traders Alexandre Wolwacz (Stormer) , Fabrício Lorenz , and Fábio Figueiredo (Vlad)
Basically, this indicator can be used in two ways:
1. In a mean reversion strategy , when there is an unusual distance from it;
2. In a trend following strategy , when the price is in an acceptable region.
Perhaps the version presented here may have some slight differences, but the core is the same.
The original indicator is presented with a 21-period moving average, but here this value is customizable.
I made some fine tuning available, namely:
1. The possibility of smoothing the indicator;
2. Choose the type of moving average;
3. Customizable period;
4. Possibility to show a moving average of the indicator;
5. Color customization.
█ CALCULATION
First, the distance of the price from a given average in percentage terms is measured.
Then, the historical average volatility is obtained.
Finally the indicator is calculated through the ratio between the distance and the historical volatility.
To facilitate visualization, the result is normalized in a range from 0 to 100.
When it reaches 0, it means the price is on average.
When it hits 100, it means the price is way off average (stretched).
█ HOW TO USE IT
Here are some examples:
1. In a return-to-average strategy
2. In a trend following strategy
3. Identification of crashes and divergences
█ THANKS AND CREDITS
- Alexandre Wolwacz (Stormer), Fabrício Lorenz, Fábio Figueiredo (Vlad)
- Feature scaler (for normalization)
- HPotter (for calc of Historical Volatility)

Aggregated Money Flow Index - InFinitoModified Version of In-Built Money Flow Index Indicator. Aggregated Volume is used for it's calculation + a couple of other features.
Aggregation code originally from Crypt0rus
***The indicator can be used for any coin/symbol to aggregate volume , but it has to be set up manually***
***The indicator can be used with specific symbol data only by disabling the aggregation option, which allows for it to be used on any symbol***
- Calculated based on Aggregated Volume instead of by symbol volume . Using aggregated data makes it more accurate and allows to compare volume flow between different kinds of markets (Spot, Futures , Perpetuals, Futures+Perpetuals and All Volume ).
- As well, in order to make the data as accurate as possible, the data from each exchange aggregated is normalized to report always in terms of 1 BTC . In case this indicator is used for another symbol, the calculations can be adjusted manually to make it always report data in terms of 1 contract/coin.
- Added Moving Average ( SMA , EMA , WMA , RMA, VWMA ) that can be plotted to the MFI
- Added 10/90 level and 45/55 range level
Things to look for:
- Divergences: Can be a very good reversal signal
- MA crossovers & Oversold/Overbought levels crossover: With proper confluence, entering a position at MA crossover and exiting at oversold/overbought levels can give very good swing setups (Or scalps on LTF)
- Center range retests: Once in a trend, retesting the middle range can give very good entries and confirmations of the trend
- Confluence of the latter: In combination, if more than one of these occur at the same time it can give more clarity regarding the current state of the market.

Adaptive Average Vortex Index [lastguru]As a longtime fan of ADX, looking at Vortex Indicator I often wondered, where is the third line. I have rarely seen that anybody is calculating it. So, here it is: Average Vortex Index - an ADX calculated from Vortex Indicator. I interpret it similarly to the ADX indicator: higher values show stronger trend. If you discover other interpretation or have suggestions, comments are welcome.
Both VI+ and VI- lines are also drawn. As I use adaptive length calculation in my other scripts (based on the libraries I've developed and published), I have also included the possibility to have an adaptive length here, so if you hate the idea of calculating ADX from VI, you can disable that line and just look at the adaptive Vortex Indicator.
Note that as with all my oscillators, all the lines here are renormalized to -1..1 range unlike the original Vortex Indicator computation. To do that for VI+ and VI- lines, I subtract 1 from their values. It does not change the shape or the amplitude of the lines.
Adaptation algorithms are roughly subdivided in two categories: classic Length Adaptations and Cycle Estimators (they are also implemented in separate libraries), all are selected in Adaptation dropdown. Length Adaptation used in the Adaptive Moving Averages and the Adaptive Oscillators try to follow price movements and accelerate/decelerate accordingly (usually quite rapidly with a huge range). Cycle Estimators, on the other hand, try to measure the cycle period of the current market, which does not reflect price movement or the rate of change (the rate of change may also differ depending on the cycle phase, but the cycle period itself usually changes slowly).
VIDYA - based on VIDYA algorithm. The period oscillates from the Lower Bound up (slow)
VIDYA-RS - based on Vitali Apirine's modification of VIDYA algorithm (he calls it Relative Strength Moving Average). The period oscillates from the Upper Bound down (fast)
Kaufman Efficiency Scaling - based on Efficiency Ratio calculation originally used in KAMA
Fractal Adaptation - based on FRAMA by John F. Ehlers
MESA MAMA Cycle - based on MESA Adaptive Moving Average by John F. Ehlers
Pearson Autocorrelation* - based on Pearson Autocorrelation Periodogram by John F. Ehlers
DFT Cycle* - based on Discrete Fourier Transform Spectrum estimator by John F. Ehlers
Phase Accumulation* - based on Dominant Cycle from Phase Accumulation by John F. Ehlers
Length Adaptation usually take two parameters: Bound From (lower bound) and To (upper bound). These are the limits for Adaptation values. Note that the Cycle Estimators marked with asterisks(*) are very computationally intensive, so the bounds should not be set much higher than 50, otherwise you may receive a timeout error (also, it does not seem to be a useful thing to do, but you may correct me if I'm wrong).
The Cycle Estimators marked with asterisks(*) also have 3 checkboxes: HP (Highpass Filter), SS (Super Smoother) and HW (Hann Window). These enable or disable their internal prefilters, which are recommended by their author - John F. Ehlers . I do not know, which combination works best, so you can experiment.
If no Adaptation is selected ( None option), you can set Length directly. If an Adaptation is selected, then Cycle multiplier can be set.
The oscillator also has the option to configure the internal smoothing function with Window setting. By default, RMA is used (like in ADX calculation). Fast Default option is using half the length for smoothing. Triangle , Hamming and Hann Window algorithms are some better smoothers suggested by John F. Ehlers.
After the oscillator a Moving Average can be applied. The following Moving Averages are included: SMA , RMA, EMA , HMA , VWMA , 2-pole Super Smoother, 3-pole Super Smoother, Filt11, Triangle Window, Hamming Window, Hann Window, Lowpass, DSSS.
Postfilter options are applied last:
Stochastic - Stochastic
Super Smooth Stochastic - Super Smooth Stochastic (part of MESA Stochastic ) by John F. Ehlers
Inverse Fisher Transform - Inverse Fisher Transform
Noise Elimination Technology - a simplified Kendall correlation algorithm "Noise Elimination Technology" by John F. Ehlers
Momentum - momentum (derivative)
Except for Inverse Fisher Transform , all Postfilter algorithms can have Length parameter. If it is not specified (set to 0), then the calculated Slow MA Length is used. If Filter/MA Length is less than 2 or Postfilter Length is less than 1, they are calculated as a multiplier of the calculated oscillator length.
More information on the algorithms is given in the code for the libraries used. I am also very grateful to other TradingView community members (they are also mentioned in the library code) without whom this script would not have been possible.

Uptrend and Oversold Index Swing Trading System 8H--- Foreword ---
The Overbought and Oversold Index Swing Trading System or short: I11L Hypertrend primarily uses money management Strategies, EMA and SMA and my momentum Ideas for trying to produce satisfactory Alpha over a timespan of multiple years.
--- How does it Work? ---
It uses 20 different EMA's and SMA's to produce a score for each Bar.
It will credit one Point If the EMA is above the SMA.
A high score means that there is a strong Uptrend.
Spotting the strong Uptrend early is important.
The I11L Hypertrend System trys to spot the "UPTREND" by checking for a crossover of the Score(EMA) / Score(SMA).
A low score means that there is a strong Downtrend.
Its quite common to see a reversal to the mean after a Downtrend and spotting the bottom is important.
The System trys to spot the reversal, or "OVERSOLD" state by a crossunder of the Score(EMA) / Score(SMA).
--- What can i customize? ---
-> Trading Mode: You can choose between two different trading modes, Oversold and Overbought(trend) and Random Buys to check if your systems Profitfactor is actually better then market.
-> Work with the total equity: The system uses the initial capital per default for Backtesting purposes but seeing the maximum drawdown in a compounding mode might help!
-> Use a trailing SL: A TSL trys to not lose too much if the trade goes against your TP
-> Lookbackdistance for the Score: A higher Lookbackdistance results in a more lagging indicator. You have to find the balance between the confirmation of the Signal and the frontrunning.
-> Leverage: To see how your strategie and your maximum Drawdown with the total equity mode enabled would have performed.
-> Risk Capital per Trade unleveraged: How much the underlying asset can go against your position before the TSL hits, or the SL if no TSL is set.
-> TPFactor: Your risk/reward Ratio. If you risk 3% and you set the ratio to 1.2, you will have a TP at 3 * 1.2 = 3.6%
-> Select Date: Works best in the 8H Timeframe for CFD's. Good for getting a sense of what overfitting actually means and how easy one can fool themself, find the highest Profitfactor setting in the first Sector (Start - 2012) and then see if the second Sector (2012 - Now) produces Alpha over the Random Buy mode.
--- I have some questions about the System ---
Dear reader, please ask the question in the comment Section and i will do my best to assist you.

ICT Index Futures Vertical LinesLearning to trade is complicated enough, so to make the process it little less daunting, I decided to create something helpful.
This indicator relieves you of drawing the same lines and levels over and over each trading day.
It also provides key price levels for you to watch when the trading session starts.
This project is inspired by the ICT 2022 Mentorship.
This indicator was designed and tested to practice and trade the CME Index Futures like Nasdaq, S&P500 and the DOW.
The concepts by ICT are known to work on other markets like Crypto, but I haven't tested that so use at your own risk.
Features:
When a new trading day starts, the following lipstick is put on the chart:
Vertical lines:
- Globex (Overnight) Session Start @17.00
- New York Midnight @ 00:00
- New York AM Session Start @ 08.30
- CME Open @ 09.30
- New York Lunch Start @12.00
- New York PM Session Start @13.00
- New York PM Session End @ 16.30
Important levels:
- Globex (Overnight) Session Opening price
- Globex (Overnight) Session High
- Globex (Overnight) Session Low
- New York Mignight Opening Price
Additional features:
- Shows the day of the week at the bottom for your convenience
- London Killzone Vertical lines
- London Killzone Highlight
- NY Lunch No-Trade-Zone Highlight
- Important levels have a small label to show their meaning and price
- Almost everything is customizable: colors, line types, times, etc
- Customizable timezone setting in case you don't want to work on ICT's recommended timezone (New York UTC-4)
- Toggle to Show only Today's drawings on the chart. You can choose to display all chart lipstick from almost a month of trading data to do your research. Ideal if you want to determine the daily profiles for example.
Screenshots:
London Killzone Highlight turned on:
Multi Day Lipstick:

Multi-Timeframe RSI GridThe relative strength index (RSI) is a momentum indicator that measures the magnitude of recent price changes to evaluate overbought or oversold conditions. The RSI is normally displayed as an oscillator separately from price and can have a reading from 0 to 100. This indicator displays the current RSI levels at up to 6 timeframes (of your choosing) in a grid. If the RSI levels reach overbought (above 70) or oversold (below 30) conditions, it changes the color to help you see that RSI has reached extreme levels. Note that in TradingView, when the chart is on a higher timeframe, the lower timeframe RSI levels don't calculate properly. If those conditions are met, this indicator will hide those values in the grid. If none of your selected values are available, it hides the table completely. There are configuration options, like:
Position the grid in any corner of the screen
Style customization (color, size)
Customize RSI length

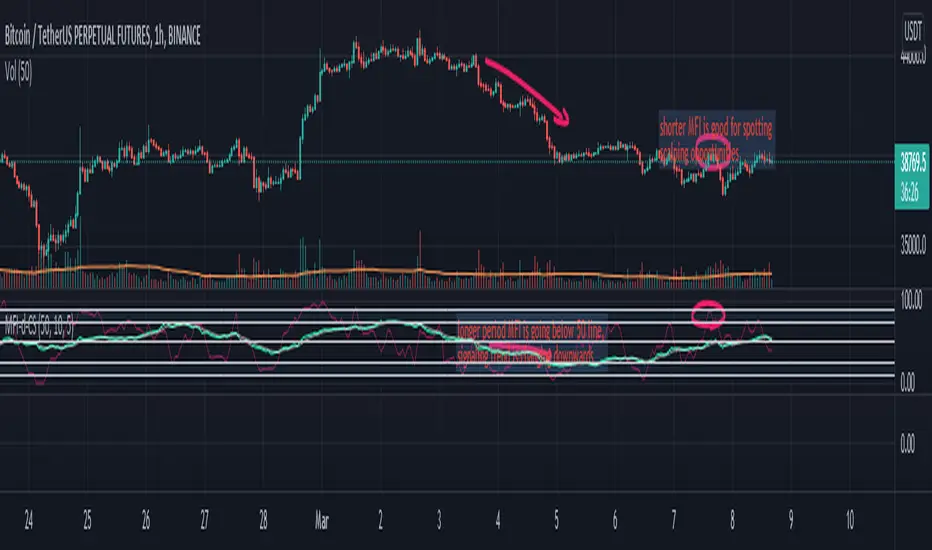
Money Flow Index (double) by CoinStaghey Piners community,
this is an iteration of inbuilt MFI script, with two MFIs of different lengths and one Moving Average which is dependent on MFI 1.
I find it useful to see the trend of longer MFI period, which tells me what direction to trade. On shorter period MFI I'm looking at Oversold or Overbought zones - while quicker MFI index is there, I'm looking to Buy/Sell, depending on trend.
Alternatively, you can use also MFI1 and MA crossovers to spot potential entries.
It seems like a good tool for crypto markets on any timeframes - from 5min, to 4h.
Trend Analysis Index [CC]The Trend Analysis Index was created by Adam White and not to be confused with the Trend Analysis Indicator that I also published. This indicator operates under the same idea but using a completely different calculation to achieve similar results. The idea behind this indicator is for a combination of volatility and trend confirmation. If the indicator is above it's signal line then the stock is very volatile and vice versa. If the stock is currently trending as in above a chosen moving average for example and the indicator falls below the signal line then there is a pretty good chance in a trend reversal. The recommended buy and sell system to use is to pair this indicator with a moving average crossover system which I have included in the script. Buy when the indicator is above it's signal and the shorter moving average crosses above the longer moving average. For selling you would do the same and sell when the indicator is above it's signal and the shorter moving average crosses below the longer moving average. I have included strong buy and sell signals in addition to the normal ones so stronger signals are darker in color and normal signals are lighter in color.
Let me know what other indicators or scripts you would like to see me publish!

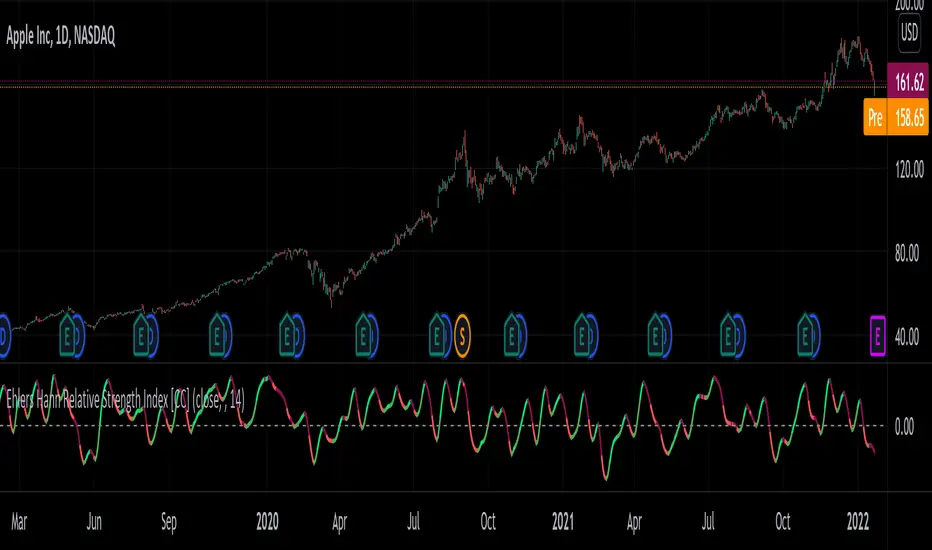
Ehlers Hann Relative Strength Index [CC]The Hann Relative Strength Index was created by John Ehlers (Stocks and Commodities Jan 2022 pgs 26-28) and this indicator builds upon his Hann Window Indicator to create an unique rsi indicator that doesn't rely on overbought or oversold levels to determine a reversal point and also provides a very superior smoothing without any of the lag associated with traditional smoothing. A much more useful RSI than the standard version in my honest opinion. Short term you buy when the line turns green and sell when it turns red. Medium to long term you buy when the indicator rises above the 0 line and sell when it falls below the 0 line. I have included strong buy and sell signals in addition to normal ones so strong signals are darker in color and normal signals are lighter in color.
Let me know if there are any other indicators or scripts you would like to see me publish!
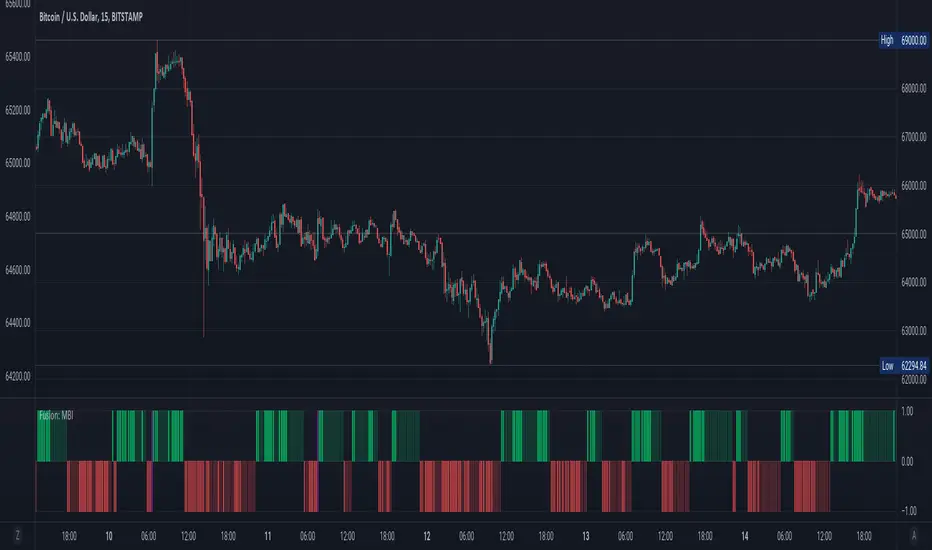
Fusion: Monster Breakout IndexThis indicator is designed to display on both the main chart and a separate chart area. If you want to display it on the main chart then flip the 4 display options. Well... you might want to:
Disable it first
Move it
Flip the display options
and then show it so the move doesn't look ugly.
Display options:
On a separate chart it will display red and lime bars showning potential breakouts.
On the main chart it will show a channel.
Personally like to see it both ways so I generally have two copies of it with one on the main chart.
The " Bar back marker " option is a tiny down arrow at the top of the chart showing where the length of the lookback starts from the current bar. So, if you set the length to 10 then this will be 10 bars back from the current bar. You can show it on or off the main chart but it's not all that visually tasteful off the main chart.
The length is certainly not some optimized setting so set to whatever suits your needs.
The source I set at hl2 which makes more sense to me than the default most people use of close so again, don't assume the settings are correct for your environment... play with it.
Credit:
Modified from the "Monster Breakout Index" by racer8 under the licence of: This source code is subject to the terms of the Mozilla Public License 2.0 at mozilla.org
The code is structured to easily drop into a bigger system so use it as a lone indicator or add the code to some bigger project you are creating. If you do, send me a note, it would be nice to know it's being well used.
Finally, if you find value please do make a comment, give a thumbs up etc.
Enjoy and good luck!
Relative Volume Strength Index (MZ RVSI)INTRODUCTION
Volume always plays a role of key indication for price movements and momentum and I always found the same problem with all available volume oscillators and indicators which is that their data is always in compounded form that can’t be easily used in raw form as a parameter in many strategies.
This indicator uses raw volume data from one of following oscillators:
TFS Volume Oscillator
On Balance Volume
Klinger Volume Oscillator
Cumulative Volume Oscillator
Volume Zone Oscillator
Then this data goes through the following process of noise filtration:
Hull Moving Average of input data to reduce noise
Relative Strength Index of HMA
Hull Moving Average of RSI to reduce noise for finalized RVSI
ADDITIONAL FEATURES
Heiken-Ashi: Heiken-Ashi values are optional to use in calculations and I’ve set them to default as I found good results with them.
Slope for Trend Detection: Slope of finalized RVSI is calculated in order to check volume trend direction. Another additional feature of Volume breakouts is also added which is used in dynamic coloring of RVSI. Dynamic color indications are as follows.
Green Color:
Strong Volume Uptrend above volume breakout point
Fuchsia Color:
Weak Volume Uptrend below volume breakout point but slope supported
Red Color:
Strong Volume Downtrend below volume breakout point
Gray Color:
Weak Volume Downtrend above volume breakout point but slope supported
Yellow Color:
Possible trend reversal as slope is flat.
DEFAULTS SETTINGS
Volume length is 30 (Better for timeframes higher than 1H)
Hull Moving Average and RSI length is set to 14
ADDITIONAL APPLICATIONS
This indicator can be used as divergence detection tool for volume same way as RSI is used for price divergence. I’ll soon add divergence signals inside the code and this code can be used in multiple ways as volume breakout indication in strategies for better results.

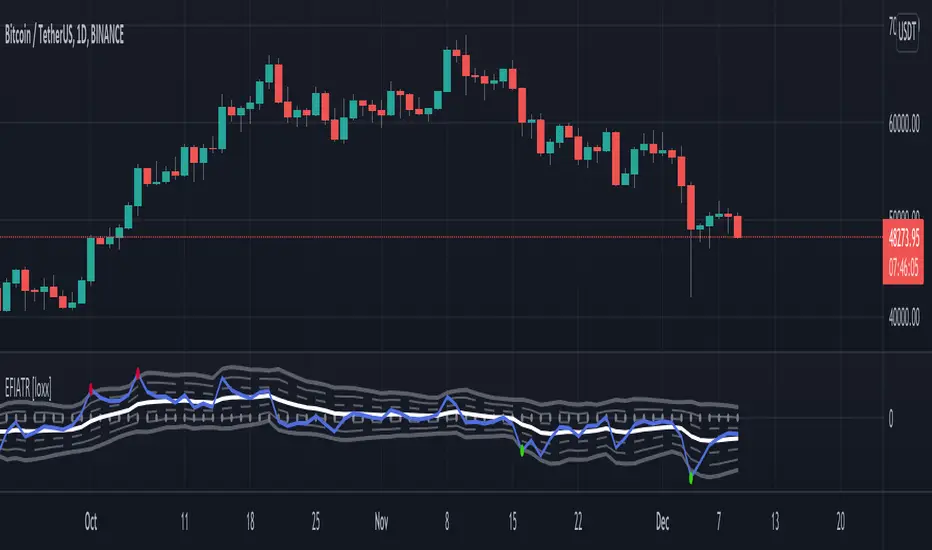
Elder Force Index With ATR Channels [loxx]Elder Force Index With ATR Channels, adaptive from original script by Dr. Alexander Elder
What it does
-EFI is used to sport reversals mainly on the weekly time frame
-When EFI spikes over 3 x ATR calculated on the signal line, price is said to have exhausted and you can start looking for reversals
Features
-Change all inputs
-Truncate EFI at 4 x ATR so as to not squish the indicator
-Open source, use code as you wish. If you use this code, shoot me a line and tell me how you're using it
RSI Levels, Multi-TimeframeThe relative strength index (RSI) is a momentum indicator that measures the magnitude of recent price changes to evaluate overbought or oversold conditions. RSI is normally displayed as an oscillator separately from price and can have a reading from 0 to 100. This indicator takes the RSI and plots the 30 & 70 levels onto the price chart so you can see when price is going to meet the 30 or 70 levels. The reason the 30 & 70 levels are important is because many traders (and bots) use those as signals to buy (at 30 RSI) or sell (at 70 RSI). Additionally, this indicator allows you to display not just the RSI levels of your currently viewed timeframe on the chart, but also shows the RSI levels of up to 6 different timeframes on the same chart. This allows you to quickly see if multiple RSI levels are aligning across different timelines, which is an even stronger indication that price is going to change direction when it meets those levels on the chart. There are a lot of nice configuration options, like:
Style customization (color, thickness, size)
Labels on the chart so you can tell which plots are the RSI levels
Optionally display the plot as a horizontal line if all you care about is the RSI level right now
Toggle overbought (RSI 70) or oversold (RSI 30) on/off completely

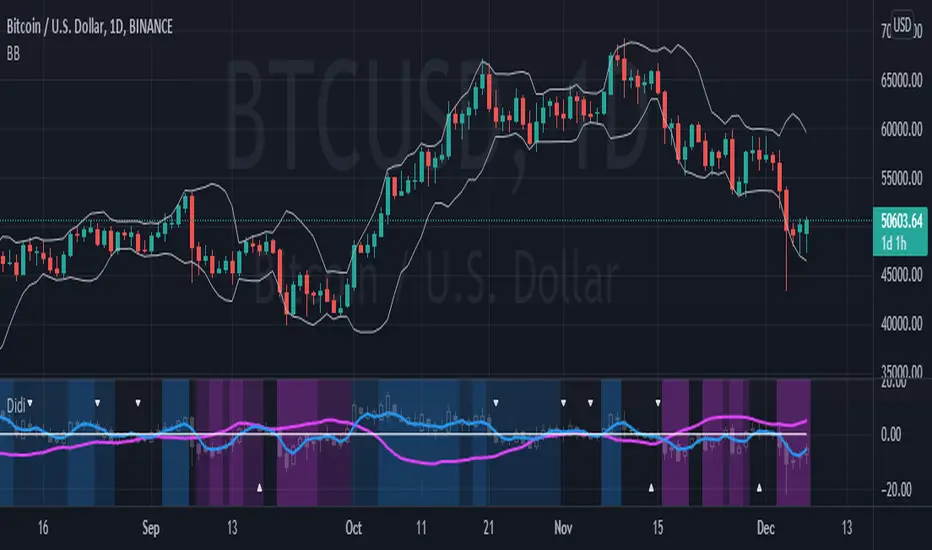
Didi index setupBeta version of the Didi setup combo - (almost) everything in one single indicator:
Didi index + DMI + TRIX + Stochastic.
Better description on how to use and color customization to come in next versions.
Enjoy!
Correlation IndexShows how often and how much the underlying security deviates from the base stock.
Indices that help in the selection of securities:
Lst10 - last 10(long factor parameter) periods average
Aver - fulltime averaged
pwr - total deviation area from base
ust - unstability (drawdown index)
cor - percent of positive bars
cross - fulltime averaged deviation
