[blackcat] L1 Banker Entry IndicatorLevel: 1
Background
@testtttt1111 inquired me how to model banker entry
Function
L1 Banker Entry Indicator demostrates a simple model of banker entry for long or short
Key Signal
bankerthreshold ---> customized input for threshold value for banker move identification
pumpdumpsoon ---> alerts for pump or dump start soon in green color
longshortentry ---> alerts for long or short entry in orange color
bankermove ---> alerts for banker move in yellow color
Pros and Cons
Pros:
1. indicating banker move and entries
2. simple classification of banker move alerts
Cons:
1. no direction can be identified
2. no volume information is utilized for big fund move
Remarks
A demo for banker entry inquired by @testtttt1111
Readme
In real life, I am a prolific inventor. I have successfully applied for more than 60 international and regional patents in the past 12 years. But in the past two years or so, I have tried to transfer my creativity to the development of trading strategies. Tradingview is the ideal platform for me. I am selecting and contributing some of the hundreds of scripts to publish in Tradingview community. Welcome everyone to interact with me to discuss these interesting pine scripts.
The scripts posted are categorized into 5 levels according to my efforts or manhours put into these works.
Level 1 : interesting script snippets or distinctive improvement from classic indicators or strategy. Level 1 scripts can usually appear in more complex indicators as a function module or element.
Level 2 : composite indicator/strategy. By selecting or combining several independent or dependent functions or sub indicators in proper way, the composite script exhibits a resonance phenomenon which can filter out noise or fake trading signal to enhance trading confidence level.
Level 3 : comprehensive indicator/strategy. They are simple trading systems based on my strategies. They are commonly containing several or all of entry signal, close signal, stop loss, take profit, re-entry, risk management, and position sizing techniques. Even some interesting fundamental and mass psychological aspects are incorporated.
Level 4 : script snippets or functions that do not disclose source code. Interesting element that can reveal market laws and work as raw material for indicators and strategies. If you find Level 1~2 scripts are helpful, Level 4 is a private version that took me far more efforts to develop.
Level 5 : indicator/strategy that do not disclose source code. private version of Level 3 script with my accumulated script processing skills or a large number of custom functions. I had a private function library built in past two years. Level 5 scripts use many of them to achieve private trading strategy.
ابحث في النصوص البرمجية عن "indicator"

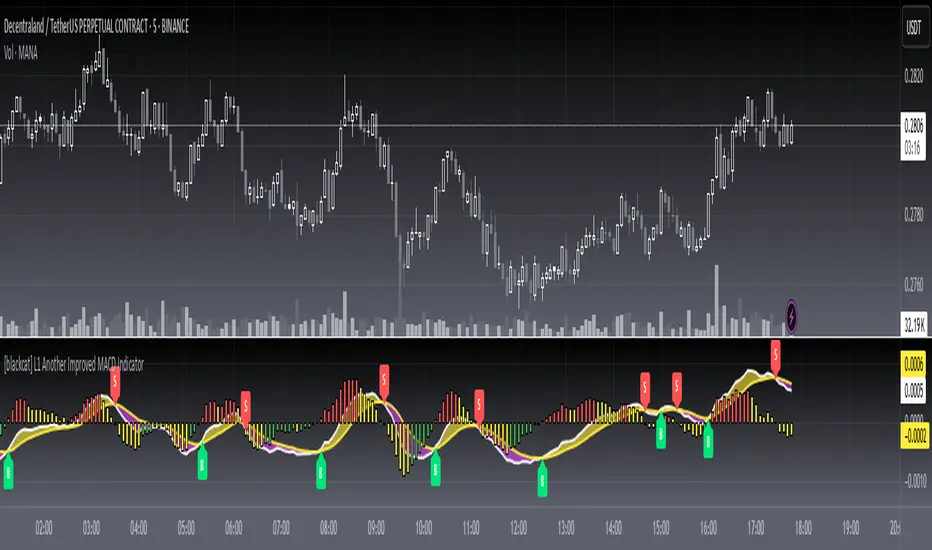
[blackcat] L1 Another Improved MACD IndicatorLevel: 1
Background
The MACD is a superior derivative of moving average crossovers and was developed by Gerald Appel in 1979 as a market timing tool. MACD uses two exponential moving averages with different bar periods, which are then subtracted to form what Mr. Appel calls the Fast Line. A 9-period moving average of the fast line creates the slow line.
Function
L1 Another Improved MACD Indicator improves MACD histogram by customized an algorithm and add three levels of long entry alerts derived from ema ().
Key Signal
diff --> classic MACD diff fast line in white
dea --> classic MACD dea slow line in yellow
macd --> classic difference histogram,but I did not use it directly in the plot.
macd1 --> ema3 of macd
Pros and Cons
Pros:
1. more clear sub level trend change with new histograms
Cons:
1. need sophisticated knowledge of MACD to use this well
2. this still requires a lot of MACD experience to obtain reliable trading signals
Remarks
Another improved MACD on histogram
Readme
In real life, I am a prolific inventor. I have successfully applied for more than 60 international and regional patents in the past 12 years. But in the past two years or so, I have tried to transfer my creativity to the development of trading strategies. Tradingview is the ideal platform for me. I am selecting and contributing some of the hundreds of scripts to publish in Tradingview community. Welcome everyone to interact with me to discuss these interesting pine scripts.
The scripts posted are categorized into 5 levels according to my efforts or manhours put into these works.
Level 1 : interesting script snippets or distinctive improvement from classic indicators or strategy. Level 1 scripts can usually appear in more complex indicators as a function module or element.
Level 2 : composite indicator/strategy. By selecting or combining several independent or dependent functions or sub indicators in proper way, the composite script exhibits a resonance phenomenon which can filter out noise or fake trading signal to enhance trading confidence level.
Level 3 : comprehensive indicator/strategy. They are simple trading systems based on my strategies. They are commonly containing several or all of entry signal, close signal, stop loss, take profit, re-entry, risk management, and position sizing techniques. Even some interesting fundamental and mass psychological aspects are incorporated.
Level 4 : script snippets or functions that do not disclose source code. Interesting element that can reveal market laws and work as raw material for indicators and strategies. If you find Level 1~2 scripts are helpful, Level 4 is a private version that took me far more efforts to develop.
Level 5 : indicator/strategy that do not disclose source code. private version of Level 3 script with my accumulated script processing skills or a large number of custom functions. I had a private function library built in past two years. Level 5 scripts use many of them to achieve private trading strategy.
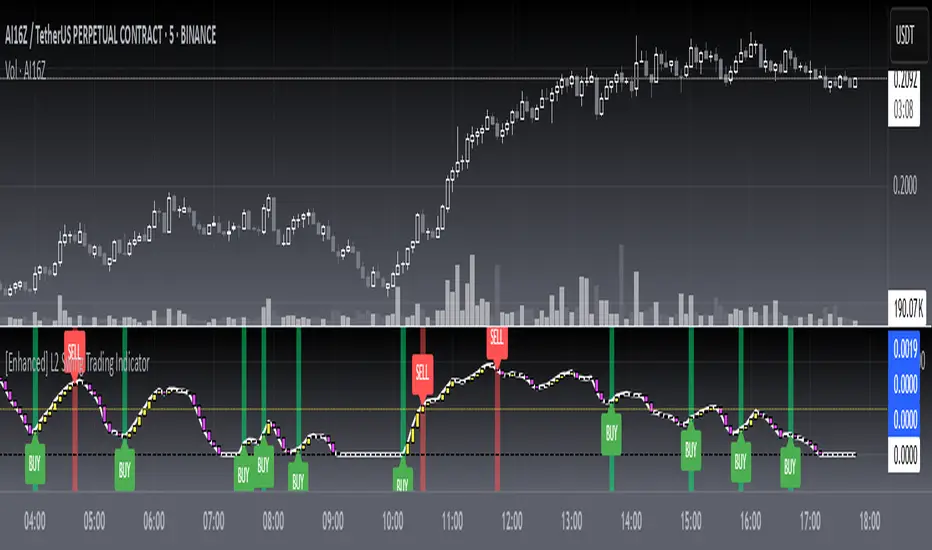
[blackcat] L2 Swing Trading IndicatorLevel: 2
Background
Swing trading is a type of trading aimed at making short to medium term profits from a trading pair over a period of a few days to several weeks. Swing traders mainly use technical analysis to look for trading opportunities. In addition to analyzing price trends and patterns, these traders can also use fundamental analysis.
Function
L2 Swing Trading Indicator
Key Signal
trend --> trend line with color candles standing for trend strength
pump --> whale pump indicator
top --> top zone for selling point
bbuy --> botton zone for buying point
varr1 ---> for selling points
bullbear --> use 50 as bull bear boundary
Pros and Cons
Pros:
1. Clear to see the trend reversals with strength changes
2. Whale pump indicator confirm the validity of trend reversals
Cons:
1. oversold zone is hidden due to using zero line as bottom
Remarks
NA
Readme
In real life, I am a prolific inventor. I have successfully applied for more than 60 international and regional patents in the past 12 years. But in the past two years or so, I have tried to transfer my creativity to the development of trading strategies. Tradingview is the ideal platform for me. I am selecting and contributing some of the hundreds of scripts to publish in Tradingview community. Welcome everyone to interact with me to discuss these interesting pine scripts.
The scripts posted are categorized into 5 levels according to my efforts or manhours put into these works.
Level 1 : interesting script snippets or distinctive improvement from classic indicators or strategy. Level 1 scripts can usually appear in more complex indicators as a function module or element.
Level 2 : composite indicator/strategy. By selecting or combining several independent or dependent functions or sub indicators in proper way, the composite script exhibits a resonance phenomenon which can filter out noise or fake trading signal to enhance trading confidence level.
Level 3 : comprehensive indicator/strategy. They are simple trading systems based on my strategies. They are commonly containing several or all of entry signal, close signal, stop loss, take profit, re-entry, risk management, and position sizing techniques. Even some interesting fundamental and mass psychological aspects are incorporated.
Level 4 : script snippets or functions that do not disclose source code. Interesting element that can reveal market laws and work as raw material for indicators and strategies. If you find Level 1~2 scripts are helpful, Level 4 is a private version that took me far more efforts to develop.
Level 5 : indicator/strategy that do not disclose source code. private version of Level 3 script with my accumulated script processing skills or a large number of custom functions. I had a private function library built in past two years. Level 5 scripts use many of them to achieve private trading strategy.
[blackcat] L1 Trading Risk Assessment Indicator Level: 1
Background
Risk assessment is a general term used in many industries to determine the likelihood of losing an asset, loan, or investment. Risk assessment is important in determining how profitable a particular investment is and which techniques are best for risk mitigation. It shows the upward reward versus the risk profile. Risk assessment is important in determining the rate of return an investor would need to earn in order to consider an investment as worth the potential risk.
Function
L1 Trading Risk Assessment Indicator provides a trading risk evaluation mechanism that follows the megatrend. By defining transaction risk as 4 levels: highly risky, risky, safe, and highly safe, the current bar’s evaluation value can be compared with historical bar data to understand the current level of trading risk and the level of trading risk Trend.
Key Signal
h1~h5 --> trading risk level threshold, which can be adjusted according different markets.
currentsafetylevel --> it indicates current bar risk assessment result
Pros and Cons
Pros:
1. according risk level, proper position size can be adjusted
2. know global trend and select propoer time to exit
Cons:
1. no exact long and short entry are disclosed
2. different markets require different thresholds
Remarks
An improved version of KDJ with less satration observed.
Readme
In real life, I am a prolific inventor. I have successfully applied for more than 60 international and regional patents in the past 12 years. But in the past two years or so, I have tried to transfer my creativity to the development of trading strategies. Tradingview is the ideal platform for me. I am selecting and contributing some of the hundreds of scripts to publish in Tradingview community. Welcome everyone to interact with me to discuss these interesting pine scripts.
The scripts posted are categorized into 5 levels according to my efforts or manhours put into these works.
Level 1 : interesting script snippets or distinctive improvement from classic indicators or strategy. Level 1 scripts can usually appear in more complex indicators as a function module or element.
Level 2 : composite indicator/strategy. By selecting or combining several independent or dependent functions or sub indicators in proper way, the composite script exhibits a resonance phenomenon which can filter out noise or fake trading signal to enhance trading confidence level.
Level 3 : comprehensive indicator/strategy. They are simple trading systems based on my strategies. They are commonly containing several or all of entry signal, close signal, stop loss, take profit, re-entry, risk management, and position sizing techniques. Even some interesting fundamental and mass psychological aspects are incorporated.
Level 4 : script snippets or functions that do not disclose source code. Interesting element that can reveal market laws and work as raw material for indicators and strategies. If you find Level 1~2 scripts are helpful, Level 4 is a private version that took me far more efforts to develop.
Level 5 : indicator/strategy that do not disclose source code. private version of Level 3 script with my accumulated script processing skills or a large number of custom functions. I had a private function library built in past two years. Level 5 scripts use many of them to achieve private trading strategy.

[blackcat] L2 Leading KDJ Candle IndicatorLevel: 2
Background
The KDJ oscillator display consists of 3 lines (K, D and J - hence the name of the display) and 2 levels. K and D are the same lines you see when using the stochastic oscillator. The J line in turn represents the deviation of the D value from the K value. The convergence of these lines indicates new trading opportunities. Just like the Stochastic Oscillator, oversold and overbought levels correspond to the times when the trend is likely to reverse.
Function
L2 Leading KDJ Candle Indicator use candles to indicate KD relationship. E.g. yellow candles for bull (K>=D) and fuchsia candles for bear (K=D and fuchsia for K KDJ K value
d --> KDJ D value
buysig --> KD buy signal in green triangle
selsig --> KD sell signal in red triangle
leadingline --> colorful leading line for KDJ
Pros and Cons
Pros:
1. Candle height can indicates the strength of trend and different colors are used for indicating KD relationship
2. a leading line is added as aux method to confirm KDJ signal
Cons:
1. It may satruate for extreme conditions of long and short as described in the chart, which is inherent KDJ shortcoming.
2. Not accurate for long and short entries and need filtering out noise and fake signal.
Remarks
More direct to observe and confirm trend with the leading line.
Readme
In real life, I am a prolific inventor. I have successfully applied for more than 60 international and regional patents in the past 12 years. But in the past two years or so, I have tried to transfer my creativity to the development of trading strategies. Tradingview is the ideal platform for me. I am selecting and contributing some of the hundreds of scripts to publish in Tradingview community. Welcome everyone to interact with me to discuss these interesting pine scripts.
The scripts posted are categorized into 5 levels according to my efforts or manhours put into these works.
Level 1 : interesting script snippets or distinctive improvement from classic indicators or strategy. Level 1 scripts can usually appear in more complex indicators as a function module or element.
Level 2 : composite indicator/strategy. By selecting or combining several independent or dependent functions or sub indicators in proper way, the composite script exhibits a resonance phenomenon which can filter out noise or fake trading signal to enhance trading confidence level.
Level 3 : comprehensive indicator/strategy. They are simple trading systems based on my strategies. They are commonly containing several or all of entry signal, close signal, stop loss, take profit, re-entry, risk management, and position sizing techniques. Even some interesting fundamental and mass psychological aspects are incorporated.
Level 4 : script snippets or functions that do not disclose source code. Interesting element that can reveal market laws and work as raw material for indicators and strategies. If you find Level 1~2 scripts are helpful, Level 4 is a private version that took me far more efforts to develop.
Level 5 : indicator/strategy that do not disclose source code. private version of Level 3 script with my accumulated script processing skills or a large number of custom functions. I had a private function library built in past two years. Level 5 scripts use many of them to achieve private trading strategy.

L1 Bottomline Reversal IndicatorLevel: 1
Background
Identify the trend - By filtering the trend, traders can select entry points using overbought and overbought signals In an uptrend, for example, traders filter for oversold signals as “long entry” points that correlate with the direction of the trend.
Function
L1 Bottomline Reversal Indicator utilizes three levels of support moving averages as detector of oversold behavior. Once the close breakout the 3rd level, it indicates bottom line appear and long entry there is commonly safe.
Key Signal
sma13 --> typical price trend
lifeline --> bull life line. if close is above lifeline, it indicates bullish state.
costline --> the 1st level of support which may have rebounce once the price drop on it for the first time.
lowbuy --> the 2nd level of support, which indicates oversold starts.
bottomline --> the 3rd level of support, which indicate extreme oversold, long entry there is safe in common sense.
Pros and Cons
Pros:
1. mid-long term trading guide
2. helpful for large time frame e.g. day or week
Cons:
1. Not so stable for small time frame
2. No exit scheme is disclosed.
Remarks
NA
Readme
In real life, I am a prolific inventor. I have successfully applied for more than 60 international and regional patents in the past 12 years. But in the past two years or so, I have tried to transfer my creativity to the development of trading strategies. Tradingview is the ideal platform for me. I am selecting and contributing some of the hundreds of scripts to publish in Tradingview community. Welcome everyone to interact with me to discuss these interesting pine scripts.
The scripts posted are categorized into 5 levels according to my efforts or manhours put into these works.
Level 1 : interesting script snippets or distinctive improvement from classic indicators or strategy. Level 1 scripts can usually appear in more complex indicators as a function module or element.
Level 2 : composite indicator/strategy. By selecting or combining several independent or dependent functions or sub indicators in proper way, the composite script exhibits a resonance phenomenon which can filter out noise or fake trading signal to enhance trading confidence level.
Level 3 : comprehensive indicator/strategy. They are simple trading systems based on my strategies. They are commonly containing several or all of entry signal, close signal, stop loss, take profit, re-entry, risk management, and position sizing techniques. Even some interesting fundamental and mass psychological aspects are incorporated.
Level 4 : script snippets or functions that do not disclose source code. Interesting element that can reveal market laws and work as raw material for indicators and strategies. If you find Level 1~2 scripts are helpful, Level 4 is a private version that took me far more efforts to develop.
Level 5 : indicator/strategy that do not disclose source code. private version of Level 3 script with my accumulated script processing skills or a large number of custom functions. I had a private function library built in past two years. Level 5 scripts use many of them to achieve private trading strategy.

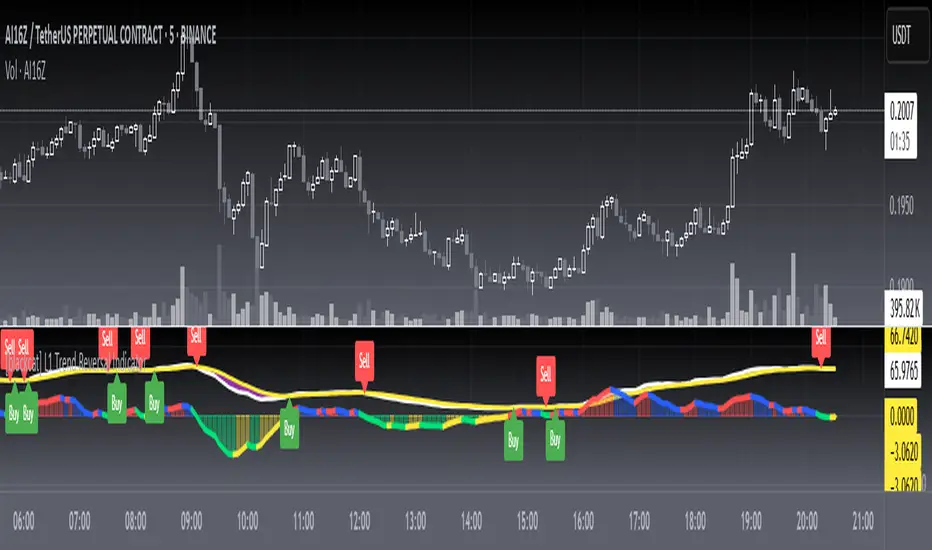
L1 Trend Reversal IndicatorLevel: 1
Background
A trend reversal occurs when the direction of a stock (or a financial trading instrument) changes and moves back in the opposite direction. Uptrends that reverse into downtrends and downtrends that reverse into uptrends are examples of trend reversals.
Function
L1 Trend Reversal Indicator is simple but powerful. It can be used as a basic element for many complex trading system. Although L1 Trend Reversal Indicator can't hold a candle to moving averages in indicating trend reversals, it's good at showing the strength of a trend and trend cycles.
Key Signal
My favoriate trend reversal indicator with histograms
Pros and Cons
Pros:
1. Simple but clear to see the trend reversals
2. Use histogram to indicate sub-time-frame trend changes
Cons:
1. No advanced trading skill is incorporated
2. Need improvements on sideways.
Remarks
Just be simple but powerful
Readme
In real life, I am a prolific inventor. I have successfully applied for more than 60 international and regional patents in the past 12 years. But in the past two years or so, I have tried to transfer my creativity to the development of trading strategies. Tradingview is the ideal platform for me. I am selecting and contributing some of the hundreds of scripts to publish in Tradingview community. Welcome everyone to interact with me to discuss these interesting pine scripts.
The scripts posted are categorized into 5 levels according to my efforts or manhours put into these works.
Level 1 : interesting script snippets or distinctive improvement from classic indicators or strategy. Level 1 scripts can usually appear in more complex indicators as a function module or element.
Level 2 : composite indicator/strategy. By selecting or combining several independent or dependent functions or sub indicators in proper way, the composite script exhibits a resonance phenomenon which can filter out noise or fake trading signal to enhance trading confidence level.
Level 3 : comprehensive indicator/strategy. They are simple trading systems based on my strategies. They are commonly containing several or all of entry signal, close signal, stop loss, take profit, re-entry, risk management, and position sizing techniques. Even some interesting fundamental and mass psychological aspects are incorporated.
Level 4 : script snippets or functions that do not disclose source code. Interesting element that can reveal market laws and work as raw material for indicators and strategies. If you find Level 1~2 scripts are helpful, Level 4 is a private version that took me far more efforts to develop.
Level 5 : indicator/strategy that do not disclose source code. private version of Level 3 script with my accumulated script processing skills or a large number of custom functions. I had a private function library built in past two years. Level 5 scripts use many of them to achieve private trading strategy.
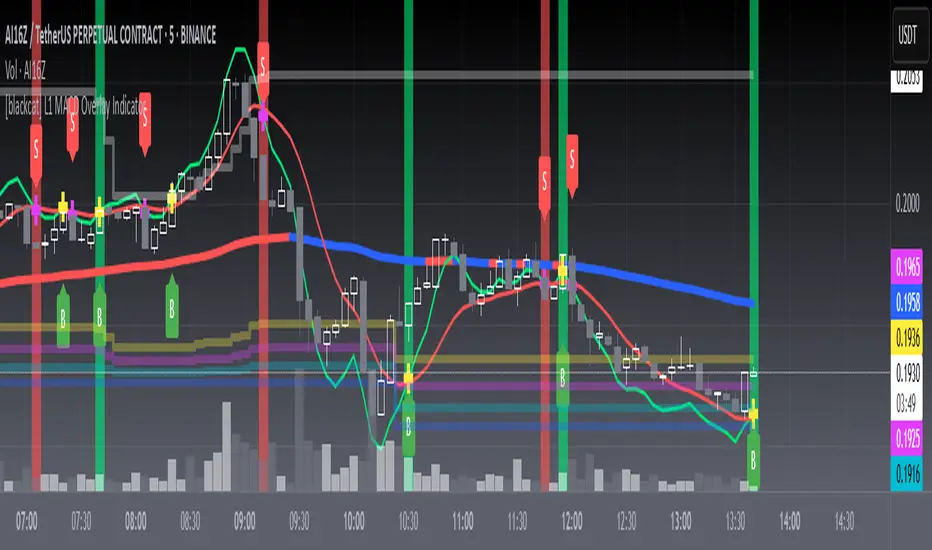
L1 MACD Overlay IndicatorLevel: 1
Background
MACD is a measure of changes in the dynamics between short-term and longer-term price averages. The sign (positive or negative) and the size or MACD line represent the interaction between the two underlying EMAs.
Function
L1 MACD Overlay Indicator is a MACD indicator for main chart. The lime and red color EMAs are the DIFF and DEA signal. I want to plot a contant "Zero Line" line in main chart but failed. So, I use dyanmic color bands to inidcate the "Zero line" in traditioanl MACD. It is not static but a dynamic one.
Key Signal
wdiff --> MACD DIFF
wdea --> MACD DEA
th191 --> zero line
th886 --> zero line
th946 --> zero line
bot --> zero line
Pros and Cons
Pros:
1. main chart MACD
2. easier observation with candles
Cons:
1. I cannot draw static zero line in main chart with PINE, so I draw dyanmic "Zero"
2. No diff-dea histograms
Remarks
I cannot draw static zero line in main chart with PINE, so I draw dyanmic "Zero"
Readme
In real life, I am a prolific inventor. I have successfully applied for more than 60 international and regional patents in the past 12 years. But in the past two years or so, I have tried to transfer my creativity to the development of trading strategies. Tradingview is the ideal platform for me. I am selecting and contributing some of the hundreds of scripts to publish in Tradingview community. Welcome everyone to interact with me to discuss these interesting pine scripts.
The scripts posted are categorized into 5 levels according to my efforts or manhours put into these works.
Level 1 : interesting script snippets or distinctive improvement from classic indicators or strategy. Level 1 scripts can usually appear in more complex indicators as a function module or element.
Level 2 : composite indicator/strategy. By selecting or combining several independent or dependent functions or sub indicators in proper way, the composite script exhibits a resonance phenomenon which can filter out noise or fake trading signal to enhance trading confidence level.
Level 3 : comprehensive indicator/strategy. They are simple trading systems based on my strategies. They are commonly containing several or all of entry signal, close signal, stop loss, take profit, re-entry, risk management, and position sizing techniques. Even some interesting fundamental and mass psychological aspects are incorporated.
Level 4 : script snippets or functions that do not disclose source code. Interesting element that can reveal market laws and work as raw material for indicators and strategies. If you find Level 1~2 scripts are helpful, Level 4 is a private version that took me far more efforts to develop.
Level 5 : indicator/strategy that do not disclose source code. private version of Level 3 script with my accumulated script processing skills or a large number of custom functions. I had a private function library built in past two years. Level 5 scripts use many of them to achieve private trading strategy.
L1 Composite RSI-William%R IndicatorLevel: 1
Background
The Relative Strength Index (RSI) developed by J. Welles Wilder is a pulse oscillator that measures the speed and change in price movements. The RSI hovers between zero and 100. Traditionally, the RSI is considered overbought when it is above 70 and oversold when it is below 30. Signals can be generated by looking for divergences and error fluctuations. RSI can also be used to identify the general trend.
Williams% R, also known as the Williams Percent Range, is a type of momentum indicator that moves between 0 and -100 and measures overbought and oversold levels. The Williams% R can be used to find entry and exit points in the market. The indicator is very similar to the stochastic oscillator and is used in the same way.
Function
L1 Composite RSI-William%R Indicator combines both RSI and William%R indicator to indicate long and short entries.
Key Signal
rsi1 --> rsi in white
wr1 --> William%R in yellow
bull --> long entry in lime
Pros and Cons
Pros:
1. resonance of RSI and William%R will provide better long and short entry signal
2. use 'bull' to indicate a long entry zone
Cons:
1. It is sensitive to fluctuations
2. More independent long and short entries should be considered
Remarks
Composite RSI+William%R
Readme
In real life, I am a prolific inventor. I have successfully applied for more than 60 international and regional patents in the past 12 years. But in the past two years or so, I have tried to transfer my creativity to the development of trading strategies. Tradingview is the ideal platform for me. I am selecting and contributing some of the hundreds of scripts to publish in Tradingview community. Welcome everyone to interact with me to discuss these interesting pine scripts.
The scripts posted are categorized into 5 levels according to my efforts or manhours put into these works.
Level 1 : interesting script snippets or distinctive improvement from classic indicators or strategy. Level 1 scripts can usually appear in more complex indicators as a function module or element.
Level 2 : composite indicator/strategy. By selecting or combining several independent or dependent functions or sub indicators in proper way, the composite script exhibits a resonance phenomenon which can filter out noise or fake trading signal to enhance trading confidence level.
Level 3 : comprehensive indicator/strategy. They are simple trading systems based on my strategies. They are commonly containing several or all of entry signal, close signal, stop loss, take profit, re-entry, risk management, and position sizing techniques. Even some interesting fundamental and mass psychological aspects are incorporated.
Level 4 : script snippets or functions that do not disclose source code. Interesting element that can reveal market laws and work as raw material for indicators and strategies. If you find Level 1~2 scripts are helpful, Level 4 is a private version that took me far more efforts to develop.
Level 5 : indicator/strategy that do not disclose source code. private version of Level 3 script with my accumulated script processing skills or a large number of custom functions. I had a private function library built in past two years. Level 5 scripts use many of them to achieve private trading strategy.

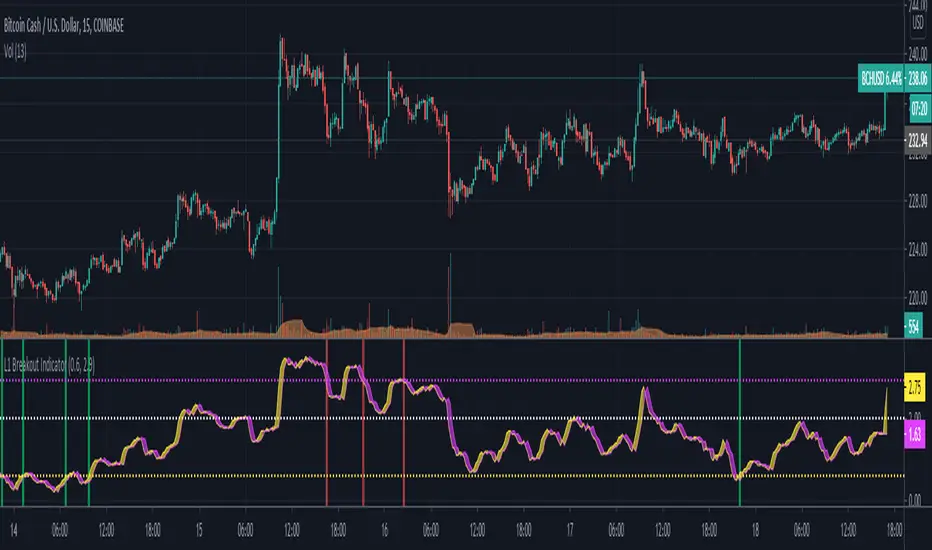
L1 Breakout IndicatorLevel: 1
Background
A breakout refers to when the price of an asset moves above a resistance area or below a support area. Breakouts indicate that the price may be trending in the direction of the breakout.
Function
L1 Breakout Indicator utilizes highest() and lowest() functions to define breakout levels. Use ema() to draw a trade line to detect the distance to breakout points. By doing that, you will know whether is overbought or oversold. Then, by applying a set of simple threshold inputs, you can locate the long and short entries points.
Key Signal
trade line and its lag version
Pros and Cons
Pros:
1. Simple but powerful to know overbought and oversold regions
2. Flexible input threshold values to adapt various market conditions
Cons:
1. It may satruate for extreme conditions of long and short.
2. Multiple long and short entries may be generated.
Remarks
Just simple
Readme
In real life, I am a prolific inventor. I have successfully applied for more than 60 international and regional patents in the past 12 years. But in the past two years or so, I have tried to transfer my creativity to the development of trading strategies. Tradingview is the ideal platform for me. I am selecting and contributing some of the hundreds of scripts to publish in Tradingview community. Welcome everyone to interact with me to discuss these interesting pine scripts.
The scripts posted are categorized into 5 levels according to my efforts or manhours put into these works.
Level 1 : interesting script snippets or distinctive improvement from classic indicators or strategy. Level 1 scripts can usually appear in more complex indicators as a function module or element.
Level 2 : composite indicator/strategy. By selecting or combining several independent or dependent functions or sub indicators in proper way, the composite script exhibits a resonance phenomenon which can filter out noise or fake trading signal to enhance trading confidence level.
Level 3 : comprehensive indicator/strategy. They are simple trading systems based on my strategies. They are commonly containing several or all of entry signal, close signal, stop loss, take profit, re-entry, risk management, and position sizing techniques. Even some interesting fundamental and mass psychological aspects are incorporated.
Level 4 : script snippets or functions that do not disclose source code. Interesting element that can reveal market laws and work as raw material for indicators and strategies. If you find Level 1~2 scripts are helpful, Level 4 is a private version that took me far more efforts to develop.
Level 5 : indicator/strategy that do not disclose source code. private version of Level 3 script with my accumulated script processing skills or a large number of custom functions. I had a private function library built in past two years. Level 5 scripts use many of them to achieve private trading strategy.
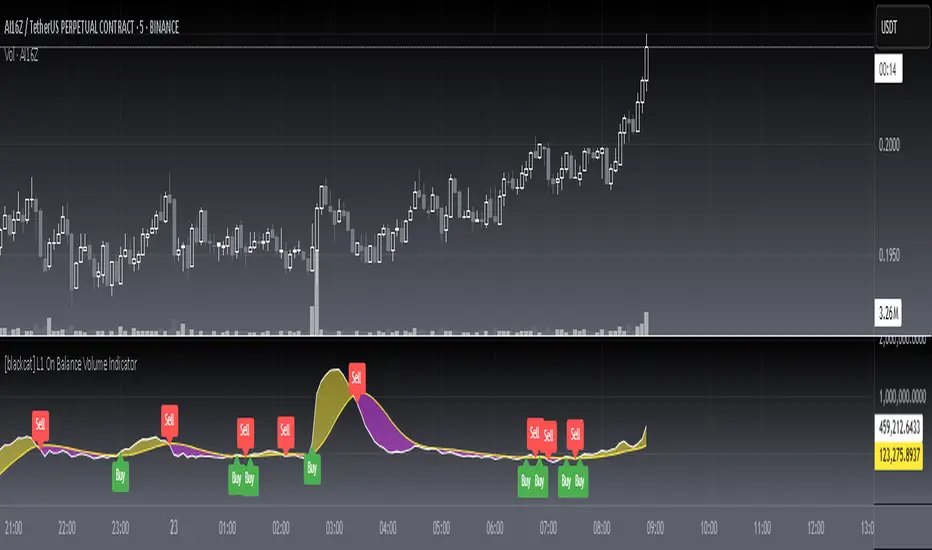
L1 On Balance Volume IndicatorLevel: 1
Background
On Balance Volume (OBV) is a simple indicator that uses volume and price to measure buying and selling pressure. The buying pressure is evident when the positive volume exceeds the negative volume and the OBV line rises.
Function
L1 On Balance Volume Indicator is a simple but improved OBV by using alma and more input parameters
Key Signal
OBV and its ALMA
Pros and Cons
Pros:
1. More freedom to tune with more input parameters
2. ALMA can make better tradeoff between response and smooth
Cons:
1. No details of volume generation can be disclosed
2. It may help to judge trend but not the short-term price movements.
Remarks
NA
Readme
In real life, I am a prolific inventor. I have successfully applied for more than 60 international and regional patents in the past 12 years. But in the past two years or so, I have tried to transfer my creativity to the development of trading strategies. Tradingview is the ideal platform for me. I am selecting and contributing some of the hundreds of scripts to publish in Tradingview community. Welcome everyone to interact with me to discuss these interesting pine scripts.
The scripts posted are categorized into 5 levels according to my efforts or manhours put into these works.
Level 1 : interesting script snippets or distinctive improvement from classic indicators or strategy. Level 1 scripts can usually appear in more complex indicators as a function module or element.
Level 2 : composite indicator/strategy. By selecting or combining several independent or dependent functions or sub indicators in proper way, the composite script exhibits a resonance phenomenon which can filter out noise or fake trading signal to enhance trading confidence level.
Level 3 : comprehensive indicator/strategy. They are simple trading systems based on my strategies. They are commonly containing several or all of entry signal, close signal, stop loss, take profit, re-entry, risk management, and position sizing techniques. Even some interesting fundamental and mass psychological aspects are incorporated.
Level 4 : script snippets or functions that do not disclose source code. Interesting element that can reveal market laws and work as raw material for indicators and strategies. If you find Level 1~2 scripts are helpful, Level 4 is a private version that took me far more efforts to develop.
Level 5 : indicator/strategy that do not disclose source code. private version of Level 3 script with my accumulated script processing skills or a large number of custom functions. I had a private function library built in past two years. Level 5 scripts use many of them to achieve private trading strategy.
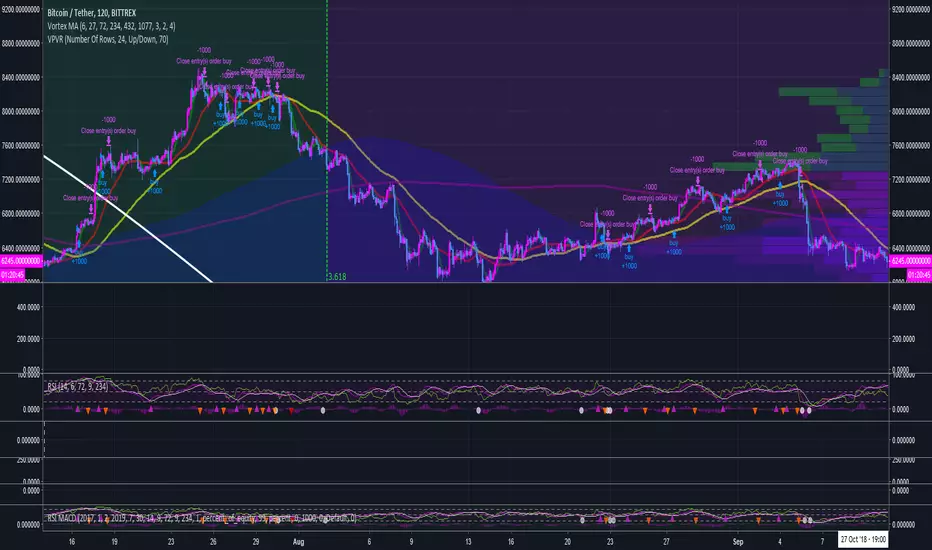
Stoch X, an Indicator of Indicators by DGTStochastic refers to a randomly determined process and financial markets use stochastic models to represent the seemingly random behaviour of assets and then used by quantitative analysts to value options on asset prices
The stochastic oscillator, developed by George Lane, presents the location of the closing price of a stock in relation to the high and low range of the price of a stock over a period of time. Lane has said that the stochastic oscillator does not follow price or volume or anything similar. He indicates that the oscillator follows the speed or momentum of price.
Traditionally, readings over 80 are considered in the overbought range, and readings under 20 are considered oversold. Please note that, very strong trends can maintain overbought or oversold conditions for an extended period and traders should look to changes in the stochastic oscillator for clues about future trend shifts. It is advised to check the higher timeframe of your trading timeframe and see where you are in the “big picture”
Signal crosses , intersection of stochastic and its signal line is considered to be a signal that a reversal may be in the works
Divergence between the stochastic oscillator and trending price action is also seen as an important reversal signal
Lane also reveals in interviews that, as a rule, the momentum or speed of the price of a stock changes before the price changes itself . In this way, the stochastic oscillator can be used to foreshadow reversals when the indicator reveals bullish or bearish divergences. This signal is the first, and arguably the most important, trading signal Lane identified.
What is Stochastic X ?
Stochastic X , is essentially an indicator of an indicator, providing stochastic calculation to some of well known indicators, such as RSI, MFI, OBV, etc. This means that it is a measure of selected specific indicator relative to its own high/low range over a user defined period of time.
Features of Stoch X
1- Displays Stoch of and indicator plus a companion indicator (companion display can be disabled from user dialog box)
Available options
Stoch Source plus PM A, where Source is close price and PMA refers to Price Distance to its Moving Average (for further details you may check my study of Price Distance to its MA by DGT, and different application of distance concept available with “MACD-X, More Than MACD" And “P-MACD”)
Stoch RSI plus RSI , Stoch RSI, developed by Tushar Chande and Stanley Kroll, is a build-in indicator available on Trading View, where Stoch X adds RSI as a companion indicator to Stoch RSI
Stoch MFI and MFI , where MFI is Money Flow Index, measures buying and selling pressure through analyzing both price and volume
Stoch OBV + VO , Where OBV is On Balance Volume, is a momentum indicator that measures positive and negative volume flow. VO stands for Volume Oscillator which aims to confirm a market turnaround or trend reversal
Stoch EWO + EWO , EWO stands for Elliott Wave Oscillator
By default the threshold levels are indicated and are displayed differently for the regular Stoch or Stoch RSI. Overbought band (70-80), oversold band (20-30) and middle line (0) are emphasized
Warning : Centered Oscillators base line is moved from 0 to 50 to better suit with Stoch X, which is applied to PMA, VO and EWO
2- Can be plotted along with Stoch in the same window using the same scaling
To avoid misinterpreting the area between Stoch X and its Signal Line is highlighted automatically in case Stoch is selected to be plotted
3- Squeeze Indicator added as Add-on in the bottom of the Stoch X
During volatile market conditions the stochastic oscillator has been known to produce false signals. One way to help with this is to take the price trend as a filter, or basic chart pattern analysis can help to identify major, underlying trends and increase the Stoch X's accuracy.
This study implements Squeeze Indicator to help and add additional insight for filtering false signals. Blue diamond shapes indicates the squeeze release, that is volatility increased and according to momentum direction the buy/sell possibility can be considered. Orange ones displays consolidation periods, that is low volatility and the market is assumed to be in squeeze and no trade is recommended. in this phase.
Disclaimer: Trading success is all about following your trading strategy and the indicators should fit within your trading strategy, and not to be traded upon solely
The script is for informational and educational purposes only. Use of the script does not constitutes professional and/or financial advice. You alone the sole responsibility of evaluating the script output and risks associated with the use of the script. In exchange for using the script, you agree not to hold dgtrd TradingView user liable for any possible claim for damages arising from any decision you make based on use of the script

Relative Strength of Volume Indicators by DGTThe Relative Strength Index (RSI) , developed by J. Welles Wilder, is a momentum oscillator that measures the speed and change of price movements.
• Traditionally the RSI is considered overbought when above 70 and may be primed for a trend reversal or corrective pullback in price, and oversold or undervalued condition when below 30. During strong trends, the RSI may remain in overbought or oversold for extended periods.
• Signals can be generated by looking for divergences and failure swings. If underlying prices make a new high or low that isn't confirmed by the RSI, this divergence can signal a price reversal. If the RSI makes a lower high and then follows with a downside move below a previous low, a Top Swing Failure has occurred. If the RSI makes a higher low and then follows with an upside move above a previous high, a Bottom Swing Failure has occurred
• RSI can also be used to identify the general trend. In an uptrend or bull market, the RSI tends to remain in the 40 to 90 range with the 40-50 zone acting as support. During a downtrend or bear market the RSI tends to stay between the 10 to 60 range with the 50-60 zone acting as resistance
This study aim to implement Relative Strength concept on most common Volume indicators, such as
• Accumulation Distribution is a volume based indicator designed to measure underlying supply and demand
• Elder's Force Index (EFI) measures the power behind a price movement using price and volume
• Money Flow Index (MFI) measures buying and selling pressure through analyzing both price and volume (used as it is)
• On Balance Volume (OBV) , created by Joe Granville, is a momentum indicator that measures positive and negative volume flow
• Price Volume Trend (PVT) is a momentum based indicator used to measure money flow
Plotting will be performed for regular RSI and RSI of Volume indicator (RSI(VOLX)) selected from the dialog box, where the possibility to apply smoothing is provided as option. Additionally, labels can be added optionally to display the value and name of selected volume indicator
Secondly, ability to present Volume Histogram within the same study along with its Moving Average or Volume Oscillator based on selection
Finally, Volume Based Colored Bars , a study of Kıvanç Özbilgiç is added to emphasis volume changes on top of the bars
Nothing excessively new, the study combines RSI with;
- RSI concept applied to some of the common Volume indicators presented with a highlighted over/under valued threshold area, optional labeling and smoothing,
- added Volume data with additional information and
- colored bars based on volume
Thanks @Vishant_Meshram for the inspiration 🙏
Disclaimer:
Trading success is all about following your trading strategy and the indicators should fit within your trading strategy, and not to be traded upon solely
The script is for informational and educational purposes only. Use of the script does not constitute professional and/or financial advice. You alone have the sole responsibility of evaluating the script output and risks associated with the use of the script. In exchange for using the script, you agree not to hold dgtrd TradingView user liable for any possible claim for damages arising from any decision you make based on use of the script

Divergence Histogram for Many IndicatorHello Traders,
This script analyses divergences for 11 predefined indicators and then draws column on the graph. Red columns for negatif divergence (means prices may go down or trend reversal), Lime columns for positive divergences (means prices may go up or trend reversal)
The script uses Pivot Points and on each bar it checks divergence between last Pivot Point and current High/Low and if it finds any divergence then immediately draws column. There is no Latency/Lag.
There are predefined 11 indicators in the script, which are RSI , MACD , MACD Histogram, Stochastic , CCI , Momentum, OBV, Diosc, VWMACD, CMF and MFI.
Smaller Pivot Point Period check smaller areas and if you use smaller numbers it would be more sensitive and may give alerts very often. So you should set it accordingly.
There is "Check Cut-Through in indicators" option, I recomment you to enable it. it checks that there is cut-through in indicators or not, if no cut-through then it's shown as valid divergence.
You should see following one as well if you haven't yet:
Enjoy!

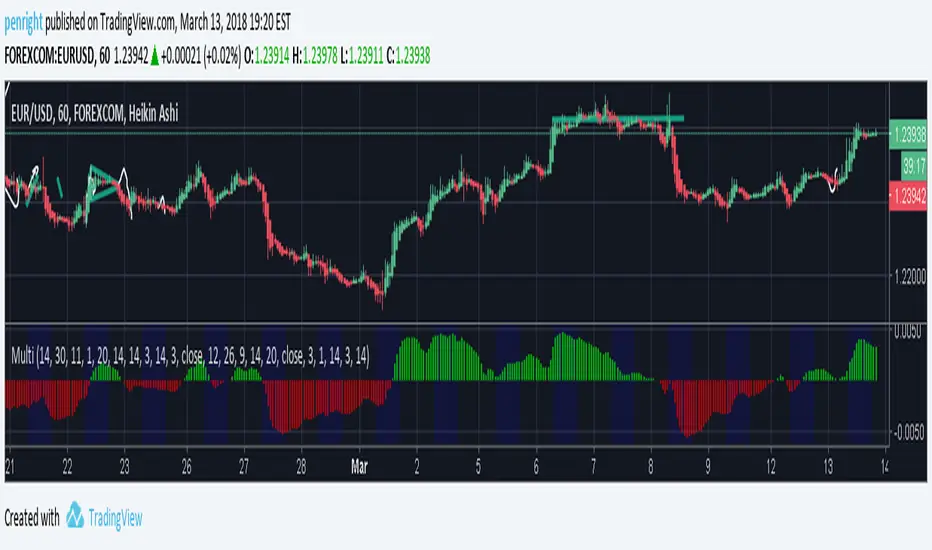
Bias And Sentiment Strength (BASS) Indicator by mattzabBias And Sentiment Strength (BASS) Indicator is designed to be a quick visualization as to the market strength.
Pair with Alligator, MACD, or Moving Average lines on your chart for good results.
How to use this indicator:
Blue above 0 is positive sentiment, red below 0 is negative sentiment.
If you have blue above and red below, be cautious! The Bass is telling you that we have a battle between the Bulls and the Bears!
The purple bars are your volume bias. Volume bias can be positive or negative, despite the direction of the overall trend. Positive Volume Bias along with Bullish Blue Sentiment is a great sign! Go Long! If you have Bullish Sentiment and have a negative Volume Bias, be cautious! Price may not be moving with much conviction, and may be subject to reversal!
This is basically several different histograms overlaying one another, and they are blue above 0 and red below 0.
MACD Histogram - Standard MACD Histogram here.
RSI Histogram - This is a standard RSI. It has been adjusted to "oscillate" above and below zero, which would be the 50 line on a normal RSI chart.
Slow Stochastic Histogram - This is a slow stochastic with a 21 Period K, 14 Period D, and 14 Smoothing K. The "oscillator" histogram is formed by subtracting K from D.
Awesome Oscillator - This is a standard Awesome Oscillator
Alligator Oscillator - This is formed by adding (lips + teeth) + (teeth - jaw)
Volume Bias - The Volume Bias is displayed as purple bars, and is calculated by a highly sophisticated and complex algorithmic function called subtraction. It's just the 30 Period Volume-Weighted Moving Average Minus the 30 Simple Moving Average.
Enjoy!

EASYMOKU INDICATORThis is the popular Ichimoku Indicator with an easier way to adjust the settings that can help you in your trading.
Components of the Ichimoku indicator:
Tenkan Sen: Basically it is a moving average that goes from 7 to 9 periods.
Kijun Sen: Like Tenkan Sen, we are facing a moving average, but this time from 22 to 26 periods.
Chikou Span: It is the one that represents the current price, but reflected in 22 to 26 periods back.
Senkou Span A: Unlike Chikou Span, this line is drawn over the next 22 to 26 periods, and its calculation is obtained from the average between Tenkan Sen and Kijun Sen. It is a projected average in the future.
Senkou Span B: It is the result of calculating the average between the maximum and minimum over the last 44 to 52 periods, representing the following 22 to 26 periods (as well as the Senkou Span A)
As with Occidental trading systems, based on the crossings of averages, with the Ichimoku we will use the crossing of the Tenkan Sen (fast moving average) with the Kijun Sen (slow moving average) as buying and selling signals.
Strategy of this script:
A strong bullish signal is when price and Chikou Span rises above Kumo cloud and Tenkan Sen cross above Kijun Sen.
A strong bearish signal is when price and Chikou Span falls below Kumo cloud and Tenkan Sen croos under Kijun Sen.

Squeeze Momentum Strategy based on Indicator [LazyBear][Bitduke]I improved Squeeze Momentum Indicator by LazyBear (momentum filter, changed data source to ohlc4) and transformed it into a strategy, adding a risk management system + ability to customize time frames for backtest.
Shortly about Squeeze Momentum Indicator:
This is a derivative of John Carter's "TTM Squeeze" volatility indicator, as discussed in his book "Mastering the Trade" (chapter 11).
Backtested on XBTUSD, ETHUSD (Bitmex). As you may notice it shows good results on 1h - 4h timeframes on these timeframes among these pairs. Relatively low drawdown ~ 12% (to date).

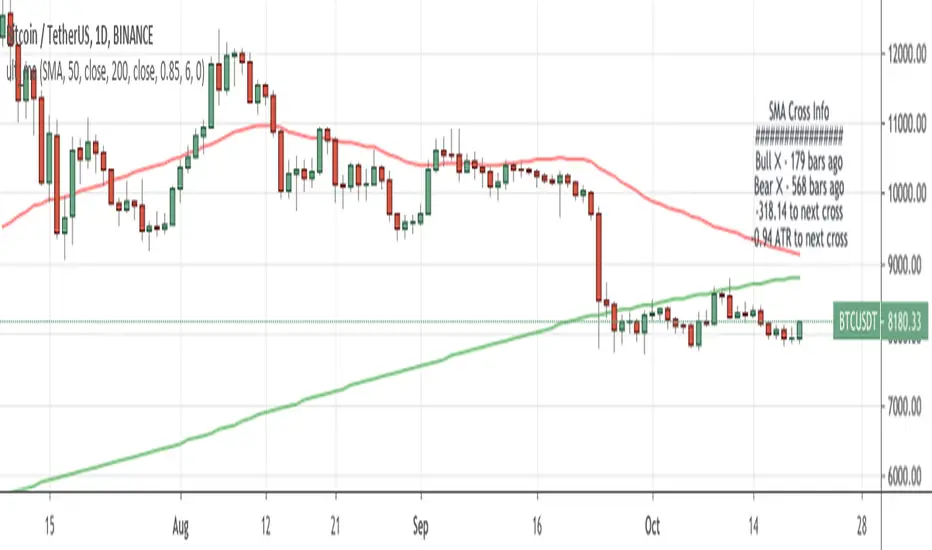
Ultimate MA Cross IndicatorContinue to experiment with new labels functionality in TradingView. Created ma cross script with 9 different types of MA wit additional information box. In that box, I included the bars passed from the previous bull/bear cross.
Also you cand find there live distance between moving averages in price and ATRs , so you track how close are you from the next close.
Do you think this concept is useful? What information do you want to see in this kind of boxes?
These ma types are included in this indicator:
Simple Moving Average ( SMA )
Exponential Moving Average ( EMA )
Weighted Moving Average ( WMA )
Arnaud Legoux Moving Average ( ALMA )
Hull Moving Average ( HMA )
Volume-weighted Moving Average ( VWMA )
Least Square Moving Average ( LSMA )
Smoothed Moving Average ( SMMA )
Double Exponential Moving Average ( DEMA )
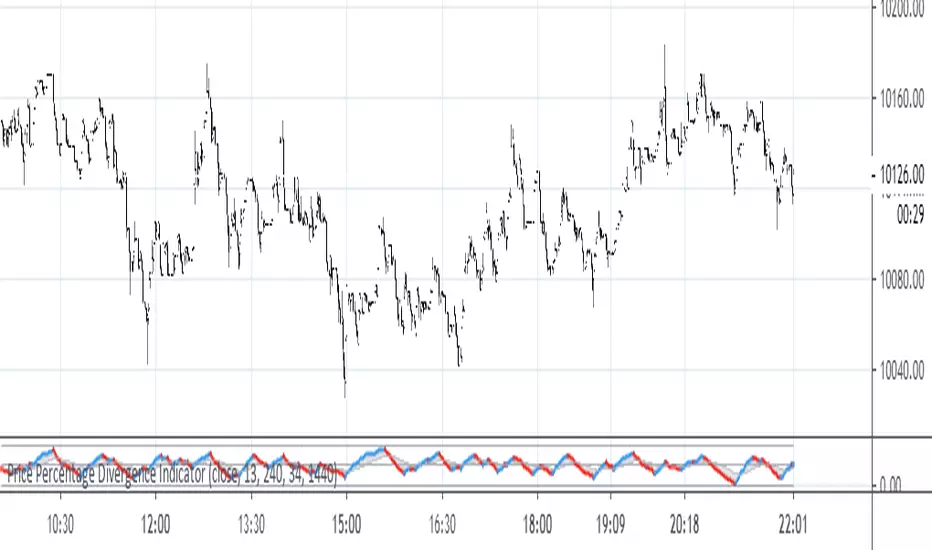
Price Percentage Divergence IndicatorThis is a price percentage divergence ( PPO ) indicator. It may as well be called a turning points indicator.)
RSI MACD with conditional MA indicator backtestingbacktesting for the RSI MACD with conditional MA indicator:
A Multi 10 indicatorREAD NOTE BEFORE APPLYING or you may think indicator doesnt work.
This indicator is a revise of another i made and contains 10 Optional Indicators allowing you to load more then 3 indicators at once if you so choose and dont pay for the platform!
Hopefully someone will find use for this script besides me :) I dont suggest turning all on at once because it
will not look right. Alot will overlap if you wish but i only use the Session and trend bar at once in
conjuction with a Oscillator setting like MacD , RSI , Stoch , Aroon or CCI .
In the chart you see i only have a few indicators active ENJOY!!
---------- NOTE ----------- ( Everything is OFF by default and indicator SHOULD show up BLANK when loaded) ------------ NOTE -------------
(Can turn EVERYTHING on AND change any values in the format tab once indicator loads)
Indicators included are listed below
Sessions, including, NY session, Aussie session, Asian session, and Europe market sessions.
MacD Split Colored , aroon oscillator
CCI Oscillator , classic aroon
RSI Oscillator , Elliot wave
Stoch RSI Oscillator , ATR%
My own Trend bar
---------- NOTE ----------- ( Everything is OFF by default and indicator SHOULD show up BLANK when loaded) ------------ NOTE -------------
(Can turn EVERYTHING on AND change any values in the format tab once indicator loads) CODE probably looks messey but this is something i made for me so i didnt really care lol
A Multi 10 indicatorREAD NOTE BEFORE APPLYING or you may think indicator doesnt work.
This indicator is a revise of another i made and contains 10 Optional Indicators allowing you to load more then 3 indicators at once if you so choose and dont pay for the platform!
Hopefully someone will find use for this script besides me :) I dont suggest turning all on at once because it
will not look right. Alot will overlap if you wish but i only use the Session and trend bar at once in
conjuction with a Oscillator setting like MacD , RSI , Stoch , Aroon or CCI .
In the chart you see i only have a few indicators active ENJOY!!
---------- NOTE ----------- ( Everything is OFF by default and indicator SHOULD show up BLANK when loaded) ------------ NOTE -------------
(Can turn EVERYTHING on AND change any values in the format tab once indicator loads)
NY session, Aussie session, Asian session, and Europe market sessions.
MacD Split Colored , aroon oscillator
CCI Oscillator , classic aroon
RSI Oscillator , Elliot wave
Stoch RSI Oscillator
Aroon Oscillator
My own Trend bar
---------- NOTE ----------- ( Everything is OFF by default and indicator SHOULD show up BLANK when loaded) ------------ NOTE -------------
(Can turn EVERYTHING on AND change any values in the format tab once indicator loads) CODE probably looks messey but this is something i made for me so i didnt really care lol

Rob Hoffman - Overlay SetHere is all the Rob Hoffman (Overlay) Indicator. Will release the rest as a different indicator.
Planned,
1. Stochastic
2. MACD
Alternatively,
Videos
www.youtube.com
