Relative Directional Volume Indicator# Relative Directional Volume Indicator (RelDirVol)
## Overview
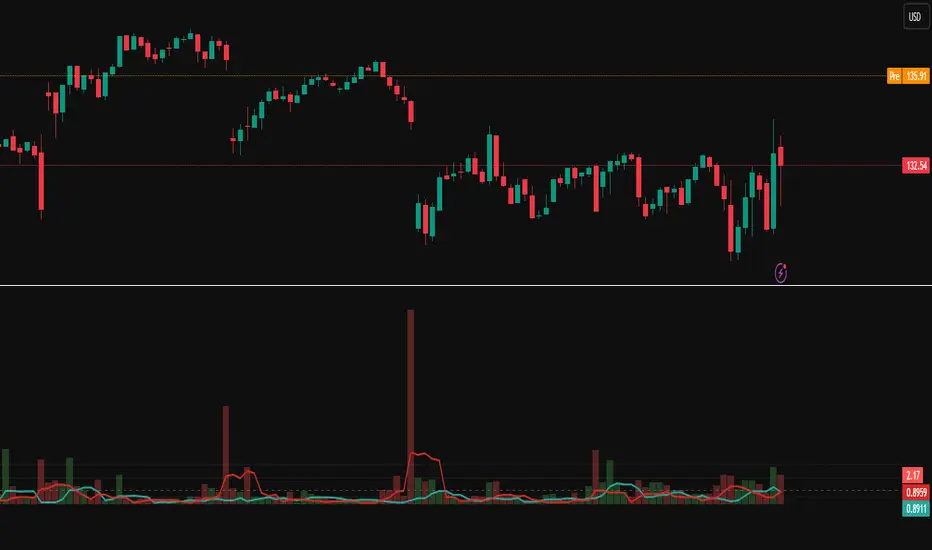
The Relative Directional Volume Indicator (RelDirVol) is a powerful volume analysis tool that measures current trading volume relative to historical volume while differentiating between bullish and bearish volume flows. This indicator helps traders identify unusual volume activity and determine whether it's coming from buyers or sellers, providing deeper insights into market participation and potential trend strength.
## Features
- **Relative Volume Calculation**: Compares current volume to historical averages
- **Directional Volume Analysis**: Separates and visualizes bullish vs bearish volume
- **Multiple Moving Average Options**: Customize smoothing with various MA types (SMA, EMA, WMA, HMA, VWMA)
- **Split Moving Averages**: View distinct moving averages for bullish and bearish volume flows
- **Reference Lines**: Visual guides for normal volume (1.0x) and key deviation levels (0.5x, 2.0x, 3.0x)
- **Customizable Colors**: Adjust visual appearance for improved chart readability
## How It Works
The indicator calculates the relative volume by dividing the current bar's volume by the average volume over a specified lookback period. It then categorizes this volume as either bullish (when price closes above the open) or bearish (when price closes below or equal to the open).
1. **Relative Volume**: Current volume ÷ Average volume from previous N bars
2. **Directional Classification**: Assigns volume to bullish or bearish categories based on price action
3. **Moving Averages**: Applies user-selected moving average to smooth the data
The result is displayed as color-coded histogram bars showing the relative volume magnitude, with optional moving average lines for both overall and direction-specific volume trends.
## Interpretation
### Volume Magnitude
- **Above 1.0**: Higher than average volume (more participation than normal)
- **Below 1.0**: Lower than average volume (less participation than normal)
- **2.0+**: Volume twice the normal level (significant participation)
- **3.0+**: Volume three times normal (exceptional participation, often at key events)
### Directional Analysis
- **Strong Green Bars**: Heavy bullish participation driving prices up
- **Strong Red Bars**: Heavy bearish participation driving prices down
- **Bullish MA > Bearish MA**: Overall buying pressure dominating
- **Bearish MA > Bullish MA**: Overall selling pressure dominating
### Key Signals
- **Volume Spikes with Price Breakouts**: Confirms strength of the move
- **Divergence Between MAs**: Early warning of potential shift in market control
- **Sustained Above-Average Volume**: Strong trend continuation likely
- **Volume Decline After Spike**: Potential exhaustion of trend
## Settings
- **Relative Volume Lookback**: Comparison period for average volume (default: 20)
- **Moving Average Type**: Method used for smoothing (default: SMA)
- **Moving Average Length**: Smoothing period (default: 5)
- **Show Moving Average**: Toggle overall volume MA visibility
- **Show Baseline**: Toggle 1.0 reference line visibility
- **Show Bullish/Bearish MAs**: Toggle direction-specific MA visibility
## Best Practices
This indicator performs best when combined with price action analysis and other indicators. Look for:
1. Volume confirmation of breakouts and trend changes
2. Divergence between price movement and volume direction
3. Shifts in the relationship between bullish and bearish MAs
4. Unusual volume patterns during consolidation phases
Particularly effective for swing trading, day trading, and identifying institutional participation in market moves across multiple timeframes.
ابحث في النصوص البرمجية عن "indicator"
VWAP + EMA Retracement Indicator SwiftEdgeVWAP + EMA Retracement Indicator
Overview
The VWAP + EMA Retracement Indicator is a powerful and visually engaging tool designed to help traders identify high-probability buy and sell opportunities in trending markets. By combining the Volume Weighted Average Price (VWAP) with two Exponential Moving Averages (EMAs) and a unique retracement-based signal logic, this indicator pinpoints moments when the price pulls back to a key zone before resuming its trend. Its modern, AI-inspired visuals and customizable features make it both intuitive and adaptable for traders of all levels.
What It Does
This indicator generates buy and sell signals based on a sophisticated yet straightforward strategy:
Buy Signals: Triggered when the price is above VWAP, has recently retraced to the zone between two EMAs (default 12 and 21 periods), and a strong bullish candle closes above both EMAs.
Sell Signals: Triggered when the price is below VWAP, has retraced to the EMA zone, and a strong bearish candle closes below both EMAs.
Signal Filtering: A customizable cooldown period ensures that only the first signal in a sequence is shown, reducing noise while preserving opportunities for new trends.
Confidence Scores: Each signal includes an AI-inspired confidence score (0-100%), calculated from candle strength and price distance to VWAP, helping traders gauge signal reliability.
The indicator’s visuals enhance decision-making with dynamic gradient lines, a highlighted retracement zone, and clear signal labels, all customizable to suit your preferences.
How It Works
The indicator integrates several components that work together to create a cohesive trading tool:
VWAP: Acts as a dynamic support/resistance level, reflecting the average price weighted by volume. It filters signals to ensure buys occur in uptrends (price above VWAP) and sells in downtrends (price below VWAP).
Dual EMAs: Two EMAs (default 12 and 21 periods) define a retracement zone where the price is likely to consolidate before continuing its trend. Signals are generated only after the price exits this zone with conviction.
Retracement Logic: The indicator looks for price pullbacks to the EMA zone within a user-defined lookback window (default 5 candles), ensuring signals align with trend continuation patterns.
Candle Strength: Signals require strong candles (bullish for buys, bearish for sells) with a minimum body size based on the Average True Range (ATR), filtering out weak or indecisive moves.
Cooldown Mechanism: A unique feature that prevents signal clutter by allowing only the first signal within a user-defined period (default 3 candles), balancing responsiveness with clarity.
Confidence Score: Combines candle body size and price distance to VWAP to assign a score, giving traders an at-a-glance measure of signal strength without needing external analysis.
These components are carefully combined to capture high-probability setups while minimizing false signals, making the indicator suitable for both short-term and swing trading.
How to Use It
Add to Chart: Apply the indicator to a 15-minute chart (recommended) or your preferred timeframe.
Customize Settings:
VWAP Source: Choose the price source (default: hlc3).
EMA Periods: Adjust the fast and slow EMA periods (default: 12 and 21).
Retracement Window: Set how many candles to look back for retracement (default: 5).
ATR Period & Body Size: Define candle strength requirements (default: 14 ATR period, 0.3 multiplier).
Cooldown Period: Control the minimum candles between signals (default: 3; set to 0 to disable).
Candle Requirements: Toggle whether signals require bullish/bearish candles or entire candle above/below EMAs.
Visuals: Enable/disable gradient colors, retracement zone, confidence scores, and choose a color scheme (Neon, Light, or Dark).
Interpret Signals:
Buy: A green "Buy" label with a confidence score appears below the candle when conditions are met.
Sell: A red "Sell" label with a confidence score appears above the candle.
Use the confidence score to prioritize higher-probability signals (e.g., above 80%).
Trade Management: Combine signals with your risk management strategy, such as setting stop-loss below the retracement zone and targeting a 1:2 risk-reward ratio.
Why It’s Unique
The VWAP + EMA Retracement Indicator stands out due to its thoughtful integration of classic indicators with modern enhancements:
Balanced Signal Filtering: The cooldown mechanism ensures clarity without missing key opportunities, unlike many indicators that overwhelm with frequent signals.
AI-Inspired Confidence: The confidence score simplifies decision-making by quantifying signal strength, mimicking advanced analytical tools in an accessible way.
Elegant Visuals: Dynamic gradients, a highlighted retracement zone, and customizable color schemes (Neon, Light, Dark) create a sleek, futuristic interface that’s both functional and visually appealing.
Flexibility: Extensive customization options let traders tailor the indicator to their style, from conservative swing trading to aggressive scalping.

Dskyz (DAFE) Turning Point Indicator - Dskyz (DAFE) Turning Point Indicator — Smart Reversal Signals
Inspired by the intelligent logic of a pervious indicator I saw. This script represents a next-generation reversal detection system—completely re-engineered with cutting-edge filters, adaptive logic, and intelligent dashboards.
The Dskyz (DAFE) Turning Point Indicator
🧠 What Is It?
is designed to identify key market reversal zones with extraordinary accuracy by combining trend direction, volatility confirmation, price action patterns, and smart filtering layers—all visualized in a highly interactive and informative chart overlay.
This isn’t just a signal generator—it’s a decision-making assistant.
⚙️ Inputs & How to Use Them
All input fields are grouped for ease-of-use and explanation:
🔸 Reversal Logic Settings
Source: The price source used for signal generation (default: hlcc4). Can be changed to any standard price formula (open, close, hl2, etc.).
ATR Period: Used for determining volatility and dynamic trailing stop logic.
Supertrend Factor / Period: Calculates directional movement to detect trending vs choppy zones.
Reversal Sensitivity Thresholds: Internal logic filters minor pullbacks from true reversals.
🔸 Filters
Trend Filter: Enables trend-only signals (optional).
Volume Spike Filter: Confirms reversals with significant volume activity.
Volatility Zone Coloring: Visually highlights high-volatility areas to avoid late entries or fakeouts.
Custom High/Low Detection: Smart local top/bottom scanning to reinforce accuracy.
🔸 Visual & Dashboard Options
Signal Labels: Toggle signal labels on the chart.
Color Theme: Choose your visual theme for easier visibility.
Dashboard Toggle: Activate a compact dashboard summarizing strategy health (win rate, drawdown, trend state, volatility).
🧩 Functions Used
ta.supertrend(): Determines trend direction for signal confirmation and filtering.
ta.atr(): Calculates real-time volatility to determine trailing stop exits and visual zones.
ta.rsi() (internally optimized): Helps filter overbought/oversold conditions.
Local High/Low Scanner: Tracks recent pivots using a custom dynamic lookback.
Signal Engine: Consolidates multiple confirmation layers before plotting.
🚀 What Makes It Unique?
Unlike traditional reversal indicators, this one combines:
Multi-factor signal validation: No single indicator makes the call—volume, trend, price action, and volatility all contribute.
Adaptive filtering: The indicator evolves with the market—less noise, smarter signals.
Visual volatility heatmap zones: Avoid entering during uncertainty or manipulation spikes.
Interactive trend dashboard: Immediate insight into the strength and condition of the current market phase.
Highly customizable: Turn features on/off to match your trading style—scalping, swing, or trend-following.
Precision timing: Uses optimized versions of RSI and ATR that adjust automatically with price context.
🧬 Recommended for:
Commodity: Futures, Forex, Crypto
Timeframes: 1m to 1h for active traders. 4h+ for swing trades.
Pair With: Support/resistance zones, Fibonacci levels, and smart money concepts for additional confluence.
🎯 Why It Works
- Traditional reversal signals suffer from lag and noise. This system filters both by:
- Using multi-source confirmation, not just price movement.
-Tracking volatility directly, not assuming static markets.
-Detecting exhaustion, not just divergence.
-Keeping your screen clean, with only the most relevant data shown.
🧾 Credit & Acknowledgement
🧠 Original Concept Inspiration: This project was deeply inspired by the work of Enes_Yetkin_ and their approach to reversal detection. This version expands on the concept with additional technical layers, updated visuals, and real-time adaptability.
📌 Final Thoughts
This is more than a reversal tool. It's a market condition interpreter, entry/exit planner, and risk assistant all in one. Every aspect is engineered to give you an edge—especially when timing means everything.
Use it with discipline. Use it with clarity. Trade smarter.
**I will continue to release incredible strategies and indicators until I turn this into a brand or until someone offers me a contract.
-Dskyz

EMA 9/21/50 + VWAP + MACD + RSI Pro [v6]Overview:
A powerful multi-indicator tool combining Exponential Moving Averages (EMA 9, 21, 50), Volume-Weighted Average Price (VWAP), Moving Average Convergence Divergence (MACD), and Relative Strength Index (RSI) into a single, easy-to-read system. Designed for traders who want a clean, all-in-one dashboard for trend analysis, momentum confirmation, and overbought/oversold conditions.
Key Features:
1. Triple EMA System (9, 21, 50)
Identifies short-term and medium-term trends.
Bullish Signal: EMA 9 > EMA 21 > EMA 50 (Green Highlight)
Bearish Signal: EMA 9 < EMA 21 < EMA 50 (Red Highlight)
Helps confirm trend direction and potential reversals.
2. VWAP (Volume-Weighted Average Price)
Tracks intraday fair value price based on volume.
Bullish: Price above VWAP (Green)
Bearish: Price below VWAP (Red)
3. MACD (Standard 12, 26, 9 Settings)
Shows momentum shifts.
Bullish: MACD line > Signal line (Green)
Bearish: MACD line < Signal line (Red)
Histogram confirms strength of momentum.
4. RSI (14-Period Default)
Identifies overbought (>70) and oversold (<30) conditions.
Red: Overbought (Potential Reversal)
Green: Oversold (Potential Bounce)
5. Signal Dashboard (Top-Right Table)
Real-time summary of all indicators in one place.
Color-coded for quick interpretation (Green = Bullish, Red = Bearish).
How to Use This Indicator?
✅ Trend Confirmation:
Trade in the direction of EMA alignment (9 > 21 > 50 for uptrends).
Use VWAP as dynamic support/resistance.
✅ Momentum Entries:
Look for MACD crossovers while RSI is not extreme.
Avoid buying when RSI > 70 or selling when RSI < 30 (unless strong trend).
✅ Mean Reversion:
Fade extreme RSI readings (overbought/oversold) when price is at key levels.
Who Is This For?
✔ Swing Traders – EMA + MACD combo for trend-following.
✔ Day Traders – VWAP + EMA for intraday bias.
✔ RSI Traders – Clear overbought/oversold signals.
Settings Customization:
Adjust EMA lengths, RSI periods, and MACD settings as needed.
Toggle VWAP visibility on/off.
Why Use This Script?
📌 All-in-One: No need for multiple indicators cluttering your chart.
📌 Visual Clarity: Color-coded signals for quick decision-making.
📌 Flexible: Works on any timeframe (1M, 5M, 1H, Daily, etc.).
Install now and enhance your trading strategy with a professional-grade multi-indicator system!
Not a financial advice. Use at your own discretion and always apply risk management

Professional MSTI+ Trading Indicator"Professional MSTI+ Trading Indicator" is a comprehensive technical analysis tool that combines over 20 indicators to generate high-quality trading signals and assess market sentiment. The script integrates standard indicators (MACD, RSI, Bollinger Bands, Stochastic, Simple Moving Averages, and Volume Analysis) with advanced components (Squeeze Momentum, Fisher Transform, True Strength Index, Heikin-Ashi, Laguerre RSI, Hull MA) and further includes metrics such as ADX, Chaikin Money Flow, Williams %R, VWAP, and EMA for in-depth market analysis.
Key Features:
Multiple Presets for Different Trading Styles:
Choose from optimal configurations like Professional, Swing Trading, Day Trading, Scalping, or Reversal Hunter. Note that the presets may not work perfectly on all pairs, and manual calibration might be required. This flexibility allows you to fine-tune the settings to align with your unique strategies and signals.
Multi-Layered Signal Filtering:
Filters based on trend, volume, and volatility help eliminate false signals, enhancing the accuracy of market entries.
Comprehensive Fear & Greed Index:
The indicator aggregates data from RSI, volatility, momentum, trend, and volume to gauge overall market sentiment, providing an additional layer of market context.
Dynamic Information Panel:
Displays detailed status updates for each component (e.g., MACD, RSI, Laguerre RSI, TSI, Fisher Transform, Squeeze, Hull MA, etc.) along with a visual strength bar that represents the intensity of the trading signal.
Signal Generation:
Buy and sell signals are generated when a predefined number of conditions are met and confirmed over multiple bars. These signals are clearly displayed on the chart with arrows, making it easier to spot potential entry and exit points.
Alert Setup:
Built-in alert conditions allow you to receive real-time notifications when trading signals are generated, helping you stay on top of market movements.
"Professional MSTI+ Trading Indicator" is designed to enhance your trading strategy by providing a multi-faceted market analysis and an intuitive visual interface. While the presets offer a robust starting point, they may require manual calibration on certain pairs, giving you the flexibility to configure your own unique strategies and signals.

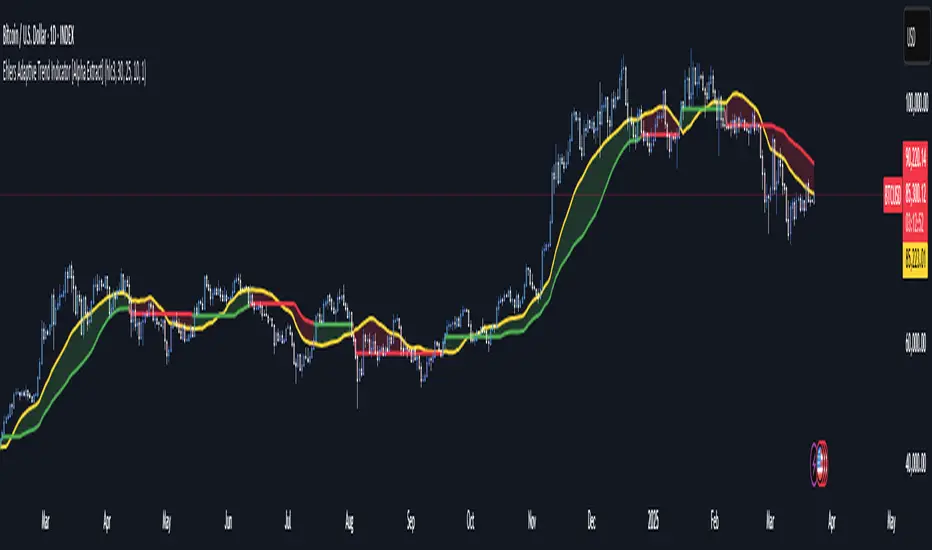
Ehlers Adaptive Trend Indicator [Alpha Extract]Ehlers Adaptive Trend Indicator
The Ehlers Adaptive Trend Indicator combines Ehlers' advanced digital signal processing techniques with dynamic volatility bands to identify robust trend conditions and potential reversals. This powerful tool helps traders visualize trend strength, adaptive support/resistance levels, and momentum shifts across various market conditions.
🔶 CALCULATION
The indicator employs a sophisticated adaptive algorithm that responds to changing market conditions:
• Ehlers Filter : Calculates a weighted average based on momentum differences to create an adaptive trend baseline.
• Dynamic Bands : Volatility-adjusted bands that expand and contract based on recent price action.
• Trend Level : A dynamic support/resistance level that adapts to the current trend direction.
• Smoothed Volatility : Market volatility measured and smoothed to provide reliable band width.
Formula:
• Ehlers Basis = Weighted average of price, with weights determined by momentum differences
• Volatility = Standard deviation of price over Ehlers Length period
• Smoothed Volatility = EMA of volatility over Smoothing Length
• Upper Band = Ehlers Basis + Smoothed Volatility × Sensitivity
• Lower Band = Ehlers Basis - Smoothed Volatility × Sensitivity
• Trend Level = Adaptive support in uptrends, resistance in downtrends
🔶 DETAILS
Visual Features :
• Ehlers Basis Line (Yellow): The core adaptive trend reference that serves as the primary trend indicator.
• Trend Level Line (Dynamic Color): Changes between green (bullish) and red (bearish) based on the current trend state.
• Fill Areas : Transparent green fill during bullish trends and transparent red fill during bearish trends for clear visual identification.
• Bar Coloring : Optional price bar coloring that reflects the current trend direction for enhanced visualization.
Interpretation :
• **Bullish Signal**: Price crosses above the upper band, triggering a trend change with the Trend Level becoming dynamic support.
• **Bearish Signal**: Price drops below the lower band, confirming a trend change with the Trend Level becoming dynamic resistance.
• **Trend Continuation**: Trend Level rises in bullish markets and falls in bearish markets, providing adaptive trailing support/resistance.
🔶 EXAMPLES
The chart demonstrates:
• Bullish Trend Identification : When price breaks above the upper band, the indicator shifts to bullish mode with green trend level and fill.
• Bearish Trend Identification : When price falls below the lower band, the indicator shifts to bearish mode with red trend level and fill.
• Trend Persistence : Trend Level adapts to market movement, rising during uptrends to provide dynamic support and falling during downtrends to act as resistance.
Example Snapshots :
• During a strong uptrend, the Trend Level continuously adjusts upward, keeping traders in the trend while filtering out minor retracements.
• During trend reversals, clear color changes and Trend Level shifts provide early warning of potential direction changes.
🔶 SETTINGS
Customization Options :
• Ehlers Length (p1) (Default: 30): Controls the primary adaptive calculation period, balancing responsiveness with stability.
• Momentum Length (p2) (Default: 25): Determines the lag for momentum calculations used in the adaptive weighting.
• Smoothing Length (Default: 10): Adjusts the volatility smoothing period—higher values provide more stable bands.
• Sensitivity (Default: 1.0): Multiplier for band width—higher values increase distance between bands, lower values tighten them.
• Visual Settings : Customizable colors for bullish and bearish trends, basis line, and optional bar coloring.
The Ehlers Adaptive Trend Indicator combines John Ehlers' digital signal processing expertise with modern volatility analysis to create a robust trend-following system that adapts to changing market conditions, helping traders stay on the right side of the market.
Multi-Timeframe PSAR Indicator ver 1.0Enhance your trend analysis with the Multi-Timeframe Parabolic SAR (MTF PSAR) indicator! This powerful tool displays the Parabolic SAR (Stop and Reverse) from both the current chart's timeframe and a higher timeframe, all in one convenient view. Identify potential trend reversals and set dynamic trailing stops with greater confidence by understanding the broader market context.
Key Features:
Dual Timeframe Analysis: Simultaneously visualize the PSAR on your current chart and a user-defined higher timeframe (e.g., see the Daily PSAR while trading on the 1-hour chart). This helps you align your trades with the dominant trend.
Customizable PSAR Settings: Fine-tune the PSAR calculation with adjustable Start, Increment, and Maximum values. Optimize the indicator's sensitivity to match your trading style and the volatility of the asset.
Independent Timeframe Control: Choose to display either or both the current timeframe PSAR and the higher timeframe PSAR. Focus on the information most relevant to your analysis.
Clear Visual Representation: Distinct colors for the current and higher timeframe PSAR dots make it easy to differentiate between the two. Quickly identify potential entry and exit points.
Configurable Colors You can easily change colors of Current and HTF PSAR.
Standard PSAR Logic: Uses the classic Parabolic SAR algorithm, providing a reliable and widely-understood trend-following indicator.
lookahead=barmerge.lookahead_off used in the security function, there is no data leak or repainting.
Benefits:
Improved Trend Identification: Spot potential trend changes earlier by observing divergences between the current and higher timeframe PSAR.
Enhanced Risk Management: Use the PSAR as a dynamic trailing stop-loss to protect profits and limit potential losses.
Greater Trading Confidence: Make more informed decisions by considering the broader market trend.
Reduced Chart Clutter: Avoid the need to switch between multiple charts to analyze different timeframes.
Versatile Application: Suitable for various trading styles (swing trading, day trading, trend following) and markets (stocks, forex, crypto, etc.).
How to Use:
Add to Chart: Add the "Multi-Timeframe PSAR" indicator to your TradingView chart.
Configure Settings:
PSAR Settings: Adjust the Start, Increment, and Maximum values to control the PSAR's sensitivity.
Multi-Timeframe Settings: Select the desired "Higher Timeframe PSAR" resolution (e.g., "D" for Daily). Enable or disable the display of the current and/or higher timeframe PSAR using the checkboxes.
Interpret Signals:
Current Timeframe PSAR: Dots below the price suggest an uptrend; dots above the price suggest a downtrend.
Higher Timeframe PSAR: Provides context for the overall trend. Agreement between the current and higher timeframe PSAR strengthens the trend signal. Divergences may indicate potential reversals.
Trade Management:
Use PSAR dots as dynamic trailing stop.
Example Use Cases:
Confirming Trend Strength: A trader on a 1-hour chart sees the 1-hour PSAR flip bullish (dots below the price). They check the MTF PSAR and see that the Daily PSAR is also bullish, confirming the strength of the uptrend.
Identifying Potential Reversals: A trader sees the current timeframe PSAR flip bearish, but the higher timeframe PSAR remains bullish. This divergence could signal a potential pullback within a larger uptrend, or a warning of a more significant reversal.
Trailing Stops: A trader enters a long position and uses the current timeframe PSAR as a trailing stop, moving their stop-loss up as the PSAR dots rise.
Disclaimer: The Parabolic SAR is a lagging indicator and may produce false signals, especially in ranging markets. It is recommended to use this indicator in conjunction with other technical analysis tools and risk management strategies. Past performance is not indicative of future results.

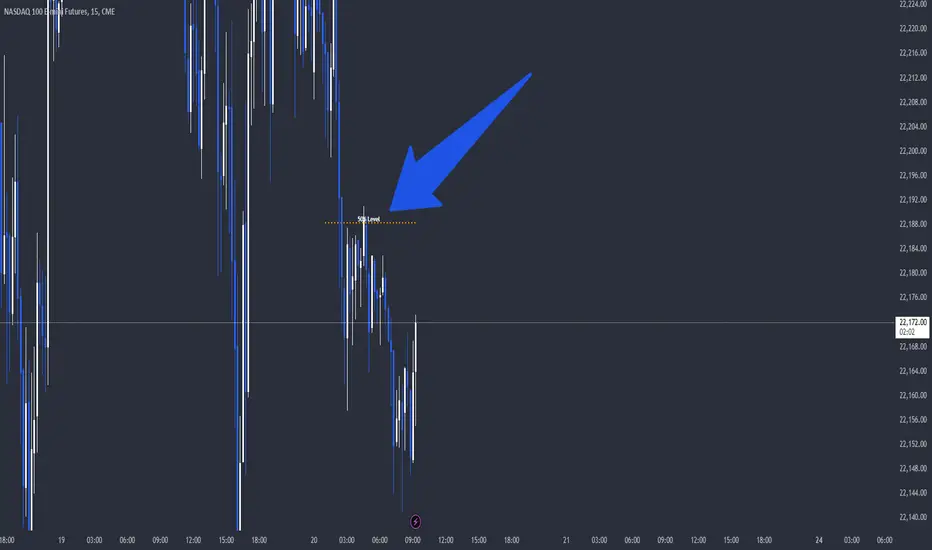
Dynamic 50% Indicator of the selected range!This is a indicator which shows you the 50% level of the selected timeframe range. This is a good tool because price tends to bounce of of 50% levels.
Introducing the 50% Range Level Indicator, designed for traders who seek accuracy and strategic insights in their market analysis. This tool calculates and visually displays the midpoint (50% level) of any selected price range, helping you identify key equilibrium zones where price action often reacts.
Why Use This Indicator?
Key Market Equilibrium – The 50% level is a crucial reference point where price often consolidates, reverses, or gathers momentum.
Custom Range Selection – Simply select your desired price range, and the indicator will dynamically plot the midpoint.
Enhance Your Trading Strategy – Use it for support & resistance confirmation, retracement analysis, or confluence with other indicators.
Works on All Timeframes & Assets – Suitable for stocks, forex, crypto, and indices.
Gain an Edge in the Market
Whether you’re a day trader, swing trader, or long-term investor, the 50% Range Level Indicator can enhance your technical analysis and decision-making.
Futuristic Indicator v3 - Enhanced Glow & Strength MetersTo ensure candles are display by script go to trading view settings and uncheck default Candle, Body and Wick to prevent them from plotting over your modified candles.
Futuristic Indicator v3 - Enhanced Glow & Strength Meters: Detailed Breakdown
This Modern styled Pine Script indicator is designed to enhance technical analysis by providing a visually striking OLED-style dashboard with multiple market insights. It integrates trend detection, momentum analysis, volatility tracking, and strength meters into a single, streamlined interface for traders.
1️⃣ Customizable Features for Flexibility
The indicator offers multiple user-configurable settings, allowing traders to adjust the display based on their trading strategy and preferences. Users can toggle elements such as strength meters, volatility indicators, trend arrows, moving averages, and buy/sell alerts. Additionally, background and candle colors can be customized for better readability.
🔹 Why is this useful?
Traders can customize their charts to focus on the data they care about.
Reduces chart clutter by allowing users to toggle features on or off.
2️⃣ Trend Detection Using EMAs
This indicator detects market trends using two Exponential Moving Averages (EMA):
A "Fast" EMA (shorter period) for quick trend shifts.
A "Slow" EMA (longer period) to confirm trends.
Comparison of the two EMAs determines if the trend is bullish (uptrend) or bearish (downtrend).
The indicator colors the trend lines accordingly and adds a trend arrow 📈📉 for quick visual cues.
🔹 Why is this useful?
EMA crossovers are widely used to identify trend reversals.
Provides clear visual cues for traders to confirm entry & exit points.
3️⃣ RSI-Based Momentum Analysis
The indicator integrates the Relative Strength Index (RSI) to gauge market momentum. The momentum value changes color dynamically based on whether it's in bullish (>50) or bearish (<50) territory.
🔹 Why is this useful?
RSI helps identify overbought and oversold conditions.
Detects trend strength by measuring the speed of price movements.
4️⃣ Bullish & Bearish Strength Meters
The indicator quantifies bullish and bearish market strength based on RSI and converts it into a percentage-based meter:
Bullish Strength (Long Strength)
Bearish Strength (Short Strength)
Strength meters are displayed using OLED-styled bars, dynamically changing in real-time.
🔹 Why is this useful?
Allows traders to visually gauge market sentiment at a glance.
Helps confirm if a trend has strong momentum or is losing strength.
5️⃣ Market Volatility Indicator (ATR-Based)
The indicator includes a volatility tracker using the Average True Range (ATR):
ATR is scaled up to provide easier readability.
Higher ATR values indicate higher market volatility.
🔹 Why is this useful?
Helps traders identify potential breakout or consolidation phases.
Allows better risk management by understanding price fluctuations.
6️⃣ Trend Strength Calculation
The indicator calculates trend strength based on the difference between the EMAs:
A higher trend strength value suggests a stronger directional trend.
Displayed as a percentage for better clarity.
🔹 Why is this useful?
Helps traders differentiate between strong and weak trends.
Reduces the likelihood of entering weak or choppy markets.
7️⃣ OLED-Style Dashboard for Market Data
A futuristic OLED-styled table is used to display critical market data in a visually appealing way:
Trend direction (Bullish/Bearish with an arrow 📈📉).
Current price.
Momentum value.
Strength meters (Bullish/Bearish).
Trend strength percentage.
Volatility Meter
The dashboard uses high-contrast colors and neon glow effects, making it easier to read against dark backgrounds.
🔹 Why is this useful?
Provides a centralized view of key trading metrics.
Eliminates the need to manually calculate trend strength.
8️⃣ Modern Style Neon Glow Effects
To enhance visibility, the indicator applies glowing effects to:
Moving Averages (EMAs): Highlighted with layered glow effects.
Candlesticks: Borders and wicks dynamically change color based on trend direction.
🔹 Why is this useful?
Improves readability in low-contrast or dark-mode charts.
Helps traders spot trends faster without reading numerical data.
9️⃣ Automated Buy & Sell Alerts
The script triggers alerts when momentum crosses key levels:
Above 55 → Potential Long Setup
Below 45 → Potential Short Setup.
🔹 Why is this useful?
Alerts help traders react quickly without constantly monitoring the chart.
Reduces the risk of missing critical trade opportunities.
🔹 Final Summary: Why is This Indicator Useful?
This futuristic cyberpunk-styled trading tool enhances traditional market analysis by combining technical indicators with high-visibility visuals.
🔹 Key Benefits:
✅ Customizable Display – Toggle elements based on trading needs.
✅ Trend Detection – EMAs highlight uptrends & downtrends.
✅ Momentum Tracking – RSI-based momentum gauge identifies strong moves.
✅ Strength Meters – Bullish/Bearish power is clearly visualized.
✅ Volatility Insights – ATR-based metric highlights market turbulence.
✅ Trend Strength Analysis – Quantifies trend intensity.
✅ Dashboard – Provides a centralized, easy-to-read data panel.
✅ Cyberpunk Neon Glow – Enhances clarity with stylish aesthetics.
✅ Real-Time Alerts – Helps traders react to key opportunities.
This indicator is designed to be both functional and visually appealing, making market analysis more intuitive and efficient. 🚀

Volume-Based RSI Color Indicator with MAsVolume-Based RSI Color Indicator with MAs
Overview
This script combines the Relative Strength Index (RSI) with volume analysis to provide an enhanced perspective on market conditions. By dynamically coloring the RSI line based on overbought/oversold conditions and volume thresholds, this indicator helps traders quickly identify high-probability reversal zones. Additionally, it incorporates short-term and long-term moving averages (MAs) of the RSI for trend analysis, making it a versatile tool for scalping and swing trading strategies.
Key Features
Dynamic RSI Color Coding:
The RSI line changes color based on two conditions:
Overbought/High Volume: RSI is above the overbought threshold (default: 70) and volume exceeds the average volume by a user-defined multiplier (default: 2.0). The line turns red, indicating potential reversal zones.
Oversold/High Volume: RSI is below the oversold threshold (default: 30) and volume exceeds the average volume by the multiplier. The line turns green, suggesting potential buying opportunities.
Neutral Conditions: Default blue color for all other scenarios.
Volume Integration:
Unlike standard RSI indicators, this script incorporates volume data to refine signals, helping traders avoid false signals in low-volume environments.
RSI Moving Averages:
Two moving averages of the RSI (short-term and long-term) provide trend context:
200-period MA: Highlights the long-term trend in RSI values.
20-period MA: Shows short-term fluctuations for quick decision-making.
Both MAs can be calculated using Simple or Exponential methods, giving users flexibility.
Visual Aids:
Horizontal lines at the overbought (70) and oversold (30) levels help define the boundaries of expected price action extremes.
How It Works
The script calculates the RSI over a user-defined length (default: 14).
Volume data is compared to its moving average to determine if it exceeds the user-defined high-volume threshold.
When RSI and volume conditions align, the RSI line is dynamically colored to indicate potential overbought/oversold zones.
The RSI moving averages provide additional context to confirm trends or reversals.
How to Use
Identify Reversal Zones:
Look for green RSI signals in oversold conditions to identify potential buying opportunities.
Look for red RSI signals in overbought conditions to identify potential selling opportunities.
Use Moving Averages for Confirmation:
When the RSI is above its 200-period MA, the long-term trend is bullish; consider only long trades.
When the RSI is below its 200-period MA, the trend is bearish; consider only short trades.
Combine with Other Tools:
This indicator works best when used alongside price action analysis, candlestick patterns, or support/resistance levels.
Originality
This script is unique in combining volume analysis with RSI and RSI-specific moving averages. While many indicators focus on RSI or volume separately, this script marries these two key metrics to filter out weak signals and improve trade decision accuracy.
Chart Recommendations
Clean Chart: Use this indicator on a clean chart without additional overlays for maximum clarity.
Timeframes: Works well on intraday charts (e.g., 5m, 15m) for scalping and on higher timeframes (e.g., 1H, 4H, Daily) for swing trading.
Disclaimer
This indicator is a tool to aid trading decisions and should not be used in isolation. Always consider other factors such as market conditions, news events, and risk management.

ELC Indicator**ELC Indicator – Enigma Liquidity Concept**
The ELC Indicator is a cutting-edge tool designed for traders who want to leverage price action and liquidity concepts for high-precision trading opportunities. Unlike conventional indicators that rely purely on trend-following or oscillatory methods, ELC incorporates a unique combination of market structure, Fibonacci retracement levels, and dynamic EMA filtering to detect key buy and sell zones. This original approach helps traders capture the most relevant market movements and anticipate potential reversals with higher confidence.
---
### **What the ELC Indicator Does**
The primary goal of the ELC Indicator is to identify liquidity zones and plot Fibonacci-based levels around detected buy or sell signals. It continuously monitors price action to identify instances where significant liquidity grabs occur, signaled by breakouts beyond recent highs or lows. Once a signal is detected, the indicator plots horizontal lines at key Fibonacci ratios (0%, 25%, 50%, 75%, 100%, 120%, and 180%) to give traders a clear visual framework for potential retracement or extension levels.
Additionally, the indicator includes a dynamic EMA filter, which ensures that buy signals are only triggered when the price is above the EMA and sell signals when the price is below the EMA. This filtering mechanism helps reduce false signals in choppy markets and aligns trades with the broader trend direction.
---
### **Key Features**
1. **Buy & Sell Signals**
- Buy signals are generated when a liquidity grab occurs below the previous low, and the closing price is above the candle body midpoint and the EMA.
- Sell signals are triggered when a liquidity grab occurs above the previous high, and the closing price is below the candle body midpoint and the EMA.
- Visual cues are provided via small upward (green) and downward (red) triangles on the chart.
2. **Fibonacci Levels**
- For each buy or sell signal, the indicator plots multiple horizontal lines at key Fibonacci levels. These levels can help traders set realistic profit targets and stop-loss levels.
- The plotted lines can be customized in terms of style (solid, dotted, dashed) and color (buy and sell line colors).
3. **Dynamic EMA Filtering**
- A customizable EMA filter is integrated into the logic to align trades with the prevailing trend.
- The EMA length is adjustable, allowing traders to fine-tune the indicator based on their trading style and market conditions.
4. **Alert System**
- Alerts can be enabled for both buy and sell signals, ensuring traders never miss an opportunity even when away from the screen.
- Alerts are triggered once per bar, ensuring timely notifications without excessive noise.
5. **Customizable Signal Visibility**
- Traders can toggle the visibility of the last 9 buy and sell signals. When this option is disabled, only the most recent signal is displayed, helping to declutter the chart.
---
### **How to Use the ELC Indicator**
- **Trend Following**: The ELC Indicator works well in trending markets by filtering signals based on the EMA direction. Traders can use the plotted Fibonacci levels to enter trades, set profit targets, and manage risk.
- **Reversal Trading**: The liquidity grab detection mechanism allows traders to capture potential market reversals. By waiting for price retracements to key Fibonacci levels after a signal, traders can enter trades with a favorable risk-to-reward ratio.
- **Scalping & Day Trading**: With its ability to plot key intraday levels and generate real-time alerts, the ELC Indicator is particularly useful for scalpers and day traders looking to exploit short-term market inefficiencies.
---
### **Concepts Underlying the Calculations**
1. **Liquidity Grabs**: The ELC Indicator’s core logic is based on detecting instances where the market moves beyond a recent high or low, triggering a liquidity grab. This often signals a potential reversal or continuation, depending on broader market conditions.
2. **Fibonacci Ratios**: Once a signal is detected, key Fibonacci levels are plotted to provide traders with actionable zones for trade entries, profit targets, or stop-loss placements.
3. **EMA Filtering**: The EMA acts as a dynamic trend filter, ensuring that signals are aligned with the dominant market direction. This reduces the likelihood of entering trades against the prevailing trend.
---
### **Why ELC is Unique**
The ELC Indicator stands out by combining multiple powerful trading concepts—liquidity, Fibonacci ratios, and EMA filtering—into a single tool that provides actionable and visually intuitive information. Unlike traditional trend-following indicators that lag behind price action, ELC proactively identifies key market turning points based on liquidity events. Its customizable features, real-time alerts, and comprehensive plotting of Fibonacci levels make it a versatile tool for traders across various styles and timeframes.
Whether you're a scalper looking for intraday opportunities or a swing trader aiming to capture larger moves, the ELC Indicator offers a robust framework for identifying and executing high-probability trades.
---
### **How to Get Started**
1. Add the ELC Indicator to your chart.
2. Customize the EMA length, line colors, and style based on your preference.
3. Enable alerts to receive real-time notifications of buy and sell signals.
4. Use the plotted Fibonacci levels to plan your trade entries, profit targets, and stop-loss levels.
5. Combine the signals from ELC with your existing market analysis for optimal results.
---
This unique approach makes the ELC Indicator a valuable tool for traders seeking precision, clarity, and consistency in their trading decisions.

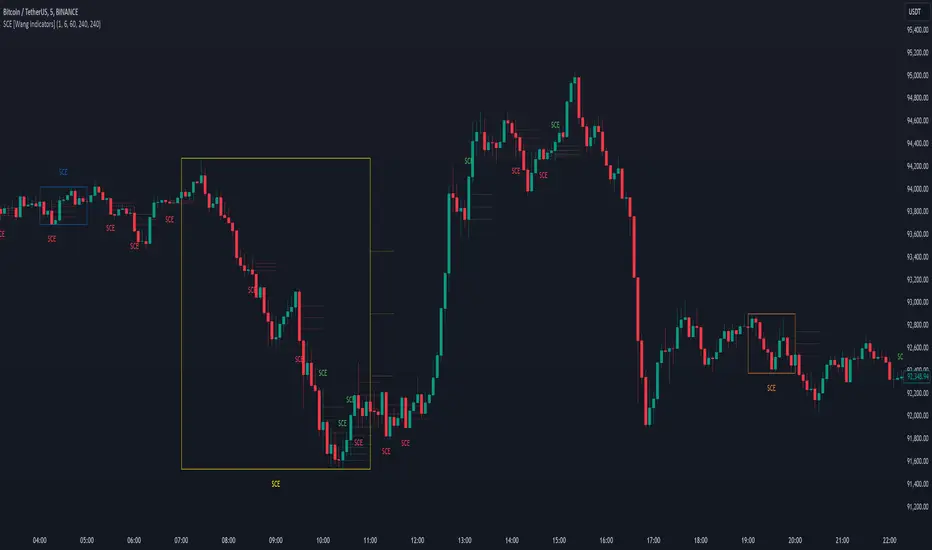
Single Candle Entry with Multi-Timeframe [Wang Indicators]
Single candle entry
Overview : The "Single Candle Entry Model" indicator is designed to help traders through a simple yet effective trading strategy. This indicator automatically detects candles that encompass both the high and low of the previous candle, creating key price zones for potential market entries.
- This indicator was developed with the help of @DaveTeaches -
How does it works ?
Detects when a candle trade above the high and below the low of the previous candle
When it occur, the indicator write "SCE" on the candle
The text will be in different color if its bearish or bullish (customizable by user)
Higher Timeframes
Users can enable up to 3 HTF SCE detection to enhance multi timeframe analysis.
Users can select which timeframe he want to use
Boxes will be displayed around High time frame SCE to highlight the HTF candle.
As regular SCE, the indicator will write "SCE" above or under the box
How does it helps users ?
Once the SCE is created, it can be used as a zone.
Levels (30, 50 and 70%) are displayed
Users can customize their apparence as they see fit
The 30 - 50 - 70 levels are support/resistance that the price tend to bounce of off
You might find some success looking for an entry inside the zone at a level if price gives further confirmations such as a lower time frame flip or using other indicators
Alert can be setup on any timeframe
OBV Divergence Indicator [TradingFinder] On-Balance Vol Reversal🔵 Introduction
The On-Balance Volume (OBV) indicator, introduced by Joe Granville in 1963, is a powerful technical analysis tool used to measure buying and selling pressure based on trading volume and price.
By aggregating trading volume—adding it on positive days and subtracting it on negative days—OBV creates a cumulative line that reflects market volume pressure, making it valuable for confirming trends, identifying entry and exit points, and forecasting potential price movements.
Divergences between price and OBV often provide significant signals. A bearish divergence occurs when the price forms higher highs while the OBV line forms lower highs. This discrepancy indicates that upward momentum is weakening, increasing the likelihood of a downward trend.
In contrast, a bullish divergence happens when the price makes lower lows, but the OBV line forms higher lows. This suggests increasing buying pressure and the potential for an upward trend reversal.
For instance, if the price is rising but the OBV trendline is falling, it may signal a bearish divergence, warning of a possible price decline. Conversely, if the price is falling while the OBV line is rising, this could signal a bullish divergence, indicating a possible price recovery. These signals are particularly useful for identifying market turning points.
OBV often acts as a leading indicator, moving ahead of price changes. For example, a rising OBV alongside stable or declining prices can signal an impending upward breakout.
Conversely, a declining OBV with rising prices may indicate that the current uptrend is losing strength. Traders using this strategy often consider entering positions at breakout levels while setting stop losses near recent swing highs or lows to manage risk effectively.
This integration highlights how OBV divergences can provide actionable insights for predicting price movements and managing trades efficiently.
Bullish Divergence :
Bearish Divergence :
🔵 How to Use
The OBV indicator, as a cumulative tool, assists analysts in comparing volume and price changes to identify new trends and key levels for entering or exiting trades. Beyond confirming existing trends, it is particularly effective in analyzing positive and negative divergences between price and volume, providing valuable signals for trading decisions.
🟣 Bullish Divergence
A bullish divergence occurs when the price continues its downward or stable trend, but the OBV line starts rising, forming a higher low compared to its previous low. This suggests increasing volume on up days relative to down days and often signals a reversal to the upside.
For instance, if an asset's price stabilizes near a support level but the OBV line shows an upward trend, this divergence could present an opportunity to enter a long position.
🟣 Bearish Divergence
A bearish divergence occurs when the price forms higher highs, but the OBV line declines, creating lower highs compared to previous peaks. This indicates decreasing volume on up days relative to down days and often acts as a warning for a reversal to the downside.
For example, if an asset’s price approaches a resistance level while OBV starts declining, this divergence may signal the beginning of a downtrend and could indicate a good time to exit long trades or enter short positions.
🔵 Setting
Period : The "Period" setting allows you to define the number of bars or intervals for "Periodic" and "EMA" modes. A shorter period captures more short-term movements, while a longer period smooths out the fluctuations and provides a broader view of market trends.
You can enable or disable labels to highlight key levels or divergences and tables to show numerical details like values and divergence types. These options allow for a customized chart display.
🔵 Table
The following table breaks down the main features of the oscillator. It covers four critical categories: Exist, Consecutive, Divergence Quality, and Change Phase Indicator.
Exist : If divergence is detected, a "+" will appear in this row.
Consecutive: Shows the number of consecutive divergences that have formed in a short period.
Divergence Quality : Evaluates the quality of the divergence based on the number of occurrences. One is labeled "Normal," two are "Good," and three or more are considered "Strong."
Change Phase Indicator : If a phase change is detected between two oscillation peaks, this is marked in the table.
🔵 Conclusion
The OBV (On Balance Volume) indicator is a simple yet effective tool in technical analysis that combines volume and price changes to provide a comprehensive view of market buying and selling pressure. By identifying positive and negative divergences, OBV enables analysts to detect early signs of trend reversals and refine their trading strategies.
Divergences in OBV often precede price changes, making it a leading indicator for predicting market movements. Using OBV alongside other technical tools can enhance decision-making accuracy and help traders identify better entry and exit points. However, it is essential to consider the limitations of OBV, such as the potential for signal errors and the impact of sudden news events.
Ultimately, OBV serves as a complementary tool in technical analysis, aiding in trend identification, signal confirmation, and risk management. A thoughtful application of this indicator, in combination with other analytical tools, can create valuable opportunities for profiting in financial markets.

No Wick Setup Indicator
**No Wick Setup Indicator**
This is a custom trading indicator designed to identify and signal potential buy and sell opportunities based on candlestick patterns with no wicks. Specifically, it looks for candles with no wicks at the bottom (bullish setup) or no wicks at the top (bearish setup). Here's how it works:
**Key Features:**
- **Bullish Setup**: A green candlestick with no bottom wick (i.e., the open price is equal to the low price of the candle) is considered a potential bullish signal. A trendline is drawn at the bottom of this candle. When the market price returns to this trendline, a buy signal is generated.
- **Bearish Setup**: A red candlestick with no top wick (i.e., the open price is equal to the high price of the candle) is considered a potential bearish signal. A trendline is drawn at the top of this candle. When the market price returns to this trendline, a sell signal is generated.
- **Timeframe**: This indicator works exclusively on the **30-minute timeframe**.
**How It Works:**
1. When a candlestick pattern with no bottom wick (bullish setup) is identified, a trendline is drawn at the low of the candlestick.
2. When a candlestick pattern with no top wick (bearish setup) is identified, a trendline is drawn at the high of the candlestick.
3. The indicator then tracks the market price and waits for it to return to the respective trendline level.
4. **Buy Signal**: When the market price touches or goes below the bullish trendline, a **Buy** signal is displayed on the chart with an upward arrow.
5. **Sell Signal**: When the market price touches or goes above the bearish trendline, a **Sell** signal is displayed on the chart with a downward arrow.
**Visual Elements:**
- **Trendlines**: Horizontal lines drawn at the bottom (bullish) or top (bearish) of the candlesticks with no wick.
- **Buy/Sell Labels**: Labels indicating "Buy" or "Sell" appear when the market price returns to the trendline.
**Why Use This Indicator?**
- This indicator helps identify specific price levels where the market might reverse or consolidate based on candlestick structure, offering potential entry points for trades.
- It allows traders to focus on price action and market behavior without relying on more complex indicators.

Cabal Dev IndicatorThis is a TradingView Pine Script (version 6) that creates a technical analysis indicator called the "Cabal Dev Indicator." Here's what it does:
1. Core Functionality:
- It calculates a modified version of the Stochastic Momentum Index (SMI), which is a momentum indicator that shows where the current close is relative to the high/low range over a period
- The indicator combines elements of stochastic oscillator calculations with exponential moving averages (EMA)
2. Key Components:
- Uses configurable input parameters for:
- Percent K Length (default 15)
- Percent D Length (default 3)
- EMA Signal Length (default 15)
- Smoothing Period (default 5)
- Overbought level (default 40)
- Oversold level (default -40)
3. Calculation Method:
- Calculates the highest high and lowest low over the specified period
- Finds the difference between current close and the midpoint of the high-low range
- Applies EMA smoothing to both the range and relative differences
- Generates an SMI value and further smooths it using a simple moving average (SMA)
- Creates an EMA signal line based on the smoothed SMI
4. Visual Output:
- Plots the smoothed SMI line in green
- Plots an EMA signal line in red
- Shows overbought and oversold levels as gray horizontal lines
- Fills the areas above the overbought level with light red
- Fills the areas below the oversold level with light green
This indicator appears designed to help traders identify potential overbought and oversold conditions in the market, as well as momentum shifts, which could be used for trading decisions.
Would you like me to explain any specific part of the indicator in more detail?

Adapted RSI w/ Multi-Asset Regime Detection v1.1The relative strength index (RSI) is a momentum indicator used in technical analysis. RSI measures the speed and magnitude of an asset's recent price changes to detect overbought or oversold conditions in the price of said asset.
In addition to identifying overbought and oversold assets, the RSI can also indicate whether your desired asset may be primed for a trend reversal or a corrective pullback in price. It can signal when to buy and sell.
The RSI will oscillate between 0 and 100. Traditionally, an RSI reading of 70 or above indicates an overbought condition. A reading of 30 or below indicates an oversold condition.
The RSI is one of the most popular technical indicators. I intend to offer a fresh spin.
Adapted RSI w/ Multi-Asset Regime Detection
Our Adapted RSI makes necessary improvements to the original Relative Strength Index (RSI) by combining multi-timeframe analysis with multi-asset monitoring and providing traders with an efficient way to analyse market-wide conditions across different timeframes and assets simultaneously. The indicator automatically detects market regimes and generates clear signals based on RSI levels, presenting this data in an organised, easy-to-read format through two dynamic tables. Simplicity is key, and having access to more RSI data at any given time, allows traders to prepare more effectively, especially when trading markets that "move" together.
How we calculate the RSI
First, the RSI identifies price changes between periods, calculating gains and losses from one look-back period to the next. This look-back period averages gains and losses over 14 periods, which in this case would be 14 days, and those gains/losses are calculated based on the daily closing price. For example:
Average Gain = Sum of Gains over the past 14 days / 14
Average Loss = Sum of Losses over the past 14 days / 14
Then we calculate the Relative Strength (RS):
RS = Average Gain / Average Loss
Finally, this is converted to the RSI value:
RSI = 100 - (100 / (1 + RS))
Key Features
Our multi-timeframe RSI indicator enhances traditional technical analysis by offering synchronised Daily, Weekly, and Monthly RSI readings with automatic regime detection. The multi-asset monitoring system allows tracking of up to 10 different assets simultaneously, with pre-configured major pairs that can be customised to any asset selection. The signal generation system provides clear market guidance through automatic regime detection and a five-level signal system, all presented through a sophisticated visual interface with dynamic RSI line colouring and customisable display options.
Quick Guide to Use it
Begin by adding the indicator to your chart and configuring your preferred assets in the "Asset Comparison" settings.
Position the two information tables according to your preference.
The main table displays RSI analysis across three timeframes for your current asset, while the asset table shows a comparative analysis of all monitored assets.
Signals are colour-coded for instant recognition, with green indicating bullish conditions and red for bearish conditions. Pay special attention to regime changes and signal transitions, using multi-timeframe confluence to identify stronger signals.
How it Works (Regime Detection & Signals)
When we say 'Regime', a regime is determined by a persistent trend or in this case momentum and by leveraging this for RSI, which is a momentum oscillator, our indicator employs a relatively simple regime detection system that classifies market conditions as either Bullish (RSI > 50) or Bearish (RSI < 50). Our benchmark between a trending bullish or bearish market is equal to 50. By leveraging a simple classification system helps determine the probability of trend continuation and the weight given to various signals. Whilst we could determine a Neutral regime for consolidating markets, we have employed a 'neutral' signal generation which will be further discussed below...
Signal generation occurs across five distinct levels:
Strong Buy (RSI < 15)
Buy (RSI < 30)
Neutral (RSI 30-70)
Sell (RSI > 70)
Strong Sell (RSI > 85)
Each level represents different market conditions and probability scenarios. For instance, extreme readings (Strong Buy/Sell) indicate the highest probability of mean reversion, while neutral readings suggest equilibrium conditions where traders should focus on the overall regime bias (Bullish/Bearish momentum).
This approach offers traders a new and fresh spin on a popular and well-known tool in technical analysis, allowing traders to make better and more informed decisions from the well presented information across multiple assets and timeframes. Experienced and beginner traders alike, I hope you enjoy this adaptation.

Perfect Hammer Pattern Indicators and Alerts# Perfect Hammer Pattern Indicators and Alerts
This indicator identifies a specific and precise hammer candlestick pattern formation that can signal potential trend reversals or continuation setups. Unlike traditional hammer pattern indicators, this script focuses on exact wick measurements to identify high-probability trade setups.
## Pattern Specifications
### Bullish Setup Requirements
- Two consecutive green (bullish) candles
- Both candles must have NO lower wick (perfect bottom)
- Both candles must have an upper wick (showing buying pressure)
- Previous candle must be red (bearish) for context
- Marked with a green 'H' below the pattern
### Bearish Setup Requirements
- Two consecutive red (bearish) candles
- Both candles must have NO upper wick (perfect top)
- Both candles must have a lower wick (showing selling pressure)
- Previous candle must be green (bullish) for context
- Marked with a red 'H' above the pattern
## Trading Logic
This pattern is particularly effective because it shows clear control by either buyers (bullish pattern) or sellers (bearish pattern):
- In the bullish pattern, the absence of lower wicks indicates strong buying pressure preventing prices from falling below the open, while the upper wicks show profit-taking at highs
- In the bearish pattern, the absence of upper wicks shows strong selling pressure capping any upward movement, while the lower wicks indicate some buying support below
## Alerts
The indicator includes two alert conditions:
1. Bullish Pattern Alert: Triggers when two perfect bullish hammers appear after a bearish candle
2. Bearish Pattern Alert: Triggers when two perfect bearish hammers appear after a bullish candle
## Usage Tips
- Best used on timeframes 15 minutes and above
- Consider using in conjunction with key support/resistance levels
- Volume confirmation can increase pattern reliability
- The pattern may signal either trend continuation or reversal - always consider the larger market context
## Notes
- This indicator focuses on precise hammer formations rather than approximate patterns
- The requirement for consecutive perfect hammers makes this a relatively rare but high-probability setup
- Visual markers ('H') provide easy pattern identification on charts

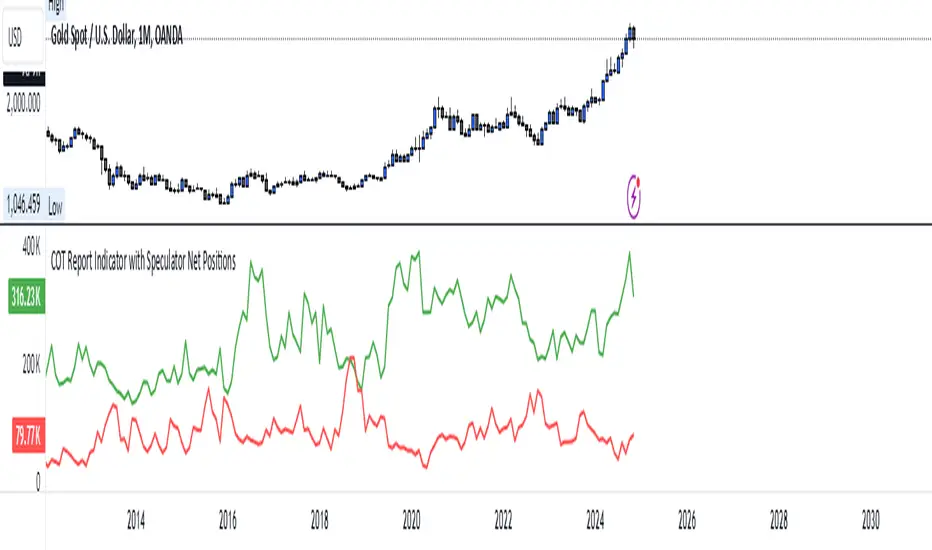
COT Report Indicator with Speculator Net PositionsThe COT Report Indicator with Speculator Net Positions is designed to give traders insights into the behavior of large market participants, particularly speculators, based on the Commitment of Traders (COT) report data. This indicator visualizes the long and short positions of non-commercial traders, allowing users to gauge the sentiment and positioning of large speculators in key markets, such as Gold, Silver, Crude Oil, S&P 500, and currency pairs like EURUSD, GBPUSD, and others.
The indicator provides three essential components:
Net Long Position (Green) - Displays the total long positions held by speculators.
Net Short Position (Purple) - Shows the total short positions held by speculators.
Net Difference (Long - Short) (Yellow) - Illustrates the difference between long and short positions, helping users identify whether speculators are more bullish or bearish on the asset.
Recommended Timeframes:
Best Timeframes: Weekly and Monthly
The COT report data is released on a weekly basis, making higher timeframes like the Weekly and Monthly charts ideal for this indicator. These timeframes provide a more accurate reflection of the underlying trends in speculator positioning, avoiding the noise present in lower timeframes.
How to Use:
Market Sentiment: Use this indicator to gauge the sentiment of large speculators, who often drive market trends. A strong net long position can indicate bullish sentiment, while a high net short position might suggest bearish sentiment.
Trend Reversal Signals: Sudden changes in the net difference between long and short positions may indicate potential trend reversals.
Confirmation Tool: Pair this indicator with your existing analysis to confirm the strength of a trend or identify overbought/oversold conditions based on speculator activity.
Supported Symbols:
This indicator currently supports a range of commodities and currency pairs, including:
Gold ( OANDA:XAUUSD )
Silver ( OANDA:XAGUSD )
Crude Oil ( TVC:USOIL )
Natural Gas ( NYMEX:NG1! )
S&P 500 ( SP:SPX )
Dollar Index ( TVC:DXY )
EURUSD ( FX:EURUSD )
GBPUSD ( FX:GBPUSD )
GBPJPY( FX:GBPJPY )
By providing clear insight into the positions of large speculators, this indicator is a powerful tool for traders looking to align with institutional sentiment and enhance their trading strategy.
Meme Coin Buy Signal Indicator by asharThis custom TradingView indicator is specifically designed for meme coins, using technical analysis indicators to identify optimal buy signals. It combines short-term moving averages, volume spikes, and Bitcoin trend alignment to pinpoint potential entry points during high-momentum periods.
Indicator Components:
Moving Averages (MA): A 5-period fast MA and a 13-period slow MA highlight short-term price momentum. Buy signals are generated when the fast MA crosses above the slow MA, indicating potential upward momentum.
Volume Spike Detection: The indicator detects high-volume periods using a multiplier. If the current volume exceeds the 10-period average volume by the set multiplier (default: 2.0), it indicates increased buying interest, which is crucial for meme coins.
Bitcoin Trend Alignment: The trend of Bitcoin, a market-wide sentiment indicator, is gauged with a 20-day moving average. Buy signals are validated only when Bitcoin is also in an uptrend, providing additional bullish confirmation for meme coins.
Buy Signal Criteria: A buy signal is triggered when:
The fast MA crosses above the slow MA.
Volume is above the average by the set multiplier.
The price is above the slow MA.
Bitcoin is trending up based on the 20-day moving average.
This indicator is ideal for meme coin traders looking to time entries with momentum-driven trends, aligning volume and trend indicators for a more comprehensive approach to high-risk assets.

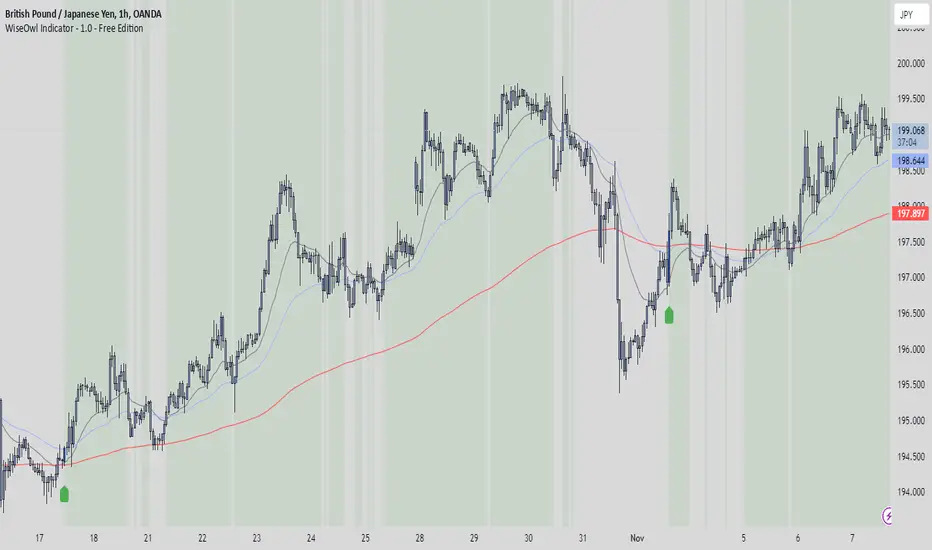
WiseOwl Indicator - 1.0 The WiseOwl Indicator - 1.0 is a technical analysis tool designed to help traders identify potential entry points and market trends based on Exponential Moving Averages (EMAs) across multiple timeframes. It focuses on providing clear visual cues for bullish and bearish market conditions, as well as potential breakout opportunities.
Key Features
Multi-Timeframe EMA Analysis: Calculates EMAs on the current timeframe, Daily timeframe, and 15-minute timeframe to confirm trends.
Bullish and Bearish Market Identification: Determines market conditions based on the 200-period EMA on the Daily timeframe.
Directional Candle Coloring: Highlights candles based on their position relative to EMAs to provide immediate visual feedback.
Entry Signals: Plots buy and sell signals on the chart when specific conditions are met on the 1-hour and 4-hour timeframes.
Breakout Candle Highlighting: Colors candles differently when significant price movements occur, indicating potential breakout opportunities.
How It Works
Market Condition Determination:
Bullish Market: When the close price is above the 200-period EMA on the Daily timeframe.
Bearish Market: When the close price is below the 200-period EMA on the Daily timeframe.
Directional Candle Coloring:
Green Background: Applied when the close is above the 50-period EMA and the market is not bearish.
Red Background: Applied when the close is below the 50-period EMA and the market is not bullish.
Uses the Average True Range (ATR) to define a range threshold.
Suppresses signals when EMAs are within this range, indicating a sideways market.
Plotting Entry Signals:
Plots arrows on the chart for potential long and short entries on the 1-hour and 4-hour timeframes.
Breakout Candle Coloring:
Colors candles blue when a bullish breakout condition is met.
Colors candles orange when a bearish breakout condition is met.
How to Use
Trend Identification: Use the background coloring to quickly identify the overall market trend.
Green Background: Suggests bullish conditions; consider looking for long opportunities.
Red Background: Suggests bearish conditions; consider looking for short opportunities.
Entry Signals: Look for plotted arrows on the chart.
Green Upward Arrow: Indicates a potential long entry signal on the 1-hour or 4-hour timeframe.
Red Downward Arrow: Indicates a potential short entry signal on the 1-hour or 4-hour timeframe.
Breakout Opportunities: Watch for candles colored blue or orange.
Blue Candles: Highlight significant upward price movements.
Orange Candles: Highlight significant downward price movements.
Avoiding Ranging Markets: Be cautious when signals are suppressed due to ranging conditions; the market may not have a clear direction.
Example Usage
Identifying a Bullish Market:
The background turns green.
Price crosses above the 50 EMA.
A green upward arrow appears below a candle on the 1-hour or 4-hour chart.
Identifying a Bearish Market:
The background turns red.
Price crosses below the 50 EMA.
A red downward arrow appears above a candle on the 1-hour or 4-hour chart.
Notes
Open-Source Code: The script is open-source, allowing users to review and understand the logic behind the indicator.
Educational Purpose: This indicator is intended to aid in technical analysis and should not be used as the sole basis for trading decisions.
Disclaimer
This indicator is for educational purposes only and does not constitute financial advice. Trading involves risk, and you should consult with a qualified financial advisor before making any investment decisions.
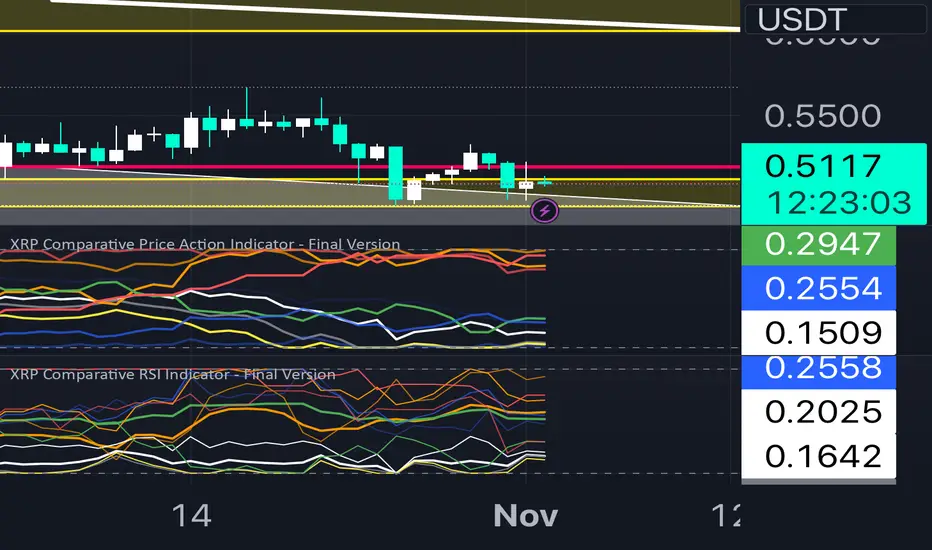
XRP Comparative RSI Indicator - Final VersionXRP Comparative RSI Indicator - Final Version
The XRP Comparative RSI Indicator offers a dynamic analysis of XRP’s market positioning through relative strength index (RSI) comparisons across various cryptocurrencies and major market indicators. This indicator allows traders and analysts to gauge XRP’s momentum and potential turning points within different market conditions.
Key Features:
• Normalized RSIs: Each RSI value is normalized between 0.00 and 1.00, allowing seamless comparison across multiple assets.
• Grouped Analysis: Three RSI groups provide specific insights:
• Group 1 (XRP-Specific): Measures XRPUSD, XRP Dominance (XRP.D), and XRP/BTC, focusing on XRP’s performance across different trading pairs.
• Group 2 (Market Influence - Bitcoin): Measures BTCUSD, BTC Dominance (BTC.D), and XRP/BTC, capturing the influence of Bitcoin on XRP.
• Group 3 (Liquidity Impact): Measures USDT Dominance (USDT.D), BTCUSD, and ETHUSD, evaluating the liquidity impact from key assets and stablecoins.
• Individual Asset RSIs: Track the normalized RSI for each specific pair or asset, including XRPUSD, BTCUSD, ETHUSD, XRP/BTC, BTC Dominance, ETH Dominance, and the S&P 500.
• Clear Color Coding: Each asset’s RSI is plotted with a unique color scheme, consistent with the first indicator, for easy recognition.
This indicator is ideal for identifying relative strengths, potential entry and exit signals, and understanding how XRP’s momentum aligns or diverges from broader market trends.
Ultimate Multi-Physics Financial IndicatorThe Ultimate Multi-Physics Financial Indicator is an advanced Pine Script designed to combine various complex theories from physics, mathematics, and statistical mechanics to create a holistic, multi-dimensional approach to market analysis. Let’s break down the core concepts and how they’re applied in this script:
1. Fractal Geometry: Recursive Pattern Recognition
Purpose: This part of the script uses fractal geometry to recursively analyze price pivots (highs and lows) for detecting patterns.
Fractals: The fractalHigh and fractalLow signals represent key turning points in the market. The script goes deeper by recursively analyzing layers of pivot sequences, adding "depth" to the recognition of patterns.
Recursive Depth: It breaks down each detected pivot into smaller components, giving more nuance to market pattern recognition. This provides a broader context for how prices have behaved historically at various levels of recursion.
2. Quantum Mechanics: Adaptive Probabilistic Monte Carlo with Correlation
Purpose: This component integrates randomness (from Monte Carlo simulations) with current market behavior using correlation.
Randomness Weighted by Correlation: By generating random probabilities and weighting them based on how well the market aligns with recent trends, it creates a probabilistic signal. The random values are scaled by a correlation factor (close prices and their moving average), adding adaptive elements where randomness is adjusted by current market conditions.
3. Thermodynamics: Adaptive Efficiency Ratio (Entropy-Like Decay)
Purpose: This section uses principles from thermodynamics, where efficiency in price movement is dynamically adjusted by recent volatility and changes.
Efficiency Ratio: It calculates how efficiently the market is moving over a certain period. The "entropy decay factor" reflects how stable the market is. Higher entropy (chaos) results in lower efficiency, while stable periods maintain higher efficiency.
4. Chaos Theory: Lorenz-Driven Market Oscillation
Purpose: Instead of using a basic Average True Range (ATR) indicator, this section applies chaos theory (using a Lorenz attractor analogy) to describe complex market oscillations.
Lorenz Attractor: This models market behavior with a chaotic system that depends on the historical price changes at different time intervals. The attractor value quantifies the level of "chaos" or unpredictability in the market.
5. String Theory: Multi-Layered Dimensional Analysis of RSI and MACD
Purpose: Combines traditional indicators like the RSI (Relative Strength Index) and MACD (Moving Average Convergence Divergence) with momentum for multi-dimensional analysis.
Interaction of Layers: Each layer (RSI, MACD, and momentum) is treated as part of a multi-dimensional structure, where they influence one another. The final signal is a blended outcome of these key metrics, weighted and averaged for complexity.
6. Fluid Dynamics: Adaptive OBV (Pressure-Based)
Purpose: This section uses fluid dynamics to understand how price movement and volume create pressure over time, similar to how fluids behave under different forces.
Adaptive OBV: Traditional OBV (On-Balance Volume) is adapted by using statistical smoothing to measure the "pressure" exerted by volume over time. The result is a signal that shows where there might be building momentum or pressure in the market based on volume dynamics.
7. Recursive Synthesis of Signals
Purpose: After calculating all the individual signals (fractal, quantum, thermodynamic, chaos, string, and fluid), the script synthesizes them into one cohesive signal.
Recursive Feedback Loop: Each signal is recursively influenced by others, forming a feedback loop that allows the indicator to continuously learn from new data and self-adjust.
8. Signal Smoothing and Final Output
Purpose: To avoid noise in the output, the final combined signal is smoothed using an Exponential Moving Average (EMA), which helps stabilize the output for easier interpretation.
9. Dynamic Color Coding Based on Signal Extremes
Purpose: Visual clarity is enhanced by using color to highlight different levels of signal strength.
Color Coding: The script dynamically adjusts colors (green, orange, red) based on the strength of the final signal relative to its percentile ranking in historical data, making it easier to spot bullish, neutral, or bearish signals.
The "Ultimate Multi-Physics Financial Indicator" integrates a diverse array of scientific principles — fractal geometry, quantum mechanics, thermodynamics, chaos theory, string theory, and fluid dynamics — to provide a comprehensive market analysis tool. By combining probabilistic simulations, multi-dimensional technical indicators, and recursive feedback loops, this indicator adapts dynamically to evolving market conditions, giving traders a holistic view of market behavior across various dimensions. The result is an adaptive and flexible tool that responds to both short-term and long-term market changes

Multi-Average Trend Indicator (MATI)[FibonacciFlux]Multi-Average Trend Indicator (MATI)
Overview
The Multi-Average Trend Indicator (MATI) is a versatile technical analysis tool designed for traders who aim to enhance their market insights and streamline their decision-making processes across various timeframes. By integrating multiple advanced moving averages, this indicator serves as a robust framework for identifying market trends, making it suitable for different trading styles—from scalping to swing trading.
MATI 4-hourly support/resistance
MATI 1-hourly support/resistance
MATI 15 minutes support/resistance
MATI 1 minutes support/resistance
Key Features
1. Diverse Moving Averages
- COVWMA (Coefficient of Variation Weighted Moving Average) :
- Provides insights into price volatility, helping traders identify the strength of trends in fast-moving markets, particularly useful for 1-minute scalping .
- DEMA (Double Exponential Moving Average) :
- Minimizes lag and quickly responds to price changes, making it ideal for capturing short-term price movements during volatile trading sessions .
- EMA (Exponential Moving Average) :
- Focuses on recent price action to indicate the prevailing trend, vital for day traders looking to enter positions based on current momentum.
- KAMA (Kaufman's Adaptive Moving Average) :
- Adapts to market volatility, smoothing out price action and reducing false signals, which is crucial for 4-hour day trading strategies.
- SMA (Simple Moving Average) :
- Provides a foundational view of the market trend, useful for swing traders looking at overall price direction over longer periods.
- VIDYA (Variable Index Dynamic Average) :
- Adjusts based on market conditions, offering a dynamic perspective that can help traders capture emerging trends.
2. Combined Moving Average
- The MATI's combined moving average synthesizes all individual moving averages into a single line, providing a clear and concise summary of market direction. This feature is especially useful for identifying trend continuations or reversals across various timeframes .
3. Dynamic Color Coding
- Each moving average is visually represented with color coding:
- Green indicates bullish conditions, while Red suggests bearish trends.
- This visual feedback allows traders to quickly assess market sentiment, facilitating faster decision-making.
4. Signal Generation and Alerts
- The indicator generates buy signals when the combined moving average crosses above its previous value, indicating a potential upward trend—ideal for quick entries in scalping.
- Conversely, sell signals are triggered when the combined moving average crosses below its previous value, useful for exiting positions or entering short trades.
Insights and Applications
1. Scalping on 1-Minute Charts
- The MATI excels in fast-paced environments, allowing scalpers to identify quick entry and exit points based on short-term trends. With dynamic signals and alerts, traders can react swiftly to price movements, maximizing profit potential in brief price fluctuations.
2. Day Trading on 4-Hour Charts
- For day traders, the MATI provides essential insights into intraday trends. By analyzing the combined moving average and its relation to individual moving averages, traders can make informed decisions on when to enter or exit positions, capitalizing on daily price swings.
3. Swing Trading on Daily Charts
- The MATI also serves as a valuable tool for swing traders. By evaluating longer-term trends through the combined moving average, traders can identify potential swing points and adjust their strategies accordingly. The flexibility of adjusting the lengths of the moving averages allows for tailored approaches based on market volatility.
Benefits
1. Clarity and Insight
- The combination of diverse moving averages offers a clear visual representation of market trends, aiding traders in making informed decisions across multiple timeframes.
2. Flexibility and Customization
- With adjustable parameters, traders can adapt the MATI to their specific strategies, making it suitable for various market conditions and trading styles.
3. Real-Time Alerts and Efficiency
- Built-in alerts minimize response times, allowing traders to capitalize on opportunities as they arise, regardless of their trading style.
Conclusion
The Multi-Average Trend Indicator (MATI) is an essential tool for traders seeking to enhance their technical analysis capabilities. By seamlessly integrating multiple moving averages with dynamic color coding and real-time alerts, this indicator provides a comprehensive approach to understanding market trends. Its versatility makes it an invaluable asset for scalpers, day traders, and swing traders alike.
Important Note
As with any trading tool, thorough analysis and risk management are crucial when using this indicator. Past performance does not guarantee future results, and traders should always be prepared for market fluctuations.
